
Abstract
[11C]physostigmine, an acetylcholinesterase inhibitor, has been shown to be a promising positron emission tomography ligand to quantify the cerebral concentration of the enzyme in animals and humans in vivo. Here, a quantitative and noninvasive method to measure the regional acetylcholinesterase concentration in the brain is presented. The method is based on the observation that the ratio between regions rich in acetylcholinesterase and white matter, a region almost entirely deprived of this enzyme, was found to become approximately constant after 20 to 30 minutes, suggesting that at late time points the uptake mainly contains information about the distribution volume. Taking the white matter as the reference region, a simplified reference tissue model, with effectively one reversible tissue compartment and three parameters, was found to give a good description of the data in baboons. One of these parameters, the ratio between the total distribution volumes in the target and reference regions, showed a satisfactory correlation with the acetylcholinesterase concentration measured postmortem in two baboon brains. Eight healthy male subjects were also analyzed and the regional enzyme concentrations obtained again showed a good correlation with the known acetylcholinesterase concentrations measured in postmortem studies of human brain.
Quantitative positron emission tomography (PET) imaging of the enzyme acetylcholinesterase (E.C. 3.1.1.7, AChE) is postulated to be relevant for those neurodegenerative disorders in which a reduction of AChE activity has been reported, such as Alzheimer's disease (Davies, 1979; Geula and Mesulam, 1994) and Parkinson's disease (Ruberg et al., 1986). Several tracers have been proposed to map AChE: [11C]physostigmine (Tavitian et al., 1993a); [11C]methyl-tetrahydroaminoacridine (methyl-tacrine) (Tavitian et al., 1993b); 14C- and 11C-labeled N-methylpiperidin-4-yl acetate or AMP (Iyo et al., 1997; Namba et al., 1998); and N-[11C]methylpiperidinyl proprionate or [11C]PMP (Koeppe et al., 1999; Kuhl et al., 1999). AMP and PMP gave reliable measures of AChE in regions with low enzyme density (ρ(AChE)), such as the cortex, but were unsuitable in high-density regions, such as the striata, where cerebral blood flow (CBF) becomes the rate limiting factor.
Physostigmine (PHY), an AChE inhibitor, has lower affinity for AChE than AMP or PMP, which means that [11C]PHY should be a better estimator of ρ(AChE) in regions rich in AChE, such as the putamen and the cerebellum. Physostigmine labeled in the carboxylic carbon has been used for imaging of AChE density by autoradiography in rats (Planas et al., 1994), by PET in baboons (Tavitian et al., 1993a, 1995), and in humans (Pappata et al., 1996). In the rat brain, the [11C]PHY radioactivity was found to be essentially superimposable to AChE activity. In the primate brain, it was observed that the early, blood flow-dependent distribution of [11C]PHY was followed by redistribution to AChE-rich regions. The same pattern was observed in the human studies. In the monkey studies, it was further observed that the uptake of [11C]PHY was significantly reduced by competition with an excess of unlabeled PHY.
Here, the authors present analysis aimed at establishing a method allowing the quantitative measure of ρ(AChE) in baboons and humans with [11C]PHY. Arterial blood samples were not taken from humans, and those taken from baboons revealed to be unsuitable to deduce the input function with sufficient accuracy and precision. These difficulties were avoided by applying “reference tissue methods,” which do not make use of the input function (Hume et al., 1992; Lammertsma et al., 1996; Lammertsma and Hume, 1996).
To validate the method, regional concentrations of AChE were biochemically measured in postmortem baboon brain slices. Published postmortem data were used to validate the method for the human brain. The results of this study have been partially presented (Blomqvist et al., 2000).
Theory
Physostigmine crosses the blood-brain barrier (BBB) by passive diffusion with high extraction rate (the early images after a bolus injection essentially show a blood flow distribution). In the brain tissue, PHY can bind reversibly to the active site of AChE to form a PHY-AChE transition complex. The complex is rapidly carbamylated, inactivating the enzyme. The importance of the carbamylation process has been demonstrated in animal studies. For example, it was found that labeled metabolites contributed by 50% to the total radioactivity in the rat brain 40 minutes after injection of [3H]PHY (Somani and Khalique, 1987). Furthermore, in vitro measurements on bovine erythrocytes AChE have shown that rate constant for carbamylation is very high, 10.8 ± 0.34 min−1 (Main and Hastings, 1966). Carbamylation is an irreversible process for PHY, but AChE is slowly reactivated by decarbamylation. For this process, Dawson (1994) obtained the rate constant 0.032 ± 0.002 min−1 for bovine erythrocyte AChE. In the rat brain, Somani and Khalique (1987) found the value 0.027 min−1 for the same parameter. By decarbamylation of [11C]PHY the label is transferred to methylcarbamic acid, which is unstable and rapidly cleaved into methylamine and [11C]CO2. The latter compound leaves the brain by diffusion into the blood stream. This process is bidirectional and therefore the transfer should be interpreted as a net outflux, upheld by the concentration gradient of CO2 between brain tissue and blood.
Thus, to describe the main features of the PHY kinetics, a compartmental model containing four tissue compartments and seven rate constants (Fig. 1A) is required. Because of the instability of the methylcarbamic acid, the concentration of this compound can be considered to be very small and, therefore, no separate compartment for this compound is needed. It should be stressed that although the carbamylation and decarbamylation processes are unidirectional, the overall kinetics of the label, as described by the model of Fig. 1A, is reversible, and with time the radioactivity concentration in a region is predicted to reach equilibrium with the input function and with the radioactivity concentrations in other regions. Because of its complexity, the model in Fig. 1A cannot be applied to the PET data but is used here only as a basis for discussion.
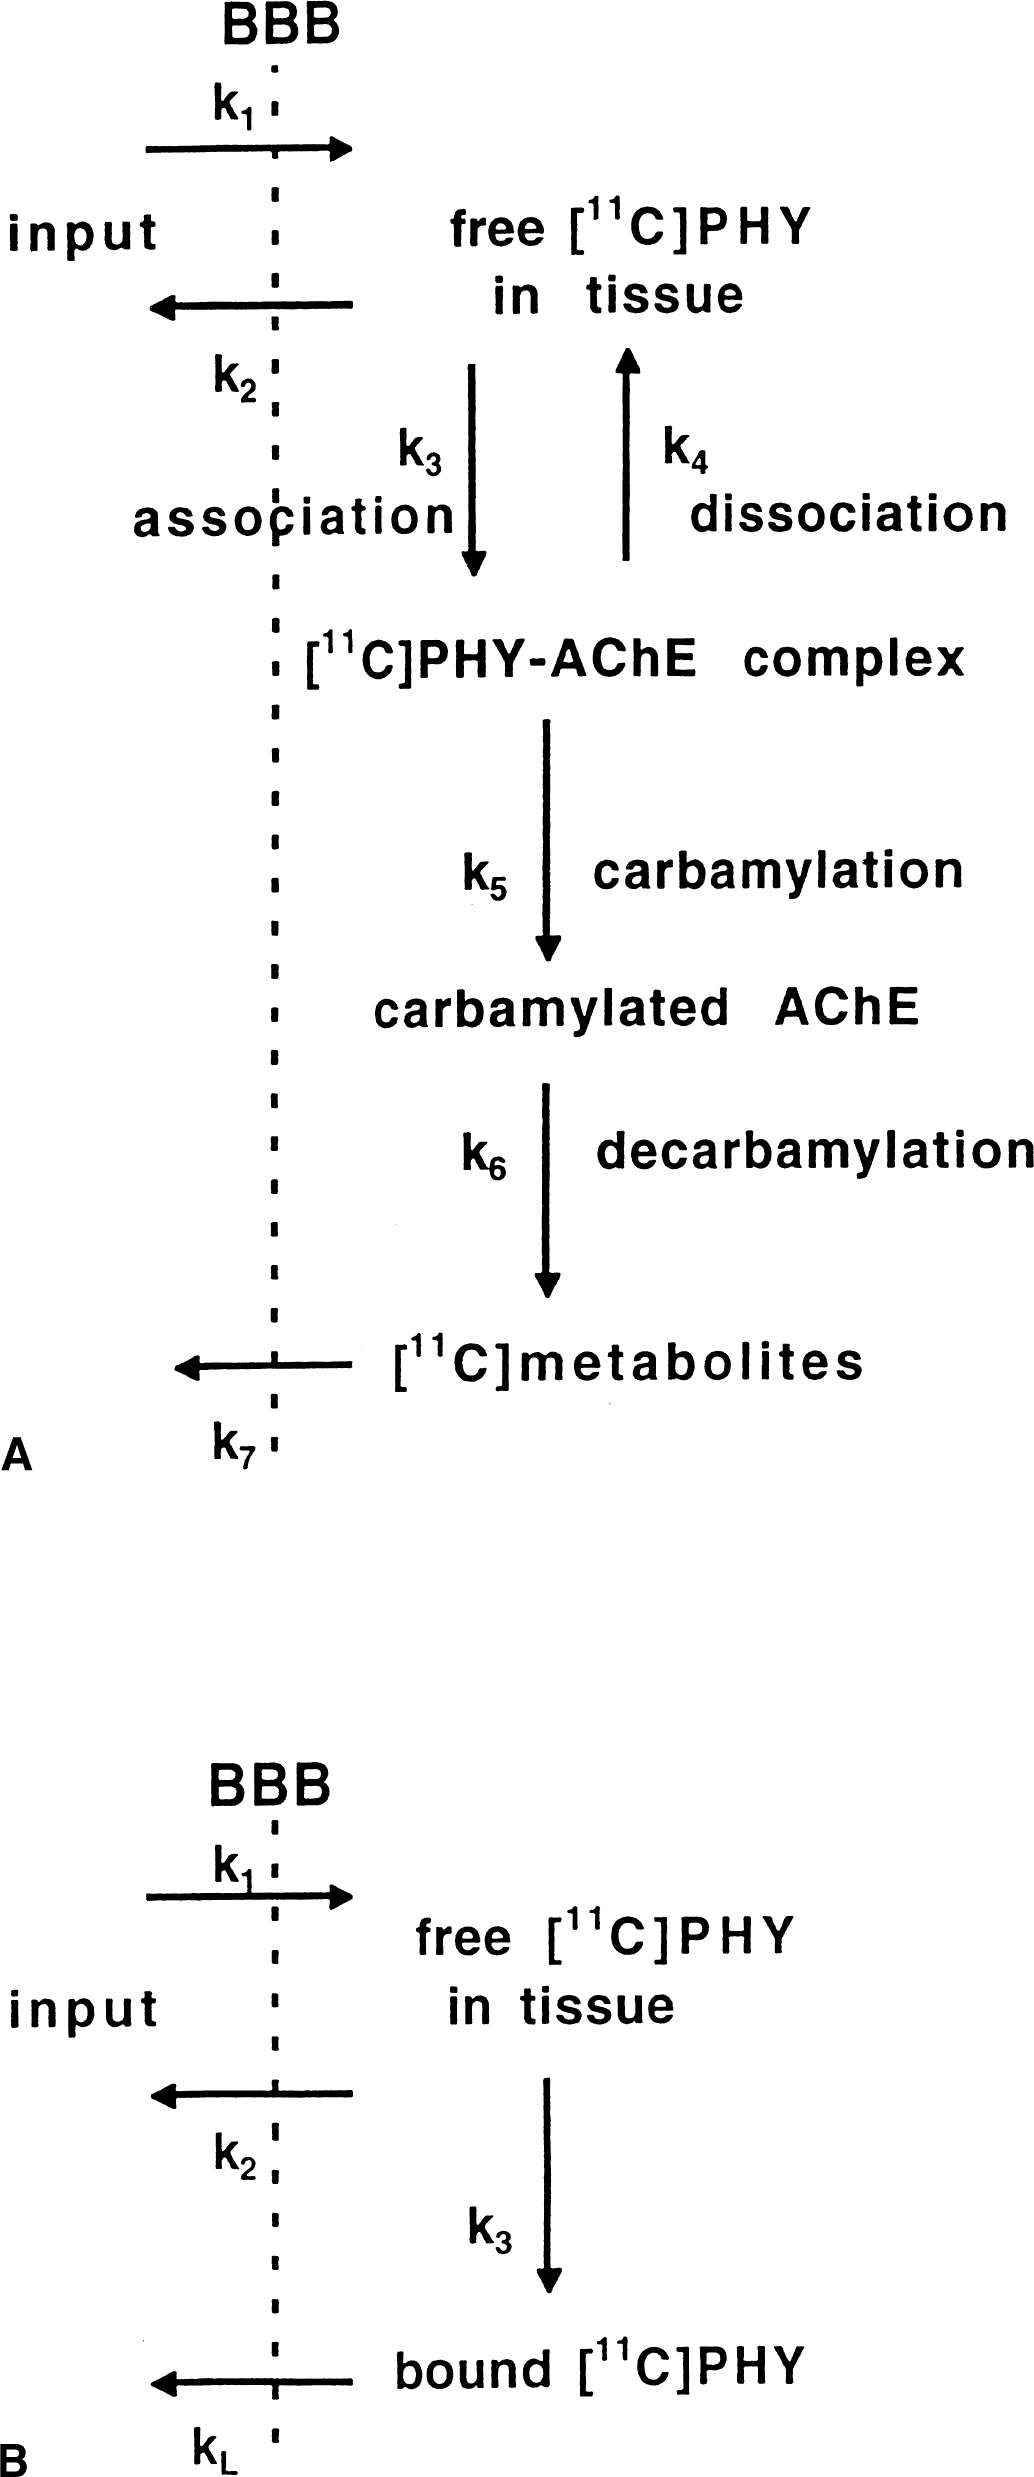
The different compartmental models for [11C]PHY.
The formation rate of the PHY-AChE transition complex is proportional to both the concentration of free PHY in the tissue and the local AChE concentration. In the model, this rate of formation is expressed as k3 · [free PHY] ([ ] denotes concentration) for unlabeled PHY (k3 · C
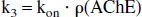
The factor of proportionality, kon, is specific for the PHY-AChE complex. In contrast to k3, the rate constant for dissociation of the PHY-AChE complex, k4, and the rate constants, k5 and k6, for the carbamylation and decarbamylation processes, respectively, are not considered to depend on ρ(AChE) but only on the chemical properties of PHY and AChE. Consequently, k3 is the parameter of primary interest in this model.
The rate of the covalent binding of PHY to AChE by carbamylation (from free PHY and active AChE) is the effective rate of the combination of two serial processes: first, the formation of the PHY-AChE transition complex with the reversible binding of PHY to the active site of the enzyme, and thereafter the irreversible carbamylation. According to the model shown in Fig. 1A and by standard tracer kinetic arguments, the net flux for this combined process is equal to [freePHY] · k3 · k5/(k4 + k5). If the carbamylation process is much more probable than the dissociation process (probabilities k5/(k4 + k5) and k4/(k4 + k5), respectively)—that is, if k5 >> k4—the above rate becomes approximately k3 · [freePHY] and the formation of the PHY-AChE complex is predicted to be the rate limiting step for the covalent binding of PHY to AChE.
If all tissue compartments besides the one for free PHY are merged into one compartment, and if the dissociation of the PHY-AChE complex is neglected (k5 >> k4), the compartmental configuration in Fig. 1B is obtained. The corresponding operational equation, using the time activity in a reference region, is given in the Appendix (Eq. A6). Although the binding of PHY to AChE is irreversible in this model, again the loss of label makes the overall kinetics of the tracer reversible, which means that with time the tracer concentrations in the blood and tissue will equilibrate.
The kinetics can be even more simplified if the exchanges between the pools are so fast that the concentrations rapidly become proportional to each other and the time courses in the different compartments become difficult to resolve. In the “simplified reference tissue model” introduced by Lammertsma and Hume (1996), the kinetics of the tracer in the tissue is described by a single compartment and three parameters, one of which is the «distribution volume ratio» (DVR)—that is, the ratio between the distribution volumes in the target and the reference regions (see Appendix). This simple model approximates more complex reversible models like the models illustrated by Fig. 1A and 1B, and also the common model with reversible transfer between two tissue compartments and four rate constants, which was the starting point for the simplification by Lammertsma and Hume (1996).
Provided the time variation of the uptake in the reference tissue becomes small at late times, the models in Fig. 1A and 1B predict that the ratio between the concentrations in a target and a reference region, Ctarg and Cref, respectively, approaches a level close to the DVR (see Appendix). For the model described in Fig. 1B, DVR is given by Eq. A3. It should be stressed that with the simplified reference tissue model the rate constants, k3 and k

The reference tissue models also predict that immediately after the bolus injection the ratio between Ctarg and Cref is close to the R-factor (see Appendix), which, in turn, is approximately the ratio between the CBF values in the target and reference regions.
MATERIALS AND METHODS
Chemistry
[11C]PHY was synthesized as previously described (Bonnot Lours et al., 1993).
Animal studies
Five adult male baboons (Papio papio, body weight 15 to 20 kg) were available for this study, each of which was repeatedly used in the different experimental protocols (see below). For PET study, the animals were presedated and anesthetized-ventilated with 1% isoflurane, 67% N2O, and 33% O2. The dose range for the bolus injection of [11C]PHY was 3 to 22 mCi (average ± SD, 11.4 ± 6.0), and specific radioactivity ranged between 53 and 1112 (average ± SD, 249 ± 246) mCi/μmol.
Positron emission tomography studies were acquired using ECAT953B/31 camera (31 slices; spatial resolution with Hanning 0.5 reconstruction filter 8.4 × 8.4 × 4.8 mm full width at half maximum). The heads of the animals were placed in a solid stereotaxic head holder fixed to the examination bed so as to align their orbito-meatal line with the scanning plane. Correction for attenuation by tissue was performed using 68Ge-68Ga transmission scans. Seventeen to 19 sequential PET scans were acquired for 80 to 120 minutes.
T1-weighted magnetic resonance imaging (MRI) images were obtained in ketamine-xylazine anesthetized animals using an MRMAX 0.5-T device (General Electric Medical Systems, Milwaukee, WI, U.S.A.). To insure similar head positioning, the animal's heads were placed in the same stereotaxic head holder as that used in the PET studies.
Experimental protocols.
Eight baseline studies were performed. In these studies, [11C]PHY was injected at trace doses.
Eight presaturation experiments were performed (Tavitian et al., 1995). In these studies, unlabeled PHY (10 to 1070 μg kg−1) was perfused at a constant rate for 150 minutes starting 60 minutes before the bolus injection of the tracer and ending 90 minutes after the injection. By the long infusion rate, near steady-state conditions were achieved and hemodynamic effects of acute PHY injections were avoided.
Two displacement studies were also performed in which the infusion of unlabeled PHY started 12 minutes after the bolus injection of the tracer. During the first and second minutes, loading doses of 0.33 and 0.22 mg, respectively, were administered, and during the remaining time (104 minutes) 0.11 mg min−1 was administered. A total of 12.1 mg of unlabeled PHY was infused.
In vitro measurement of AChE.
The regional AChE activity was directly measured in two normal baboons after the PET examination. Brain regions were sampled immediately after death, homogenized in extraction buffer as previously described (Couraud and Di Giamberardino, 1980), and processed for the measurement of AChE activity by the standard procedure of Ellman et al. (1961). The enzyme activity in absorbance units was converted to enzyme concentration (nmol/L) using the enzyme turnover values reported by Vigny et al. (1978).
Human studies
The method of quantification of regional AChE developed using the animal studies was then applied to 8 healthy male subjects (24 to 76 years in age). In these experiments, data were acquired during 60 minutes after a bolus injection of [11C]PHY (dose range 3 to 20 mCi, specific activity 200 ± 150 mCi/μmol). A complete description of the PET and MRI methodology used for the acquisition of these studies is given by Pappata et al. (1996).
Data processing
Images of radioactivity concentrations, expressed as a percentage of the injected dose per liter (% IDPL) of the tissue in question, were reconstructed by standard software. Based on the reconstructed images, the time course of the radioactivity concentrations was obtained in a number of regions in the monkey brains. The definition of these regions of interest was based on magnetic resonance images of the animals' heads placed in the same head holder as used in the PET studies and on the anatomic atlas in the orbito-meatal plane of Riche et al. (1988). In the human studies, the PET and MRI images were adjusted using an automatic three-dimensional coregistration method (Mangin et al., 1994). Irregular regions of interest were delineated in the MR images on the basis of sulcal anatomy and the Talairach atlas (Talairach and Tournaux, 1988) and grouped to form anatomic functional regions.
Kinetic analysis
“Reference tissue models” (Hume et al., 1992; Lammertsma et al., 1996; Lammertsma and Hume, 1996) were applied to the data. In such models, the kinetics in a reference tissue region is used in place of the input function and the transfer constant K1 for influx across the BBB. It is also required that the kinetics in such a region should be well described by a single tissue compartment with only two rate constants (the transport in and out across the BBB) and further that the ratio between these rate constants is the same in all brain regions, including the reference region. In this study, white matter (central semiovale) was chosen as reference tissue because this tissue is known to be almost devoid of AChE activity (Finkelstein et al., 1988).
The authors applied three reference tissue models. One is the “simplified reference tissue model” (see Theory and Appendix) with three parameters. The parameter of interest is the distribution volume ratio (DVR), the ratio between the distribution volumes in a target region and the reference region. With this model, the parameter k3 cannot be obtained directly but is estimated with the aid of Eq. A4 using DVR obtained from the model fit and average values for k2 and k
The other model applied is the more complex reference tissue model illustrated in Fig. 1B “reference tissue model with loss,” containing four parameters. In this model, the loss of [11C]CO2, known to occur from the tissue after injection of [11C]PHY, is explicitly taken into account. Fitting a loss rate constant like k
The ex vivo measurements of ρ(AChE) allow direct comparison of the measured ρ(AChE) with the estimated DVR in certain regions of the monkey brain. Fitting these data with Eq. 2 (corresponding to the compartmental configuration of Fig. 1B), average values of kon, k2, and k
Parameters estimate were obtained by minimization of a least squares cost function using Marquardt's algorithm (Marquardt, 1963). To investigate if any model is preferred from a statistical point of view, the Akaike information criterion, AIC, (Akaike, 1974) and the F-test (Beck and Arnold, 1977) were applied. The latter test was used for discrimination between the reference models with loss. The null hypothesis is that the loss rate constant has a fixed value (0.05 min−1) and the test should indicate if a significantly improved fit was obtained when k
RESULTS
Experiments on monkeys
Figure 2 shows the ratios between the uptakes in two regions (putamen and thalamus) and the reference region (a white matter area) as a function of time, obtained in the baseline monkey experiments. Averages and standard deviations over this sample (n = 8) have been calculated in each time frame. One observes that, after the initial flow-dependent phase, the ratio becomes constant within errors. Thus, under the late time period (after 20 minutes), when the regional net accumulation of tracer is observed to closely follow the known regional cerebral AChE activity (Tavitian et al., 1993a), near equilibrium conditions between the tracer in different regions and in white matter (the reference tissue) are reached.
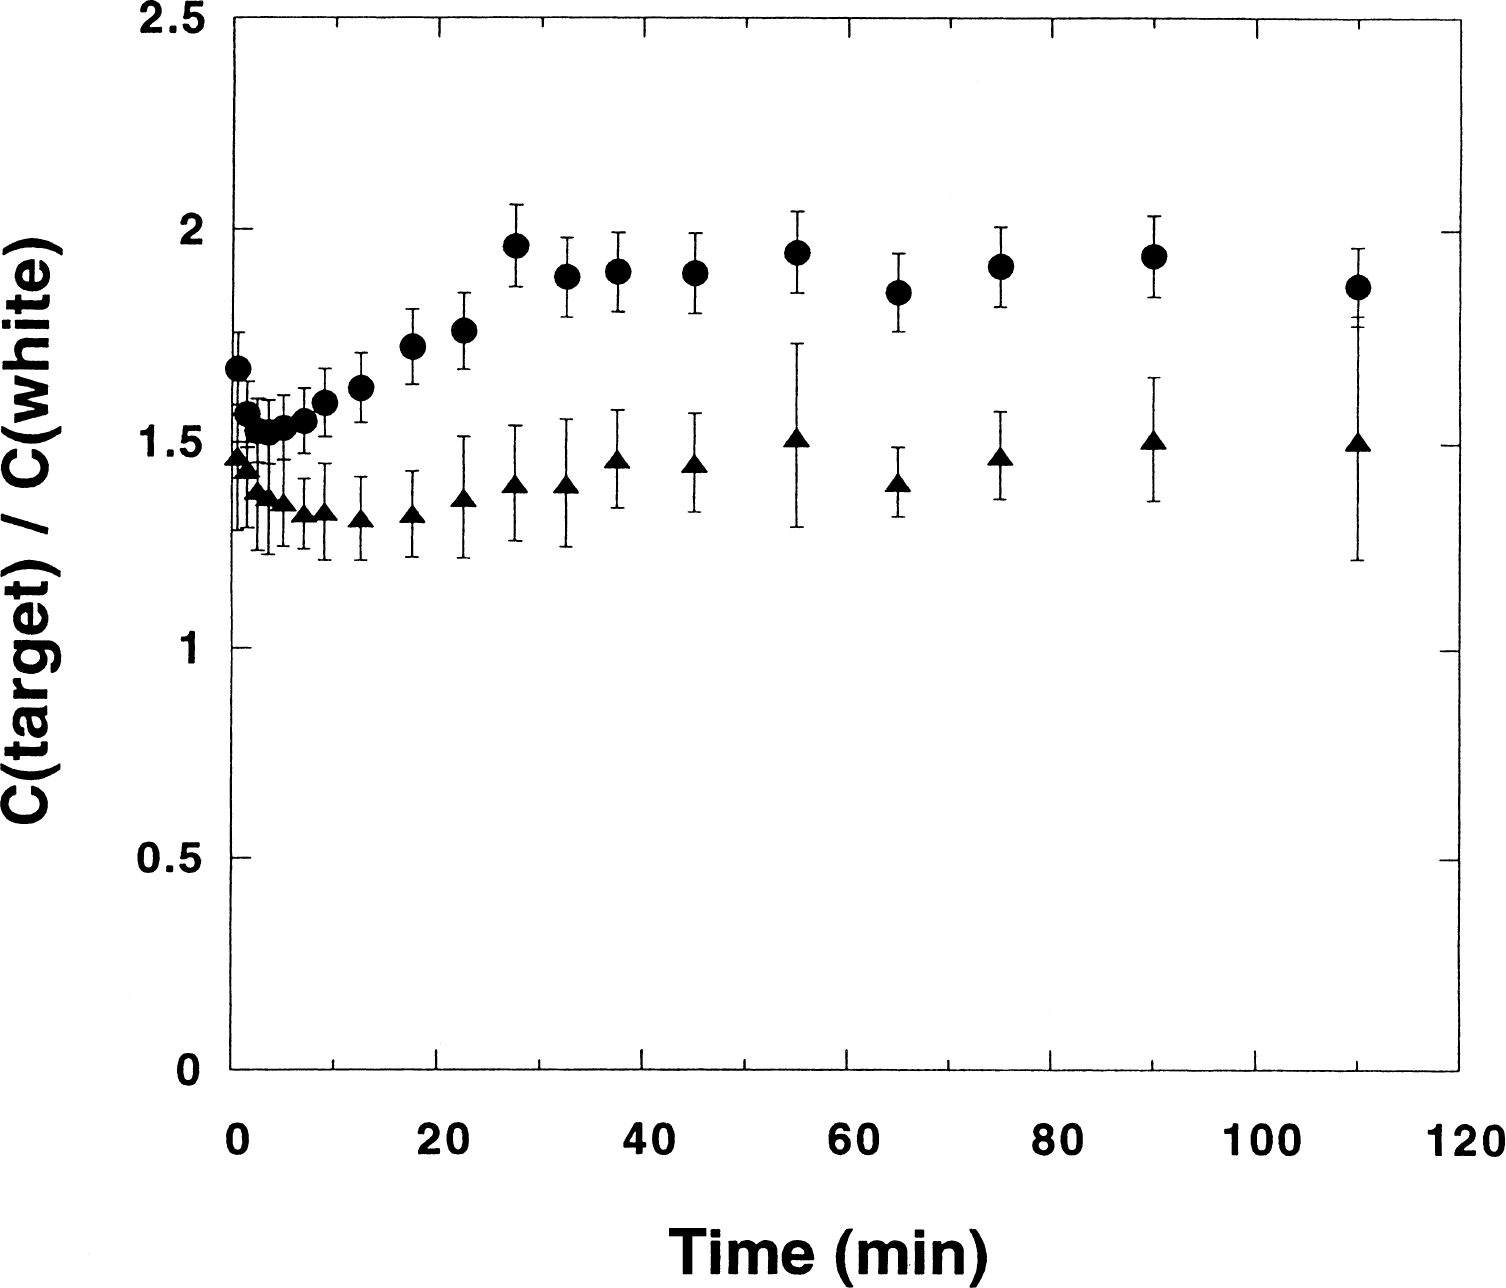
Ratio between the uptakes in two regions (putamen (•) and thalamus (▵)) and a white matter area (the reference tissue region) as a function of time for monkeys. Averages of the control experiments (n = 8) are displayed. Bars indicate standard deviations. Time values are the midpoints of the frames chosen for the data acquisition.
Regional parameters values, obtained by applying the three reference tissue models on the data from the monkey baseline experiments, are presented in Table 1. For the two models with loss, DVR was calculated with the aid of Eq. A3, using the fitted values of k2, k3, and k
Results obtained by applying three different reference tissue models on the baboon experiments (n = 8)
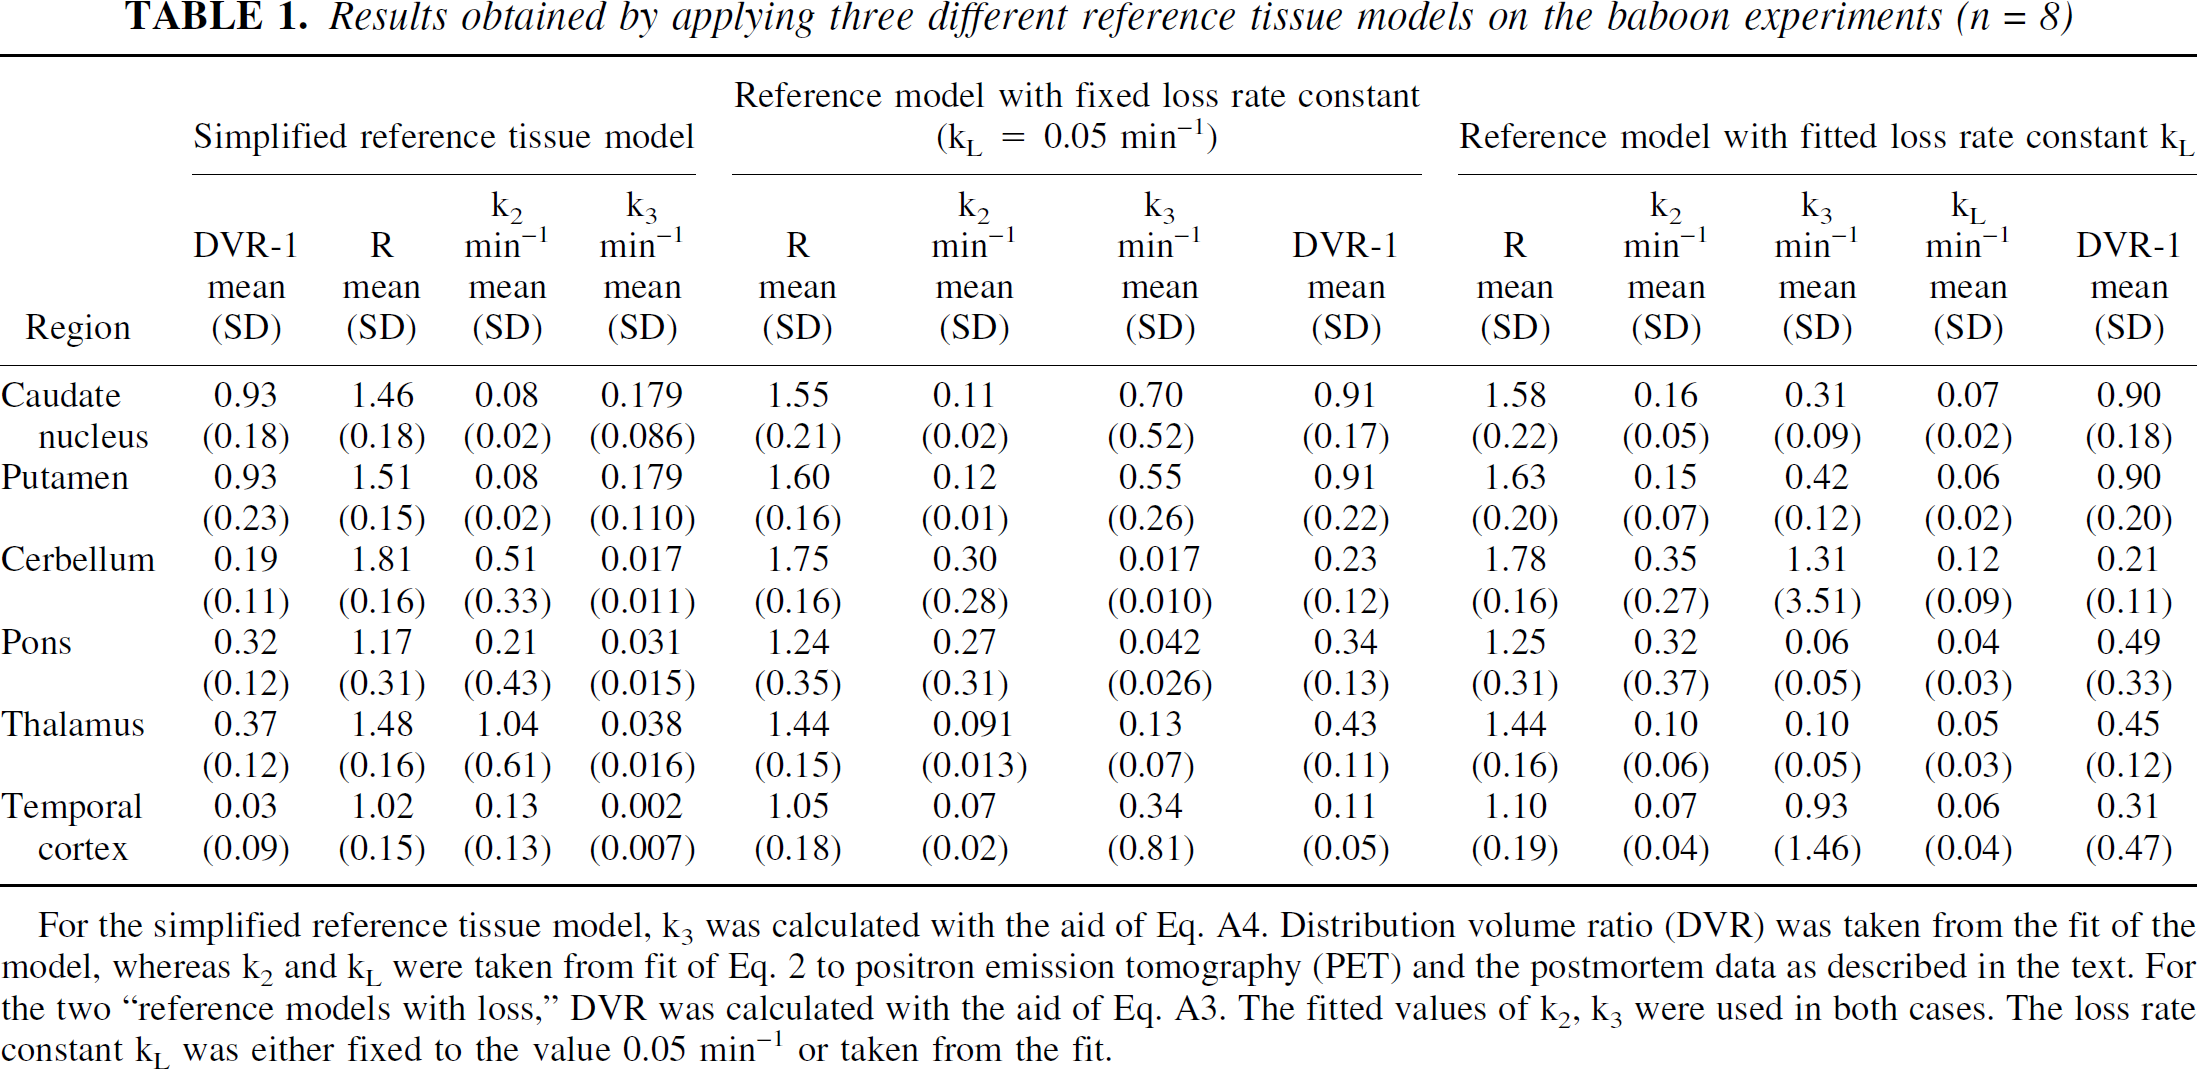
For the simplified reference tissue model, k3 was calculated with the aid of Eq. A4. Distribution volume ratio (DVR) was taken from the fit of the model, whereas k2 and k
The three models give very similar estimates of R, the ratio between the k1 values in the target and reference regions. This feature is expected because for all three models the dominant source of the R-dependence in the operational equations is a term R · Cref(t) (a scaling of the tracer concentration in the reference region with the factor R). Compared with the regional variation in the DVR values, the regional variation of the R parameter is much smaller. This feature is also expected because the CBF values in the selected regions are known to be close to each other.
The parameter k3, which should reflect the AChE activity more directly than DVR, cannot be fitted with the simplified reference tissue model but was calculated with the aid of Eq. A4. The DVR values were taken from the model fit, but the values for k2 and k
Figure 3 shows examples of model fits of the regional uptake in a baseline experiment in a monkey. The reference tissue model (Eq. A6) with fixed k
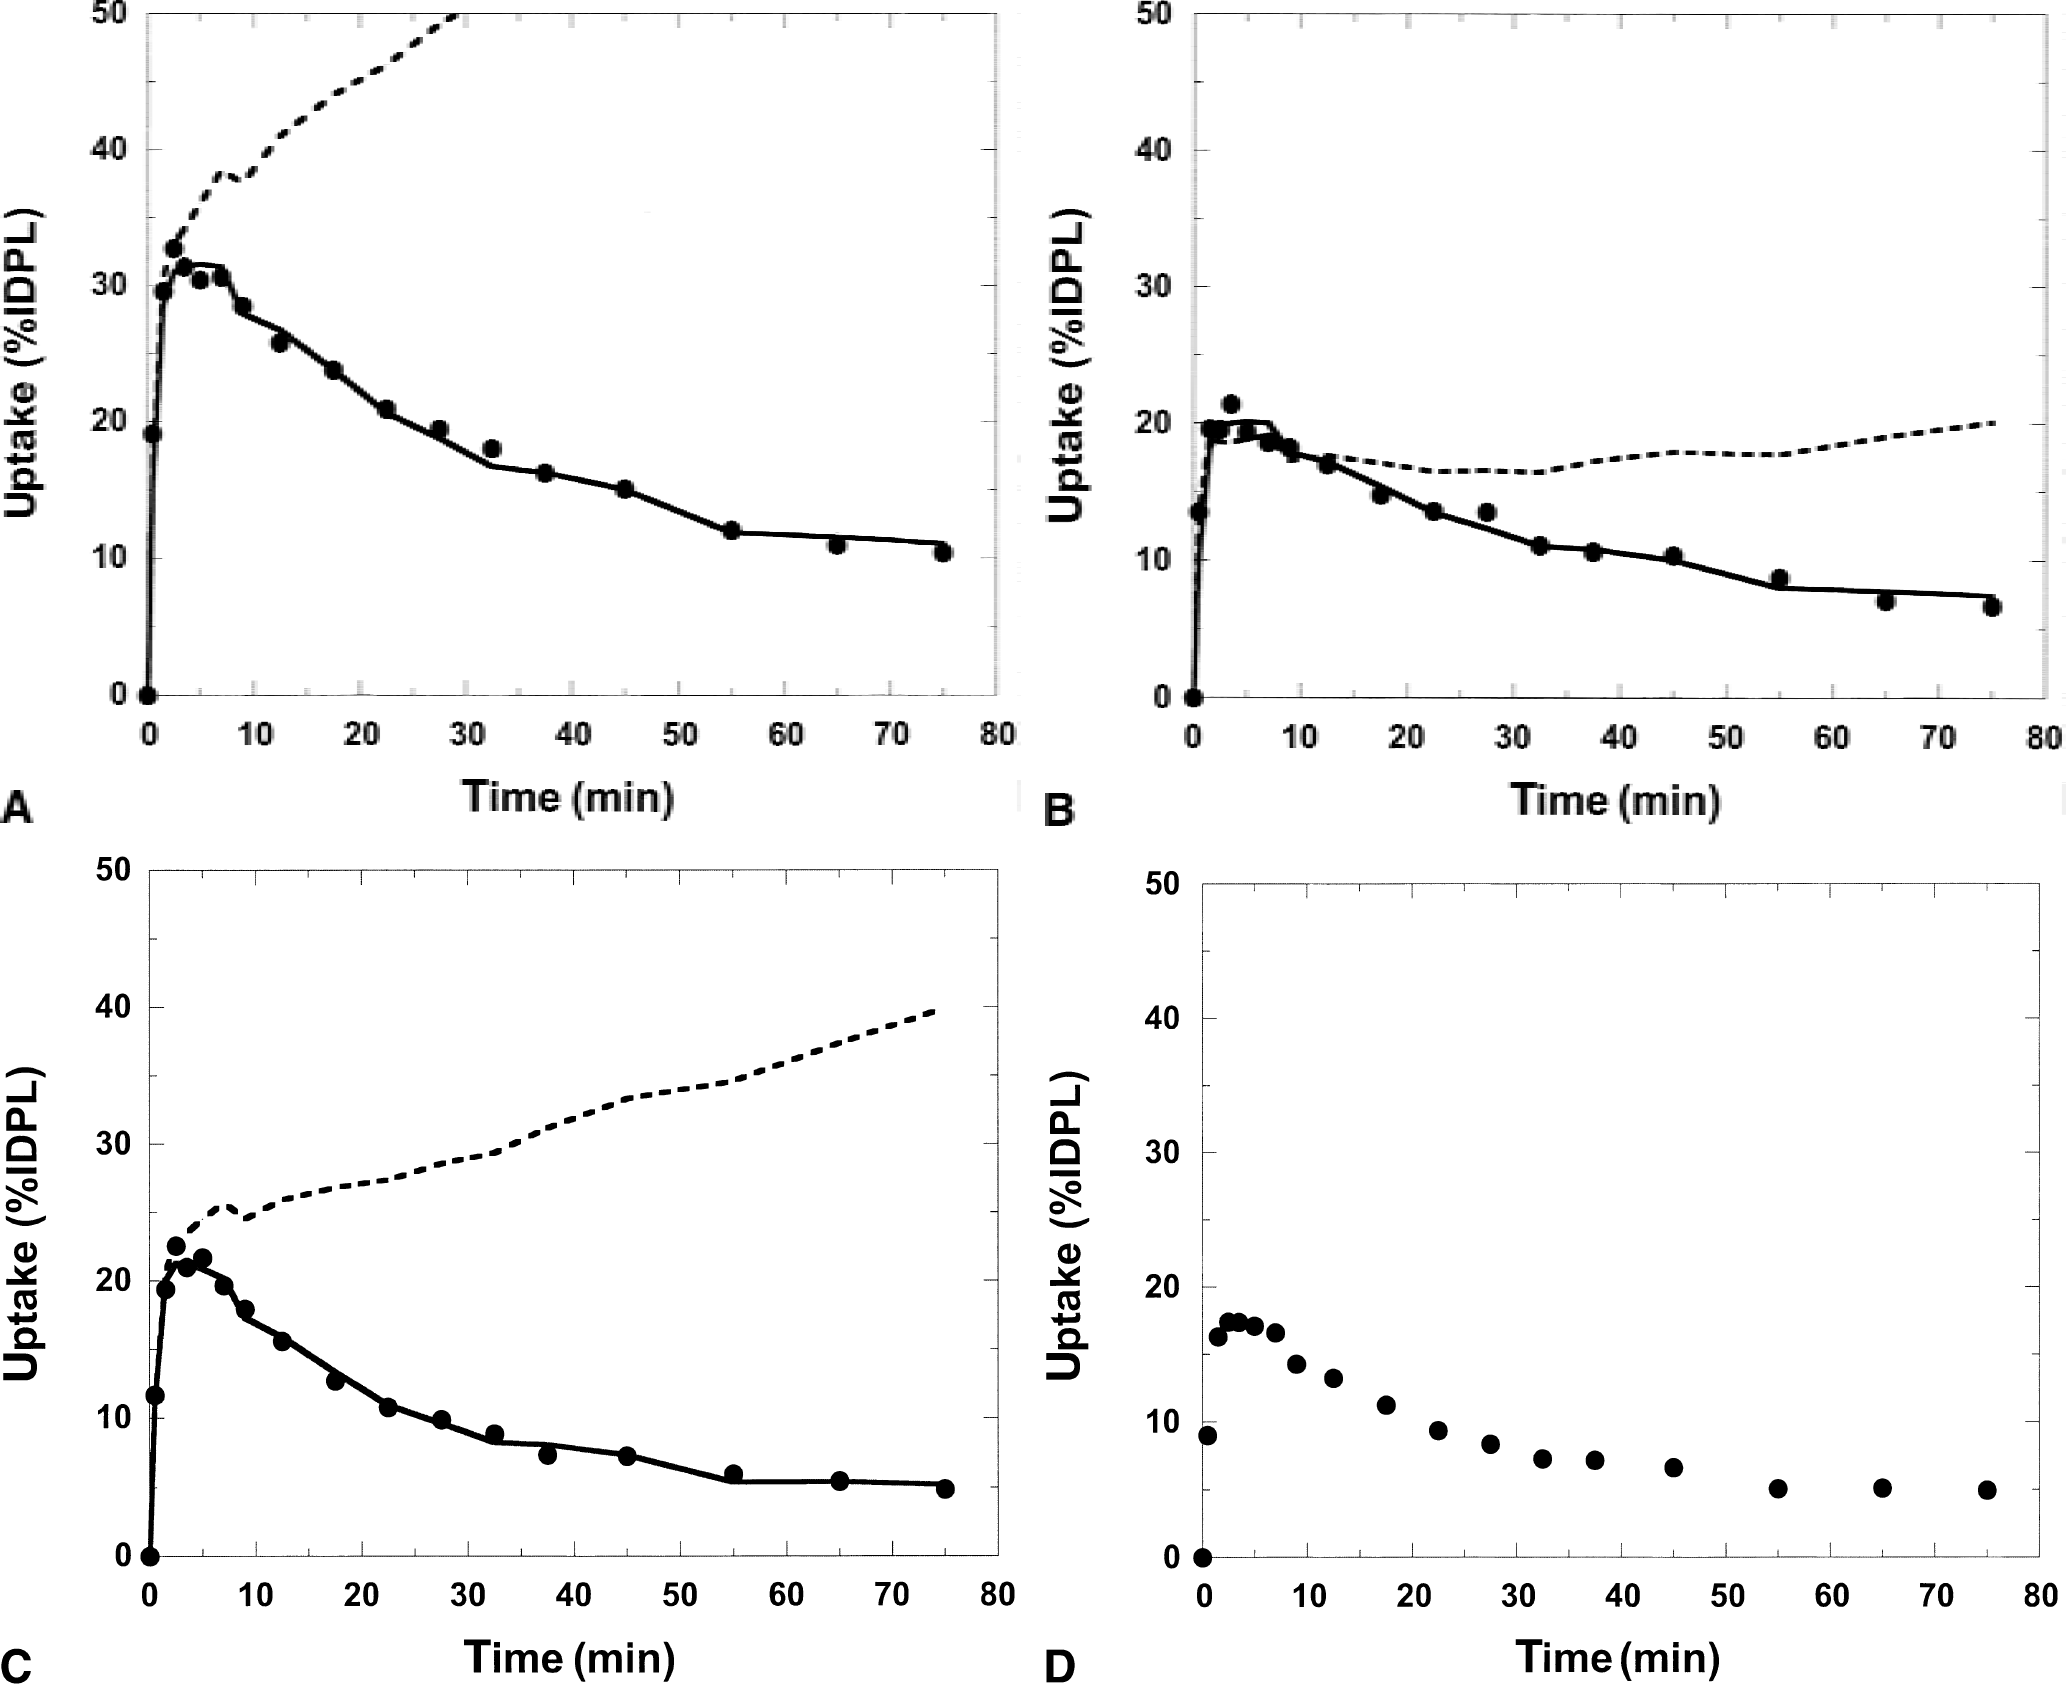
Result of applying the simplified reference tissue model and the reference model with fixed loss rate constant (k
Figure 4 shows the estimated DVR in the putamen and temporal cortex as a function of the preinjected dose of unlabeled PHY. The simplified reference tissue model has been applied. Except for the two displacement experiments, all experiments on monkeys are included (n = 16). Evidently, preblocking with PHY causes DVR to decrease substantially in the putamen even after infusion of moderate amounts of PHY. In the interval 50 to 550 μg/kg/h, the estimated DVR in the putamen is roughly constant, appoximately 0.2 units greater than the baseline value, which is approximately 20% of the DVR value obtained without presaturation (1.93 ± 0.18). For other regions like temporal cortex, where small DVR values were obtained already in the baseline experiment, presaturation gave insignificant decreases in DVR.
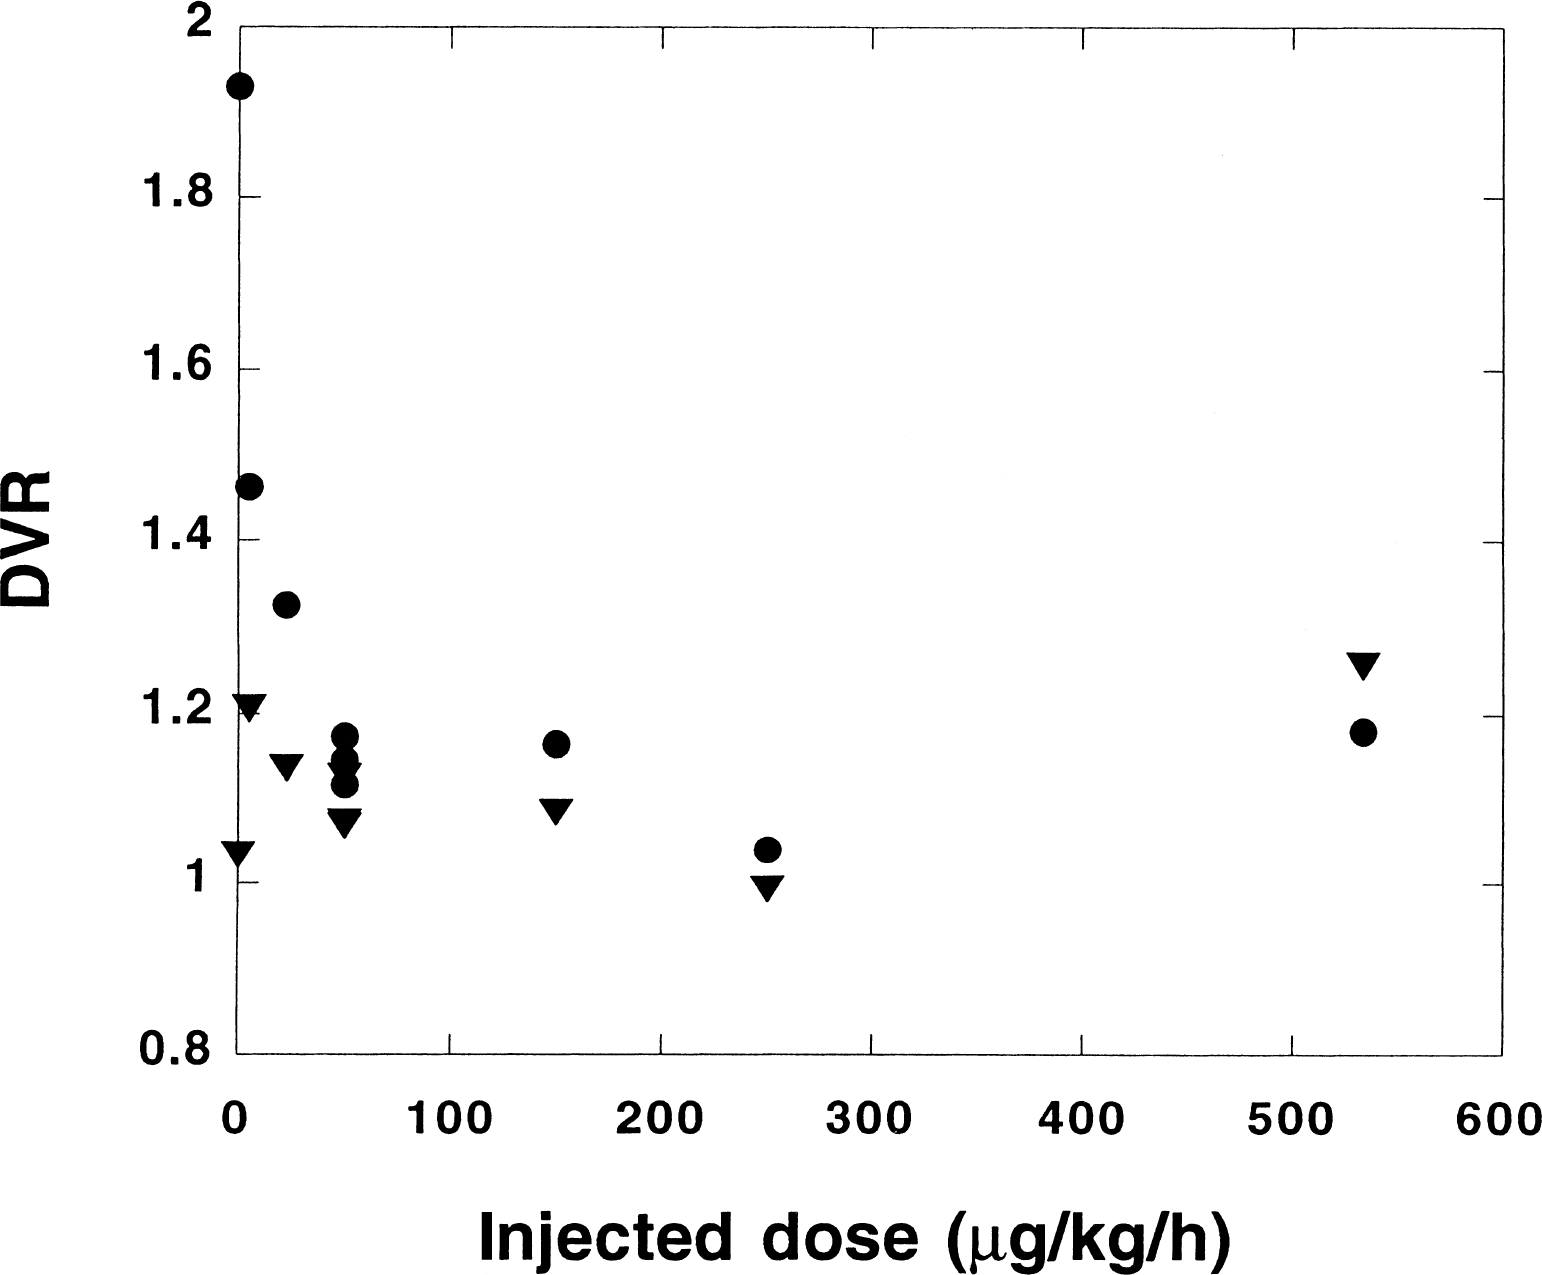
Estimated distribution volume ratio (DVR) (using the simplified reference tissue model) in the putamen (•) and temporal cortex (▵) plotted versus the preinjected dose (μg/kg body weight/hour). All experiments except the two displacement experiments in the study on monkeys are included (n = 16). For the baseline experiments (n = 8), the average value is displayed.
Figure 5 shows the R values for the putamen plotted versus the corresponding DVR values obtained with the simplified reference tissue model. The preblocking experiments are also included (n = 16). No correlation between R values and DVR values can be distinguished. As the low DVR values displayed are the result of preblocking, the data show that the R-parameter is not affected by preblocking with PHY. This is a desired result, because according to the model, the R-parameter should reflect the difference in delivery between the reference region and the target region and this difference should be unaffected by the preblocking. For a diffusible tracer like PHY, the delivery is strongly correlated with the blood flow. In the preblocking experiments, the infusion of unlabeled PHY was started long (1 hour) before the tracer administration to minimize changes in cerebral blood flow, which is known to occur at the onset of the infusion of PHY. The data in Fig. 5 indicate negligible changes in relative CBF as an effect of the infusion.
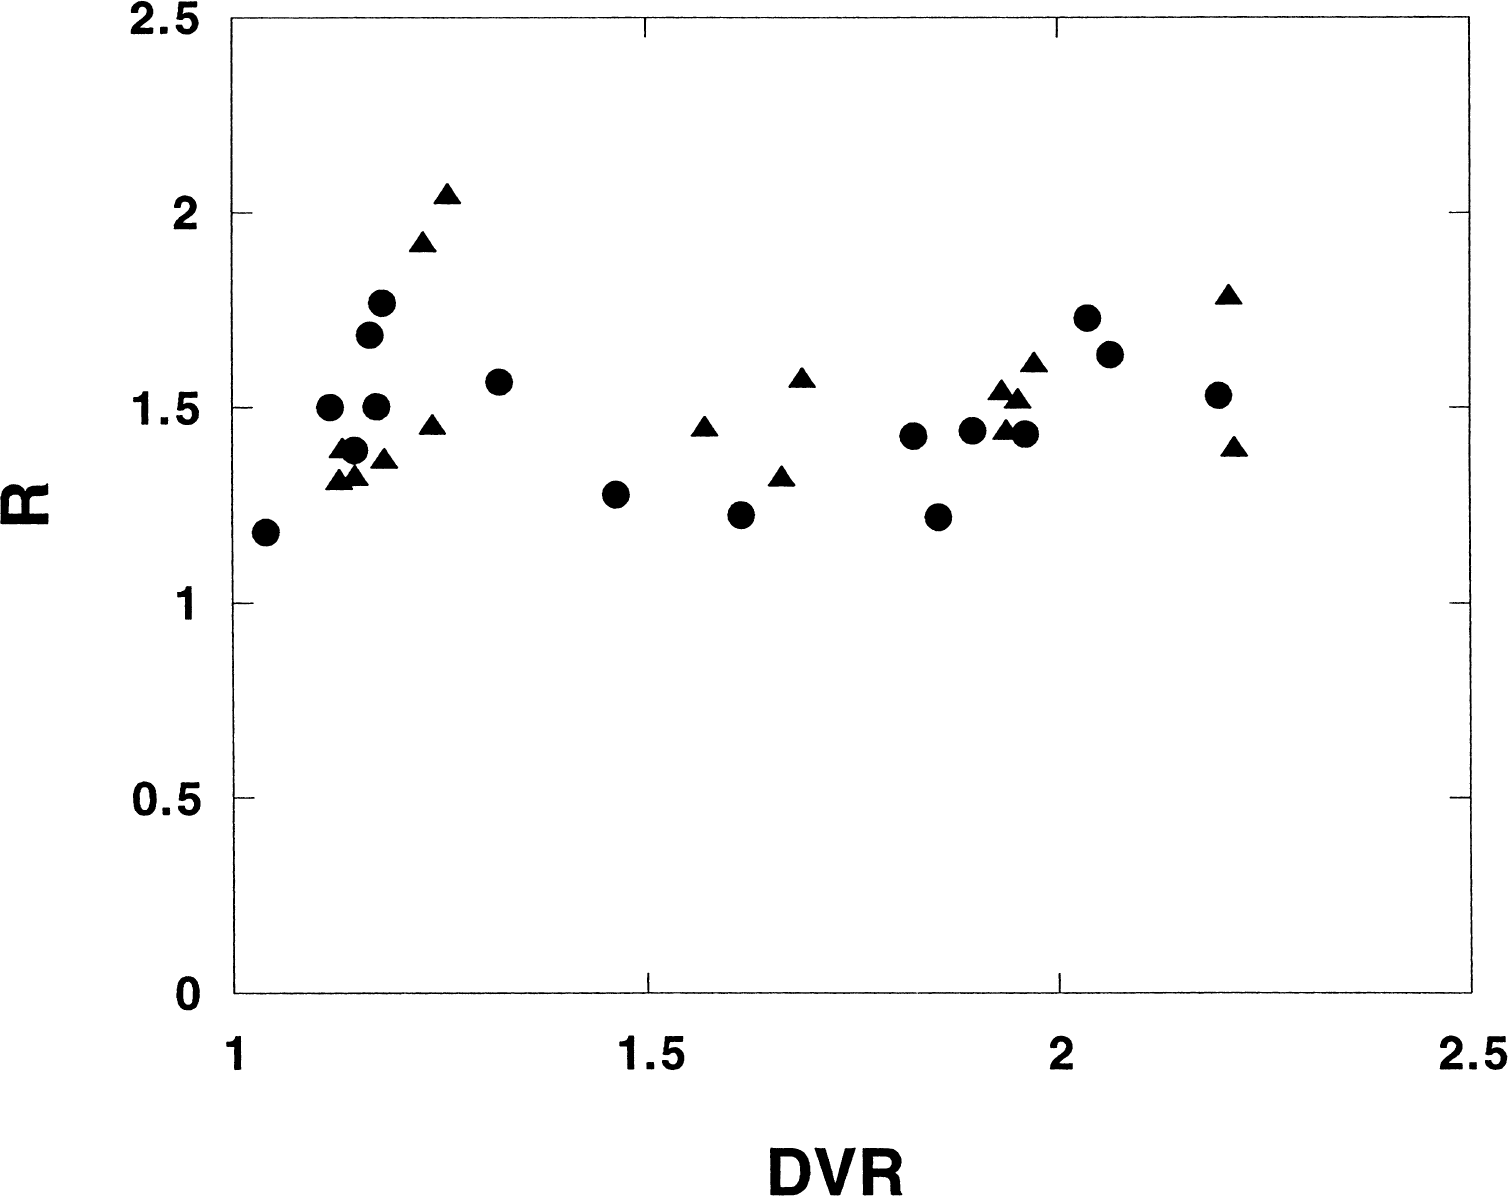
Parameter-R plotted versus distribution volume ratio (DVR) for the putamen (•) and the caudate nucleus (▵). All experiments except the displacement experiments in the study on monkeys are included (n = 16). The simplified reference tissue model was applied.
In the displacement experiments, no immediate effect on the uptake curves of the infusion could be observed in any region, but in regions with high ρ(AChE), the radioactivity concentrations were found to fall somewhat steeper at late times than in the corresponding baseline experiment. This is illustrated in Fig. 6, which shows the ratios between the time-activity curves in the putamen and in white matter and between the caudate nucleus and white matter for one baseline experiment together with the corresponding ratios for a displacement experiment on the same monkey. Clearly, in the time period after the start of the infusion the ratios are similar in shape, but at late times the ratios fall in the displacement experiment, a feature that is not observed in the baseline experiment.
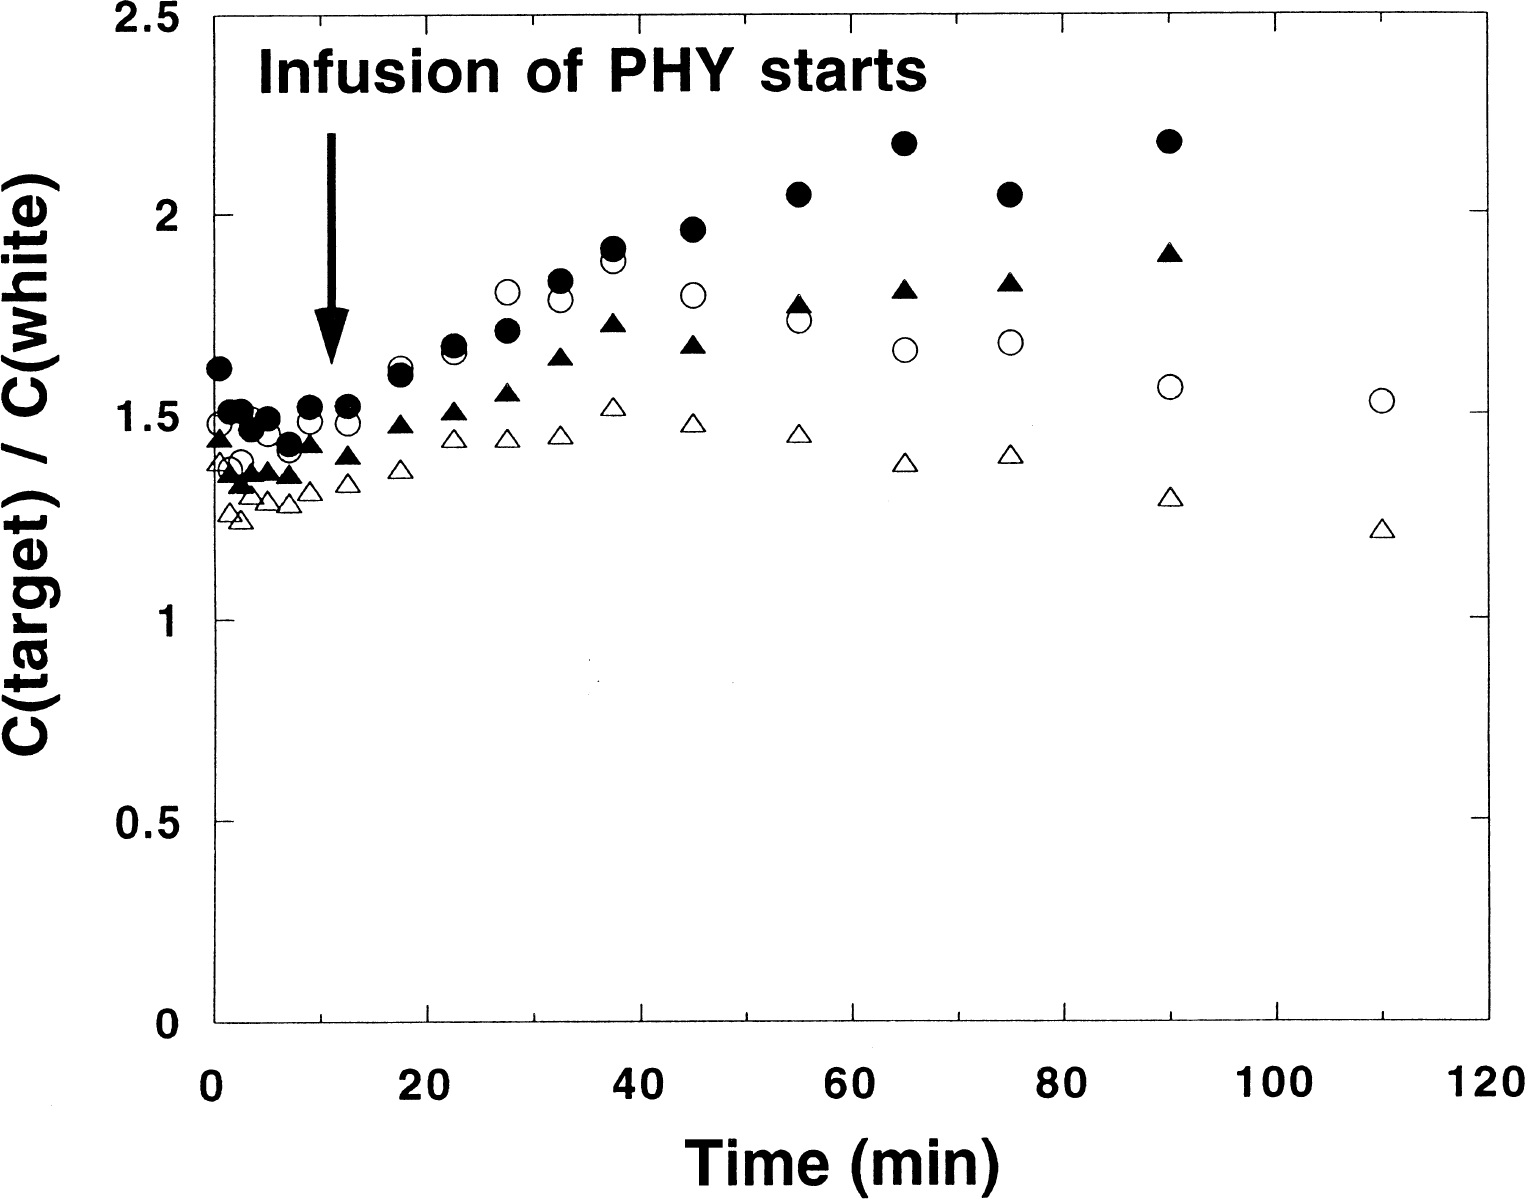
Ratio between the uptake in the putamen and the white matter (•) and the ratio between the uptake in the caudate nucleus and white matter (▵) for a baseline study and the corresponding ratios (○ and Δ) in a study on the same monkey with infusion of unlabeled physostigmine (PHY), starting 12 minutes after the bolus administration of [11C]PHY.
Figure 7 shows a comparison between ρ(AChE) measured postmortem in two monkeys and the DVR values for the same regions in these monkeys. The simplified reference tissue model was used. The points with the highest values are data from the putamen and the caudate nucleus. It should be noted that, when comparing in vivo and in vitro experiments, it is difficult to obtain data from exactly the same areas of the brain. Linear regression applied on the displayed data gives a good correlation (sample correlation coefficient 0.96) between DVR and ρ(AChE). However, the shape of the distribution indicates that the correlation between DVR and ρ(AChE) deviates from linearity. The displayed data demonstrate that the parameter DVR obtained with the simplified reference tissue model correlates well with the in vitro AChE activity obtained with a method that is entirely independent from the PET measurements.
Estimated distribution volume ratio (DVR) versus the acetylcholinesterase (AChE) concentration measured in vitro in some brain regions of two monkeys (• and ▵). Ranked by increasing ρ(AChE), the regions are: cortical areas, cerebellum, thalamus, caudate nucleus, and putamen. The curve is a fit of Eq. 2 (reference tissue model with loss) to the data.
The curve in Fig. 7 was obtained by fitting Eq. 2 to the data. The values for k2, kon, and k
In a previous study, the relative magnitude of the uptake at late times (15 to 20 minutes) after the tracer administration) was used as a measure of the relative regional ρ(AChE) (Tavitian et al., 1993a). The striatal regions (putamen an caudate nucleus) showed the largest uptakes (22.4% ± 1.7% IDPL), followed by the cortex and the cerebellum (13.1% ± 1.0% and 12.7% ± 0.7% IDPL, respectively). Evidently, the contrast in DVR-1 (the signal above the baseline value) between different regions is considerably greater than the corresponding contrast in the uptake at late times. For example, the ratio between the values of DVR-1 in the putamen and the cerebellum is 4.6 ± 1.3 (mean ± SD), whereas the ratio between the average uptakes in the time interval 70 to 80 minutes was only 2.1.
If the measured tracer concentrations are not corrected for the tracer remaining in the blood vessels, a bias in the DVR estimate is introduced (see Appendix). In this study, CBV was not measured, but in the monkey experiments, arterial blood was measured and, therefore, the effect of the vascular radioactivity could be estimated. The authors compared the DVR estimates obtained with CBV put equal to zero in all regions (including the reference region) with the corresponding DVR values obtained by using realistic CBV values and using the time-activity concentration in the arterial blood for correction. The CBV values were assumed to be 0.05, 0.05, and 0.03 in putamen, thalamus, and pons, respectively, and 0.02 in the reference region (white matter). In the putamen, the effect on DVR-1 of neglecting the blood volume component never became greater than 5% in the baseline studies (average ± SD, 3.2 ± 1.7). In the presaturation experiments, in which ρ(AChE) is reduced in all brain regions, the maximum effect reached 11% (average ± SD, 6.3 ± 4.2). The effects in the other regions fell within this range.
Experiments on humans
Figure 8 shows the average ratio of the uptakes in the putamen and in white matter as a function of time obtained in the human experiments. The results show that in humans the ratio also becomes constant within errors at late times (see Fig. 2). The ratio is similar in shape for other regions. Thus, near equilibrium conditions between the tracer in different regions and in white matter (the reference tissue) are reached in the time interval where the regional net accumulation of tracer is observed to follow closely the known regional cerebral AChE activity (Pappata et al. 1996).
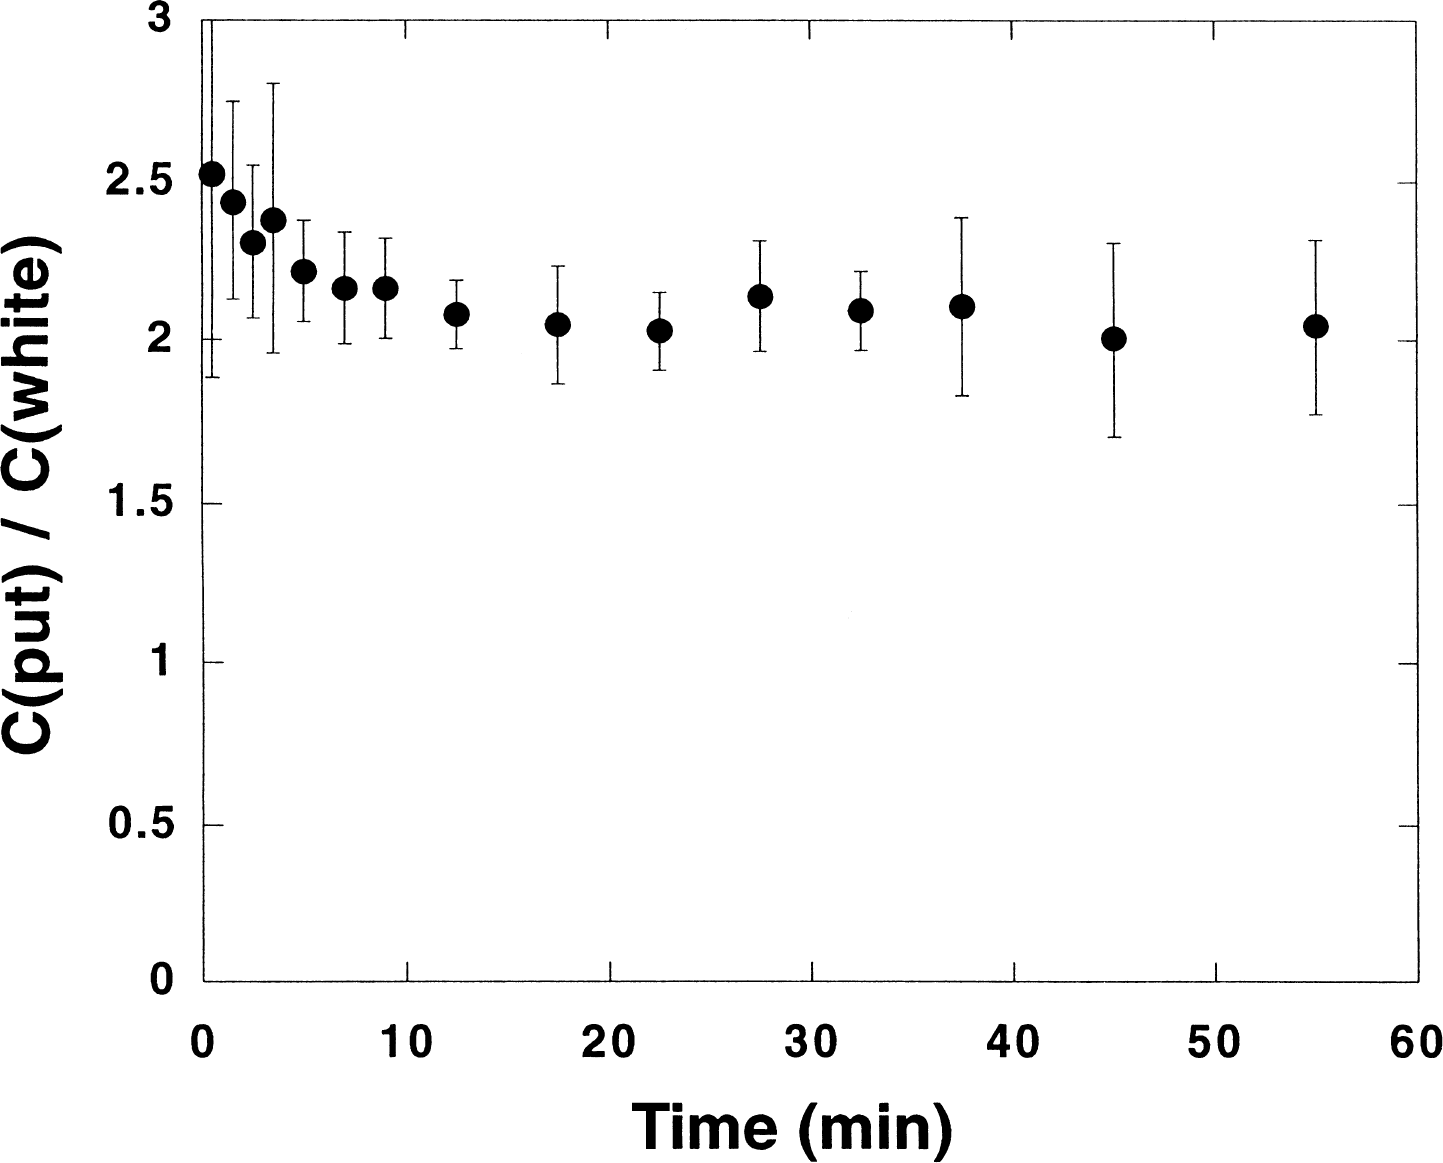
Ratio between the uptake in the putamen and a white matter area (the reference tissue region) as a function of time for humans. Sample averages (n = 8) and standard deviations (bars) are displayed. The time values are the midpoints of the frames chosen for the data acquisition.
Table 2 gives results of applying the three reference tissue models to regional data from the human brain. Again, the two model discrimination criteria, AIC and F-test, were applied on the fits underlying the data in the table. According to AIC, the simplified reference tissue model was best for all except two uptake curves (15 regions in 8 subjects). According to the F-test, use of free k
Results obtained by applying three different reference tissue models on the human baseline experiments (n = 8)
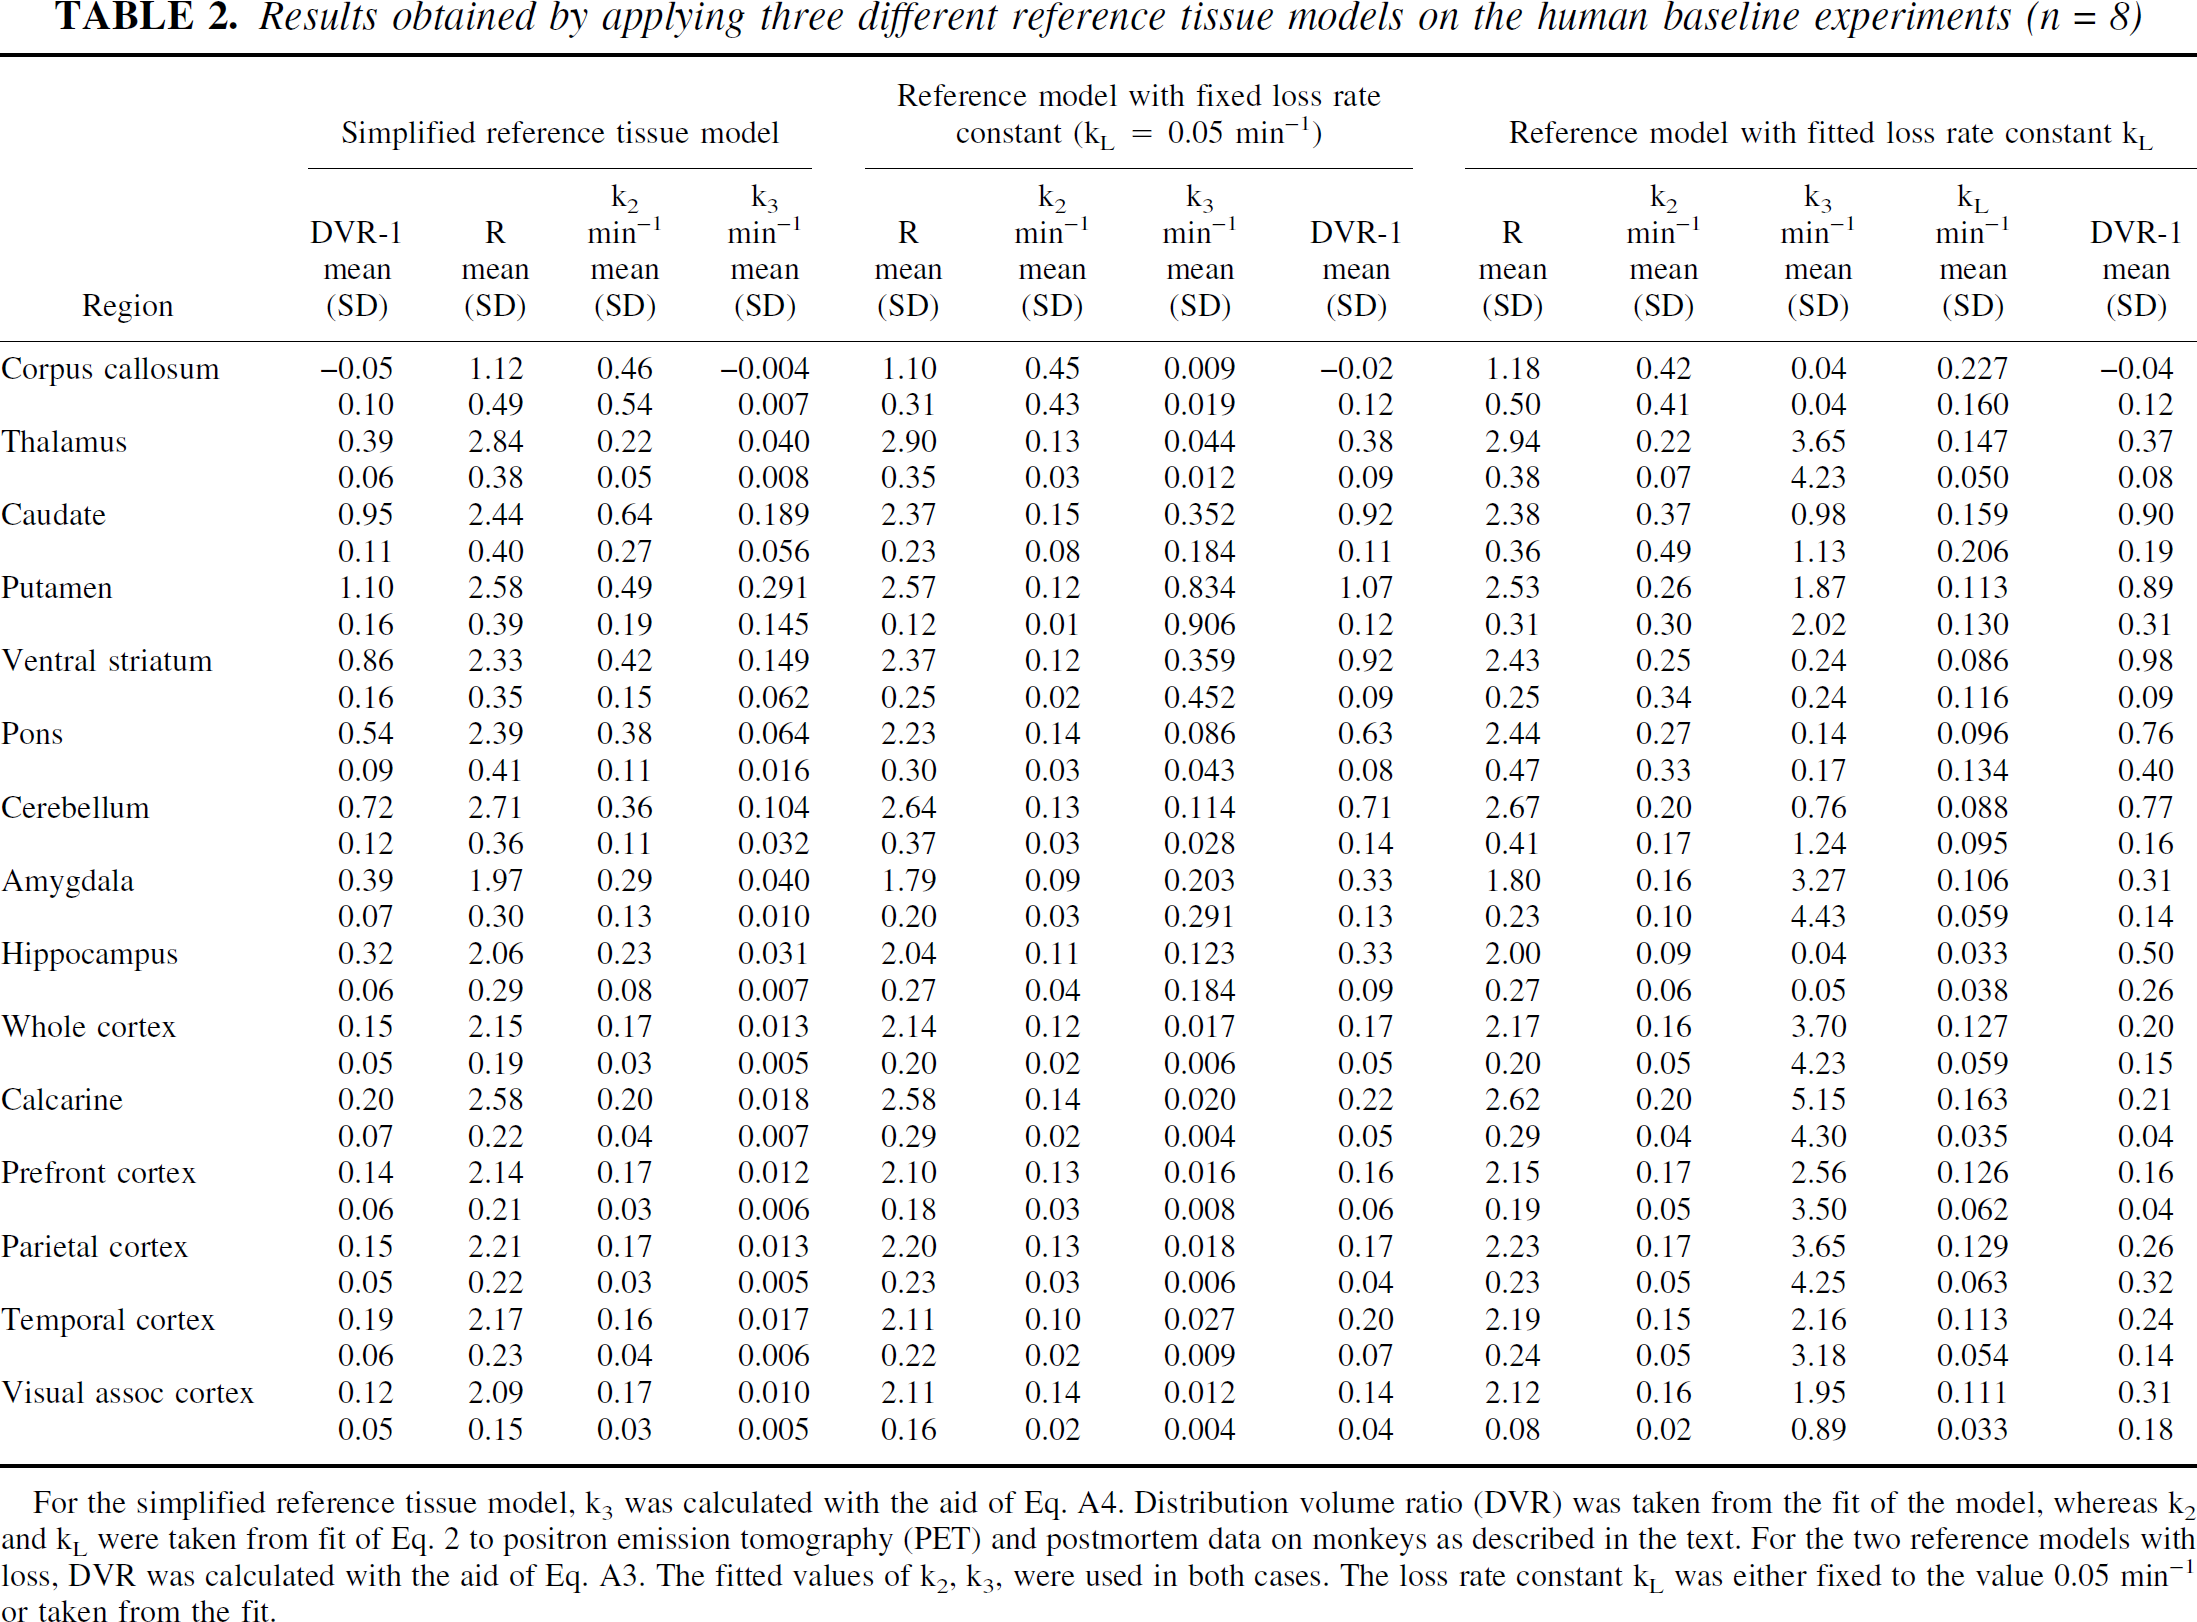
For the simplified reference tissue model, k3 was calculated with the aid of Eq. A4. Distribution volume ratio (DVR) was taken from the fit of the model, whereas k2 and k
The parameter values obtained when the different models are applied on the human data have similar features as observed in the monkey experiments. The DVR values obtained with the simplified reference model and the reference model with fixed loss rate constant (0.05 min−1), respectively, are very close to each other for all regions (regression line y = 0.035 + 0.98x, r = 0.996). With freely varying k
Figure 9 shows results of applying the simplified reference tissue model and the reference tissue model with fixed loss rate constant (k
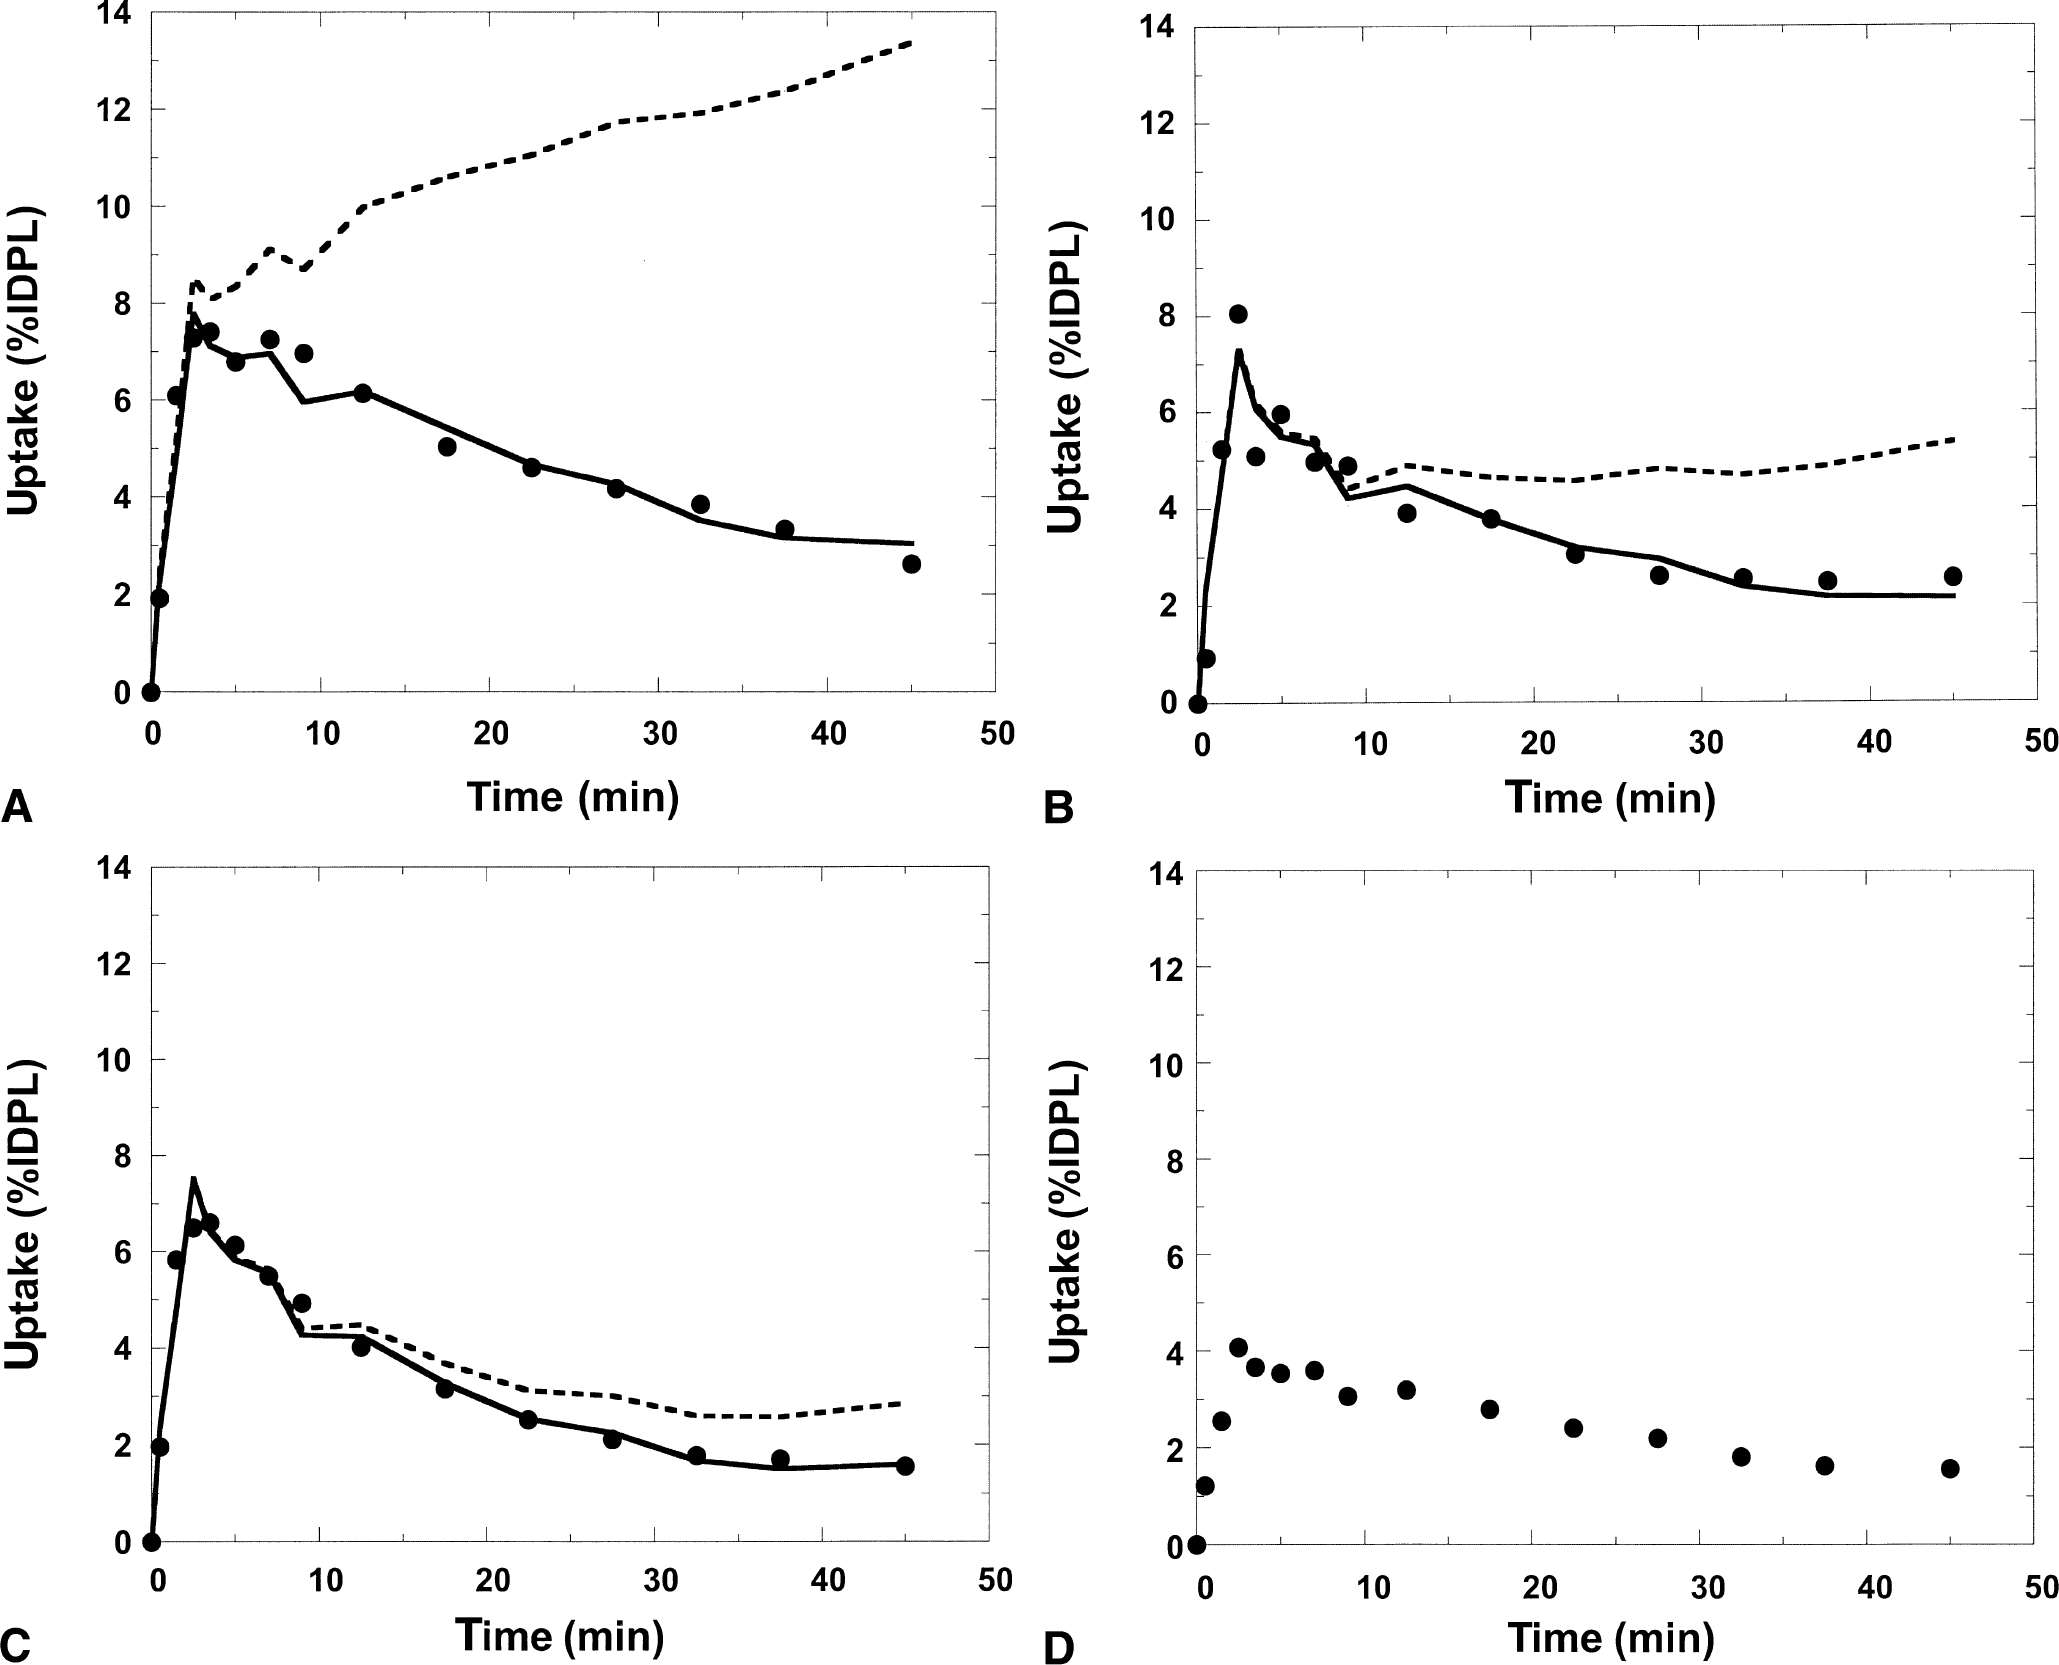
Simplified reference tissue model and the reference model with fixed loss rate constant (k
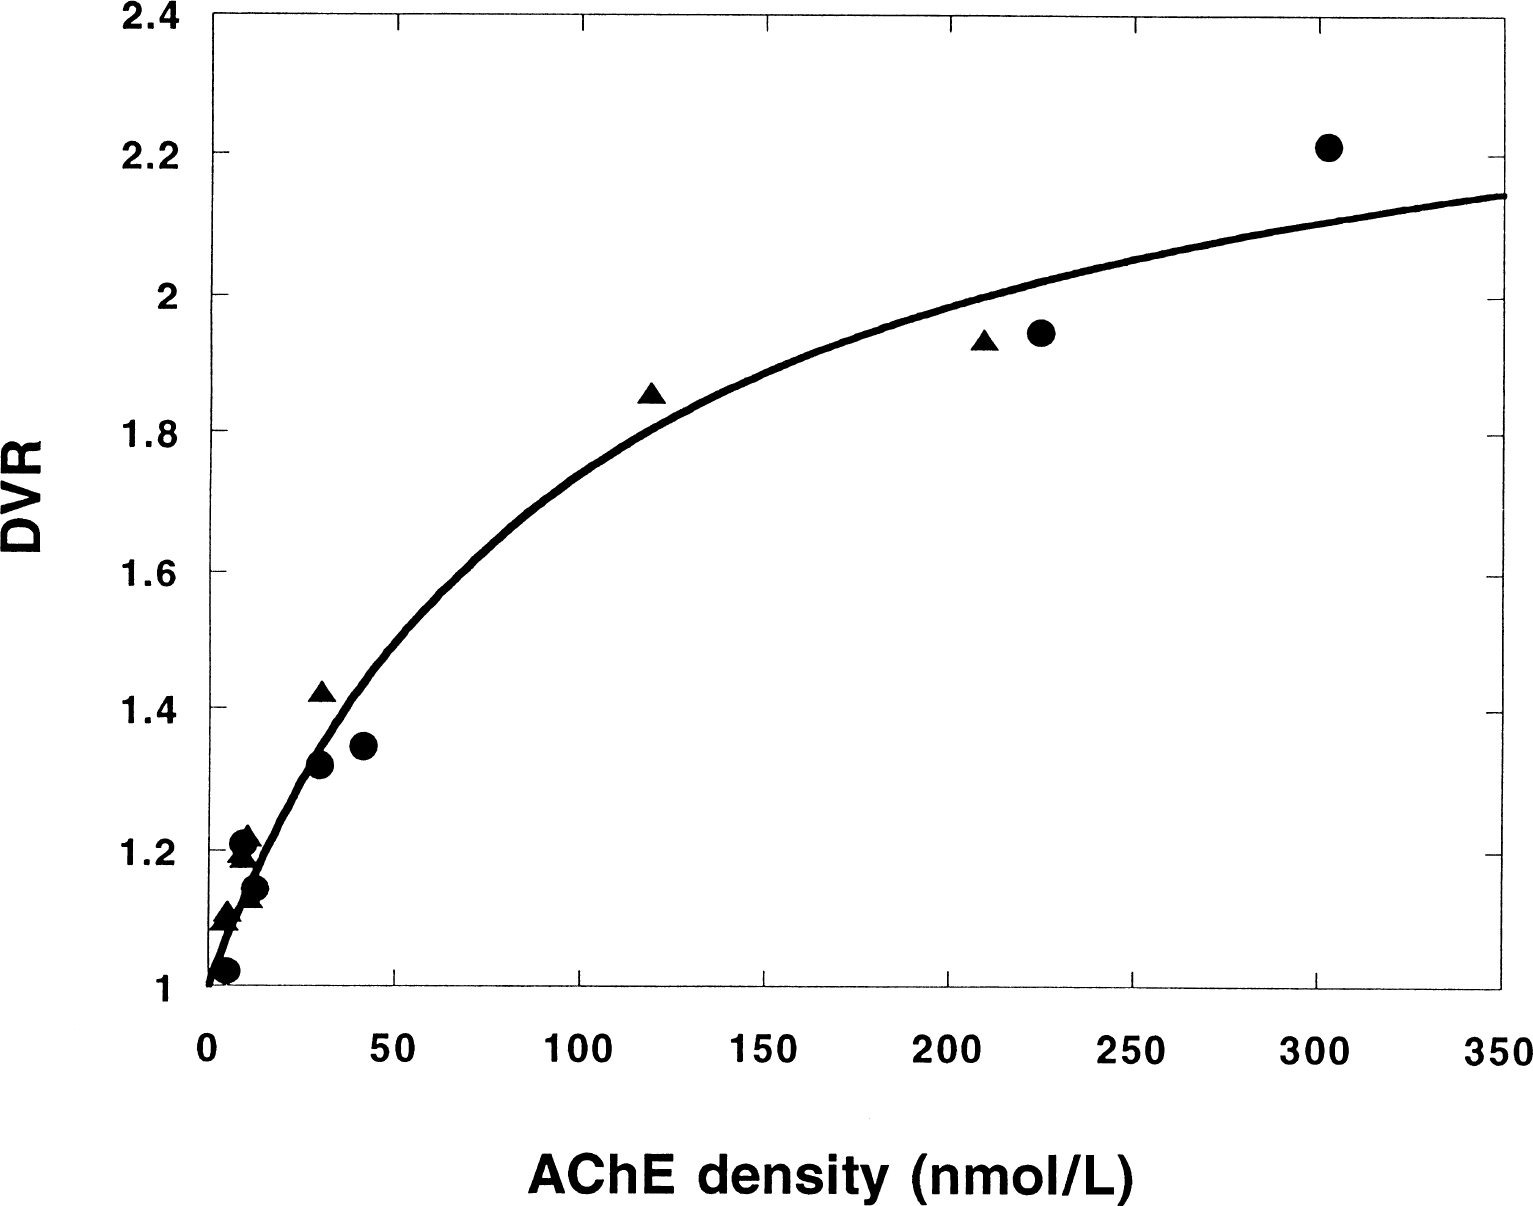
Figure 10 shows a comparison between the DVR values obtained for some regions in the human study and the corresponding ρ(AChE) values obtained in vitro. The latter data are the most recent found in the literature (Enz et al., 1993). The plot indicates that for humans the correlation between DVR and ρ(AChE) is also nonlinear (see Fig. 7). The curve is obtained by fitting Eq. 2 to the data. Because of the small number of observations, k2 and k
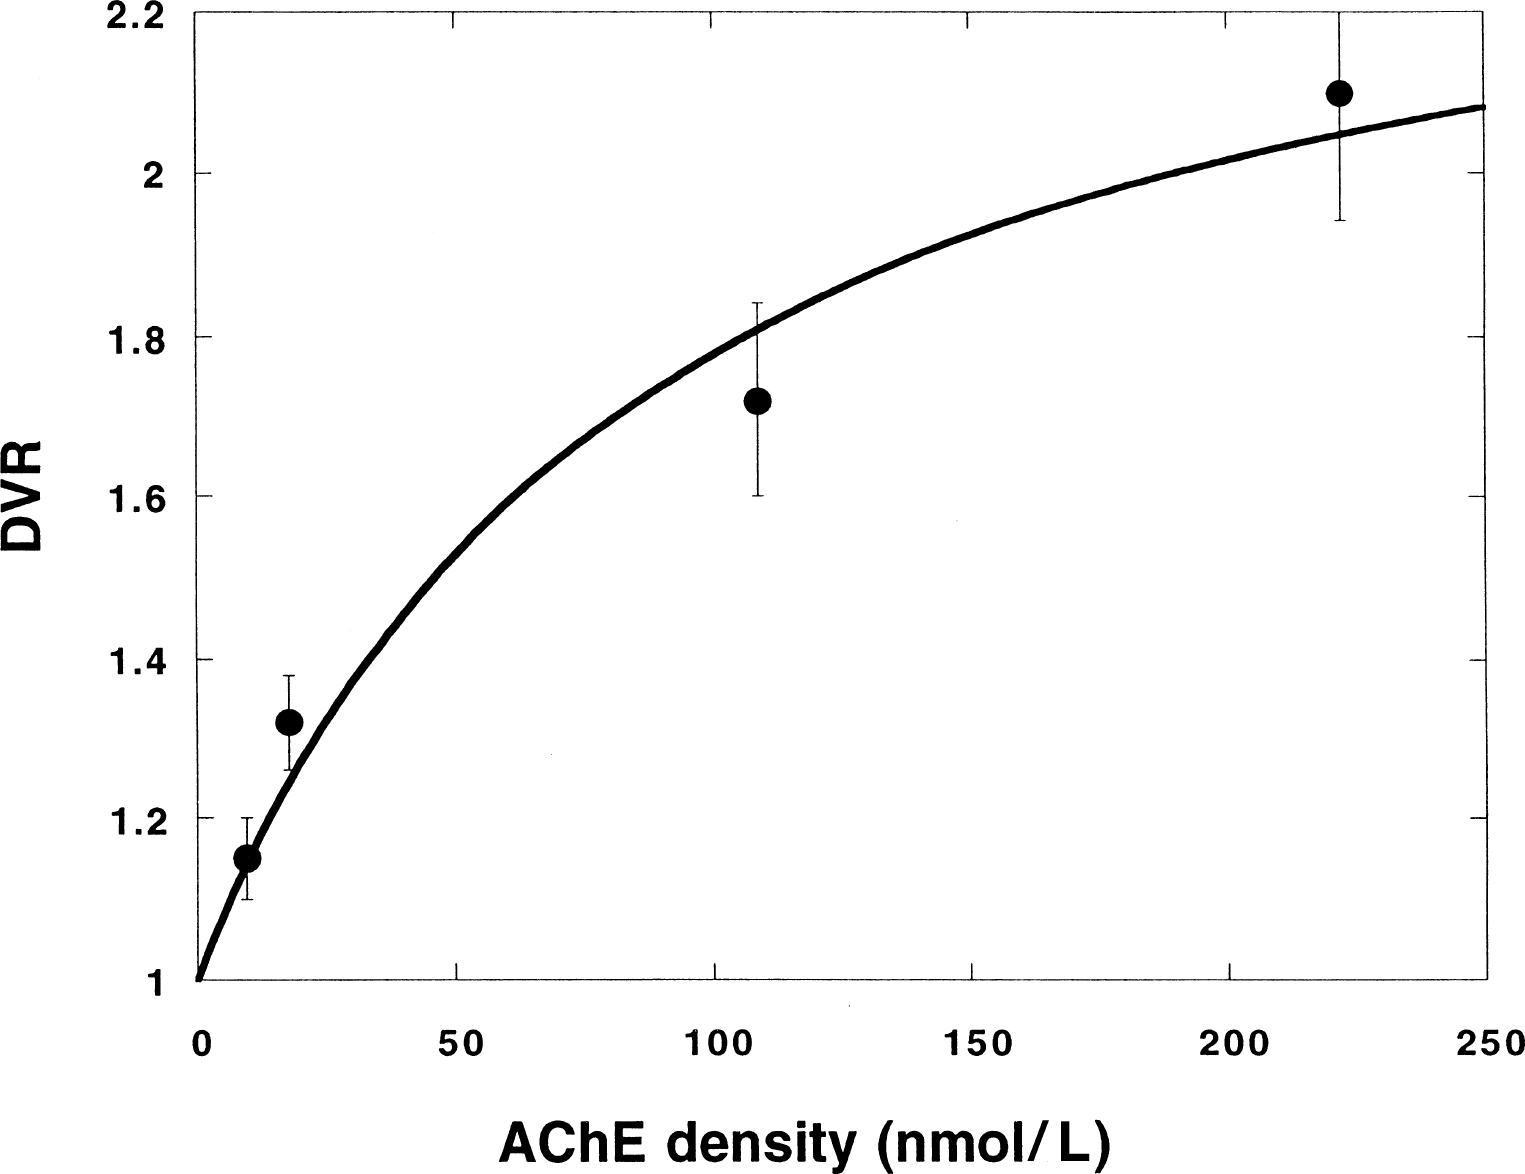
Average distribution volume ratio (DVR) values obtained for the experiments on humans (n = 8) plotted versus the acetylcholinesterase (AChE) concentration measured in vitro for some regions (average cortex, hippocampus, cerebellum, and striatum) of the human brain taken from Enz et al. (1993). Ranked by increasing ρ(AChE), the regions are: parietal cortex, hippocampus, cerebellum, and putamen. The curve is a fit of Eq. 2 to the data using the same values for k2 and k
DISCUSSION
Use of reference region
The authors' analysis of [11C]PHY data shows that the DVR obtained from the simplified reference tissue model, or alternatively from the reference model with fixed loss rate constant, is a robust index of ρ(AChE). Using reference tissue models, the need for invasive arterial sampling, as well as tedious and time-consuming metabolite analysis of the blood or plasma, is avoided. Systematic errors caused by an ill-defined input function are also eliminated. However, it is essential to have a good reference region with these methods. The DVR values in Tables 1 and 2 show that for humans the coefficients of variation are smaller and the contrast between regions are greater than in the monkey studies. The reason for this difference is most likely the reduced partial volume effect due to the improved delineation of white matter in human brain. In the monkey experiments, the measured uptake in white matter can contain a large admixture from the uptake in the surrounding (grey) matter. Therefore, the uptake in white matter easily will be overestimated which, in turn, implies that DVR will be underestimated. This effect is illustrated by Fig. 4, showing that DVR values less than the baseline value of 1 can be obtained (in this case for a region in the temporal cortex). Consequently, it becomes difficult to detect the effect of presaturation in regions with low ρ(AChE). These problems can be overcome by using cameras with improved spatial resolution.
The general feature of the regional uptake of [11C]PHY, an initial flow-dependent phase and a final phase-dependent on ρ(AChE), suggests a kinetic model with at least two tissue compartments. The monotonic decrease of the uptake curves with time after the initial flow-dependent peak suggests that irreversible trapping of the tracer is very small or absent. The time course of the ratio between the uptake in different regions and the uptake in white matter, which is almost constant at late times (Figs. 2 and 9), also indicates that the overall kinetics of the tracer is reversible. In white matter, [11C]PHY is only supposed to diffuse in and out across the BBB, which means that the kinetics can be described with a single reversible tissue compartment. Moreover, the data suggests that a workable model should be simple: at late times (in which the uptake reflects AChE activity), effectively only one parameter, the DVR between the target and reference regions DVR, is needed.
Carbamylation versus dissociation
The [11C]PHY data can be described well with the reference tissue model corresponding to the compartmental configuration of Fig. 1B, with dominance of carbamylation of the PHY-AChE complex in front of dissociation and with subsequent loss of [11C]CO2 from the brain (Eq. A6). The data can be described equally well with the simplified reference tissue model (Eq. A8), which is the limiting case not only for the former model but also for the reverse model with dominating dissociation of the complex in front of carbamylation. In fact, the simplified reference model is the limiting case of any overall reversible model with sufficiently rapid equilibration between the tissue compartments. Thus, it is impossible to discriminate between the two extreme cases from the behavior of the uptakes at late times only. However, the displacement experiments, as well as the comparison between DVR and ρ(AChE), indicate that carbamylation dominates in front of dissociation. The arguments are explained below.
As an effect of displacement, the ratio between the regional uptake and the uptake in white matter decreases as a function of time, after the initial flow-dependent phase (Fig. 6). The decrease is interpreted as effect of loss of [11C]CO2 from the brain. By displacement, the influx into the pool of the PHY-AChE complex stops, and by the carbamylation process, the concentration in this pool decreases. Because of the effectiveness of the carbamylation, the concentration of the PHY-AChE complex is probably already small at the time of the displacement (the ratio [PHY-AChE]/[free PHY] is k3/(k4+k5); Fig. 1); therefore, no immediate change in slope of the uptake curves can be observed at the onset of the displacement. However, after this time the large pool of carbamylated AChE is not refilled and the decrease of the tracer concentration becomes faster than in the baseline experiments. Equilibrium cannot be reached until all the tissue pools except the pool of free PHY are empty, which is not achieved within the measuring time.
However, if dissociation of the PHY-AChE complex were much more probable than the carbamylation, equilibrium should be reached after displacement when the PHY-AChE pool is empty. It is likely that this equilibrium state should be reached comparatively fast, because otherwise the ratio between the uptakes in different regions and white matter should not become constant within time so rapidly (Figs. 2 and 8). Furthermore, it is likely that the onset of the displacement should be visible in the uptake data as an accelerated decrease of the tracer concentration with time.
If dissociation should dominate in front of carbamylation—that is, if k5 << k4—DVR should be linearly related to k3 (Eq. A5) which, in turn, is expected to be proportional to ρ(AChE) (see Appendix). Thus, in this case, DVR should be linearly related to ρ(AChE). This prediction is contradicted by the data (Figs. 7 and 10). However, with dominance of carbamylation in front of the dissociation, DVR is predicted to depend nonlinearly on ρ(AChE) because k3 enters nonlinearly in the equation for DVR (Eqs. A2 and A3). Figures 7 and 10 show that Eq. A3, which is based on the assumption that k5 >> k4, can describe the experimental data well.
Thus, the results indicate that carbamylation with subsequent production of [11C]CO2 is a dominating process in front of dissociation of the [11C]PHY-AChE complex, but the data do not rule out that the latter process contributes to some extent. The compartmental configuration in Fig. 1B is the simplest possible that contains a unidirectional transfer (the rate limiting association process, see Theory) between the tissue pools with subsequent loss of tracer back into the blood stream.
Cerebral blood flow dependence
For [11C]PMP, Koeppe et al. (1999) found that increased CBF did not affect k3. Thus, with this tracer the DVR for nonmetabolized tracer in the tissue, DVRfree = k2/(k2 + k3), is expected to increase somewhat with increasing CBF (because k2 like K1 is expected to be approximately proportional with CBF). It is likely that k2 for [11C]PHY has an analogous CBF dependency. However, the proportions between k2 and k3 are different for the two tracers, because PMP has a larger affinity for AChE than PHY, which means that k3 is greater for PMP than for PHY (see below). This implies that DVRfree for PHY probably depends less on CBF than DVRfree for [11C]PMP.
Dominance of carbamylation in front of dissociation of the PHY-AChE complex (k5 >> k4) means that labeled CO2 must be lost from the tissue, otherwise the tracer would accumulate in the tissue and the equilibrium state (Figs. 2 and 8) would not be reached. Furthermore, with the loss rate constants equal to 0.05 min−1, the loss of label is predicted to be large in regions with high AChE activity (Fig. 9). It is likely that increased CBF results in a more effective removal of CO2 from the tissue, that is, that the loss rate constant k
Assuming the model in Fig. 1B to be valid, the argument can be made quantitative with the aid of Eq. A3 for DVR. Two regions with k3 equal to 0.2 (high ρ(AChE)) and 0.02 min−1 (low ρ(AChE)), respectively, are considered. The two regions are assumed to have the same values of the parameters k2 and k
To some extent, the possible CBF difference between a control group and a patient group can be checked with the aid of the R-factor, because this factor is a measure of the ratio between the CBF values in a target and the reference regions for a tracer that enters the brain by passive diffusion (see Appendix). However, this test is only applicable if CBF in the reference region is the same in the two groups.
Comparison of the reference tissue models
In theory, the more complex reference tissue model including loss (Eq. A6, Fig. 1B) should be a better choice than the simplified reference tissue model, because it allows the estimate of K3, which is a more direct measure of the AChE activity than DVR, obtained with the simplified model. The results in Tables 1 and 2 show that the model with freely varying loss rate constant k
When k
In agreement with that conclusion, the information in Figs. 2 and 8 indicate that, apart from the initial time interval providing information about the parameter R, there is little information besides DVR in the data. Therefore, the estimates of other parameters (k2, k3) become variable. In general, attempts to use models with more parameters than needed lead to large variation of the parameter estimates, or false couplings between the parameters, or both. However, the close relation between the DVR estimates using either the simplified reference model or the reference model with loss (k
The model with fixed loss rate constant and the simplified reference model give nearly the same DVR value for each region and the corresponding COV values are also similar. The fitted uptake curves are close to each other. No discrimination between the two models can be made on the basis of the AIC or F-test. The AIC favors the simplified reference model in front of the model with fixed loss rate constant in the human model, but this result can be an effect of using an average k
Comparison of [11C]PHY with other tracers for AChE activity
Irie et al. (1994, 1996) investigated labeled acetylcholine analogs as tracers for AChE activity. Unlike [11C]PHY, these tracers are effectively trapped in the brain tissue. Because of its higher specificity for AChE compared with the other tracers investigated, labeled N-methyl-4-piperidyl acetate (AMP) was selected as the most promising tracer to use in studies of cortical AChE (Iyo et al., 1997; Namba et al., 1998). However, along with its high specificity for AChE, AMP also has a high hydrolysis rate. In regions with high AChE activity, such as the basal ganglia, the tracer is hydrolyzed so rapidly that the transport across the BBB becomes the rate limiting step (Irie et al., 1994), which means that the tracer concentrations in regions of high AChE activity is strongly dependent upon blood flow and extraction, and only to a lesser extent on AChE activity.
The method using [11C]PMP as tracer for AChE activity in the human brain was developed by Koeppe et al. (1999) and applied by Kuhl et al. (1999). Determination of metabolite corrected arterial input function is required. This tracer has less affinity for AChE than AMP, which means that regions with greater ρ(AChE) than the cortex can be analyzed. The labeled metabolites are retained in the tissue. As index of regional ρ(AChE), the rate constant for hydrolysis, k3, was used. Very precise measurements of k3 in regions with low ρ(AChE) were achieved, but the method performs progressively more poorly as ρ(AChE) increases. Coefficient of variation for k3 (Fig. 7 in Koeppe et al., 1999) was found to be approximately 15% in cortical areas, 21% in pons and cerebellum, 30% in thalamus and putamen, and 40% in caudate nucleus. In comparison, COV of DVR-1 for [11C]PHY is found to be 30% to 40% in cortical areas, 17% in pons and cerebellum, 15% in thalamus and putamen, and 12% in caudate nucleus. These data show that in areas with low AChE activity, k3 obtained with [11C]PMP gives much better precision than DVR-1 obtained with [11C]PHY. In regions with intermediate AChE activity, the two measures have comparable precisions, whereas [11C]PHY gives much better precision than [11C]PMP in areas with high AChE activity. However, the better precision of [11C]PHY in regions with high ρ(AChE) is counteracted by the lower contrast in DVR, compared with k3 using [11C]PMP. According to Eq. 2, DVR is expected to become constant, equal to k2/k
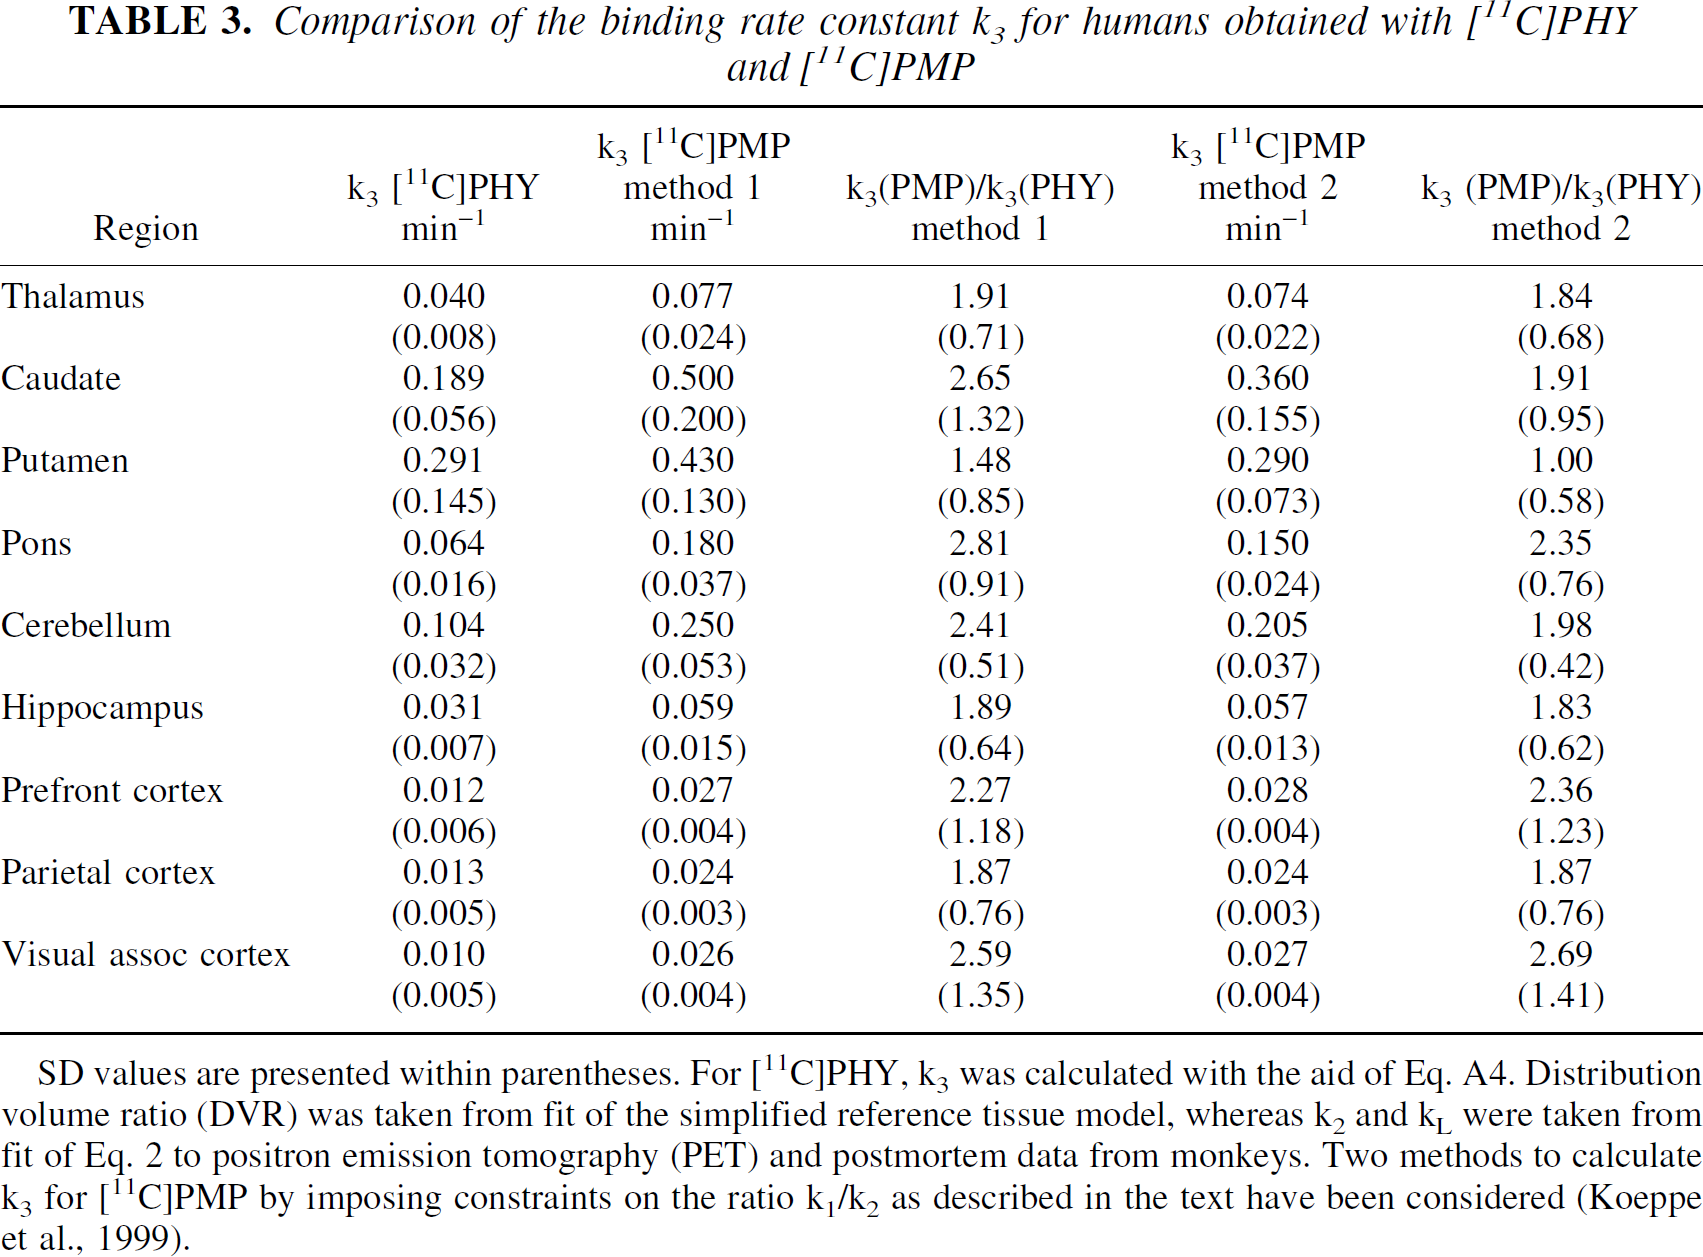
The k3 values obtained with [11C]PMP and [11C]PHY are compared in Table 3 for some regions. For [11C]PMP, the k3 values have been extracted from Figs. 6 and 7 in Koeppe et al. (1999). In regions with high ρ(AChE), k3 could only be estimated reliably by assuming a constant value (= 4) of k1/k2, or making a correction, using this constant value of k1/k2 (Koeppe et al., 1999). The results from both methods are presented. For [11C]PHY, the k3 values were calculated with the aid of Eq. A3, using DVR estimated with the simplified reference tissue model, and the k2 and k
Comparison of the binding rate constant k3 for humans obtained with [11C]PHY and [11C]PMP
SD values are presented within parentheses. For [11C]PHY, k3 was calculated with the aid of Eq. A4. Distribution volume ratio (DVR) was taken from fit of the simplified reference tissue model, whereas k2 and k
The k3 ratio is seen to be lowest in the putamen. With [11C]PMP the average value of k3 became lower in the putamen than in the caudate nucleus. In contrast, with [11C]PHY a greater DVR value was obtained in the putamen than in the caudate nucleus in all eight human experiments, in agreement with postmortem data for the human brain (Reinikainen et al., 1988). The observation illustrates the difficulty of using [11C]PMP in regions with high ρ(AChE). In both models applied for this tracer, the estimate of k3 depends critically on the assumed value of the ratio between k1 and k2. In the reference tissue models, used for [11C]PHY, the value of k1/k2 is not specified, because the ratio does not enter in the operational equations (Eqs. A6 and A8). Thus, the ratio can vary between subjects, for example, between controls and patients.
Conclusions
The proposed method of using the simplified reference tissue method to analyze [11C]PHY data is noninvasive and provides a robust index, DVR, of regional AChE concentration that correlates well with regional ρ(AChE) measured in vitro.