
Abstract
N-[11C]Methylpiperidin-4-yl propionate ([11C]PMP) is a substrate for hydrolysis by acetylcholinesterase (AChE). This work evaluates kinetic analysis alternatives for estimation of relative AChE activity using dynamic positron emission tomography (PET) studies of [11C]PMP. The PET studies were performed on three groups of subjects: (1) 12 normal volunteer subjects, aged 20 to 45 years, who received a single intravenous injection of 16 to 32 mCi of [11C]PMP; (2) six subjects, aged 21 to 44 years, who received two 16-mCi injections of [11C]PMP (baseline and visual stimulation, respectively); and (3) five subjects, aged 24 to 40 years, who received two 16-mCi injections separated by 200 minutes (baseline and after a 1-hour constant infusion of 1.5 mg of physostigmine, respectively). Dynamic acquisition consisted of a 17-frame sequence over 80 minutes. All analysis methods were based on a first-order kinetic model consisting of two tissue compartments with the parameter k3‘ representing PMP hydrolysis, being the index of AChE activity. Four different schemes were used to estimate k3: (1) an unconstrained nonlinear least-squares fit estimating blood—brain barrier transport parameters, K1 and k2, in addition to the hydrolysis rate constant k3; (2) and (3), two methods of constraining the fit by fixing the volume of distribution of free tracer (DVfree); and (4), a direct estimation of k3 without use of an arterial input function based on the shape of the tissue time—activity curve alone. Results showed that k3 values from the unconstrained fitting and no input methods were estimated with similar accuracy, whereas the two methods using DVfree constraints yielded similar results. The authors conclude that the optimal analysis method for [11C]PMP differs as a function of AChE activity. All four methods gave precise measures of k3 in regions with low AChE activity (~10% coefficient of variation in cortex), but surprisingly, with unconstrained methods yielding estimates with lower variability than constrained methods. In regions with moderate to high AChE activity, constrained methods were required to yield meaningful estimates and were superior to the unconstrained methods.
Positron emission tomography (PET) offers the ability to quantify biochemical features in living humans through the use of radiolabeled tracers and the application of tracer kinetics and compartmental analysis. This study evaluates kinetic analysis alternatives for characterizing the in vivo behavior of N-[11C]methylpiperidin-4-yl propionate ([11C]PMP) to yield quantitative estimates of the model parameter k3 as an index of regional acetylcholinesterase (AChE) activity in the human brain. Acetylcholine, the acetic acid ester of choline, is a neurotransmitter present in cholinergic synapses of the CNS. Acetylcholinesterase is an enzyme of the CNS (as well as muscles and red cells) that catalyzes the hydrolysis of acetylcholine to choline and acetic acid. A radiolabeled piperidinyl ester, [11C]PMP also is a substrate for AChE and is hydrolyzed to a hydrophilic product in both blood and brain. The hydrolyzed product does not cross the blood—brain barrier (BBB), and, therefore, the [11C]PMP that is hydrolyzed in the brain is irreversibly trapped, providing the capability to measure locally an index of AChE enzyme activity.
Previous work identified several potential PET tracers for quantification of AChE activity including N-[11C]methylpiperidin-4-yl acetate (MP4A or AMP), N-[11C]methylpiperidin-4-yl propionate (MP4P or PMP), and N-[11C]methylpiperidin-4-yl isobutyrate (MPIB or iBMP) Irie et al. (1994) conclude that [11C]MP4A (AMP) and [11C]MP4P (PMP) were the two most promising tracers of those tested and selected [11C]MP4A as the tracer to pursue for human studies (Iyo et al., 1997; Namba et al., 1998) because of its higher specificity for AChE relative to butyrylcholinesterase. However, along with its higher specificity for AChE, [11C]MP4A has a higher hydrolysis rate. In regions of high AChE activity such as the basal ganglia, this rapid rate of hydrolysis, combined with the high local concentration of AChE, causes such a rapid conversion of the substrate to the hydrolyzed product that the primary step limiting brain uptake of the radiotracer is the rate of transport into brain (Irie et al., 1994). Thus, tracer concentration in regions of high AChE activity are strongly dependent on flow and extraction (K1) and only minimally dependent on AChE activity. For this reason, we have pursued [11C]PMP (MP4P), a substrate with a slower rate of hydrolysis (by a factor of 3 to 4) than [11C]AMP (MP4A). This tracer allows more precise estimates of the AChE activity index in regions of moderate to high AChE concentration while providing only slightly lower specificity for AChE.
Here we present an evaluation of kinetic analysis approaches for the estimation of AChE activity from dynamic PET studies after injection of [11C]PMP. We have tested and compared four alternatives, each of which is based on a two-tissue compartment model with irreversible trapping of tracer in the second tissue compartment and each providing an estimate of the rate constant k3 as our index of AChE activity. Three approaches used standard nonlinear least-squares optimization in conjunction with the measured time courses of the concentration of authentic tracer in arterial plasma and tissue, whereas the final method (Frey et al., 1997a, b ) required no input function and estimated k3 from the shape of the time—activity curve alone. Of the three least-squares methods, one involved no parameter constraints, whereas two involved constraint of K1/k2.
Three groups of normal human volunteers were scanned with [11C]PMP. Subjects of the largest group were scanned a single time. Data from these studies were used to evaluate the precision of the various estimation techniques. The two smaller groups of subjects were scanned twice on the same day, with the data used to study parameter identifiability and potential biases of the different techniques. One group received scans with (1) eyes closed (control) and (2) eyes open watching a video (activation) to study identifiability of K1 and k3 effects, since transport but not hydrolysis was assumed to differ in the visual cortex between scans. The other group received one scan under baseline conditions and a second after a 1-hour constant infusion of physostigmine, a reversible AChE inhibitor. We compared the means and coefficients of variation (COV = SD/mean) to determine the precision in the parameter estimates for each approach. Computer simulation studies were performed in conjunction with the human studies to examine the magnitude of potential biases in the parameter estimates caused by various model assumptions. Computer simulations also were used to compare predicted precision of k3 estimates for various AChE activities to those actually observed in human subjects. A primary challenge in this work was to find an analysis method that can be applied to all brain regions when the parameter of interest, k3, varies by a factor of approximately 20 to 30 or more across the brain (Atack et al., 1986; Reinikainen et al., 1988).
THEORY
The compartmental model for [11C]PMP consists of a blood compartment representing authentic substrate in arterial plasma (Cp) and two tissue compartments representing authentic substrate in tissue (Cfree) and the trapped metabolic product of hydrolysis by AChE (Cm), respectively. This two-tissue compartment configuration has three rate parameters, K1 to k3, defined as follows:
where K1 and k2 represent the standard rate constants for transport across the BBB, f is mass specific blood flow (mL g−1 min−1), E0 is the single-pass extraction fraction of ligand across the BBB into brain, PS is the permeability surface area product (mL g−1 min−1), DVfree is the equilibrium distribution volume of authentic substrate in tissue (mL g−1), khyd′ is the effective rate of hydrolysis of PMP by AChE (mL pmol−1 min−1), and [AChE] is the concentration of AChE in tissue (pmol mL−1 or nmol/L). The model does not require a parameter k4, since hydrolysis by AChE is completely irreversible. Notice that DVfree is defined as K1/k2 and is the equilibrium distribution volume of authentic tracer (although equilibrium can never be reached unless k3 equals zero), not the steady-state distribution volume for an irreversibly trapped tracer, which is given by K1/(k2+k3). The parameter khyd′ is the effective rate of the combination of two serial processes, the binding of substrate to the site on the enzyme (along with possible dissociation of substrate from the enzyme binding site), and the actual hydrolysis rate of the substrate by the enzyme. The rate constant khyd′, then, is given by the familiar formula for the net rate of two serial processes where the second is irreversible: khyd′ = (kassockhyd)/(kdissoc+khyd). Since the actual rate of hydrolysis is much faster than the rates of association and dissociation of substrate with the enzyme binding site (Hucho et al., 1991), khyd/(kdissoc+khyd) ≈ 1, and the effective rate of hydrolysis likely is limited by the association rate (khyd′ ≈ kassoc), although this is not an assumption or a necessary condition of the model. The value of the model parameter k3 is a function of both the effective hydrolysis rate by AChE, which is substrate dependent, and the concentration of AChE in brain, which is brain region dependent. Thus, for a given substrate (i.e., [11C]PMP), the regional AChE activity is determined by the regional concentration of AChE. This theory assumes that there is no effect resulting from levels of endogenous acetylcholine. Although there is possibly some sensitivity to endogenous substrate levels through competitive inhibition, the magnitude of these effects is likely to be small. The time that acetylcholine spends at the enzyme binding site before being hydrolyzed is extremely short (Hucho et al., 1991), and both hydrolysis products clear rapidly from the binding site. Thus, AChE can be rendered inactive by acetylcholine only for a short time, in contrast to physostigmine, which does inhibit enzyme activity by covalently modifying the enzyme binding site and, thus, not clearing rapidly. Furthermore, in vivo rodent studies in our laboratory show that dilution of the specific activity by a factor of 104 has no effect on the rate of hydrolysis of labeled PMP in blood or brain.
For irreversible tracers, it is well documented that when the rate constant for the irreversible process k3 is much higher than the efflux rate constant k2, the net incorporation of tracer will be limited by BBB transport, and therefore, the ability to accurately estimate k3 is severely compromised (Koeppe 1990, 1996; Frey et al., 1992; Koeppe et al., 1996). Thus, if the physiologic or biochemical parameter being measured varies considerably across the brain, it is difficult to estimate the parameter accurately in all brain regions. Regions with low AChE activity can be quantified better using a labeled substrate with a relatively high hydrolysis rate, whereas regions with high AChE activity require a substrate with a lower hydrolysis rate.
The primary goal of this study was to determine how to provide the best possible index of AChE activity with a single tracer that is reliable across the entire brain. Results from Iyo et al. (1997) using [11C]MP4A (AMP) in addition to our own earlier studies (Kuhl et al., 1996, 1998; Koeppe et al., 1997a, b ) indicate that precision would be better in areas of lower AChE activity, whereas estimation in areas of higher activity would be more challenging. Since estimation of fewer parameters typically reduces uncertainty in the estimates of the remaining parameters, we explored the possibility of fixing or constraining the ratio of the transport parameters (K1/k2), a simplification commonly used in PET that assumes that the equilibrium distribution volume of authentic tracer is uniform across the brain. If the K1/k2 ratio is not constrained, the model may fail to differentiate the two tissue compartments kinetically, typically resulting in underestimation in both k2 and k3, since the model incorrectly “assigns” the radioactivity to the compartment representing authentic substrate rather than compartment representing hydrolyzed tracer. One possible confound of this approach is if the K1/k2 ratio is not uniform across the brain. However, the ratio of K1 to k2 (where k2 represents the clearance rate of tracer from the free compartment back across the BBB) is relatively constant across the brain for most all PET tracers studied. Additional evidence for K1/k2 uniformity for piperidinyl esters is given by the work of Irie et al. (1994) using N-[11C]methylpiperidin-4-yl isobutyrate (iBMP) and work in our laboratory using this and other longer chain piperidinyl esters, which have much lower affinities for AChE (Kilbourn et al., 1998). The regional accumulation of these tracers become progressively more uniform with decreasing hydrolysis rate. Since the tracer distribution is proportional to K1k3/(k2+k3), which becomes K1/k2 as k3 → 0, we conclude that K1/k2 for piperidinyl esters is relatively uniform across the brain.
An alternative simplification, outlined later, is to remove the uncertainty inherent to determination of the input function and estimate k3 entirely from the shape of the tissue time—activity curve. Although this approach has the advantage of requiring no arterial blood sampling or plasma metabolite analysis, the ability to estimate the BBB transport parameter K1 is forfeited.
METHODS
Positron emission tomography scanning
N-[11C]Methylpiperidin-4-yl propionate was synthesized as described by Snyder et al. (1998). Specific activity exceeded 1.5 × 10⁷ MBq mmol−1 in all cases. Three groups of normal volunteer subjects were studied. Group 1 consisted of 12 subjects ranging in age from 20 to 45 years. A single PET study was performed injecting 16 to 32 mCi (600 to 1200 MBq) of [11C]PMP. Data were acquired as a sequence of 17 PET scans (4 × 30 seconds, 3 × 1 minutes, 2 × 2.5 minutes, 2 × 5 minutes, 6 × 10 minutes) over a duration of 80 minutes on a Siemens/CTI ECAT EXACT-47 scanner (Siemens, Knoxville, TN, U.S.A.) after intravenous injection. Data were acquired in two-dimensional mode and reconstructed using a Hanning filter with 0.5 (cycles/projection ray) cutoff with no axial smoothing. Calculated attenuation correction was performed on all images.
Blood samples were withdrawn rapidly through a radial artery catheter for the first 2 minutes of the study and then at progressively longer intervals for the remainder of the session. Plasma was separated from red cells by centrifugation and counted in a NaI well-counter. The plasma radioactivity time course was corrected for radiolabeled metabolites using a rapid Sep-Pak C18 cartridge chromatographic technique similar to that previously reported for scopolamine and flumazenil (Frey et al., 1992, 1991). The samples at 30, 50, 70, 90, 120, and 150 seconds and all samples 3 minutes and later were analyzed for metabolites. Metabolite fractions of other samples were estimated by linear interpolation. Because of the relatively long scan duration, we used a method using radioactive fiducial markers to correct for any patient motion occurring throughout the study. Molecular sieve beads (1- to 2-mm diameter) were placed at three points on the patient s scalp before the study. Approximately 1 μL of the tracer preparation was pipetted onto each bead at a radioactivity of ~3 to 4 μCi per bead. After reconstruction of the dynamic PET sequence, the beads were defined on a single-base frame (frame 10, 10 to 15 minutes after injection). Details of the reorientation method are described in Koeppe et al. (1991).
A second study designed to test sensitivity of the kinetic estimation procedures to changes in CBF (and hence BBB transport of the tracer) consisted of six subjects, aged 21 to 44 years, who received two injections of 16 ± 1.6 mCi (600 ± 60 MBq) of [11C]PMP separated by 120 minutes. One scan was performed with eyes closed, whereas the other was performed with eyes open watching a movie video. The video presentation was started 5 minutes before injection and continued throughout the entire 60-minute scan. The order of scans was counterbalanced across the six subjects: three scanned first under the eyes-closed condition, and three scanned first under the eyes-open condition. Analysis of visual cortex, where k3 was expected to remain constant while K1 was increased, was performed to test the ability of the various estimation procedures to differentiate ‘ changes in flow from changes in AChE activity. The scanning protocol, except for injected dose, was identical to that described for group 1.
The third group was studied with a protocol designed as a compliment to the study involving group 2. This experiment tested the sensitivity of the kinetic estimation procedures to changes in AChE activity. This group consisted of five subjects, aged 24 to 40 years, who received two injections of 16 ± 1.6 mCi (600 ± 60 MBq) of [11C]PMP separated by 200 minutes. The first scan was acquired at baseline conditions. One hour after completion of the first scan, 1.5 mg of physostigmine in 100 mL was administered at a constant rate over the next 1 hour. Immediately after physostigmine administration, a second PET scan was performed. Again, the scanning protocol was identical to that described for group 1 except for injected dose.
Parameter estimation methods
In all four methods, the rate parameter k3 is assumed to be a direct index of AChE activity. Volumes of interest were created on frame 10 of the dynamic sequence and applied to all other frames generating time—activity curves for different brain structures. Regions analyzed included caudate nucleus, putamen, cerebellar hemispheres, brain stem (predominantly pons), thalamus, hippocampus, frontal cortex, parietal cortex, and primary visual cortex. Left and right hemisphere regions were analyzed separately (except for brain stem) then averaged within each subject before calculation of group means and SD. No significant hemispheric differences were observed.
Procedure 1. In procedure 1, K1, k2 and k3 were estimated without constraints using the metabolite corrected input function, all 80 minutes of the dynamic PET scan sequence, and nonlinear least-squares optimization (Bevington, 1969). The compartmental model also included a parameter reflecting cerebral blood volume, which was estimated independently for each region, and an additional parameter for the vascular time lag between brain and the arterial sampling site in the radial artery. This parameter was determined once for each patient from a single, large cortical region and then fixed to a constant value for all subsequent fits for that subject. This estimation procedure is referred to as the unconstrained least-squares estimate of k3. Estimates of K1 and DVfree (= K1/k2) also are reported.
Procedure 2. In procedure 2, K1 and k3 were estimated in an identical manner to that described from procedure 1, except that the parameter k2 was constrained so that the ratio of K1/k2 was held constant. Again, this constraint is based on the assumption that the tissue distribution volume of authentic tracer is uniform across the brain. The K1/k2 ratio was fixed to 4.0, the mean estimate across cortical regions of all subjects from the unconstrained fits of procedure 1. This estimate of the AChE activity index is referred to as the constrained least-squares estimate of k3, or k3c. Estimates of K1 also are reported.
Procedure 3. The approach to procedure 3 begins with the parameter estimates K1, k2, and k3 from procedure 1 but uses an alternative calculation for k3 based on the following concepts. Under ideal PET conditions, all three rate constants, K1, k2, and k3 would be fitted. As described earlier, the sensitivity to changes in individual rate constants, and hence our ability to accurately estimate them from the measured PET data, is dependent on their relative values. For [11C]PMP (see Results), the magnitude of k3 in areas of low AChE activity is optimal for providing precise parameter estimates not only of k3, but of k2 and hence DVfree (= K1/k2). However, in regions of high AChE activity, the value of k3 becomes too large relative to k2, and uptake becomes increasingly flow-limited. Whereas K1 continues to be estimated precisely, the estimates of k2 and k3 become extremely variable, yet remain highly correlated. If k3 is underestimated, then k2 is underestimated and, in fact, is underestimated by nearly the same fractional amount as k3. Since the K1 estimate remains stable, DVfree, being inversely related to k2, is overestimated by nearly the inverse of the underestimation in k3. This led us to propose an alternative calculation, k3*, which equals the unconstrained k3 multiplied by the unconstrained K1/k2 (all from procedure 1) divided by the fixed value for DVfree, which was used in procedure 2 (4.0 mL g−1).

This estimate of the AChE activity index is referred to as the constrained least-squares estimate of k3*. Estimates of K1 and DVfree are the same as those for procedure 1.
Procedure 4. The final method is considerably different than the first three with the k3 determination arising from the shape of the time—activity curve alone. The following conditions are required for this approach to be valid: (I) the concentration of authentic tracer in arterial plasma must reach zero during study period; and (2) the hydrolysis of the substrate PMP is completely irreversible. Under these assumptions, two further conditions hold: (I) at the start of the study, all radiotracer in brain is in the free compartment; and (2) by the end of the study, all radiotracer in the brain is in the metabolite compartment. This can be deduced because requirement 1 does not allow new radiotracer to enter the free tissue compartment from the blood after a certain time, and requirement 2 does not allow radiotracer to reenter the free tissue compartment from the metabolite compartment; thus, all radiotracer in the free compartment either clears back into the blood or is hydrolyzed by AChE. For each scan, the total tracer concentration in tissue (Ctot) is the sum of the free [11C]PMP (Cfree) plus the hydrolyzed [11C]-labeled metabolic product (Cm). The first PET frame of the sequence is assumed to be 100% free: Cfree(1) = Ctot(1); Cm(1) = 0. For all subsequent frames n, Cm(n) is assumed to equal k3Cfree(n − 1)Δt + Cm(n − 1), and thus Cfree(n) is given by Ctot(n) − Cm(n). In practice, the PET data are interpolated so that Δt is smaller than the PET scan durations. Only a single value of k3 will yield the results that Cm(final) = Ctot(final) and Cfree(final) = 0. This estimate of the AChE activity index is referred to as the unconstrained “no input” k3, or k3ni. Estimates of K1 and DVfree are not possible with this approach.
To better understand the relative performance of the four analysis procedures, different groupings can be made based on commonalties between approaches. These also relate to each procedure's sensitivity to various sources of error, and, thus, it is important to be clear as to which procedures are referred to when various issues are discussed later. The two primary groupings used are based on (1) the use of (i) input function with least-squares fitting versus (ii) no input function with shape analysis; and (2) the use of (i) a constraint in the free distribution volume in the estimation routines versus (ii) no DVfree constraint. Procedures 1, 2, and 3 all involve nonlinear least-squares fitting with standard compartmental analysis using a metabolite-corrected arterial plasma input function. Thus, “input function” or “least-squares” procedures always refers to procedures 1 through 3. No input, or “shape analysis,” refers only to procedure 4. Procedures 1 and 4 do not use constraints involving DVfree; thus, “unconstrained” procedures always refers to procedures 1 and 4, whereas “constrained” procedures refers to procedures 2 and 3.
RESULTS
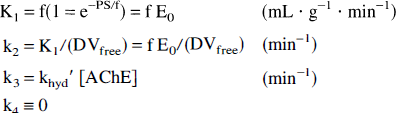
Figure 1 shows a typical arterial input function for [11C]PMP. Both total and metabolite-corrected plasma radioactivity are displayed. The authentic fraction had dropped to less than 50% by 2 minutes into the study, below 15% by 10 minutes, and to approximately 1% (although not accurately measured) by the end of the study. In addition, the total radioactivity in plasma has decreased by greater than a factor of 50 from peak to the end of the study, and thus the arterial peak-to-tail ratio typically is around 5000:1. This low level is sufficient to satisfy the zero input assumption required for shape analysis.
Arterial input function for N-[11C]methylpiperidin-4-yl propionate ([11C]PMP). Displayed are the total and the metabolite-corrected radioactivity concentration in plasma. By approximately 2 minutes, the authentic fraction has dropped to less than 50%, by 10 minutes to less than 15%, and by the end of the study to approximately 1%.
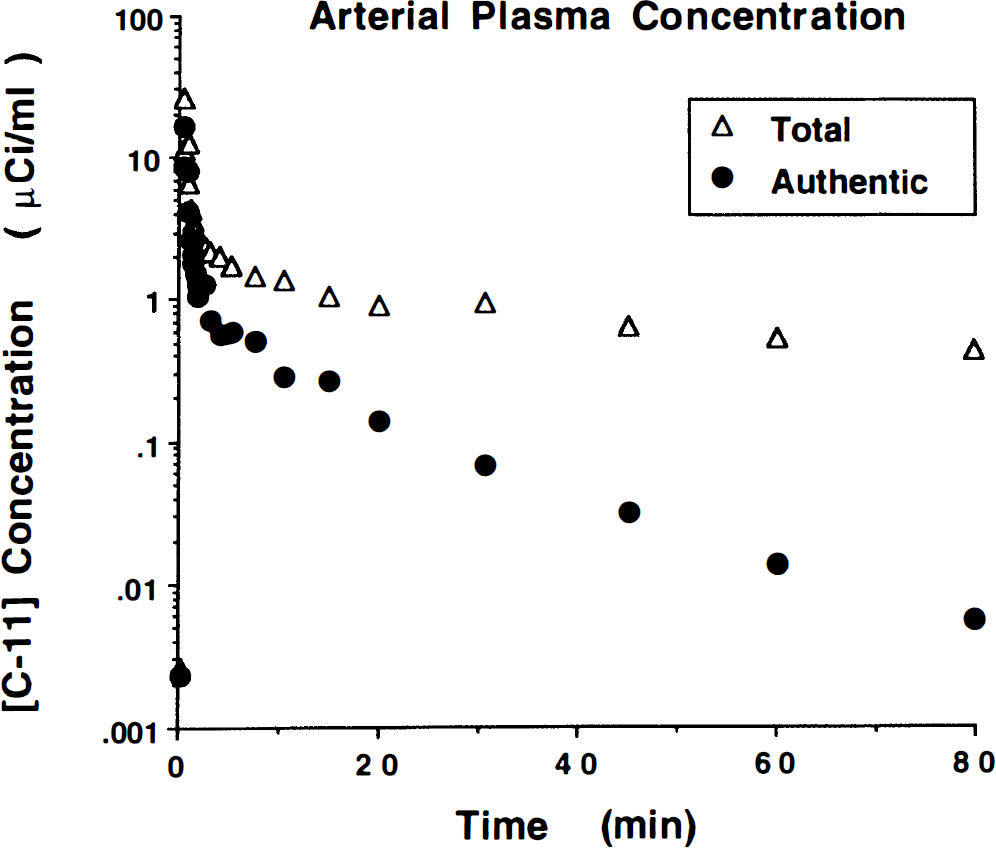
Brain radioactivity time courses and unconstrained nonlinear least-squares fits (procedure 1) for a typical [11C]PMP scan are shown in Fig. 2. By 40 minutes, the tissue curves become nearly constant. Since the input function has become negligible, this indicates that the free radioactivity in brain has cleared, leaving only hydrolyzed tracer, and demonstrates that hydrolysis by AChE is irreversible. The goodness of fit indicates that three rate parameters (K1, k2, and k3) are sufficient to describe the in vivo kinetics of [11C]PMP. Goodness-of-fit worsened slightly when constraining K1/k2 (to 4.0), however F tests indicate that this was not statistically significant for most fits.
Brain time—activity curves and nonlinear least-squares fits for [11C]PMP. After 40 minutes, the tissue curves are nearly constant, indicating that the input function has become negligible and that the free radioactivity in brain has cleared, leaving only hydrolyzed tracer, and that the reaction is irreversible (k4 = 0). The goodness of fit indicates that three rate parameters (K1 − k3) are sufficient to describe the in vivo kinetics of [11C]PMP.
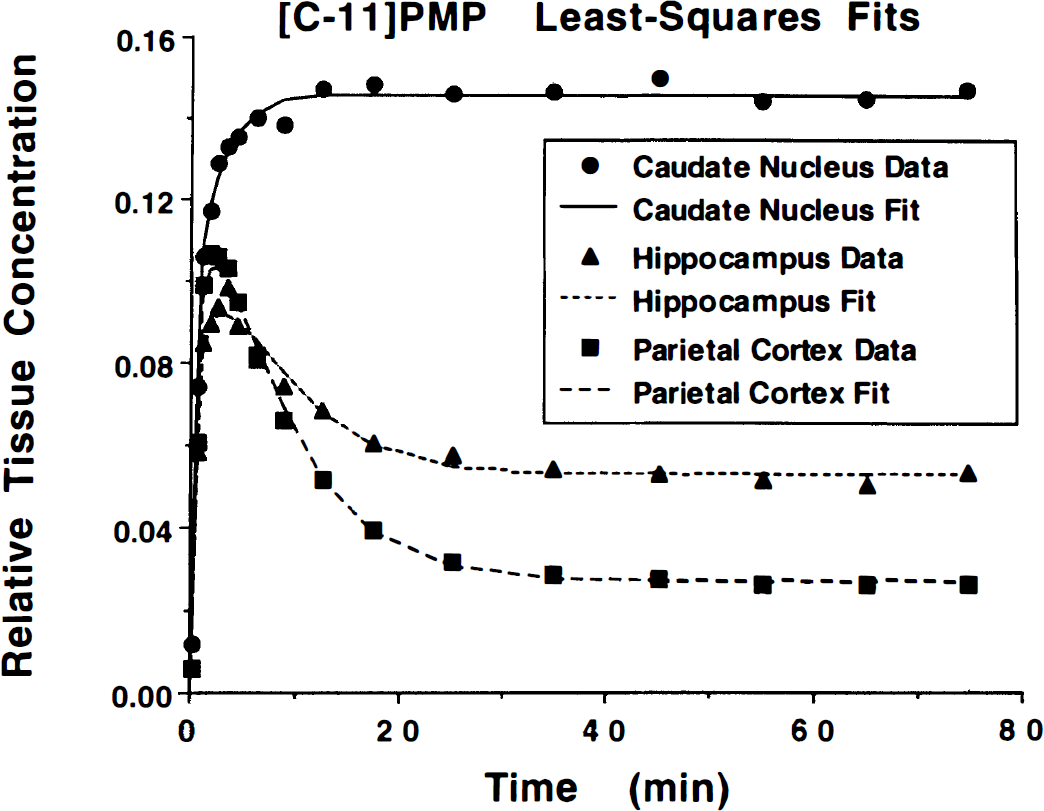
The COV from computer simulations for model parameters in regions with high, medium, and low AChE activities are shown in Fig. 3. These simulations account only for variability resulting from PET count uncertainties. In all cases, the input function was assumed to be known perfectly, in addition, DVfree, when constrained, was fixed to its correct value. Simulated “true” k3 values for striatum, thalamus, and cortex were 0.75, 0.10, and 0.025 min−1, respectively. The transport parameter, either with or without constraints, was estimated precisely in all regions, exhibiting only a slight loss of precision in areas with rapid hydrolysis rates. Estimates of k3 and DVfree show a high dependence on AChE activity. The constrained k3 and k3* results are similar, whereas the unconstrained and the no input k3 methods are similar and are predicted to perform considerably more poorly than the constrained methods. Notice that the rank order of the predicted performances of the four k3 measures stays the same across the full range of AChE activities. Figure 4 shows predicted biases in the parameter estimates when the assumptions used in the simulations for Fig. 3 are violated. Panel A shows biases from errors in the metabolite correction for the plasma input function. Simulated true authentic fractions at 2, 10, 30, 50, and 80 minutes were 55%, 15%, 5%, 2%, and 1 %, respectively. Data were fitted using an input function that was calculated using the correct plasma total radioactivity, but with a progressive overestimation of authentic fraction. The input function used for fitting assumed the authentic fractions at these same five time points to be 60%, 20%, 8%, 4%, and 2%, respectively. Overestimation of the arterial input function caused underestimation in k3. Underestimations in the input function of the same magnitude caused similar magnitude errors to those shown in Fig. 4A, but with the opposite sign. Notice that the constrained procedures, particularly k3*, have higher sensitivity to input function errors. The shape analysis method inherently has no bias at all, since it does not use an input function. Panel B shows biases in k3 fits for an incorrectly assumed value of DVfree. The simulated true value of DVfree was 4.0 mL g−1 but was assumed to be 4.4 in the fit. The two unconstrained procedures obviously have no bias caused by errors in assumed DVfree. The two different ways of applying the constraint cause similar errors. The error in k3* (procedure 3) is the opposite sign and the same magnitude as the error in DVfree. The k3C estimate using a fixed DVfree in the fit (procedure 2) causes an error of the opposite sign but at about one third less than the magnitude of the error in DVfree.
Coefficients of variation from fits to simulated data. Nonlinear least squares fits were performed on 1024 sets of simulated data using both unconstrained and constrained fits. Striatum, thalamus, and cortex refer to simulations where the “true” parameter values were set to typical values for these regions obtained in actual human studies. Calculation of k3 without input function also was performed. The four different k3 indices for AChE activity are grouped to the right in each set.
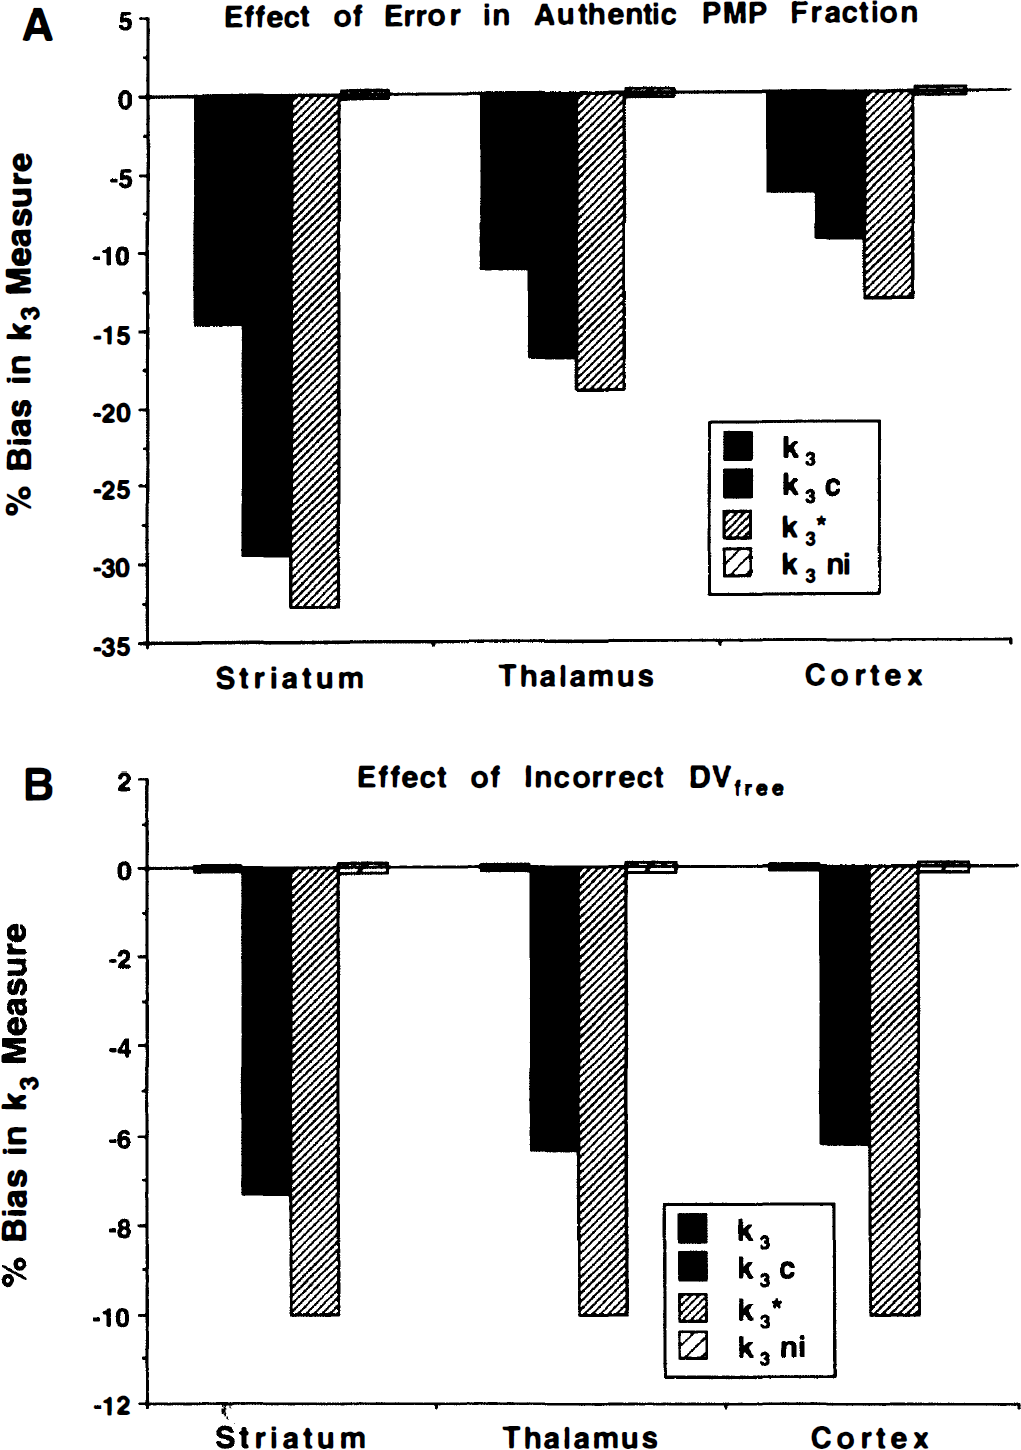
Simulated effects of methodologic errors in k3 estimates. Shown are biases caused by errors in the determination of the metabolite-corrected arterial input function
Means and SD of K1 and DVfree (K1/k2) estimates from the human studies for the nine brain regions are given in Fig. 5. Data were derived from the 12 subjects from group 1 plus the baseline scans from the 11 subjects from groups 2 and 3. As indicated by K1 values in gray matter structures in the range of 0.5 to 0.7 mL g−1 min−1, [11C]PMP is highly extracted. Results for the two methods for determining K1 are nearly identical in regions of low AChE activity, whereas the constrained method yields slightly higher K1 estimates in regions of high activity. Estimates of DVfree average close to 4 in the low-activity regions with coefficients of variation of only 10% to 12% in cortical regions. Estimates of DVfree become highly variable (COV 50% to 90%) and increase in magnitude as the ability to differentiate kinetically between free and hydrolyzed compartments is lost in regions with progressively higher k3 values.
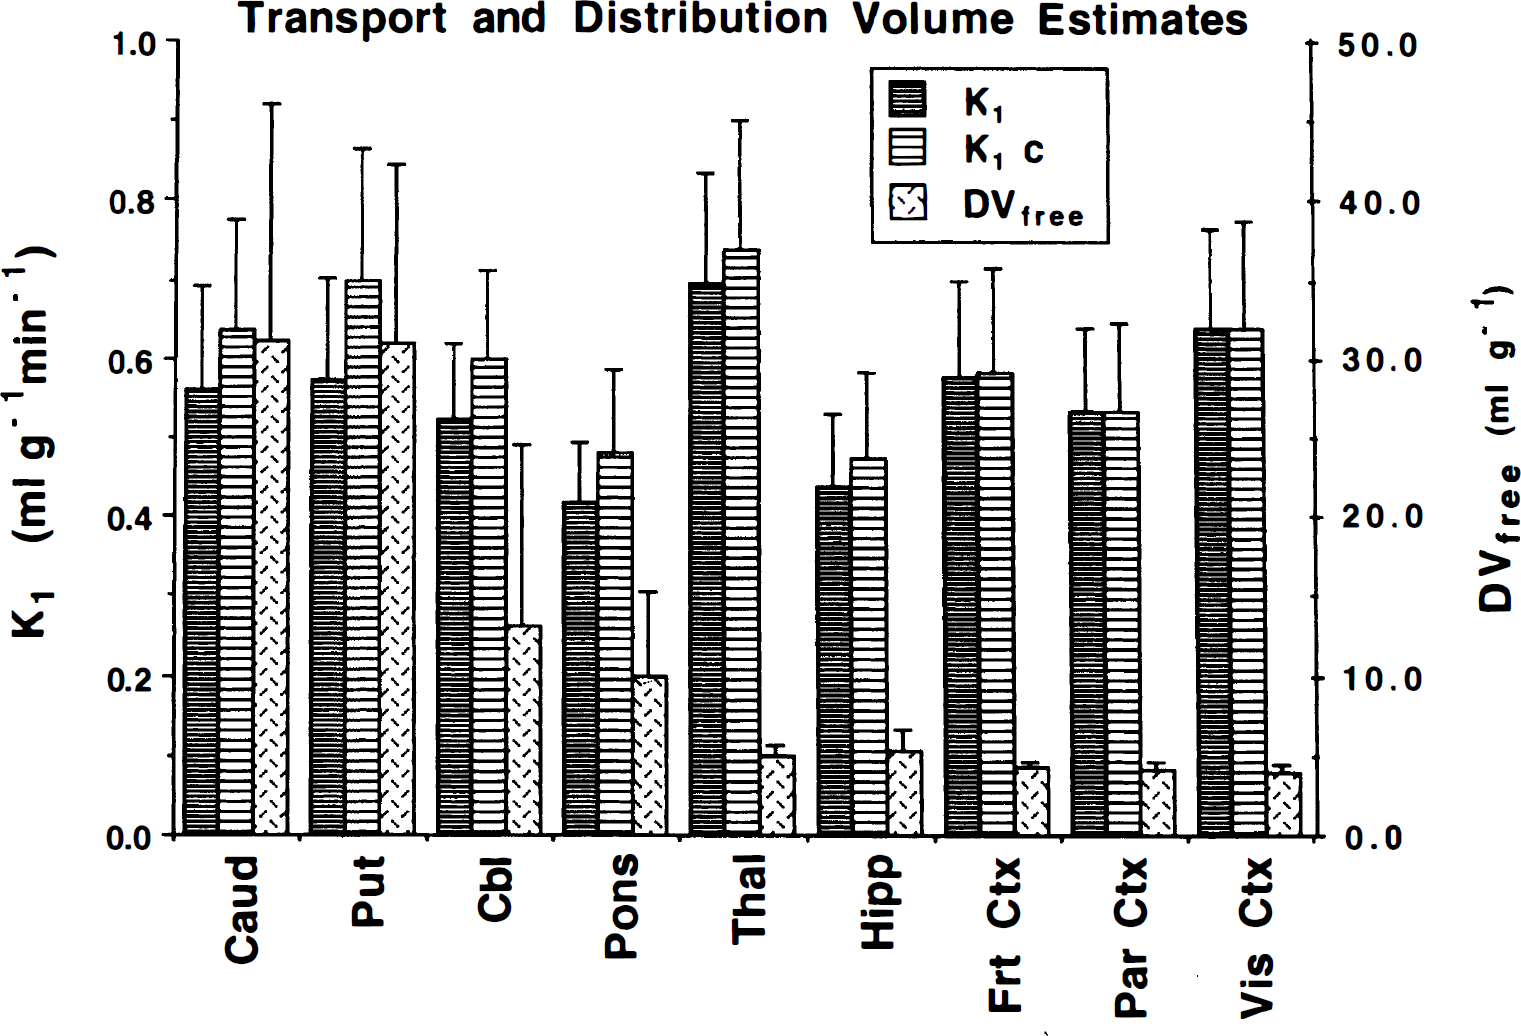
Mean and SD of transport rate constant and authentic PMP distribution volume estimates for normal controls. Data were derived from the 12 subjects from group 1 plus the baseline scans from the 11 subjects from groups 2 and 3. See methods for detailed explanations of k3 estimation procedures. The K1 and DVfree values are determined from procedure 1 (and also procedure 3). The K1c value is determined from procedure 2. Procedure 4 cannot be used to estimate either K1 or DVfree. Caud, caudate nucleus; Put, putamen; Cbl, cerebellar hemispheres; Pons, brain stem (predominately pons); Thai, thalamus; Hipp, hippocampus; Frt Ctx, frontal cortex; Par Ctx, parietal cortex; Vis Ctx, primary visual cortex.
Figure 6 shows means and SD of k3 estimates from the baseline scans (n = 23) for each of the four estimation procedures. Results are given in two panels to display better the full dynamic range of AChE activities across the brain. The higher activity regions are shown in panel A (upper) and the lower activity regions in panel B (lower). The thalamus is shown in both panels for easier comparison between panels. Coefficients of variations for these estimates are shown in Fig. 7. Estimates in the lowest activity regions were most precise and were similar across procedures. The COV in cortex averaged around 10%. As the AChE activity increases, two main features become readily apparent. First, estimates for all procedures become considerably less precise with COV increasing to 40% or greater, and second, a consistent difference between procedures emerges with increasing k3. The unconstrained procedures yielded estimates far lower than the constrained procedures, and between the two constrained estimates, k3* was consistently greater than k3c. The dynamic range of the unconstrained methods from basal ganglia to cortex was only between 4 and 6 to 1, whereas the constrained methods range between 15 and 20 to 1, much closer to the reported range of AChE activity in human brain (Atack et al., 1986; Reinikainen et al., 1988).
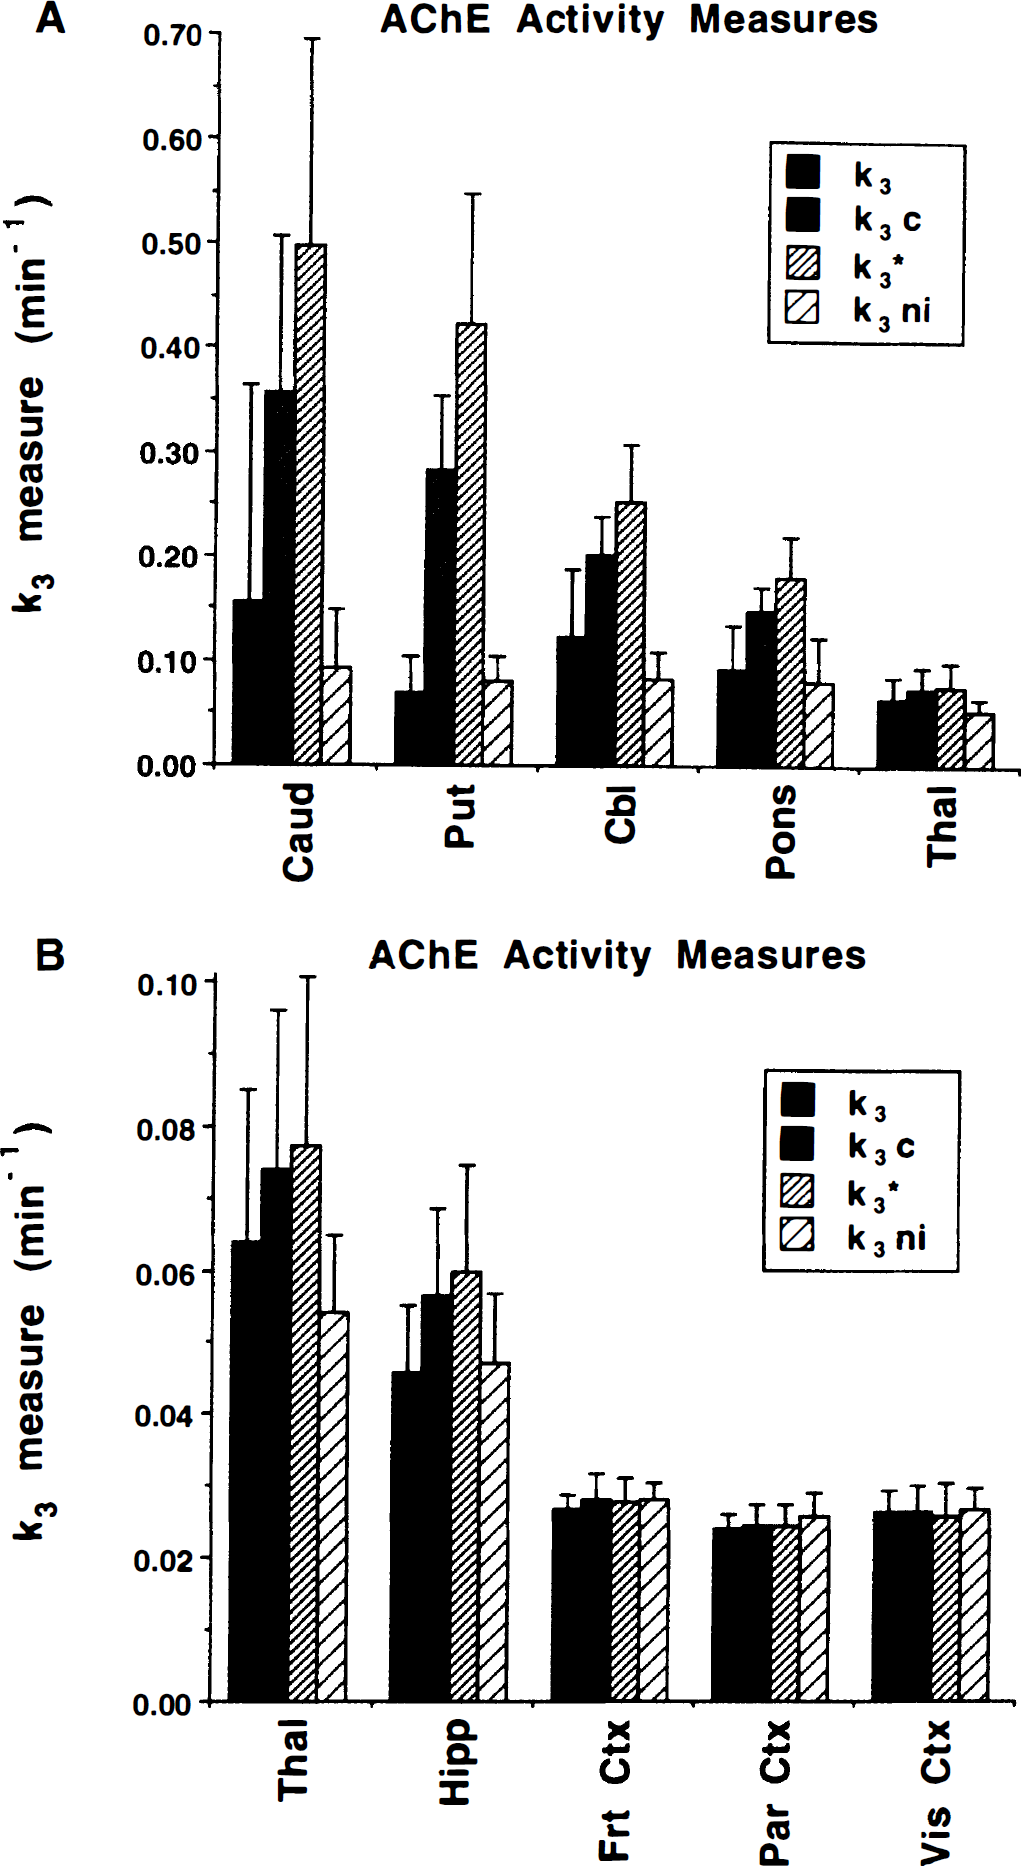
Mean and SD of hydrolysis rate constant estimates for normal controls (n = 23). Data were derived from the 12 subjects of group 1 plus the baseline scans from the 11 subjects of groups 2 and 3. Estimates of k3 from all four procedures are presented. Panel
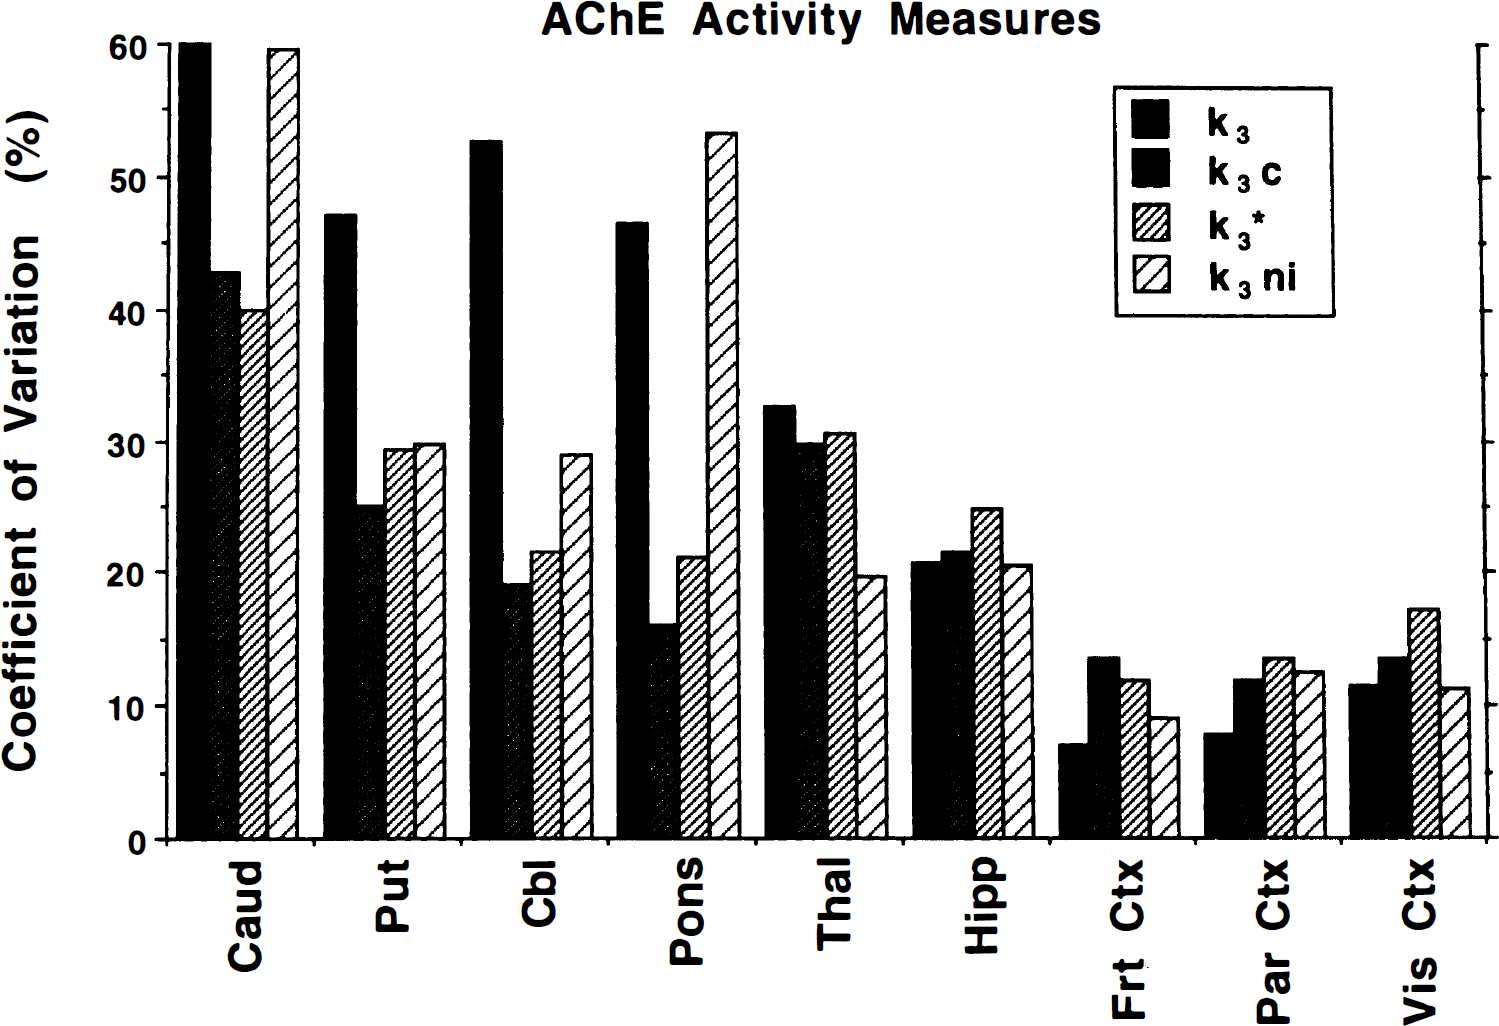
Coefficients of variation for normal controls (n = 23). Data were derived from the 12 subjects of group 1 plus the baseline scans from the 11 subjects of groups 2 and 3. Estimation procedures and regions are the same as those shown in Fig. 5.
The coefficients of variation shown in Fig. 7 demonstrate another interesting result. The unconstrained methods yielded lower COV than the constrained methods in the low activity regions, opposite of that predicted by the simulations shown in Fig. 3. For k3 values as high or higher than those found in the pons, however, the uncertainty in the unconstrained methods exceeded that of the constrained methods, consistent with that predicted by the simulations.
Results from the visual stimulation challenge study (n = 6) are reported in Fig. 8. Shown are means and SD of the ratio of the parameter values from the stimulation scan divided by that from the baseline scan for K1 (panel A) and k3 (panel B). Changes were statistically significant only in visual cortex (paired t test, P = 0.00019 for both unconstrained and constrained K1 estimates), which exhibited ~40% increase in K1. No other regions were significantly changed, although parietal cortex was ~10% higher in the stimulation scan. When normalizing (to global mean) to reduce variance, still only the visual cortex remained significant, although parietal cortex for K1c did reach P = 0.052 uncorrected for multiple comparisons. Panel B shows results for the k3 estimates. The primary effect of a large K1 increase in the occipital cortex from visual stimulation is not seen in these results. Cortical values averaged across subjects ranged from 2% lower to 9% higher in the stimulation studies. Significant increases (paired t test, n = 6) at P < 0.05 were detected in frontal and parietal cortex only for the unconstrained k3 estimate, and a significant decrease was detected in hippocampus only for k3ni. However, none of these remained significant after correction for multiple comparisons. In areas of high AChE activity, ratios for the unconstrained methods deviated greatly from unity; however, the COV in these regions is extremely high, with scan ratios for individual subjects in basal ganglia ranging from as low as 0.5 to greater than 4.0. Notice that the ratios from constrained fits, although more variable than in cortex, remained near unity in all regions.
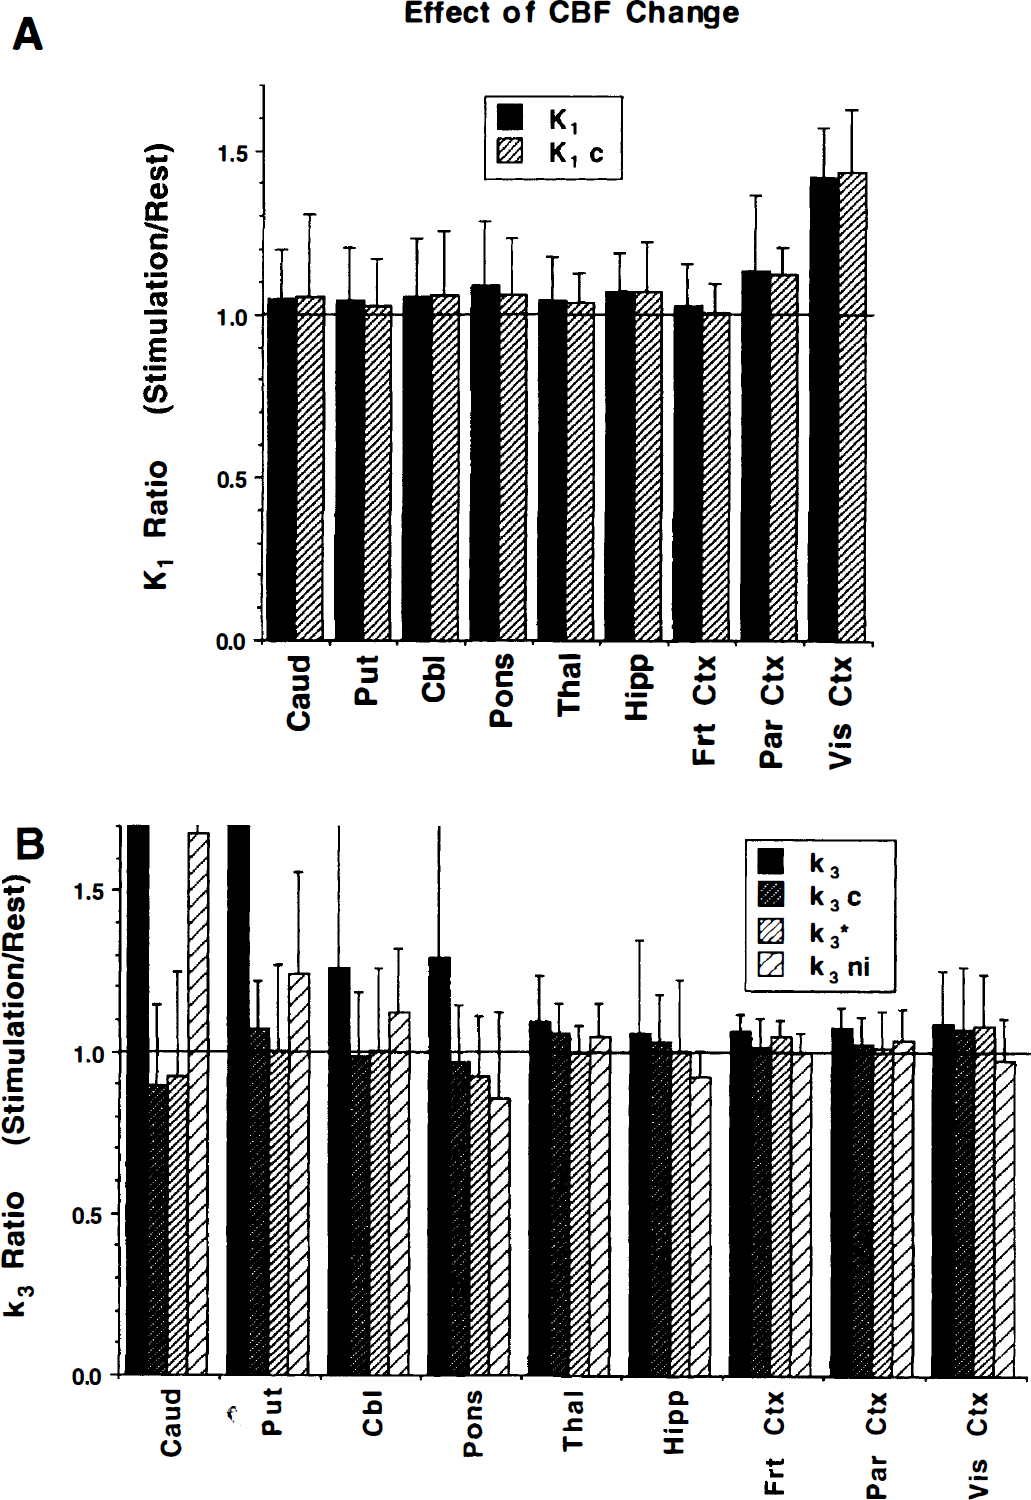
Ratio of parameter estimates for visual stimulation relative to baseline studies. Reported are means and SD across the six subjects from study 2. It was assumed that the visual stimulation caused increased flow in the primary and associate visual cortex. Panel
The visual challenge study also can be used to estimate within-subject variability for [11C]PMP scans, although with n = 6 the reliability of the results is limited. Consistent with intersubject variability, regions with low AChE activity have much less intrasubject variability than regions with high activity. In cortex (excluding visual), the absolute difference between scans reported as a percentage of the mean of the two scans averaged across the six subjects was 6.7%, 7.0%, 7.2%, and 5.8% for k3, k3c, k3*, and k3ni, respectively. This compares with the corresponding intersubject COV of 7.4%, 12.6%, 12.5%, and 10.7%. The average within-subject variability increased with greater AChE activity, reaching 56% for k3 and 27% for k3ni, but only 17% and 20% for k3c and k3*, respectively in the basal ganglia. Across all regions and methods, intrasubject variability averaged about 30% lower than intersubject variability.
Results from the physostigmine challenge study are reported in Fig. 9. Whereas five subjects were studied, one subject's data from the physostigmine challenge scan was compromised because of the subject's feeling nauseous, which required removal from the scanner for about 5 minutes during the time of peak uptake. Although the least-squares calculations still were possible, k3ni could not be determined because of loss of data critical to the no input approach. Shown are means and SD of the ratio of the k3 values from the scan after physostigmine administration divided by those from the baseline scan. Following the typical pattern of results shown in the preceding figures, all four procedures yielded stable results in regions with low AChE activity (35% to 50% inhibition from the 1.5-mg dose) but progressively more variable results, particularly for the unconstrained procedures, in areas of high AChE activity. However, unlike other results, consistent differences occurred between procedures even in areas of low activity. The inhibition effects as estimated by k3ni were consistently smaller than those from the unconstrained k3 (P = 0.0042) for all cortical regions, which in turn were consistently smaller than those from either k3c (P = 0.0007) or k3*(P = 0.0002). The inhibition effect, as estimated by k3*, generally was greater than that by k3c (P = 0.016), although these two procedures yielded the most consistent results.
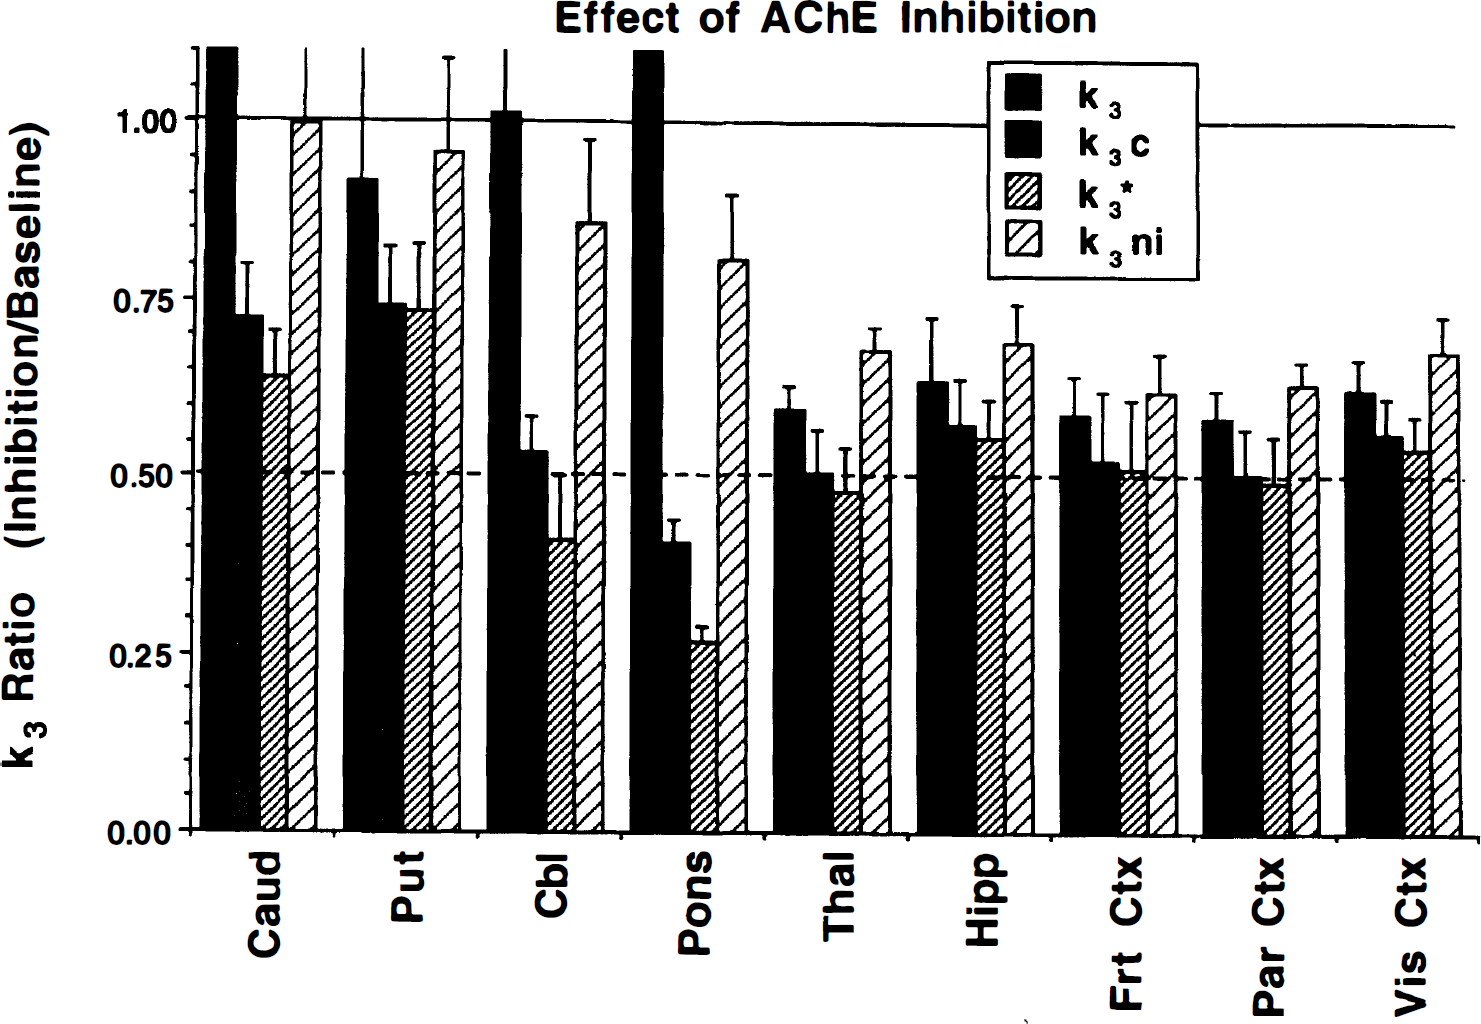
Ratio of k3 for physostigmine challenge relative to baseline scans from study 3 (n = 5) for each of the four estimation procedures. Given are the means and across subject SD. The solid horizontal line at 1.0 represents no inhibition, whereas the dashed horizontal line represents 50% inhibition. Inhibition of AChE by physostigmine was observed in all regions. In regions of low AChE activity, the unconstrained and no input function procedures yielded lower estimates of AChE inhibition by physostigmine. In regions of high AChE activity, only the two constrained procedures (k3c and k3*) yielded acceptable results.
DISCUSSION
N-[11C]methylpiperidin-4-yl propionate falls into the category of irreversible PET radiotracers. Such tracers generally are analyzed with a kinetic model configuration consisting of two tissue compartments, one representing authentic or free radiotracer, and a second representing metabolized or trapped radiotracer. An irreversible radiotracer must have a good match between the rate of trapping (k3; hydrolysis by AChE for [11C]PMP) and the rate of BBB transport (K1 and k2). If the k3/k2 ratio is too low, the fraction of tracer trapped is not a large enough, and the signal is poor. However, if k3/k2 is too high, the uptake or trapping of radiotracer is limited by delivery to the tissue, and the sensitivity to changes in k3 is low. The range of useful k3/k2 ratios is slightly greater than a single order of magnitude, with the optimal ratio for PET studies typically being from about 0.1 to 0.3. Values of k3 either greater than k2 or less than 0.05 times k2 are likely to yield poor results (Koeppe 1991; Koeppe et al., 1996). Thus, when there is a large range of irreversible trapping rates between brain regions, such as the 20- to 30-fold or greater differences in AChE hydrolysis rate between basal ganglia and cortex (Atack et al., 1986; Reinikainen et al., 1988), it is difficult to obtain accurate measures of k3 in all regions with a single tracer. The value for [11C]PMP comes close to matching the needed range, with k3 values varying from 0.025 min−1 in cortex to about 0.5 in basal ganglia. With k2 values of about 0.15 min−1, k3/k2 ranges from about 0.15 to 3.3; thus, values in the striatum fall outside of the optimal range. Using this range as a guideline, we predicted a more precise estimation of k3 in lower activity regions, such as cortex, than in high activity regions, such as basal ganglia. A review of the literature would likely reveal that more “irreversible” PET radiotracers have been suboptimal because the irreversible rate of trapping was too rapid rather than too slow.
Figures 1 and 2 demonstrate several of the properties of [11C]PMP that make it an excellent PET radiotracer. The time—activity curves shown in Fig. 2 demonstrate the irreversibility of hydrolysis by AChE, as indicated by the constant phase after about 40 minutes after injection. Notice that there is substantial clearance of radiotracer before the constant phase in the lower activity regions, an indication that uptake is not delivery limited and that kinetic analysis is feasible. A key additional reason for the success of [11C]PMP is the shape of the arterial plasma input function. Figure 1 shows that rapid clearance plus rapid hydrolysis of radiotracer in blood causes the input function to be more “bolus-like” than for most PET radiotracers. The tail of the curve is very low, indicating little recirculating radiotracer. Since dynamic PET measures correspond to the input function convolved with the tissue response function and the goal is to determine the tissue response function (as described by K1 − k3), convolution with an input function shaped closer to a delta function means that the PET measure itself more closely resembles the tissue response function [f(t) ⊕ δ = f(t)]. Thus, the rapid metabolism of the [11C]PMP in blood translates to more accurate estimation of the model parameters.
Computer simulation studies were used to examine both the precision of parameter estimates and two potential sources of bias. The effects of statistical uncertainty in the dynamic PET measurements depicted in Fig. 3 illustrate several points. First, the ratio of the hydrolysis rate parameter to the transport parameters strongly affects the precision of the estimates of k2 and k3, but not K1. Variability in K1 from statistical uncertainty never exceeded 8%. Variability in k3 and k2 (which is reflected in DV) from statistical uncertainty was low (>5%) in “cortex” where k3/k2 was 0.167, increased to 10% to 15% for “thalamus” where k3/k2 was 0.67, and jumped to 30% or greater for “striatum” where k3/k2 was 5.0. A second important feature is the relative sensitivity to statistical uncertainty of the four estimation procedures. The two constrained estimates performed similarly and considerably better than the unconstrained procedures, as expected, since the constrained fitting used the “correct” value of DVfree. Of the unconstrained methods, the k3 procedures yielded better results than the no input procedure, but again, this is expected, since the least-squares fitting used the correct input function. Thus, considering statistical uncertainty alone, constrained procedures provide superior measures of the AChE activity index than do unconstrained procedures.
The overall accuracy of the k3 estimates depends on the magnitude of the errors from a variety of sources that propagate into the parameter estimates, including the two mentioned earlier. Figure 4A clearly shows that errors resulting from an incorrectly determined input function are more serious for the constrained estimates k3c and k3* than for the unconstrained k3. Since the simulated “incorrect” input function used for fitting was higher at all points than the true input, there was a “scale” component to input function error. However, the overestimation was proportionally higher at the end of the study, and thus there also was a distinct “shape” error in the input function. Estimates of k3 are entirely independent of the scale of the input function; thus, the biases shown in Fig. 4 reflect errors only in input function shape, whereas estimates of k3c and k3* are affected by both shape and scale errors, and thus the overall bias is larger. Of course, k3ni is unaffected by errors of any type in the input function, thus demonstrating an advantage of this procedure. Figure 4B clearly shows the bias encountered by incorrect assumption of DVfree. Errors in DVfree do not affect either of the two unconstrained procedures. The error in k3* is inversely proportional to the error in the assumed DVfree. The magnitude of the error in k3c is about two thirds that of k3*.
Although the statistical uncertainty in PET data can be modeled accurately, it is not as easy to predict the magnitude of the various biases. For example, it is unknown how large the errors in the measured input function or in the assumed DVfree values are on a case-by-case basis. Thus, the overall accuracy is not known for any individual study. When examining the coefficient of variation across a group of subjects for a given parameter, there are three primary sources of variability: (1) statistical imprecision, (2) methodologic bias and error, and (3) true intersubject biological variability. The goal is to reduce the first two sources as much as possible by optimizing data acquisition and analysis. Since the underlying biological variability is the same no matter which analysis method is applied, the differences in COV can help to determine which procedure should be used.
The performance of the four procedures when applied to actual human data is examined best in Figs. 5 through 7. Results from the subjects of group 1 and the baseline scans from subjects of groups 2 and 3 (n = 23) demonstrate the utility of [11C]PMP for assessing AChE activity in the human brain. Transport rate and distribution volume estimates in the human studies are consistent with the simulations shown in Fig. 3. Uncertainties in K1 are almost constant across regions and are nearly identical for constrained and unconstrained fits. Coefficients of variation in K1 averaged just over 20% across the various brain regions. These uncertainties are higher than observed with many PET tracers, where 15% variability is more typical. The increased uncertainty in K1 with [11C]PMP likely results from the rapid hydrolysis by AChE in plasma. The authentic fraction of [11C]PMP during the key uptake phase already has dropped substantially, whereas the authentic fraction for most tracers remains near 100% during the first few minutes.
Estimates of DVfree are stable in regions with lower AChE activity but are overestimated in high-activity regions. This comes from the inability to differentiate kinetically the two tissue compartments when k3 is high. However, rather than estimates merely being more variable (lower precision), most fits in basal ganglia, and to a lesser extent cerebellum and brain stem, resulted in underestimations (substantial bias) in both k2 and k3. This is seen in DVfree estimates increasing from about 4 mL g−1 in cortex to around 30 in basal ganglia, although we believe that the DVfree values in basal ganglia remain closer to 4. Unconstrained estimates of k3 in higher activity regions (solid bars, Fig. 6A) confirm that as AChE activity increases, the predicted k3 values remain constant whereas the increase in trapped radioactivity in these regions is accounted for, instead, by an apparent increase in DVfree. The no input procedure has the same problem as the unconstrained k3 estimation, resulting in severe underestimation of k3ni in regions of high AChE activity. All four procedures perform progressively more poorly as AChE activity increases (Figs. 6A versus 6B and Fig. 7); however, the rate of progression is worse for the unconstrained procedures. Therefore, we conclude that some form of model constraint is essential for estimation of k3 in regions of high AChE activity.
The k3/k2 ratio is much closer to optimal in cortex (~0.15) than it is in basal ganglia (~3). This is borne out by the variability in k3 shown in Figs. 6 and 7. The COV for estimates of absolute k3 across the group of 23 subjects is ~10% in cortex. These results are far better than those of most PET tracers. Three characteristics of PMP contribute significantly to this high level of precision: (1) the tracer is completely, not just “nearly,” irreversible; (2) the input function approaches zero around by 40 minutes into the study (i.e., is more bolus-like); and (3) the k3/k2 ratio is near to optimal from a parameter identifiability perspective.
On closer examination of Fig. 7, it can be seen that the rank order of the COV for the four procedures is different than that predicted by the simulations shown in Fig. 3. A surprising and atypical finding was that the COV are lower with the unconstrained and no input function procedures than the constrained procedures. The COV in frontal and parietal cortex for k3 were slightly less than 7% and 8%, respectively, whereas COV for k3ni were 9% and 12%, respectively, for the same regions. These are extremely precise for a kinetic PET parameter, particular one other than K1, CMRglc, or a slope estimate from a graphical method. When applying either form of the DVfree constraint, COV increased from less than 10% for k3 and k3ni to 13% to 14% in k3c and k3*, which are still highly precise PET measures, but a 40% to 60% increase compared with the unconstrained k3. We conclude from these results that the statistical component of the total error in the parameter estimate in cortex for [11C]PMP is small for the reasons given in the preceding paragraph. The larger COV for the constrained methods result from errors like those simulated in Fig. 4. Both k3 and k3ni estimates are based on shape determinations alone. These estimates are completely unaffected by the scale of the PET and by the input function data. The unconstrained least-squares determination is determined entirely by the relative shapes (and temporal offset) of the input function and the brain radioactivity curves. The no input function method does not even depend on input function shape, but only on the shape of the tissue curve. Thus, errors in scanner or well-counter calibration do not affect the results. Furthermore, effects from partial volume, atrophy, or precise positioning of the volumes of interest used to define the time—activity curves have almost no effect on the results of the unconstrained methods. Errors in the metabolite corrections may affect the unconstrained least-squares estimates by causing shape changes in the input function but have no effect on k3ni. Such effects as calibration errors, partial volume, atrophy, and volume of interest placement do, however, cause increased variability in the constrained k3c and k3* estimates. As shown in Fig. 4, seemingly small errors in the metabolite correction can cause significant errors in the fitted parameters. Since the magnitude and sign of the error in the measured input function, or in the estimate of DVfree or in some other source of bias that differs from subject to subject, the across-subject COV of the constrained procedures exceed those of the unconstrained procedures.
This preceding discussion applies only to cortical regions. As regional AChE activity increases, the relative contribution of statistical uncertainty to the total error in the k3 becomes progressively greater. In other words, the degradation in precision caused by delivery-limitation effects with increasing k3 occurs more rapidly than the increase in errors caused by other methodologic considerations. This can be seen in Fig. 7, where the COV that are higher in the constrained methods in the cortical regions become nearly equal across the four procedures for hippocampus and thalamus, and become considerably higher for the unconstrained methods in cerebellar, brain stem, and basal ganglia.
Thus, we believe that in regions of low AChE activity where [11C]PMP offers greatest sensitivity, uncertainty caused by statistical noise is low, and the greatest contribution to intersubject variability (besides possibly true biological variability) comes from scale differences and related methodologic variables. Therefore, although all methods perform well, unconstrained procedures offer better precision because of their intrinsic “shape-sensitive” and “scale-insensitive” properties. However, as AChE activities become higher, hence k3 values are larger, uncertainty from propagation of statistical noise quickly becomes the major source of variability both within and across subjects. In these regions, the constrained procedures not only are superior to unconstrained procedures, but their use becomes essential.
Results from the studies on subject groups 2 and 3 demonstrate the validity of using [11C]PMP as a marker of AChE activity. These studies clearly demonstrate the ability to distinguish changes in [11C]PMP uptake that are caused by flow (tracer delivery) from those that are caused by differences in enzyme concentration or activity. The visual stimulation study demonstrates that changes in K1 caused by visual stimulation are easily detected (~40% increase in primary visual cortex; Fig. 8A), whereas estimates of k3 were nearly unchanged. None of the approaches for estimating k3 were influenced significantly by changes in tracer delivery. This particular result, however, may not necessarily be extrapolated to areas of high AChE activity, since CBF changes occurred only in visual cortex. Distinguishing changes caused by flow from those caused by enzyme activity in regions with higher AChE levels may be more problematic because the net incorporation of [11C]PMP in the high-activity regions is partially flow limited. The physostigmine challenge study (subject group 3) demonstrates that [11C]PMP does provide a sensitive index to AChE activity, since estimates were shown to drop 40% to 50% after a dose of the AChE inhibitor physostigmine selected to inhibit approximately 50% of the enzyme activity (Somani et al., 1987; Asthana et al., 1995).
Other tracers have been proposed for quantification of AChE activity. Closely related is the compound [11C]MP4A (or [11C]AMP) developed by Irie and colleagues (Irie et al, 1996; Iyo et al., 1997; Namba et al., 1998). The compounds [11C]AMP and [11C]PMP are similar, both being substrates for AChE; however, they have different rates of hydrolysis. The product of the hydrolysis rate of AChE for a given tracer multiplied by the concentration of AChE in tissue determines not only the magnitude of k3, but how precisely it can be estimated. Since the range of AChE activity varies by a factor of 20 to 30 or more across the human brain, estimating AChE activities over this entire spectrum is difficult to accomplish with a single tracer. If a particular tracer provides optimal estimates in regions of low AChE activity (such as cortex) then, because of flow/delivery limitation effects, there will be difficulty in estimating k3 in regions of high activity (such as the basal ganglia). Hydrolysis rates are relatively high for both tracers and, therefore, better suited for assessing AChE activity in cortex than in basal ganglia. However, the relative hydrolysis rate of [11C]PMP is lower by a factor of approximately 3 to 4 than that of [11C]AMP. For estimation of k3 in cortex, [11C]AMP is at the moderate to high end of the optimal range and thus yields imprecise measures in any region with higher AChE concentration. Estimates are moderate in the thalamus but poor to indeterminate in regions such as the cerebellum or basal ganglia. However, [11C]PMP is at the middle to lower end of the optimal range for quantifying k3 in the cortex, and thus, with its slower hydrolysis rate compared with [11C]AMP, yields more precise k3 estimates in brain regions with higher activity. Estimates in the hippocampus and thalamus still are good, estimates in brain stem and cerebellum are moderate, and estimates in the basal ganglia, although certainly poorer than those in the cortex, are acceptable. Thus, the inherent kinetic properties of [11C]PMP are superior to those of [11C]AMP. One potential advantage of [11C]AMP over [11C]PMP is a higher specificity for AChE relative to butyrylcholinesterinase, although precise in vivo enzyme specificities of these two radiotracers have not been firmly established.
Use of radiolabeled piperidinyl esters is not the only approach to PET imaging of AChE in the human brain. [11C]Physostigmine also has been proposed for in vivo imaging of human AChE activity (Tavitian et al., 1993; Papatta et al., 1996). Physostigmine, however, is not simply a substrate for AChE but also is a reversible suicide inhibitor. The time course for brain radioactivity distribution after [11C]physostigmine injection is dependent not only on the affinity of physostigmine for AChE, the concentration of enzyme, and the reaction rate at the active site, but also on the rate of decarbamylation, with eventual formation of [11C]methylcarbamic acid and further conversion to [11C]CO2, which readily crosses the BBB. The rate of this latter clearance is independent of AChE concentration and hydrolysis rate. Thus, this tracer is not likely to produce a stable index of AChE activity, since kinetic modeling of the tracer would be difficult, and the radioactivity pattern late in the study reflects several factors other than enzyme number or activity. These problems with [11C]physostigmine are exemplified by the maximum putamen-to-cortex radioactivity ratio of only 2.0, when the actual enzyme activity difference is far greater.
SUMMARY AND CONCLUSIONS
This study examines distinctly different approaches for quantifying an index of AChE activity with N-[11C]methylpiperidin-4-yl propionate and PET: first, standard nonlinear least-squares kinetic modeling, estimating rate parameters from measured input functions and a dynamic sequence of PET scans with and without constraints on the free volume of distribution; and second, a shape analysis requiring neither an input function nor a reference region assumed devoid of AChE activity.
We have found that [11C]PMP PET studies provide an extremely precise index of AChE activity in brain regions with low AChE concentration (i.e., cortex) using any of the analysis alternatives. In fact, no other tracer produces estimates of a rate constant for irreversible trapping (i.e., k3) with such a high level of precision. We conclude that this results from three specific properties of PMP: rapid conversion of authentic tracer in plasma resulting in a more delta function—like input function with little recirculation; a near optimal ratio of trapping to clearance rates; and total irreversibility of the trapping process.
It is difficult to state definitively which analysis method should be applied under all circumstances. Least-squares approaches, in general, are more versatile. They offer the possibility of using constraints during the fitting procedure, and they provide estimates of both BBB transport and the distribution volume of free tracer in tissue in addition to the rate of hydrolysis. On the other hand, a practical advantage of the no input method is that it does not require acquisition and processing of blood samples, and furthermore, errors in determination of the input function can propagate additional uncertainty into the parameter estimates of the least-squares approaches. Aside from these two considerations, the four methods are best evaluated based on whether a DVfree constraint is used.
Unconstrained methods (k3 and k3ni) are completely independent of scale errors in either the PET or the arterial plasma data. Thus, partial volume effects, atrophy, calibration errors, and mispositioning of volumes of interest have only minor effects on these estimates. Errors of this type do, however, propagate into estimates when using either of the constrained methods (k3c or k3*). Thus, although variability from statistical noise is lower when using constraints, we found the across-subjects variance in cortical k3 estimates to be lower than that for the methods without constraints. We conclude that in areas of low AChE activity, variability is dominated by a combination of true biological variability and methodologic errors, whereas the component caused by statistical uncertainty is low.
Estimates of AChE activity index are poorer in regions of high activity (i.e., basal ganglia, cerebellum). The unconstrained approaches fail badly in these regions because of excessive bias and variability caused by delivery-limitation effects and, thus, should not be used. Constraint of the free distribution volume was determined to be essential in these regions and, when applied, did produce acceptable parameter estimates, although with significantly greater variability than estimates in cortex. We conclude that in areas of high AChE activity, variability in k3 is dominated by statistical uncertainty and no longer by true biological variability or methodologic errors.
Overall, [11C]PMP, with its bolus-like input function shape, complete irreversibility, and near optimal kinetic properties, can be used with dynamic PET to provide an in vivo index of local AChE activity with excellent precision in cortex and other regions of low enzyme activity. Standard compartmental analysis with least-squares estimation using constraint of the free distribution volume should be used for applications involving brain regions that cover a wide range of AChE activities, whereas a no input function, shape analysis procedure is suggested for applications that are limited to brain areas of low activity such as cortex, where arterial sampling and metabolite analysis is difficult.
Footnotes
Acknowledgments
The authors thank the PET radiochemistry and technologist staff of the Division of Nuclear Medicine for production of isotopes and acquisition of PET data.