
Abstract
N-[11C]methylpiperidin-4-yl acetate ([11C]MP4A) is an acetylcholine analog. It has been used successfully for the quantitative measurement of acetylcholinesterase (AChE) activity in the human brain with positron emission tomography (PET). [11C]MP4A is specifically hydrolyzed by AChE in the brain to a hydrophilic metabolite, which is irreversibly trapped locally in the brain. The authors propose a new method of kinetic analysis of brain AChE activity by PET without arterial blood sampling, that is, reference tissue-based linear least squares (RLS) analysis. In this method, cerebellum or striatum is used as a reference tissue. These regions, because of their high AChE activity, act as a biologic integrator of plasma input function during PET scanning, when regional metabolic rates of [11C]MP4A through AChE (k3; an AChE index) are calculated by using Blomqvist's linear least squares analysis. Computer simulation studies showed that RLS analysis yielded k3 with almost the same accuracy as the standard nonlinear least squares (NLS) analysis in brain regions with low (such as neocortex and hippocampus) and moderately high (thalamus) k3 values. The authors then applied these methods to [11C]MP4A PET data in 12 healthy subjects and 26 patients with Alzheimer disease (AD) using the cerebellum as the reference region. There was a highly significant linear correlation in regional k3 estimates between RLS and NLS analyses (456 cerebral regions, [RLS k3] = 0.98 × [NLS k3], r = 0.92, P < 0.001). Significant reductions were observed in k3 estimates of frontal, temporal, parietal, occipital, and sensorimotor cerebral neocortices (P < 0.001, single-tailed t-test), and hippocampus (P = 0.012) in patients with AD as compared with controls when using RLS analysis. Mean reductions (19.6%) Fin these 6 regions by RLS were almost the same as those by NLS analysis (20.5%). The sensitivity of RLS analysis for detecting cortical regions with abnormally low k3 in the 26 patients with AD (138 of 312 regions, 44%) was somewhat less than NLS analysis (52%), but was greater than shape analysis (33%), another method of [11C]MP4A kinetic analysis without blood sampling. The authors conclude that RLS analysis is practical and useful for routine analysis of clinical [11C]MP4A studies.
The importance of acetylcholine in cognitive function has been recognized for years, as has the fact that depletions of two cholinergic marker enzymes, choline acetyltransferase and acetylcholinesterase (AChE), are the primary neurochemical abnormalities in the cerebral neocortex and hippocampus of Alzheimer disease (AD) (Davies and Maloney, 1976; Perry et al., 1978; Bierer et al., 1995). Recently, an acetylcholine analog method has been developed for in vivo measurement of cerebral AChE activity by positron emission tomography (PET) (Irie et al., 1994, 1996; Kilbourn et al., 1996; Namba et al., 1994). Currently, two lipophilic acetylcholine analogs, N-[11C]methylpiperidin-4-yl acetate ([11C]MP4A) and propionate ([11C]PMP), have been used with PET for the quantitative measurement of cerebral regional AChE activity in healthy subjects (Namba et al., 1998, 1999) and patients with AD (Iyo et al., 1997; Kuhl et al., 1999; Shinotoh et al., 2000) and other neurodegenerative disorders (Shinotoh et al., 1999). Current drug therapy for patients with AD aims at enhancing cholinergic neurotransmission through inhibition of cerebral AChE activity. In vivo determination of cerebral AChE activity is, therefore, of importance not only for diagnostic or biochemical assessment but also for evaluating therapeutics for neurodegenerative disorders.
[11C]MP4A and [11C]PMP are lipophilic acetylcholine analogs with high specificity for AChE. Both are classified as irreversible radiotracers. The analogs enter the brain by diffusion and are hydrolyzed by AChE to a common hydrophilic metabolite, which is trapped in the brain according to the distribution of AChE activity.
The standard method to estimate regional hydrolysis rate of [11C]MP4A by AChE (k3; an index of AChE activity) is to fit the regional time-activity curve (TAC) obtained by PET to the theoretical function derived from the kinetic model and the arterial input function using nonlinear least squares (NLS) optimization. In NLS analysis, however, the procedure involves measurement of the arterial input function that is invasive to patients and requires considerable technical expertise, which may restrict widespread use of this method in daily clinical practice. As an alternative analysis method without the use of an arterial input function, shape analysis has been proposed for estimation of regional cerebral k3 of [11C]PMP (Koeppe et al., 1999) and [11C]MP4A (Tanaka et al., 2001). However, shape analysis showed larger bias and coefficient of variation (CV) of k3 estimates as compared with NLS analysis, particularly in regions with high AChE activity. In the case of [11C]MP4A, shape analysis allowed quantitative measurement of AChE activity only in neocortical regions.
For irreversible radiotracers such as 2-[18 F]-fluoro-2-deoxy-d-glucose, a linear least squares algorithm for the rapid calculation of local rate constants has been proposed (Blomqvist, 1984). However, this approach requires the arterial input function data in the form of single and double integral with respect to PET scan time. In the case of [11C]MP4A, because metabolism by AChE in the striatum and cerebellum is very high, all of [11C]MP4A molecules entered these regions would be trapped there completely. This assumption allows the use of these brain regions as reference region to obtain input function data in the form of single integral with respect to PET scan time. By applying such input function data to Blomqvist's linear approach, local kinetic parameters could be estimated from PET data alone without arterial blood sampling.
In the current study, the authors have examined this possibility allowing another simple method for kinetic parameter estimation of [11C]MP4A without arterial blood sampling, that is, the reference tissue-based linear least squares (RLS) analysis. Computer simulation studies were performed to determine the precision and bias of k3 estimates obtained from the present RLS analysis as well as by NLS and shape analyses. A clinical evaluation study then was performed on 12 healthy subjects and 26 patients with AD to compare the sensitivity of these analyses in detecting regions with reduced AChE activity in patients with AD.
Theory
The kinetic model for [11C]MP4A is the same as the 2-deoxyglucose model (Sokoloff et al., 1977). Both are classified as an irreversible radiotracer. [11C]MP4A is lipophilic enough to pass through the blood–brain barrier depending on regional cerebral blood flow. In the brain tissue, [11C]MP4A is then partly washed out, and the rest is hydrolyzed specifically by AChE into N-methyl-4-piperidinol ([11C]MP4OH). The hydrophilic metabolite does not cross the blood–brain barrier, and thus becomes trapped irreversibly at the site of metabolic reaction, providing the capability to determine regional cerebral AChE activity. The entire process is described by three functional parameters: K1, representing the rate of tracer penetration into the brain; k2, representing the rate of tracer back-diffusion; and k3, representing the rate of tracer hydrolysis by AChE.
For the category of irreversible radiotracers, Blomqvist (1984) proposes a linear algorithm for the rapid calculation of local rate constants using the following operational equation in which the kinetic parameters appear linearly:
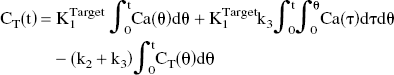
where CT (t) is radioactivity in the target region in the brain, and Ca(t) is the arterial input function.
The authors assumed that [11C]MP4A molecules incorporated into the striatum and cerebellum are rapidly transformed into the hydrophilic metabolites [11C]MP4OH because the AChE activity is known to be very high in these brain regions (reference regions), and that elimination of [11C]MP4OH from the brain can be ignored. Figure 1 shows the validity of these assumptions in both cerebellum and striatum. Radioactivity data of both regions are similar, showing a rapid increase after the tracer injection, then gradually approaching to a plateau level. The plateau level begins at approximately 20 minutes after the tracer injection, when plasma [11C]MP4A radioactivity is almost zero. The PET data of both regions are fitted well with time integral of the arterial input function. In this case, the TAC of the reference region represents the time integral of the arterial input function:
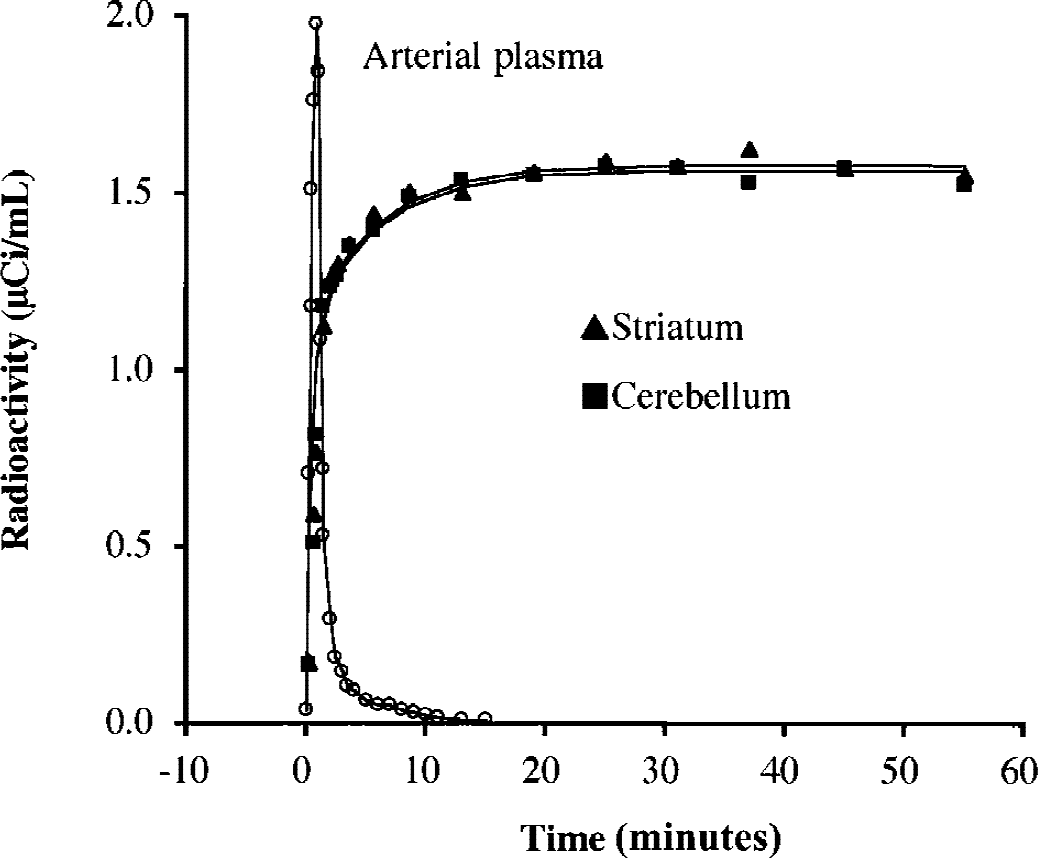
Time-radioactivity data in the striatum (▴) and cerebellum (▪) measured by positron emission tomography in one particular healthy subject. Fitted curves represent time integral of measured input function Ca(t) for K1 values of 0.564 and 0.559 mL g−1 min−1 for the striatum and cerebellum, respectively. Cerebellar time-activity curves (TACs) fitted well with the integrated input function in all subjects used in the current study. Most striatal TACs also fitted well, but some fluctuation was seen in striatal TACs in four patients with Alzheimer disease (see Results).
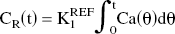
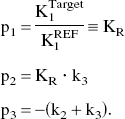
where CR (t) is radioactivity in the reference region, and K1REF is the value of K1 in this region. By using Eqs. 1 and 2, the operational equation of RLS analysis for target regions is derived as follows:

In this approach, the rate of tracer penetration into the target region is obtained as a relative value KR, which is the ratio of target K1 to reference K1.
MATERIALS AND METHODS
Subjects
Two groups of subjects, normal control group (NC group) and Alzheimer disease group (AD group), participated in the current study. The NC group consisted of 12 healthy subjects without a history of central nervous system diseases or psychiatric disorders and the AD group consisted of 26 patients diagnosed as probable AD. The NC group ages ranged from 48 to 79 years (61 ± 11, mean ± SD) with their Mini-Mental State Examination (MMSE) scores ranging from 28 to 30 (29.3 ± 0.7). The AD group ages ranged from 47 to 74 years (64 ± 8) with their MMSE scores ranging from 0 to 20 (13.7 ± 5.4). All patients, who met the National Institute of Neurological and Communicative Disorders and Stroke-Alzheimer's Disease and Related Disorders Association criteria for probable AD (McKhann et al., 1984), were confirmed by magnetic resonance imaging to be free from focal cerebral abnormalities.
The study was approved by the Ethics and Radiation Safety Committee of the National Institute of Radiological Science in Japan. Written informed consent was obtained from each subject and/or a family member.
Positron emission tomography scan protocol
[11C]MP4A was prepared in high radiochemical purity (>95%) and specific radioactivity of greater than 18 TBq · mmol−1 (Namba et al., 1999). The tracer in 5 mL physiologic saline (740 MBq; 20 mCi) was constantly infused into right cubital vein of each subject for 60 seconds through an infusion pump after the transmission scan for 10 minutes using a68 Ge-68 Ga external standard. A sequence of 16 PET scan frames (3 × 20 seconds, 3 × 40 seconds, 1 × 1 minute, 2 × 3 minutes, 5 × 6 minutes, 2 × 10 minutes, total = 60 minutes) was acquired in two-dimensional mode using Siemens/CTI ECAT EXACT-47 scanner (CTI PET Systems, Knoxville, TN, U.S.A.). All emission scans were reconstructed using a Hanning filter with cutoff intensity of 0.5. Measured attenuation correction was performed on all image sets. The spatial resolution of reconstructed images was 9.2 mm axially and 10.0 mm transaxially (full width at half maximum) in the center of the field of view. Positron emission tomography data in three NC subjects were acquired with different scan frame numbers (33 to 42 scans over 60 minutes) and were adjusted to 16 frames/60 minutes after the reconstruction. No correction for patient motion was applied.
The following regions of interest (ROI) were placed manually on the summed PET image by referring the corresponding magnetic resonance image: frontal (FR; mean ROI volume = 3.5 mL), temporal (TE; 4.5 mL), parietal (PA; 4.8 mL), occipital (OC; 3.1 mL) and sensorimotor (SM; 3.1 mL) cerebral neocortices, hippocampus (HP; 2.1 mL), thalamus (1.6 mL), striatum (2.5 mL), and cerebellar cortex (5.2 mL) in both left and right hemispheres (Fig. 2). Regions of interest were transferred to all of the PET scan frames to generate the corresponding brain TACs.
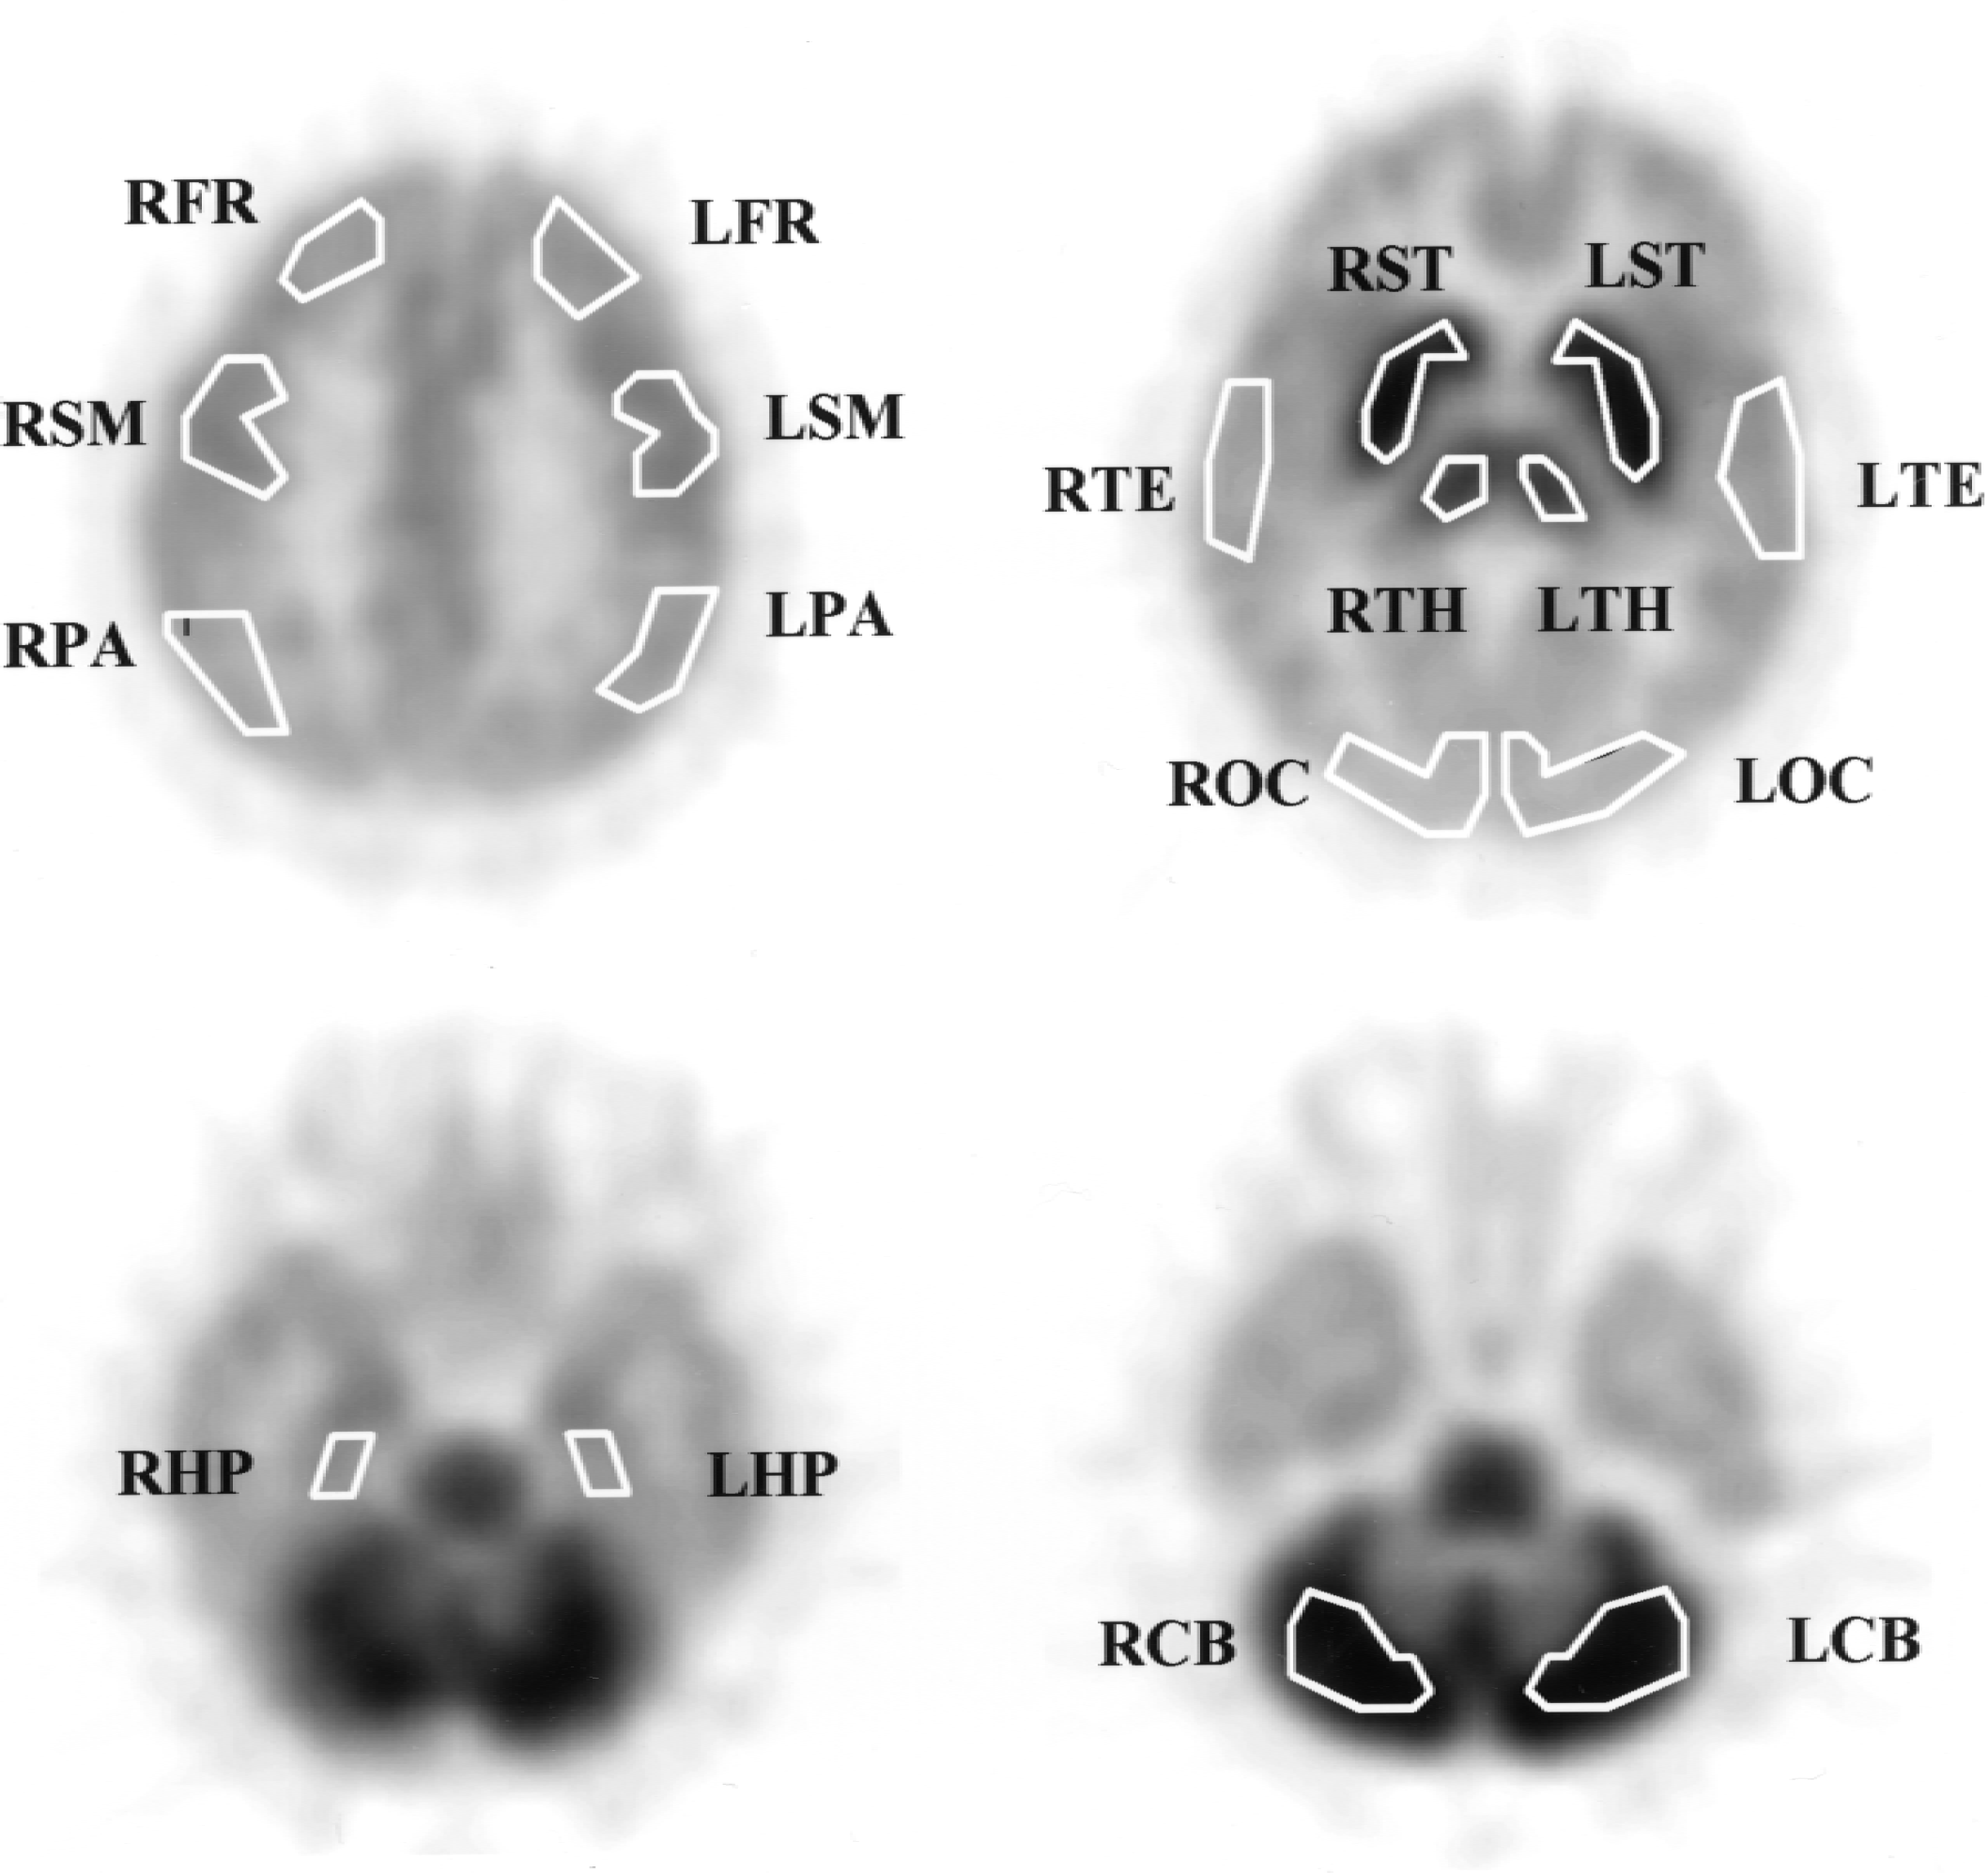
Images showing region of interest placement: frontal (FR), temporal (TE), parietal (PA), occipital (OC), and sensorimotor (SM) cerebral neocortices, hippocampus (HP), thalamus (TH), striatum (ST), and cerebellar cortex (CB) in both left (L) and right (R) hemispheres.
Parameter estimation by nonlinear least squares analysis
A three-compartment model with an arterial blood compartment and two tissue subcompartments representing authentic tracer [11C]MP4A and the metabolite [11C]MP4OH in the brain was used to estimate K1, k2, and k3 parameters. The input function was obtained by fitting TAC of [11C]MP4A in the arterial plasma with sum of exponential functions as described previously (Namba et al., 1999). Regional brain TACs were fitted with the theoretical function derived from the compartmental model convoluted with the arterial input function. The parameters K1, k2, and k3 were obtained by iterative NLS calculation using the weight factor of relative radioactivity disintegration number in each ROI (Namba et al., 1999). The effect of radioactivity in cerebral blood volume fraction, which gives only a few percent bias for the k3 parameter, was ignored. Standard errors (SE) of kinetic parameters were calculated by the method as described in the Appendix.
Parameter estimation by shape analysis
Shape analysis is a method for direct estimation of k3 solely from the shape of tissue TAC without the use of an arterial input function based on the following equations (Tanaka et al., 2001):
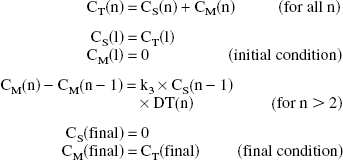
where CT (n), CS (n), and CM (n) are total, [11C]MP4A, and [11C]MP4OH radioactivity in a ROI, respectively, and DT(n) is duration time of the scan frame n. The last 9 scan frames of each TAC were fitted to a steadily decreasing biexponential function with negativity constraint for the exponents. Positron emission tomography data consisting of observed (from 0 to 3 minutes) and fitted (from 3 minutes to the end of PET scan) data points then were linearly interpolated to yield an 8-fold increase in the number of data points before shape analysis calculation. Using the interpolated TAC and the equations described above, the radioactivity of authentic tracer and metabolite in each time point was calculated with varying the k3 value. The calculation was terminated when a difference between the calculated and the measured (or fitted) final metabolite radioactivity became less than 0.0001% using numerical least squares optimization (quasi-Newton method included in Solver/Microsoft Excel 98).
Parameter estimation by reference tissue-based linear least squares analysis
Based on the equation of RLS analysis as described in Theory, TACs in target ROI (cortical regions and thalamus) and reference ROI (cerebellum or striatum) were integrated numerically without data interpolation, and three combined parameters p1, p2, and p3 were calculated by standard linear least squares optimization. The SE values of kinetic parameters KR, k2, and k3 were calculated based on the equations of linear error transfer as described in the Appendix.
Computer-simulation study
To compare the reliability in k3 estimation in RLS analysis with those in standard NLS and shape analyses as a function of PET scan duration and a function of ROI k3 value, two kinds of computer simulation studies were performed.
The effect of PET scan duration on the k3 biases in RLS and shape analyses was examined using error-free TACs for both target and reference ROIs. The TACs were derived by applying an input function from 1 representative healthy subject, fixed K1 (0.547 mL min−1 g−1) and k2 (0.123 min−1), and k3 of 0.088 min−1 for the target ROI and k3 of 800 min−1 for reference ROI to the theoretical function used in NLS analysis. The error-free TACs up to 80 minutes (60 minutes plus 2 extra 10-minute scan frames) were subjected to both RLS and shape analyses for different conditions of scan duration ranging from 28 minutes to 80 minutes by removing time points one by one. The bias of k3 obtained by either shape or RLS analysis was evaluated by calculating the difference between the k3 estimate and the true k3 value, that is, bias (%) = ([estimated k3]/[true k3] − 1) × 100. In this simulation, NLS analysis always gives the true k3, that is, k3 bias is 0%.
Monte Carlo simulation study was performed to compare the precision and bias of k3 between NLS and RLS analyses as a function of ROI k3 value. A series of standard TACs were generated from the three-compartment model configuration using the same input function as was used for error-free simulation. In this approach, the fixed K1 (0.547 mL min−1 g−1) and k2 (0.123 min−1) with varying k3 values ranging from 0.006 to 0.375 min−1 were used to derive standard error-free TACs for target ROI. For the reference ROI, the same error-free TAC as described above (k3 = 800 min−1) was used. For each k3 condition, 100 different target TAC data sets were generated by adding Gaussian random error derived from the estimated PET data error to each time point of the error-free TAC. The magnitude of PET data error for each time point was estimated from the total disintegration number, which was calculated from typical ROI size (5 mL), scan frame duration, half life of 11 C, and radioactivity concentration as described previously (Tanaka et al., 2001). For each k3 condition, 100 data sets were subjected to NLS and RLS analyses. The mean and SD of the 100 k3 estimates then were used to calculate the bias as percent difference of the mean k3 estimate relative to the true k3 value, and the precision as CV of 100 k3 estimates.
Clinical evaluation studies
To assess reliability in parameter estimation of NLS and RLS analyses, PET data of 6 cortical regions (FR, TE, PA, OC, SM, and HP) and thalamus obtained from 12 NC subjects were subjected to NLS and RLS analyses using TACs containing 16 (60 minutes) scan frames. Standard errors of estimated parameters (K1, k2, and k3 in NLS analysis; KR, k2, and k3 in RLS analysis) were calculated using the methods described in the Appendix, and the results were expressed as the mean of 24 SE values (12 subjects, both hemispheres) for each region. Because the thalamus showed high k3 SE (36%) in both NLS and RLS analyses (see Results), this region was omitted in the rest of clinical evaluation studies.
Using all cortical ROI data obtained from 12 NC subjects (144 ROI data) and 26 subjects with AD (312 ROI data), the relation of k3 estimates between NLS and RLS analyses was examined by a linear regression analysis with y-intercept fixed at zero and without a weighting factor. Reductions in k3 estimates of 6 cortical regions (FR, TE, PA, OC, SM, and HP; mean of both hemispheres) in the AD group as compared with the NC group were evaluated using one-tailed t-test with significance level of 0.05. No correction for multiple comparison was made.
The sensitivity of NLS, shape, and RLS analyses in detecting cortical ROIs in the AD group with abnormally low k3 was evaluated as a function of PET scan duration. Cortical ROI data of both NC and AD groups were subjected to NLS, shape, and RLS analyses using TACs containing 12 (28 minutes), 13 (34 minutes), 14 (40 minutes), 15 (50 minutes), and all 16 (60 minutes) scan frames. By NLS analysis using 60-minute TACs, 312 cortical ROIs from 26 patients with AD (6 cortical regions in both right and left hemispheres) were classified as positive (A) or nonpositive (AC) by whether their k3 values were significantly low (z-test;P < 0.05) as compared with the healthy subjects population. By using shape and RLS analyses (using TACs containing 12, 13, 14, 15, and 16 scan frames) and NLS analysis (using TACs containing 12, 13, 14, and 15 scan frames), the same 312 ROIs were classified as positive (B) or nonpositive (BC). The authors define true-positive (TP) ROI and false-negative (FN) ROI as:

As a measure of the diagnostic power of each analysis method under different scan duration, as compared with NLS analysis with 60-minute scan duration, the authors define the sensitivity as
RESULTS
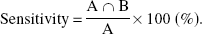
Figure 3 shows an example of curve fitting in RLS analysis of normal cortical TAC obtained from one representative subject using the cerebellum as the reference tissue. The curve fitting in NLS analysis of the same data is overlaid for comparison. Despite the slight difference in the shape of two fitting curves, RLS and NLS analyses gave similar k3 estimates, 0.074 and 0.075 min−1, respectively. In this subject, NLS analysis gave larger k2 (0.103 min−1) than RLS analysis (0.090 min−1), corresponding to the difference in the shape of two curves between the peak and the beginning of the plateau level.
Time-radioactivity data in the temporal cortex of one healthy subject fitted by nonlinear least squares (NLS) and reference tissue-based linear least squares (RLS) analyses. Values of estimated parameters were as follows: K1 = 0.593 mL g− 1 min−1, k2 = 0.103 min−1, k3 = 0.075 min−1 for NLS analysis; and KR = 1.05, K2 = 0.090 min−1, k3 = 0.074 min−1 for RLS analysis.
Computer simulation studies
Figure 4 shows the effect of PET scan duration on the bias of k3 estimates in shape and RLS analyses. The k3 obtained by RLS analysis was almost bias-free—k3 biases being 1.3% at 28 minutes, −0.1% at 40 minutes, and −1.4% at 80 minutes. However, shape analysis showed much larger k3 biases—15.8% at 28 minutes, 1.2% at 40 minutes, and −5.1% at 80 minutes. In shape analysis, unbiased k3 was obtained only for scan duration of approximately 45 minutes.
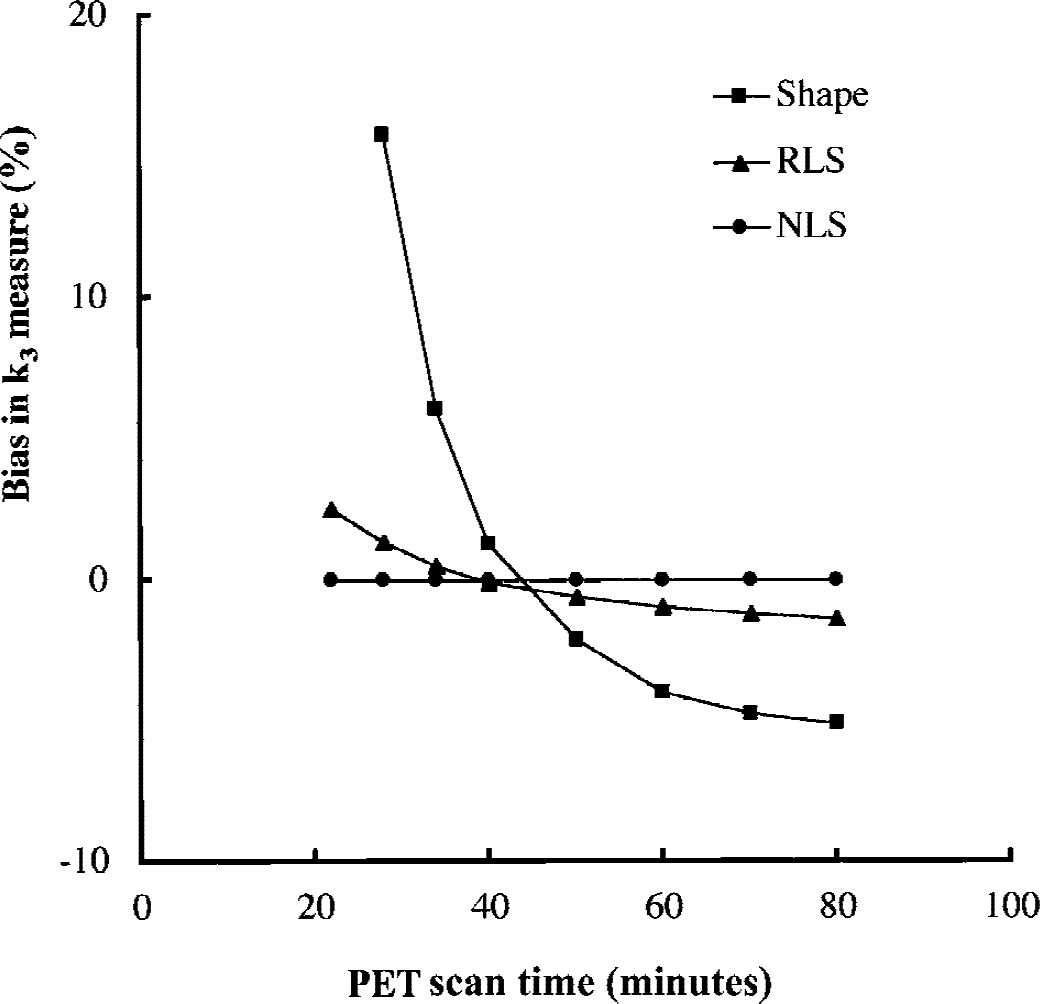
Simulation of the effect of total positron emission tomography (PET) scan time on k3 estimates by nonlinear least squares (NLS), reference tissue-based linear least squares (RLS), and shape analyses. The k3 biases are shown as a function of scan time (used as the calculation time). Both NLS and RLS analyses show small k3 biases for scan time between 28 and 80 minutes. Shape analysis is bias-free only around 45 minutes and yields large plus-biases at shorter scan time and minus-biases at longer scan time.
The effect of the magnitude of ROI k3 value on the bias (Fig. 5A) and precision (Fig. 5B) of k3 estimates was evaluated by the Monte Carlo simulations for both NLS and RLS analyses. The k3 bias in NLS analysis remained within ±1% across the range of k3 tested, although the CV gradually increased with increasing k3, reaching 12.7% for k3 value of 0.375 min−1. The k3 biases in RLS analysis were within ±5% up to k3 value of 0.3 min−1 with similar CV as compared with NLS analysis.
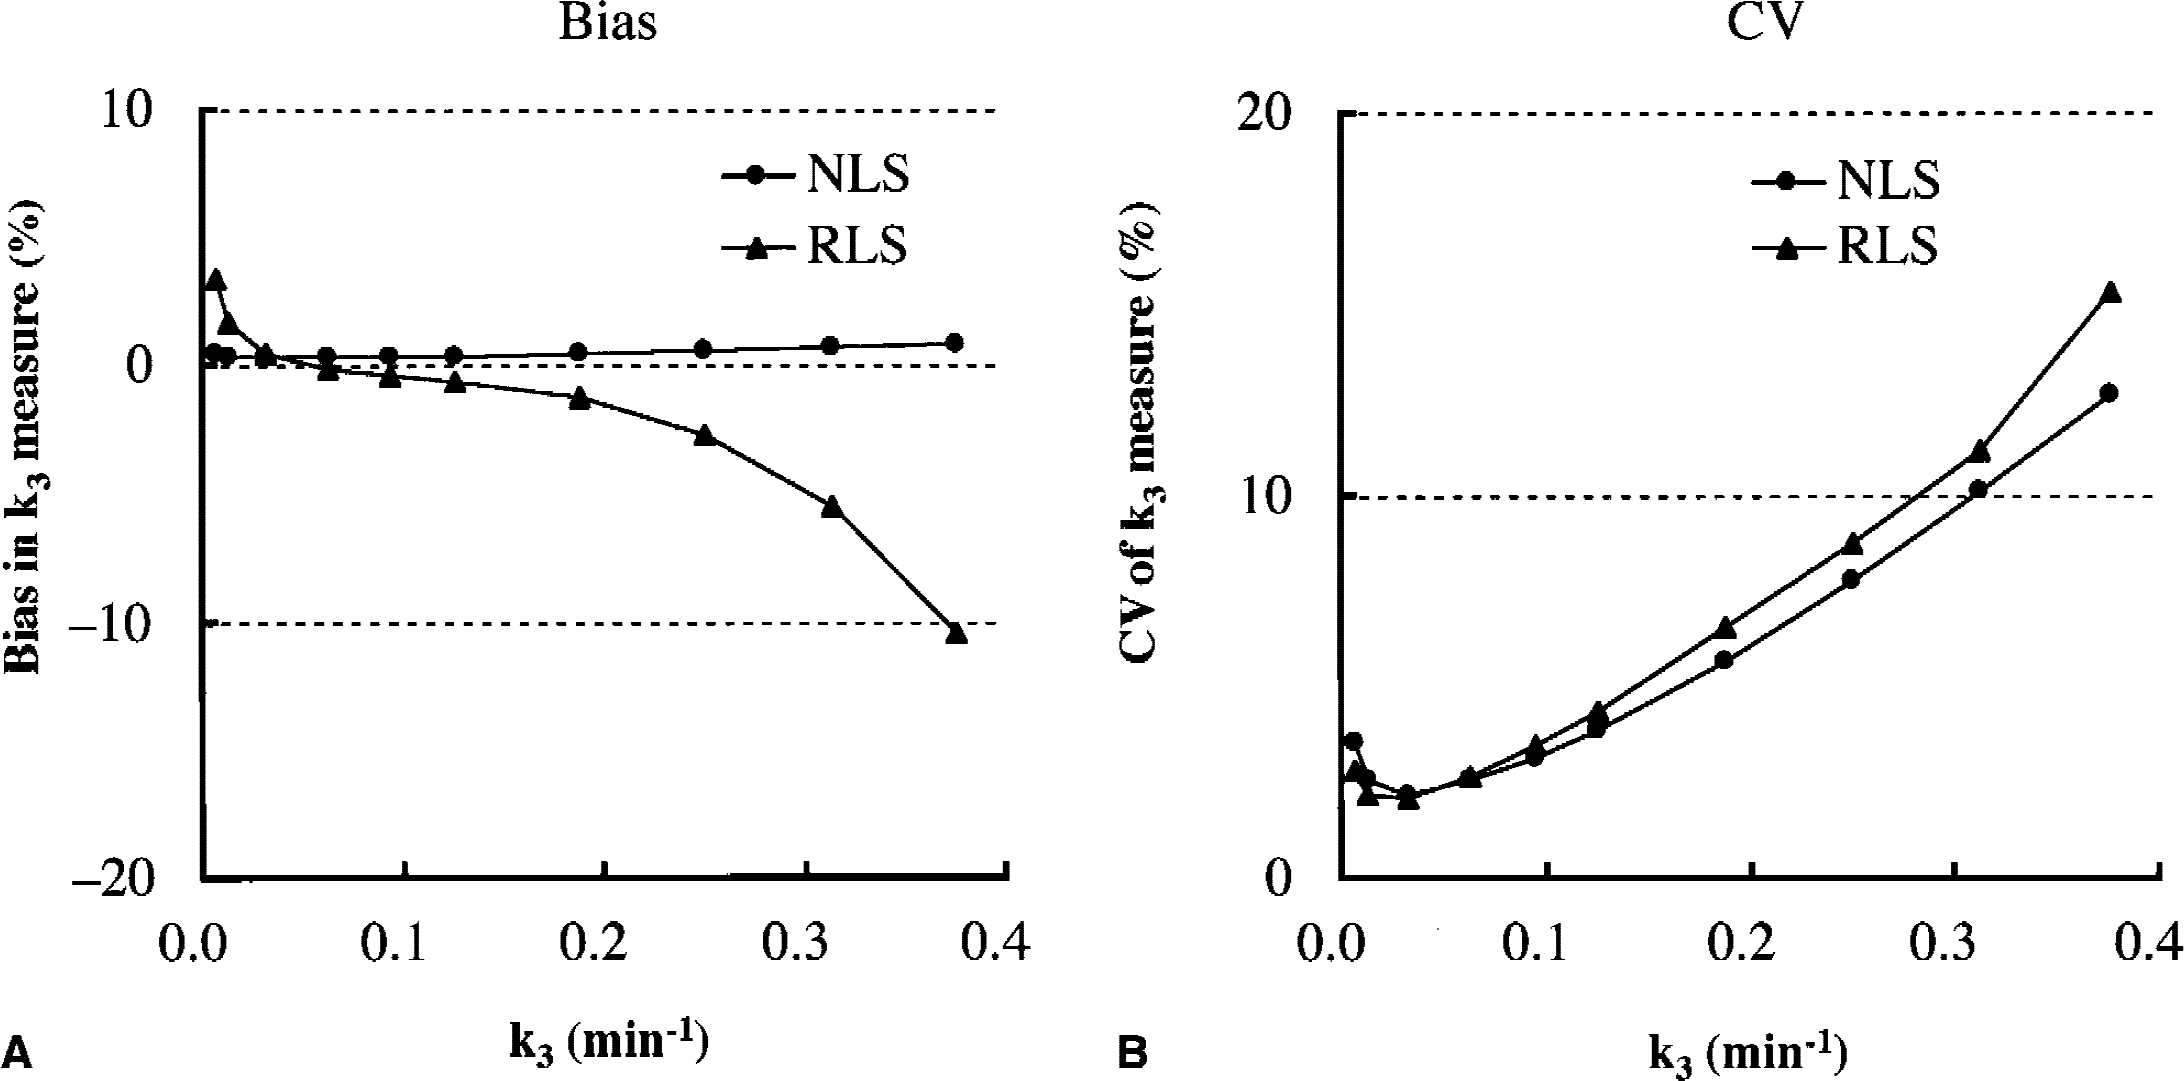
Monte Carlo simulation studies showing the effect of region of interest (ROI) k3 value on bias
Clinical evaluation study
Table 1 shows regional kinetic parameters (mean ± SD) and parameter SE (uncertainty of the parameter value because of fitting error) in the NC group. The SE values for K1 and KR were very small, indicating that kinetic parameters for tracer incorporation were estimated with high precision in both analyses. The SE values of k2 in RLS analysis were approximately twice as large in cortical regions and five times larger in the thalamus (240%) compared with NLS analysis (48%). Both NLS and RLS analyses gave less than 8% of k3 SE in neocortical regions (from OC to SM), indicating that k3 parameters in these regions were highly reliable in both analyses. However, increases in k3 SE were observed in regions with greater k3, approximately 17% in the hippocampus and 35% in the thalamus in both analyses. In the thalamus, RLS analysis showed lower k3 (0.184 min−1) than NLS analysis (0.266min−1). Large SE of thalamic k3 in RLS analysis and k3 bias in the thalamus indicate that RLS analysis is not applicable to the thalamus. When the thalamus data were omitted, linear correlations of regional kinetic parameters were observed between NLS and RLS analyses: [RLS KR] = 1.89 × [NLS K1] (r = 0.99); [RLS k2] = 0.95 × [NLS k2] (r = 0.95); and [RLS k3] = 0.97 × [NLS k3] (r = 0.98). The thalamus, therefore, was not included in the remaining clinical evaluation studies.
Regional kinetic parameters of [11C]MP4A in healthy subjects and SE of estimated parameters
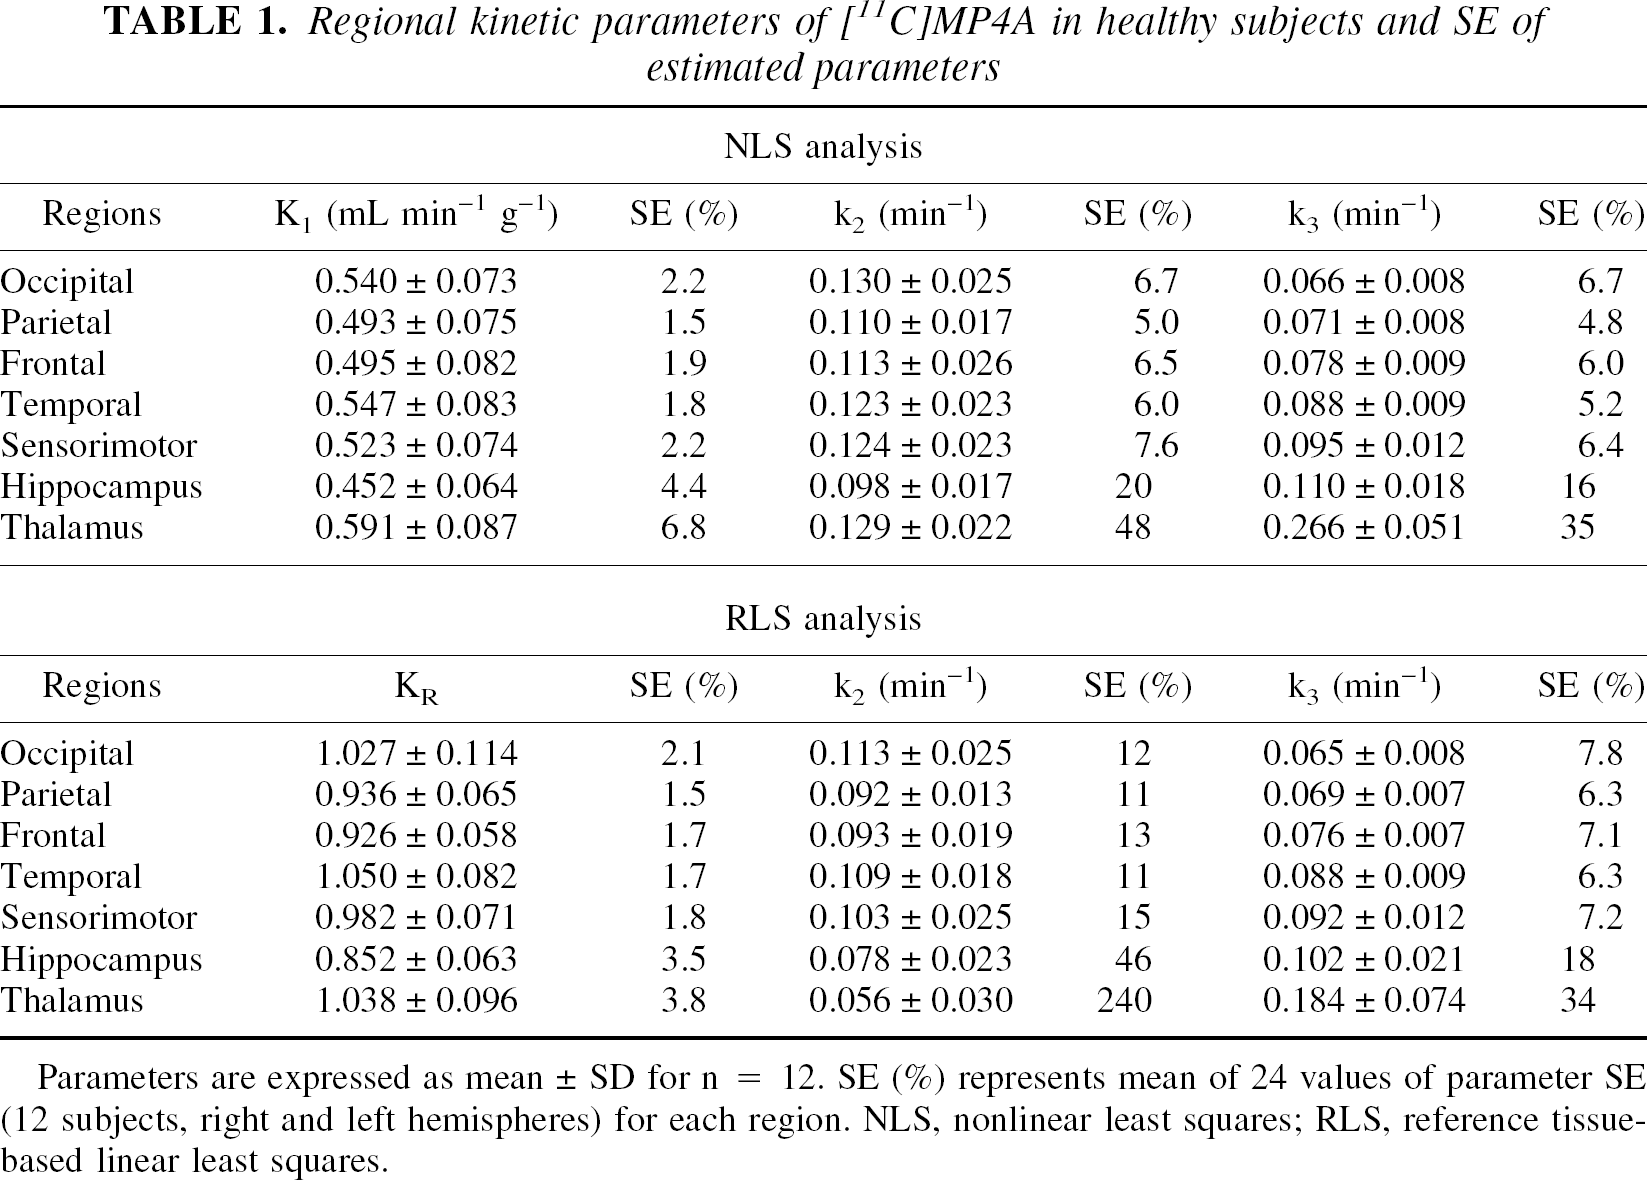
Parameters are expressed as mean ± SD for n = 12. SE (%) represents mean of 24 values of parameter SE (12 subjects, right and left hemispheres) for each region. NLS, nonlinear least squares; RLS, reference tissue-based linear least squares.
Correlation of k3 estimates obtained from NLS and RLS analyses was examined for cortical regions of 38 subjects (12 NC subjects and 26 subjects with AD). When the cerebellum was used as the reference, the correlation coefficient of k3 across all 456 ROIs was r = 0.92 with a regression line of [RLS k3] = 0.98 × [NLS k3] (Fig. 6A). With the striatum as the reference, 4 of 26 patients with AD showed large deviations (Fig. 6C). Striatal TACs of these four patients showed either gradual decreases in radioactivity and/or irregular fluctuations, likely because of partial volume effect or head movement during the PET scan in these subjects (Fig. 7). When these patients' data were omitted (Fig. 6B), the correlation coefficient was r = 0.87 with a regression line of [RLS k3] = 1.02 × [NLS k3]. Most of the ROIs deviated from the regression line in Fig. 6A and 6B were in the hippocampus, which had greater k3 values and smaller ROI volumes than other cortical regions. Because the cerebellum was superior to the striatum as the reference, the cerebellum was used as the reference in the following RLS analysis.
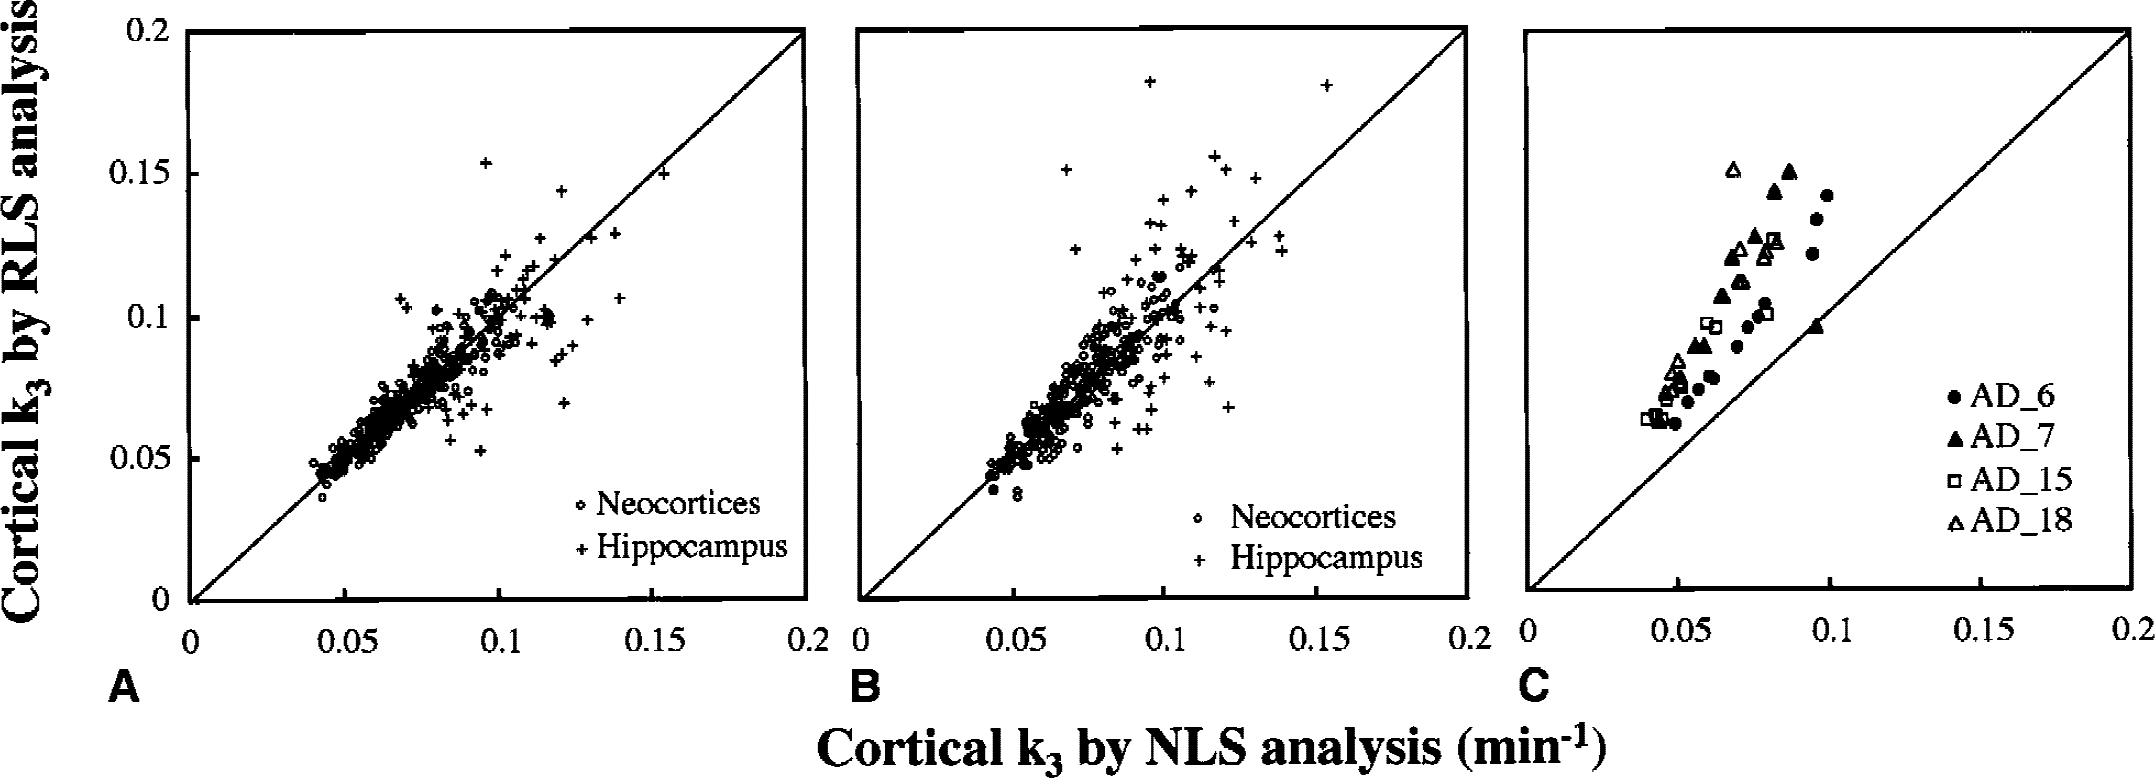
Correlation of k3 estimates between standard nonlinear least squares (NLS) analysis and reference tissue-based linear least squares (RLS) analysis in 12 cerebral cortical regions (frontal, temporal, parietal, occipital, and sensorimotor cerebral neocortices, and hippocampus; right and left sides).
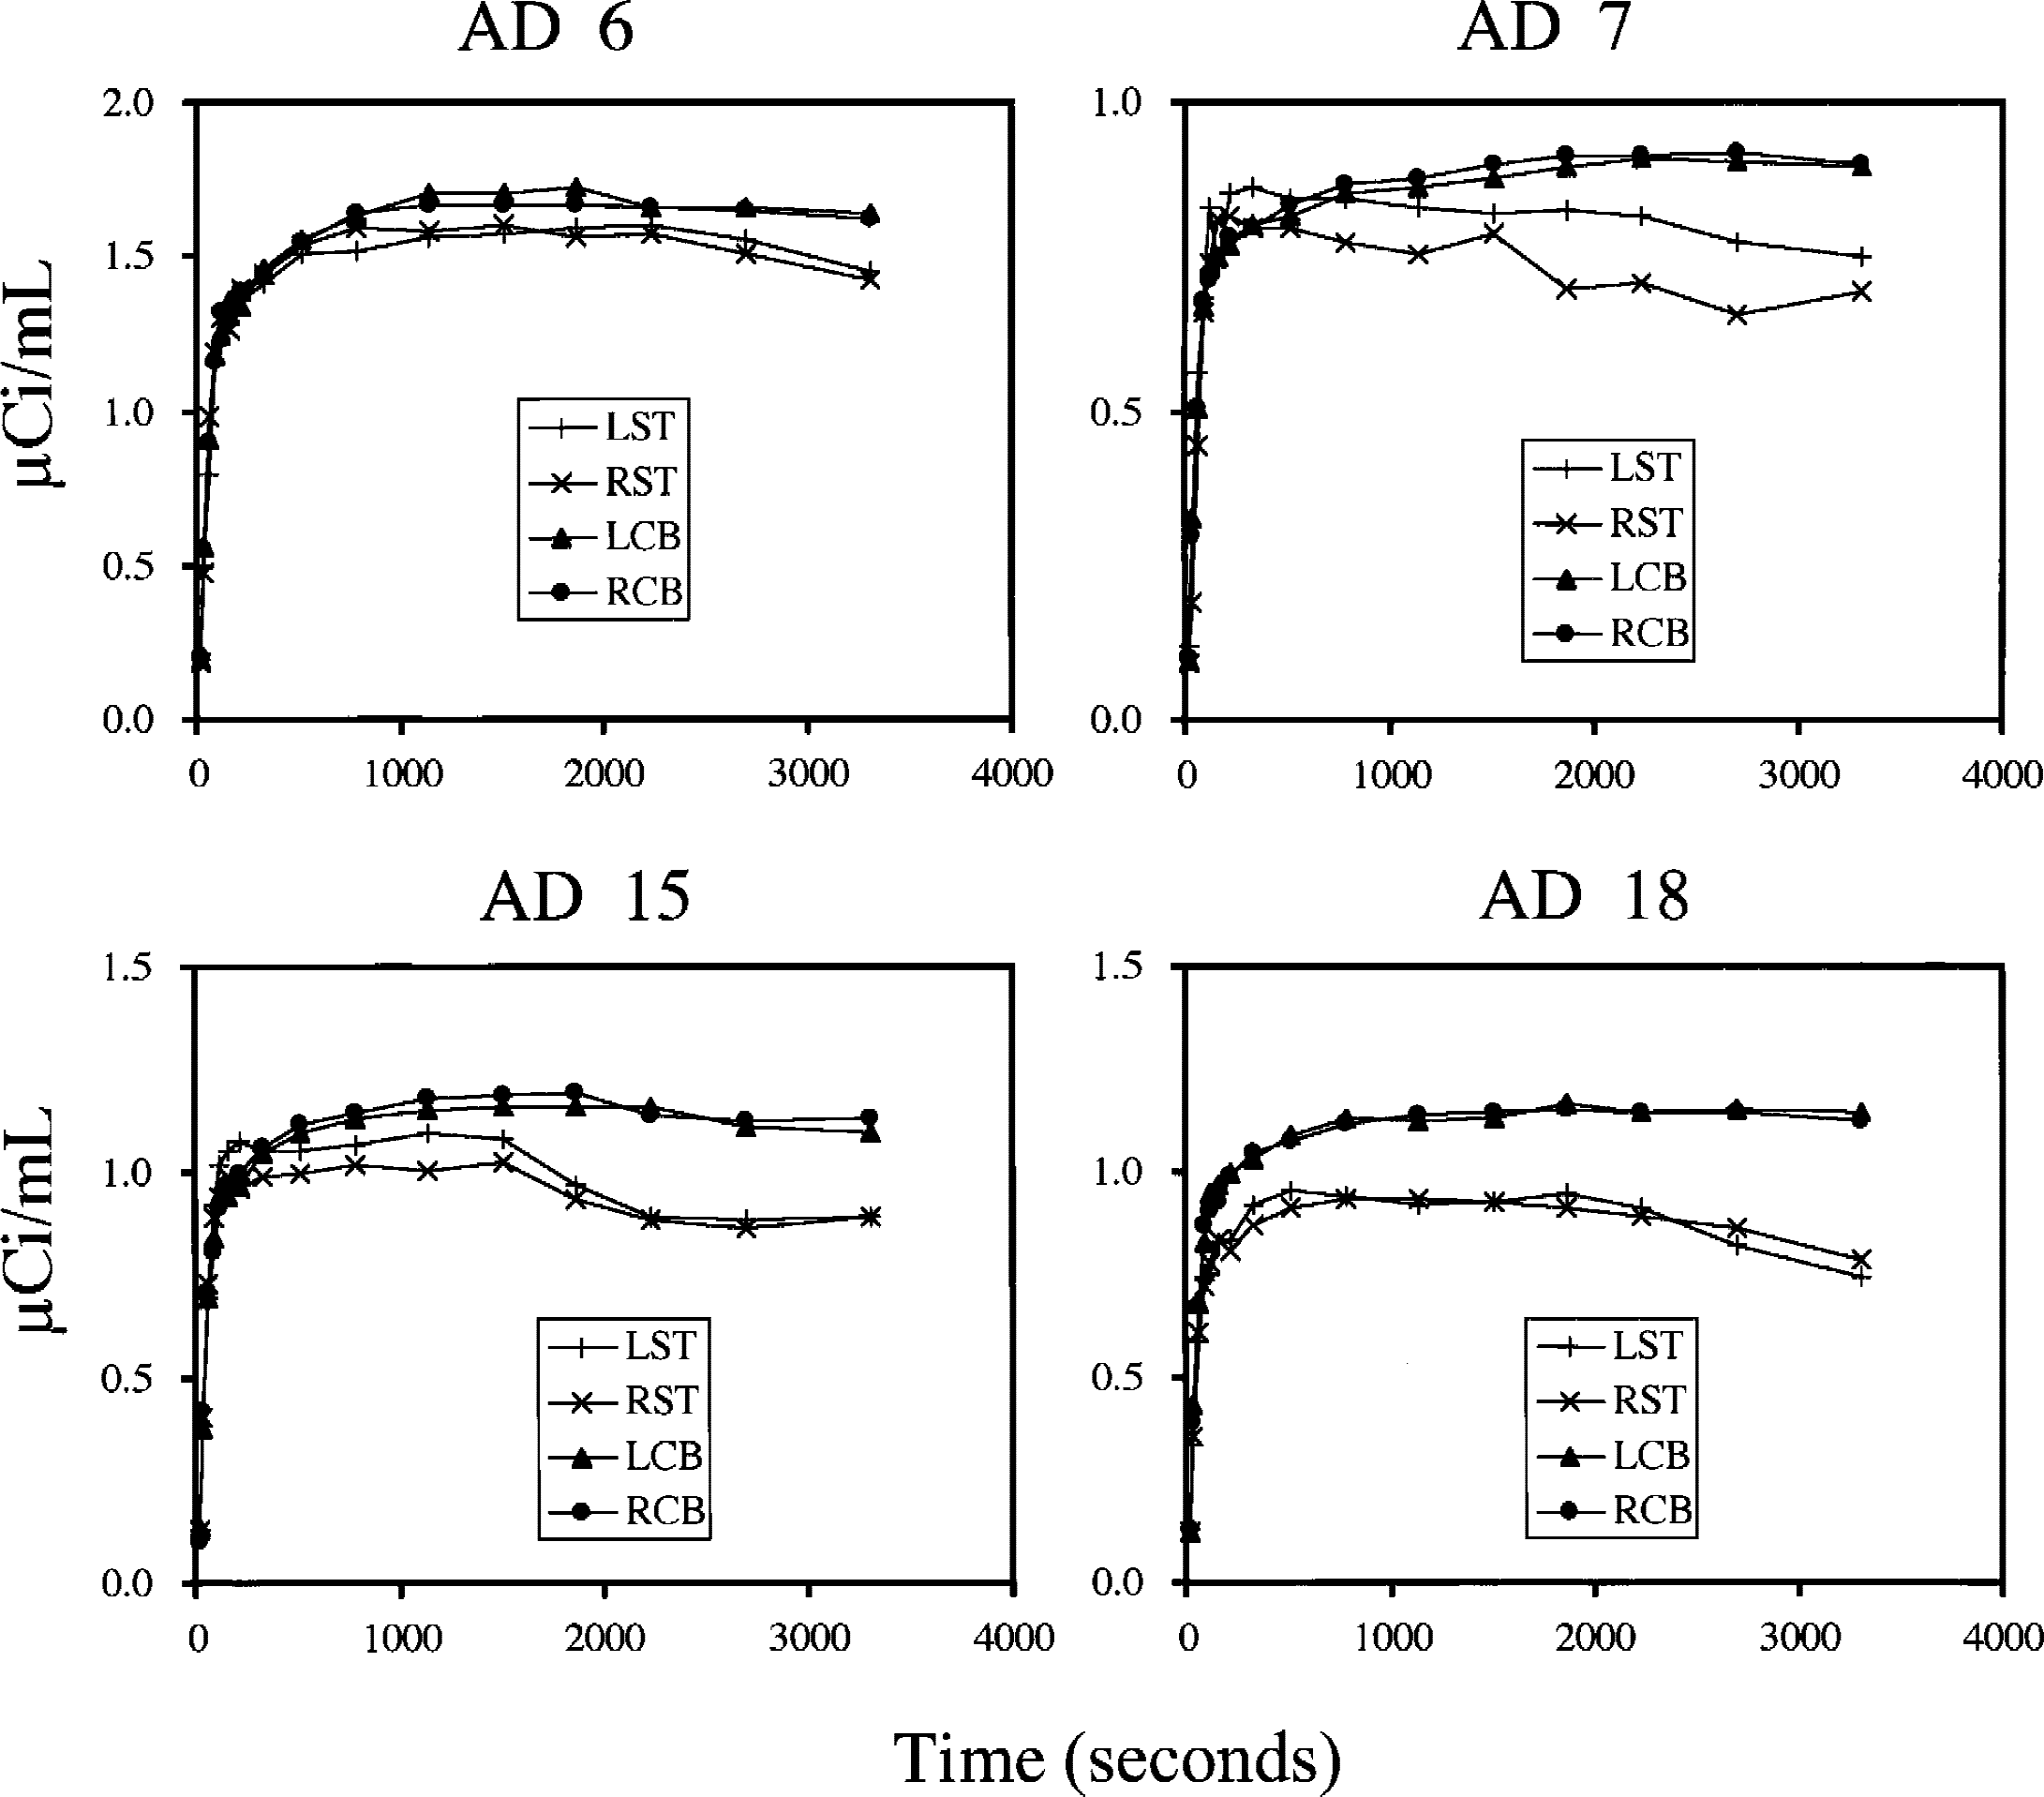
Comparison of reference time-activity curves (TACs) for four patients with Alzheimer disease who showed highly biased k3 values in striatal reference tissue-based linear least squares analysis. In all cases, TACs of striatum (LST, RST) show gradual decreases in radioactivity with irregular fluctuations, likely because of partial volume effect, or head movement artifacts, or both, in the striatum of these subjects. These effects were not obvious in the cerebellum (LCB, RCB).
The average regional k3 values were compared between NC and AD groups using NLS (Fig. 8A) and RLS (Fig. 8B) analyses. Of the six cortical regions examined, NLS analysis gave the greatest k3 values for the NC group in HP followed by SM > TE > FR > PA > OC. This order was in accordance with the reported AChE distribution in the postmortem human brains (Arai et al., 1984; Atack et al., 1986). With NLS analysis, the AD group showed significant k3 reductions in all regions (P < 0.001)—16% in HP, 21% in SM, 26% in TE, 19% in FR, 23% in PA, and 18% in OC. For RLS analysis, the rank order of k3 values for the six cortical regions in the NC group was the same as for NLS analysis. Reductions of cortical k3 values in the AD group also were significant (P = 0.012 in HP;P < 0.001 in SM, TE, FR, PA, and OC)—12% in HP, 19% in SM, 25% in TE, 20% in FR, 24% in PA, and 19% in OC. The mean reduction in cortical k3 obtained by RLS analysis was 19.6%, which was similar to that by NLS analysis (20.5%).
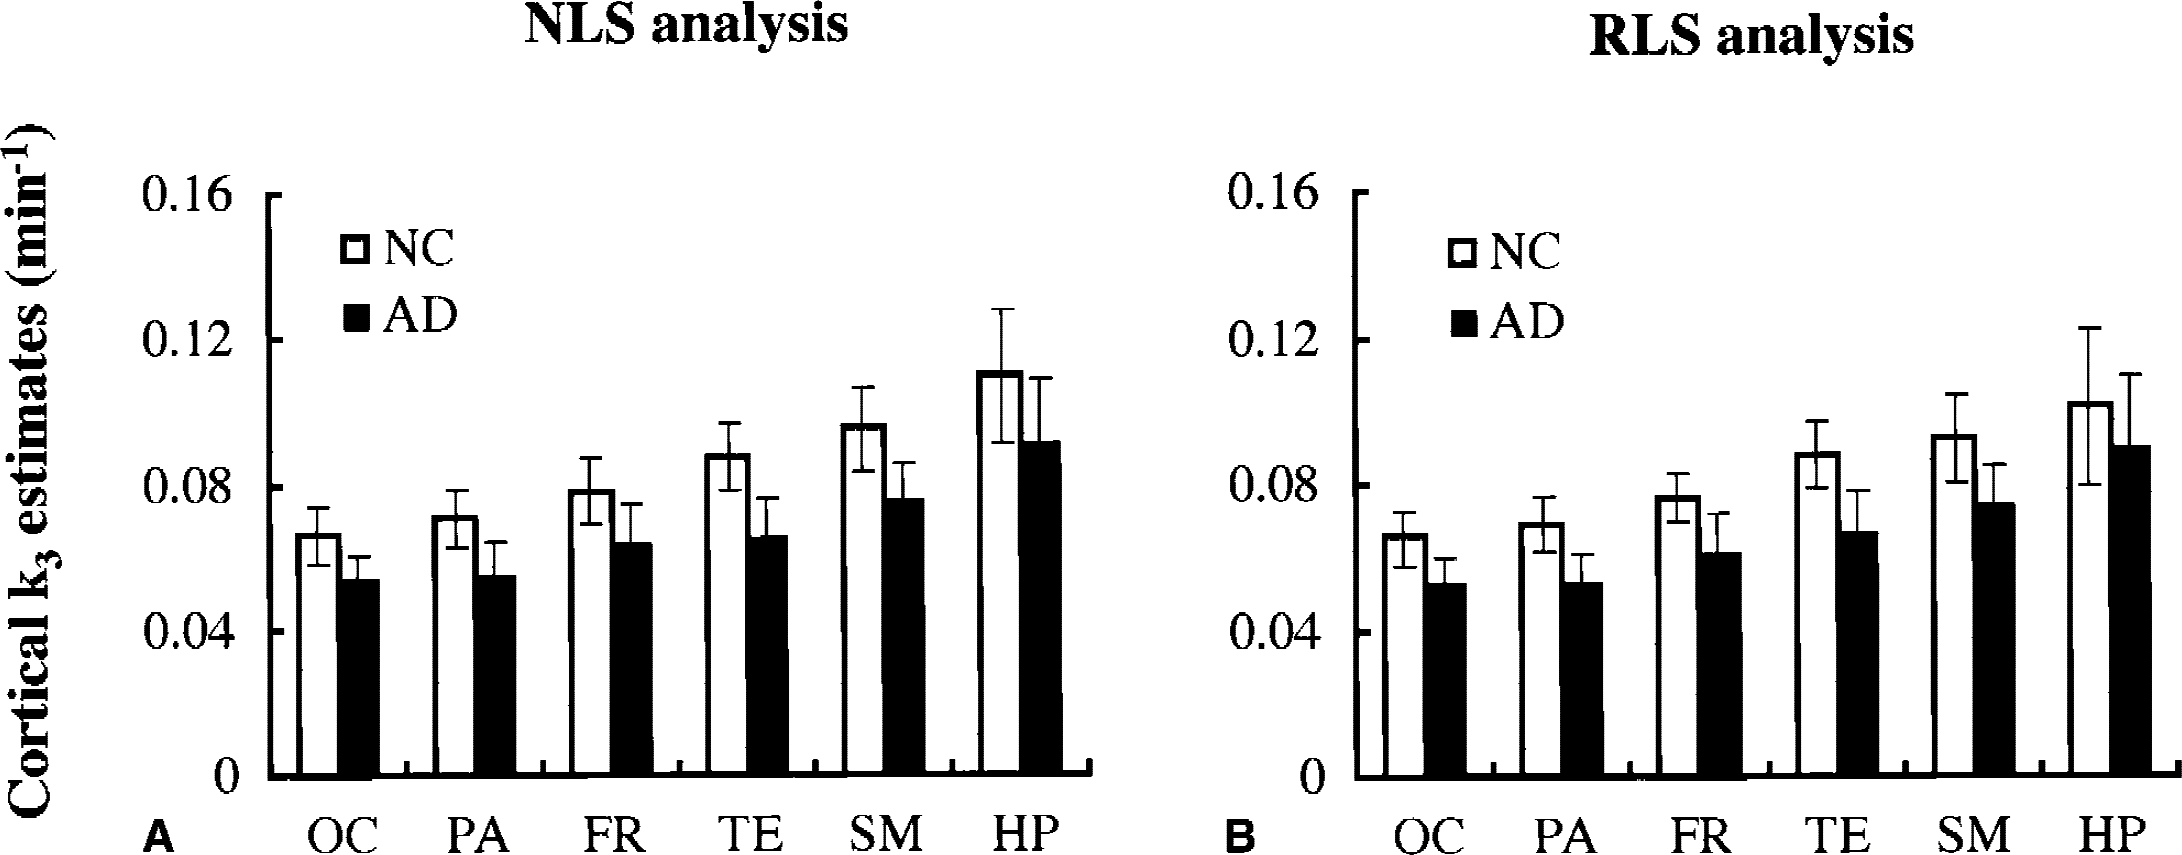
Comparison of cortical k3 values (mean and SD) between normal control (NC) and Alzheimer disease (AD) groups by using
Of 312 cortical ROIs in 26 patients with AD examined, NLS analysis of 60-minute scan data detected 163 positive ROIs in total (6.3 ROIs/AD patient). Figure 9 shows changes of sensitivity in each method as the function of PET scan time. As the scan duration becomes shorter, the sensitivity of NLS analysis gradually decreased—96.6% (157 TP ROIs) for 50 minutes, 92.0% (150 TP ROIs) for 40 minutes, 83.4% (136 TP ROIs) for 34 minutes, and 69.3% (113 TP ROIs) for 28 minutes. Reference tissue-based linear least squares analysis showed somewhat lower sensitivity than NLS analysis in each scan time—84.7% for 60 minutes, 84.0% for 50 minutes, 76.7% for 40 minutes, 66.3% for 34 minutes, and 50.3% for 28 minutes. When the comparison was made for the same scan duration, RLS analysis retained more than 80% of relative sensitivity to NLS analysis, except for scan duration of 28 minutes. However, shape analysis showed the maximum sensitivity in scan time of 40 to 50 minutes (63.2% for 40 minutes, 61.3% for 50 minutes), and the sensitivity decreased in both longer (33.1% for 60 minutes) and shorter (36.2% for 28 minutes) scan time than the optimum one.
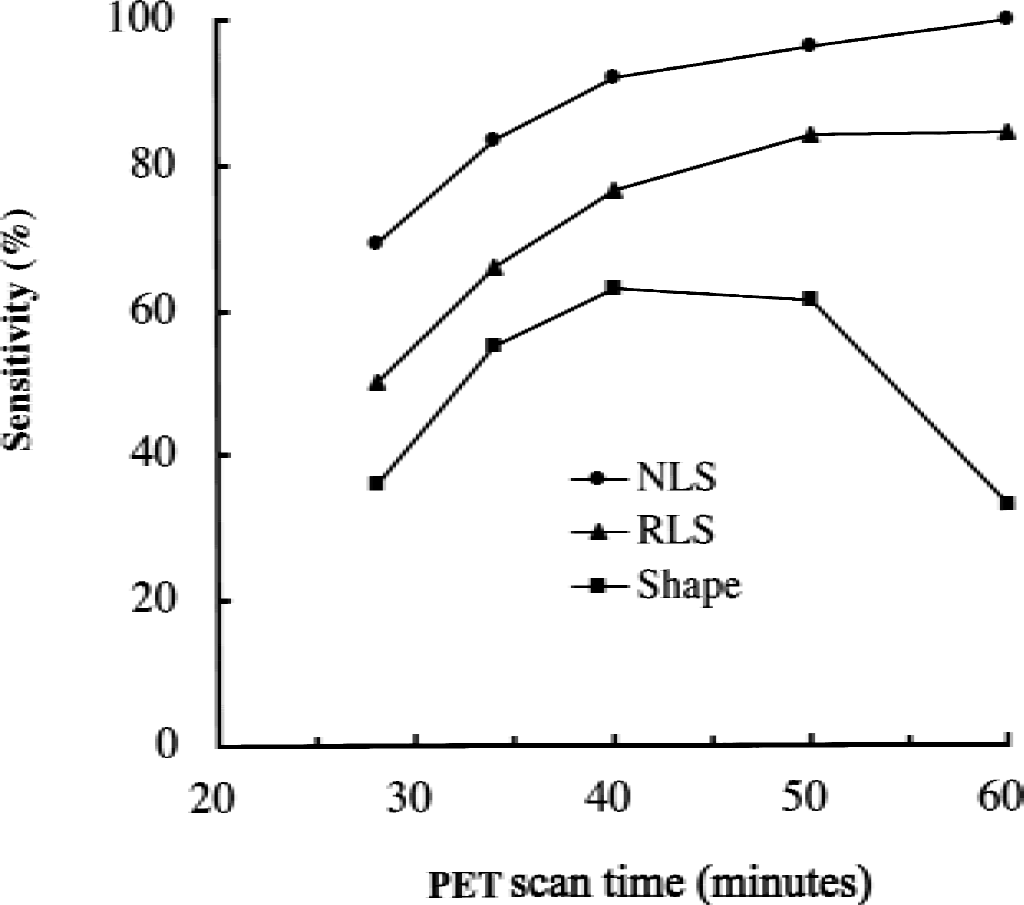
Sensitivity of nonlinear least squares (NLS) analysis, reference tissue-based linear least squares (RLS) analysis, and shape analysis in detecting abnormal regions of interest in 26 patients with Alzheimer disease shown as a function on positron emission tomography (PET) scan time. The sensitivity of NLS analysis at 60-minute scan time is taken as 100%. The sensitivity is higher in RLS analysis than in shape analysis at each scan time.
DISCUSSION
Principle of reference tissue-based linear least squares analysis
The primary assumption required for RLS analysis is that all tracer molecules that have entered the reference brain region should be trapped locally, and thus TAC of the reference region should represent time-integral of the arterial input function. Acetylcholinesterase activities differ grossly across different brain regions, and the interrelation of cerebral cortex/thalamus/cerebellum/striatal AChE activities is 1/3/8/38, as determined in normal brain at postmortem (Arai et al., 1984; Atack et al., 1986). Time-radioactivity data of both striatum and cerebellum were quite similar and were fitted well with time-integral curves of the arterial input function (Fig. 1), suggesting that AChE activities in both regions are high enough to trap almost all of the [11]MP4A that entered these regions.
In kinetic analyses of reversible radioligands such as [11C]raclopride and [11C]SCH23390, an internal reference method similar to RLS analysis is used. In this method, the cerebellum or other regions containing negligible specific-binding sites is used as the reference region giving an information of the arterial input function. The current RLS analysis has two advantageous properties over the previous internal reference method. In RLS analysis of [11C]MP4A, because brain regions with high AChE activity are used as the reference, time-integral of the arterial input function is obtained from reference TAC with high radioactivity counting rates. In the internal reference method with reversible radioligands, radioactivity of reference TAC is usually low, because a receptor-poor region is used as the reference. Another advantage of RLS analysis is the fewer number of unknown parameters (KR, k2, and k3) compared with reversible radiotracer method with four or more unknown parameters. With these properties, the current RLS analysis would give kinetic parameters with greater precision than the previous internal reference method for reversible radiotracers.
Simulation study
In shape analysis, k3 value is strongly dependent on PET scan duration. The simulation study (Fig. 4) showed that the optimum scan duration for shape analysis was approximately 40 to 50 minutes for k3 value of 0.088 min−1, an average k3 value in the normal temporal cortex. The primary assumption in shape analysis is that all tracer molecules in the target brain region are washed out or metabolized at the end of PET scan. If the scan duration is shorter than the time it actually takes for the TAC to become completely flat, the level of final radioactivity is overestimated, resulting in the overestimation of k3. Conversely, if the scan duration is longer than the optimal time, k3 is underestimated (Tanaka et al., 2001). The drawback of shape analysis is the variation of the optimal scan duration between healthy subjects and patients with AD, because of the differences in k2 and/or k3 values. However, RLS analysis was quite stable, yielding negligible k3 bias over a wide range of scan duration ranging from 28 to 80 minutes as does the NLS analysis. The slight k3 bias seen in RLS analysis was explained by the errors in numeric integration.
In the irreversible radiotracer method, reliability of k3 estimation is known to be dependent on the ROI k3 value. In a brain region with high AChE activity, where metabolic rate of the tracer (k3) is much greater than efflux rate (k2), the net incorporation of the tracer is determined solely by the influx transport rate (K1) and the input function, and is no longer sensitive to k3 (flow-limitation effect). This flow-limitation effect in regions with high AChE activity affects the accuracy and precision of k3 estimates in NLS analysis with [11C]MP4A and [11C]PMP (Namba et al., 1999; Koeppe et al., 1999) and in shape analysis with [11C]MP4A (Tanaka et al., 2001). The authors' previous study showed that shape analysis is much more susceptible to the flow-limitation effect than NLS analysis and that precise k3 estimation is solely limited to the cerebral neocortices (k3 values up to 0.10 min−1) in shape analysis with [11C]MP4A.
The current simulation study was performed under an ideal condition of k3 (800 min−1), high enough to ensure the equivalency between reference TAC and integrated input function, hence the situation is equivalent to Blomqvist's linear analysis using the arterial input function. Under this ideal condition, the precision of k3 estimates obtained by RLS analysis was comparable to that obtained by NLS analysis for brain regions with k3 values up to 0.30 min−1 (thalamic k3). The bias of k3 estimates in RLS analysis was within 5% up to k3 of 0.30 min−1, suggesting that RLS analysis would have a wider range of k3 measurement than shape analysis. The k3 bias of RLS analysis was negative and much more significant than NLS analysis greater than the k3 value of approximately 0.25 min−1. This is partly explained by the disappearance of washout phase in the target TAC. By the disappearance of downward part in the TAC, the trapezoidal approximation line for numeric integration tends to be lower than the actual TAC, resulting in underestimation of TAC data that causes underestimation of k3.
Clinical evaluation study
In k3 estimation using clinical data (Table 1), RLS analysis showed almost the same k3 SE values as NLS analysis, ranging from 7% in neocortex with lower mean k3 (lower AChE activity) to 18% in the hippocampus and 34% in the thalamus with increasingly higher AChE activity, indicating that RLS and NLS analyses were similarly sensitive to the flow-limitation effect. For neocortical regions, k3 SE estimated from clinical data corresponded well to k3 CV in Monte Carlo simulation study, suggesting that the authors' noise estimates of PET data were realistic. However, the k3 SE values of hippocampus and thalamus were 3 to 4 times larger than corresponding CV values obtained from the simulation. This may be explained by the difference between the ROI size used in the simulation (5 mL) and the actual ROI size in the hippocampus (2.1 mL) and thalamus (1.6 mL).
Reference tissue-based linear least squares analysis yielded negligible k3 biases except in the thalamus, where mean k3 by RLS analysis (0.184 min−1) was approximately 30% less than that by NLS analysis (0.266 min−1). The Monte Carlo simulation showed much smaller k3 bias (approximately −5%) at thalamic k3 level. The reason for this difference is partly because of the smaller ROI size that may involve effects of minor head movement, or partial volume effect, or both. As seen in the simulation study, RLS analysis is thought to be more sensitive to underestimation of radioactivity in target region than NLS analysis at thalamic k3 level. However, cortical k3 values determined by RLS analysis were almost identical to those obtained from NLS analysis with good agreement of clinical SE and simulated CV. Because of large k3 SE and considerable k3 bias obtained with RLS analysis for the thalamus, the authors restricted further evaluation study to six cerebral cortical regions.
In the clinical evaluation study, RLS analysis using the cerebellum as the reference region yielded more reliable estimates of cortical k3 value than that using the striatum when compared with the k3 values obtained by the standard NLS analysis (Fig. 6A). Actually, 4 of 26 patients with AD showed large deviation in the correlation analysis of k3 values in the striatal reference–RLS analysis (Fig. 6C), whereas no patients did in the cerebellar reference-RLS analysis. The striatums in these four patients with AD showed gradual decreases in radioactivity, or irregular fluctuations in TACs, or both, which may be because of partial volume effect or head motion during PET scans (Fig. 7). The cerebellar reference–RLS analysis seems to be rather insensitive to such effects because its ROI size (5.2 mL) is larger than that of the striatum (2.5 mL). Patients with dementia tend to move during PET scans; therefore, the cerebellar reference–RLS analysis may be more practical than the striatal reference-RLS analysis. In the correlation analysis between NLS k3 (as the gold standard) and the cerebellar reference-RLS k3 (Fig. 6A), the linear relation with regression line of [RLS k3] = 0.98 × [NLS k3] (r = 0.92) was observed across all 456 cortical ROIs (12 NC subjects, 144 ROIs; 26 AD patients, 312 ROIs). Most data points that showed large deviations from the regression line were in the hippocampus, which had greater k3 values and smaller ROI sizes than other cortical regions.
The rank order of six cortical k3 values in the NC group obtained by NLS and RLS analyses was identical and corresponded to the reported order of cortical AChE activity in necropsy sample (Arai et al., 1984; Atack et al., 1986). The RLS analysis yielded similar mean and SD of k3 in these cortical regions compared with NLS analysis. The RLS analysis showed significant reductions (P = 0.012 for HP;P < 0.001 for other five regions) in cortical k3 values of patients with AD as compared with the NC group. These results demonstrate that RLS analysis of [11C]MP4A PET data is useful for noninvasive evaluation of cholinergic functions in cerebral cortical regions in patients with AD.
As shown in Fig. 9, NLS analysis showed the highest sensitivity to detect AD ROIs with significant k3 reduction (P < 0.05 in z-test) among the three methods of analysis. As scan duration decreased, the sensitivity of NLS analysis decreased because of a loss of information. Similarly, the sensitivity of RLS analysis decreased as scan duration became short. The relative sensitivity of RLS analysis to NLS analysis in the same scan duration remained more than 80% for scan duration from 34 minutes to 60 minutes. However, shape analysis showed much lower and more variable sensitivity with changes in scan duration as compared with RLS and NLS analyses. Although both NLS and RLS analyses showed an increase in sensitivity with increasing scan duration up to 60 minutes, shape analysis showed the highest sensitivity at scan duration from 40 to 50 minutes, but showed the lowest sensitivity at 60 minutes. In the shape analysis, the optimal scan duration for normal cortex with k3 of 0.088 min−1 was approximately 40 to 50 minutes (Fig. 4). However, the optimal time depends on ROI k3 value and is much longer in patients with AD with lower cortical k3 values. When scan duration (calculation time of k3) is shorter than the optimal time, overestimation of k3 occurs in shape analysis, especially in AD cortex, resulting in lower sensitivity. Conversely, when the scan duration becomes longer than the optimal time, underestimation of k3 value in NC cortex occurs in shape analysis, again resulting in reduction of sensitivity. Thus, the shape analysis is very sensitive to the bias effect of scan duration.
Although the sensitivity of RLS analysis is somewhat lower than NLS analysis, RLS analysis possesses some advantages over NLS analysis. First, RLS analysis does not require arterial blood sampling. Second, because parameter estimation by RLS analysis is simple because of linear calculation, the analysis is of great use for pixel-by-pixel parameter estimation for reconstruction of parametric images. Reference tissue-based linear least squares analysis showed the highest sensitivity when using 60-minute scan data. However, shorter scan duration such as 40 minutes may be practically useful, not only because of convenience for patients but also for the reduction of artifacts caused by head movement, especially in the case of patients with dementia.
Previously, the authors proposed shape analysis with [11C]MP4A and PET as a simple and noninvasive technique for the measurement of cortical AChE activity without arterial blood sampling. The current study revealed that RLS analysis was superior to shape analysis in terms of measurable range of k3, precision and accuracy in k3 estimates, and sensitivity in detecting brain regions with abnormally low k3 in patients with AD. With RLS analysis, KR value (target-to-reference ratio of K1) is obtained instead of K1. Because regional blood flow in the cerebellum is known to be maintained in many cerebral diseases, the relative blood flow rate in the target tissue obtained from the cerebellar reference–RLS analysis may be informative. The current study recommends the use of the cerebellum as the reference region in RLS analysis. In case of cerebellar disorders, however, the striatum should be used as the reference region with the correction of head motion when required. When both of these regions are affected, for example, in multiple system atrophy, the use of shape analysis rather than RLS analysis should be considered.
Conclusions
The authors examined the applicability of RLS analysis, a simple approach without blood sampling, for the determination of a quantitative index of brain AChE activity by using [11C]MP4A and PET. The RLS analysis is based on the linear least squares analysis of irreversible tracer kinetics using the TACs in reference tissues to obtain the information of input function. Computer simulation studies showed that RLS analysis provides a precise index of AChE in brain regions with low (for example, cortex) and moderate AChE activity (hippocampus and thalamus). Clinical studies showed that the cerebellum is superior to the striatum as the reference region. Reference tissue-based linear least squares analysis using the cerebellum as the reference region showed sensitivity (85% as compared with NLS analysis) enough to detect abnormality of AChE activity in cortical ROIs in patients with AD. Considering its simplicity and noninvasiveness, the authors conclude that RLS analysis with [11C]MP4A is a practically useful method for the detection of abnormal AChE activity in patients with AD.
Footnotes
Acknowledgments:
The authors thank N. Oku, Tokyo Institute of Technology, for his helpful discussions and assistance in preparing the manuscript. They are also grateful to Drs. K. Suzuki, T. Nakajima, M. Suzuki, H. Murayama, H. Ikehira, and H. Matsuura, National Institutes of Radiological Sciences, for their production of isotopes, acquisition of PET data, and helpful discussions.
APPENDIX
Standard errors SE of local kinetic parameters obtained by NLS and RLS analyses were calculated as follows.