
Abstract
The applicability of two reference tissue-based analyses without arterial blood sampling for the measurement of brain regional acetylcholinesterase (AChE) activity using N-[11C]methylpiperidin-4-yl propionate ([11C]MP4P) was evaluated in 12 healthy subjects. One was a linear least squares analysis derived from Blomqvist's equation, and the other was the analysis of the ratio of target-tissue radioactivity relative to reference-tissue radioactivity proposed by Herholz and coworkers. The standard compartment analysis using arterial input function provided reliable quantification of k3 (an index of AChE activity) estimates in regions with low (neocortex and hippocampus), moderate (thalamus), and high (cerebellum) AChE activity with a coefficient of variation (COV) of 12% to 19%. However, the precise k3 value in the striatum, where AChE activity is the highest, was not obtained. The striatum was used as a reference because its time-radioactivity curve was proportional to the time integral of the arterial input function. Reliable k3 estimates were also obtained in regions with low-to-moderate AChE activity with a COV of less than 21% by striatal reference analyses, though not obtained in the cerebellum. Shape analysis, the previous method of direct k3 estimation from the shape of time-radioactivity data, gave k3 estimates in the cortex and thalamus with a somewhat larger COV. In comparison with the standard analysis, a moderate overestimation of k3 by 9% to 18% in the linear analysis and a moderate underestimation by 2% to 13% in the Herholz method were observed, which were appropriately explained by the results of computer simulation. In conclusion, simplified kinetic analyses are practical and useful for the routine analysis of clinical [11C]MP4P studies and are nearly as effective as the standard analysis for detecting regions with abnormal AChE activity.
The potential roles of neocortical and hippocampal cholinergic nerve systems on cognitive function have been investigated in neuropathological studies of Alzheimer's disease (Bierer et al., 1995; Davies and Maloney, 1976; Perry et al., 1978), where the reduction of acetyl-cholinesterase (AChE) activity has been used as a marker of degeneration of the cholinergic system. Currently, two lipophilic acetylcholine analogs with a high specificity for AChE, N-[11C]methylpiperidin-4-yl acetate ([11C]MP4A) and propionate ([11C]MP4P), which are classified as irreversible tracers, have been used with positron emission tomography (PET) for the purpose of in vivo mapping of AChE activity. The AChE selectivity of MP4A and MP4P in human cortical homogenates is estimated to be 94% (Namba et al., 1999) and 86%, respectively, and the hydrolysis rate is four or five times larger for MP4A than for MP4P (Irie et al., 1996). Quantitative measurements of cerebral regional AChE activity have been reported in healthy subjects (Koeppe et al., 1999; Kuhl et al., 1999; Namba et al., 1999) and in patients with Alzheimer's disease (Herholz et al., 2000; Iyo et al., 1997; Kuhl et al., 1999; Shinotoh et al., 2000) or other neurodegenerative disorders (Shinotoh et al., 1999).
The standard analysis to estimate the regional hydrolysis rate of [11C]MP4A and [11C]MP4P by AChE is to fit the regional time-radioactivity curve obtained by PET to the theoretical function derived from the kinetic model and the arterial input function using nonlinear least squares optimization. Reliable k3 values (an index of AChE activity) were reported in brain regions with low (such as neocortices and hippocampus) and moderate (such as thalamus) AChE activity by [11C]MP4A (Namba et al., 1999) and [11C]MP4P (Koeppe et al., 1999). [11C]MP4P allows more precise k3 estimates in regions with moderate-to-high AChE activity (such as cerebellum). The standard analysis procedure, however, requires arterial blood sampling and considerable technical expertise, which may restrict the widespread use of this method in daily clinical practice.
As an alternative analysis without the use of an arterial input function, shape analysis has been proposed for [11C]MP4P (Koeppe et al., 1999) and optimized for [11C]MP4A (Tanaka et al., 2001); this is a unique method for the direct estimation of k3 solely from the shape of tissue time-radioactivity data, where neither radioactivity data in plasma nor those in a reference region is necessary. Quantitative measurements of AChE activity for cerebral cortex and thalamus by [11C]MP4P and for neocortical regions by [11C]MP4A were reported by using shape analysis; however, the coefficient of variation (COV) of k3 estimates was larger than that of the standard analysis.
In the case of [11C]MP4A, because metabolism by AChE in the striatum and cerebellum is very high, almost all [11C]MP4A molecules that enter these regions would be trapped there, and thus these brain regions could be used as a reference region to obtain input function data in the form of a single integral. Based on this supposition, two reference tissue-based analyses for the measurement of cortical AChE activity using [11C]MP4A were proposed (Herholz et al., 2001; Nagatsuka et al., 2001); these were evaluated to be superior to the shape analysis and useful for the diagnosis of Alzheimer's disease. Considering [11C]MP4P, however, a simplified kinetic analysis other than shape analysis has not been proposed previously. In addition, because the applicability of a reference tissue-based analysis depends on whether a suitable internal reference is available, the applicability of these two tracers is not necessarily the same because [11C]MP4P has a slower hydrolysis rate by AChE than [11C]MP4A.
In this report, for a detailed investigation of [11C]MP4P, two reference tissue-based analyses for the kinetic parameter estimation of [11C]MP4P were examined in studies in 12 healthy subjects. To evaluate these analyses, the standard analysis using arterial blood sampling as well as shape analysis were also performed.
MATERIALS AND METHODS
Subjects
Twelve healthy subjects (mean ± SD age, 56 ± 17 years; range, 32–86 years; nine men and three women) participated in the present study after giving written informed consent. Medical history, general physical, and neurologic examinations were performed to ensure that all subjects were free of neurologic, psychiatric, and serious illness. The Mini-Mental State Examination scores ranged from 27 to 30 (29.7 ± 0.6). None of the subjects were taking any medications at the time of the study. All subjects were free of focal cerebral abnormalities according to the results of magnetic resonance imaging. The Ethics and Radiation Safety Committee of the National Institute of Radiological Sciences in Japan approved the study.
Positron emission tomography scan protocol
[11C]MP4P was synthesized by reaction of its demethyl precursor with [11C]methyl iodide, followed by purification with reversed-phase high-pressure liquid chromatography. A saline solution of [11C]MP4P was prepared and passed through a millipore filter. Specific radioactivity was higher than 18 TBq/mmol. The product had a radiochemical purity of greater than 95%, and according to test results was free of bacteria and pyrogen.
[11C]MP4P dosing solution was prepared in 5 mL physiologic saline and was infused through an infusion pump into the right cubital vein of each subject for 60 seconds after the 10-minute transmission scan by using a 68Ga-68Ge external standard. Injected radioactivity ranged from 400 to 760 MBq (10.8–20.6 mCi). A sequence of 16 scan time frames (3 × 20 seconds, 3 × 40 seconds, 1 × 1 minute, 2 × 3 minutes, 5 × 6 minutes, 2 × 10 minutes) was acquired over 60 minutes in the two-dimensional mode using Siemens/CTI EXACT 47 scanner (CTI PET Systems, Inc., Knoxville, TN, U.S.A.). The regions of interest in frontal (volume, 3.4 ± 0.8 mL), temporal (4.0 ± 1.7 mL), parietal (3.5 ± 1.0 mL), occipital (4.4 ± 1.1 mL), and sensorimotor (3.9 ± 1.0 mL) cerebral neocortices, hippocampus (1.7 ± 0.5 mL), thalamus (1.9 ± 0.4 mL), cerebellar cortex (4.9 ± 0.8 mL), and striatum (3.5 ± 0.5 mL) in both hemispheres were placed manually on a summation PET image by referring to the corresponding magnetic resonance image.
Measurement of input function
The input function was obtained according to a previously described method for [11C]MP4A (Namba et al., 1999), with minor modifications. Twenty-seven blood samples were withdrawn rapidly through a radial artery catheter into 1.5-mL tubes containing 0.1 mg physostigmine, an inhibitor of cholinesterases, in 10 μL heparinized saline. Blood sampling was started at the time of tracer arrival in the brain and continued for 30 minutes according to the following protocol: 10 × 10 seconds, 5 × 30 seconds, 7 × 60 seconds, 2 × 120 seconds, 3 × 300 seconds. The sampled blood (approximately 0.5 mL) was quickly mixed and the plasma was separated with a microcentrifuge at 13,000 g for 1 minute. To remove protein, 50 μL of plasma sample was mixed with 100 μL of ethanol and recentrifuged at 13,000 g for 1 minute. The residual plasma samples were counted using a γ counter to calculate the concentration of total radioactivity in the plasma. Deproteinized plasma samples were spotted on a silica gel thin-layer chromatography plate and developed for 5 minutes with ethylacetate-isopropanol-ammonia (15:5:1, v/v/v). The volume of the spots was 10 μL for the first 18 samples, and 30 μL for the last nine samples. The authentic-to-total radioactivity ratios in the ethanol extracts were measured by an imaging phosphor plate system (BAS-1800; Fuji Photo Film, Tokyo, Japan). The time-radioactivity curve of total and authentic tracer in the plasma, expressed empirically by monoexponential saturation function during infusion and the sum of three exponential functions after infusion, was obtained by a nonlinear least squares method with weighting factors of inverse concentration as described previously (Namba et al., 1999).
Parameter estimation by standard nonlinear least squares analysis
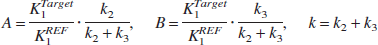
A three-compartment model with an arterial blood component and two tissue subcompartments representing authentic tracer [11C]MP4P and the metabolite [11C]MP4OH in the brain was used to estimate three functional parameters: K1 (mL·min−1·g−1). representing the tracer penetration into the brain; k2 (min−1), representing the rate of tracer back-diffusion; and k3 (min−1), representing the rate of tracer hydrolysis by AChE. The regional brain radioactivity concentration CT(t), composed of authentic tracer CS(t) and metabolite CM(t) in the brain, was fitted with the following theoretical functions derived from the tissue two-compartment irreversible model convoluted with the arterial input function Ca(t) to yield the estimates of K1, k2, and k3 by iterative nonlinear least squares calculations (Namba et al., 1999):
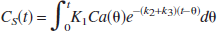
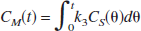
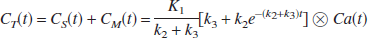
where ⊗ represents the mathematical operation of convolution. Weight factor 1/σc2 was used for nonlinear calculation, where σc2 represents the variance of radioactivity counts in a region of interest, which was calculated from the radioactivity concentration, volume of the region, tracer decay, and scan frame duration. The effect of radioactivity in the cerebral blood fraction was disregarded because the fraction was estimated to be approximately 4% and almost equal among brain regions of interest in this study, giving a bias of only a few percent for the k3 parameter. The elimination of metabolite from the brain during the period of PET study as long as 60 minutes, which was thought to be acceptable (Koeppe et al., 1999), was ignored in this study. To obtain reasonable k3 values, the value of distribution volume (DV, K1/k2 ratio) was constrained to be within the mean ± 2SD of the DV value in the cerebral neo-cortices for each subject when necessary.
Parameter estimation by shape analysis
Shape analysis was based on the following equations (Koeppe et al., 1999; Tanaka et al., 2001):


where DT(n) is duration of the scan frame n. The last 10 scan frames of each time-radioactivity data were fitted to biexponential function. PET data consisting of observed (0–3 minutes) and fitted (3–60 minutes) data points were linearly interpolated to yield an eightfold increase in the number of data points before shape analysis calculation. Using the interpolated time-radioactivity data and the equations described above, the radioactivity of authentic tracer CS(n) and metabolite CM(n) at each time point was calculated by varying the k3 value. The calculation was terminated when a difference between the calculated and the measured (or fitted) final metabolite radioactivity became less than 0.0001% using numerical least squares optimization.
Parameter estimation by Nagatsuka's reference tissue-based analysis
The time-radioactivity of the target tissue CT(t) is given as the following theoretical function in linear least squares analysis (Blomqvist, 1984):
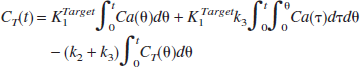
According to a previous report (Nagatsuka et al., 2001), under the approximation of rapid hydrolysis (k3≫k2) in the reference region, the time-radioactivity of the reference tissue CR(t) is assumed to be comparable to K1 times the integral of the input function and is given as:
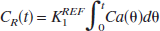
where K1REF is K1 of the reference region. By using Eq. 5, Eq. 4 can be rewritten as
This equation is linear for three combined parameters of p1(KR), p2(KR·k3), and p3(−k2 − k3). The parameter KR is the ratio of K1 between the target and reference tissue, K1Target/K1REF. The standard linear least squares algorithm gave the solutions for these combined parameters.
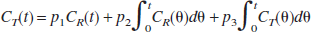
Parameter estimation by Herholz's reference tissue-based analysis
According to the method of Herholz et al. (2001), under the same approximation as in the derivation of Eq. 5, the ratio of target-tissue radioactivity relative to reference-tissue radioactivity, C(t), is calculated by using Eqs. 3 and 5 as follows:
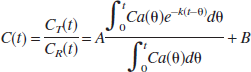
where
This method makes the second assumption that the net clearance rate of the true arterial input function Ca(t) behaves mono-exponentially with a clearance rate constant kp that is much larger than k, which results in the following equation:
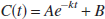
The parameters A, B, and k can be estimated from a nonlinear least squares fit, and the rate constant k2 and k3 can be calculated as follows:
The C(t) data often fluctuated and showed large deviations especially at the very early phase with a rapid increase, which increased COV in k3 estimates; therefore, the data up to scan duration 100 seconds were excluded from the curve-fitting calculation.
Evaluation of simplified kinetic analyses
The reliability of reference tissue-based analyses and shape analysis was evaluated with respect to bias and COV in k3 estimates as compared with standard analysis. Bias was defined as percent difference of the estimated k3 value relative to the true k3 value; that is, bias (%) = ([estimated k3]/[true k3] − 1) × 100, where k3 obtained by standard analysis was used as true k3. COV was represented as percent SD relative to the mean value.
Computer simulation study for reference tissue-based analyses
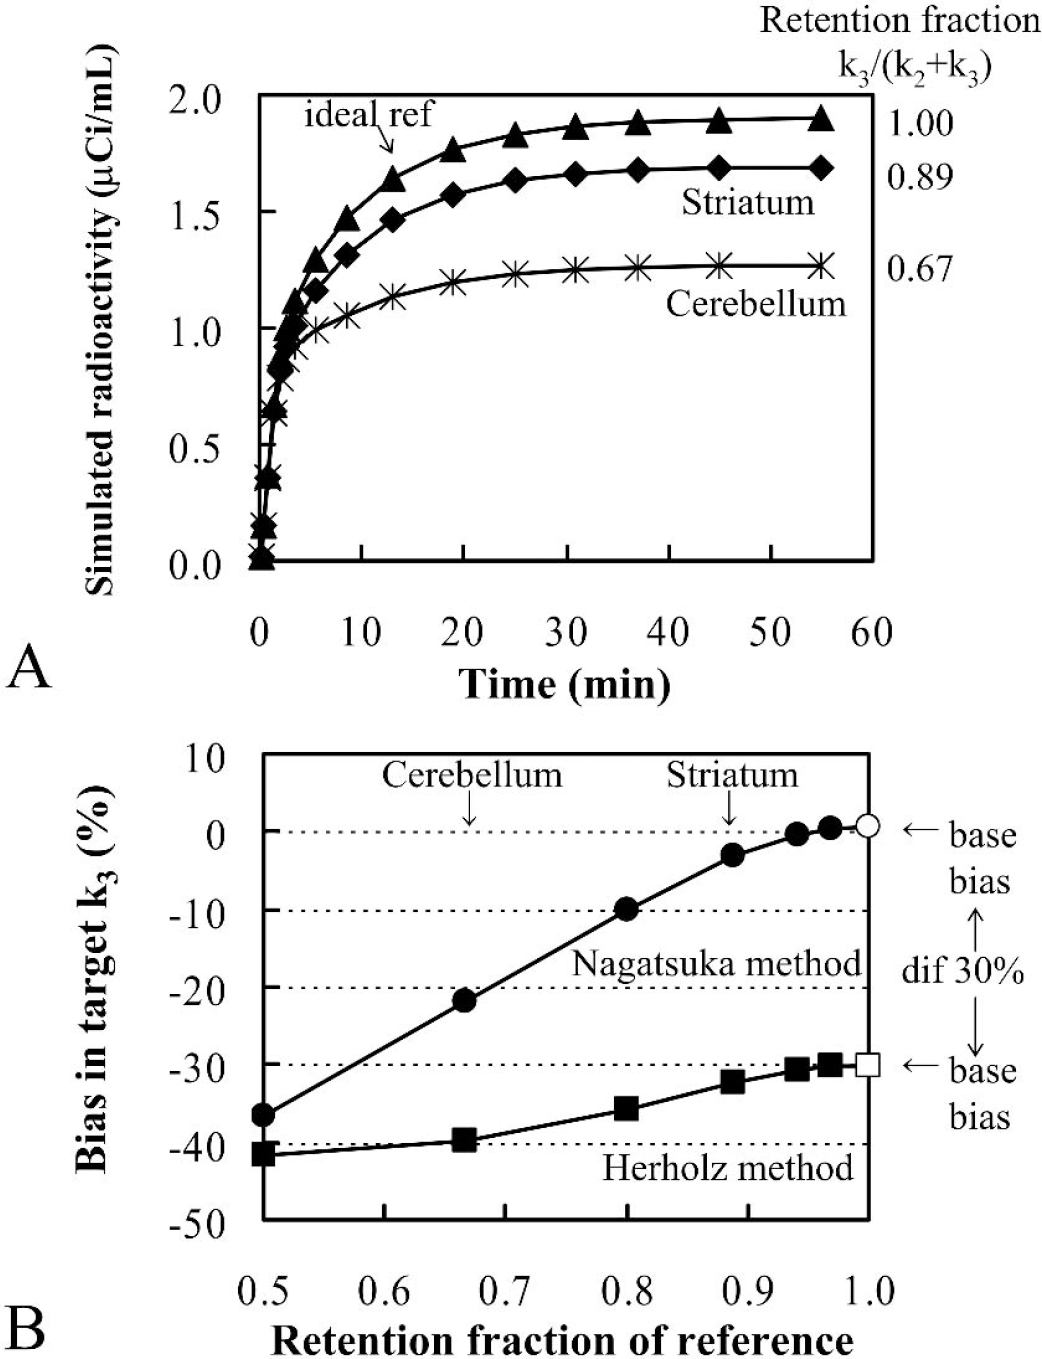
The ratio of k3 to (k2 + k3) was defined as the retention fraction, which becomes almost equal to 1 when k3 is markedly greater than k2. The retention fraction was used as an index for the validity of the assumption of sufficiently rapid hydrolysis of the authentic tracer in the reference region. In the first simulation, the effect of the retention fraction of the reference region when varied from 0.5 to 1 was simulated, because both reference tissue-based analyses were based on the assumption of a markedly larger k3 than k2 and hence a retention fraction almost equal to 1 in the ideal reference region. The time-radioactivity curve for the target region was derived using Eq. 3 with a fixed input function from one subject (Fig. 1) and fixed kinetic parameters (approximate values obtained from the temporal cortex), K1 0.5 mL·min−1·g−1, DV 4 mL/g (k2 0.125 min−1) and k3 0.025 min −1. The same input function and K1 and k2 values were used to derive time-radioactivity curves for the reference region, with k3 varying from 0.125 (retention fraction 0.5) to 512 min−1 (retention fraction 1).
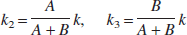
Semilogarithmic plots of total (○) and metabolite-corrected (∘) radioactivity data in the arterial plasma up to 30 minutes after an intravenous injection of 20.0 mCi [11C]MP4P in one healthy subject. Fitting curves extrapolated to the end of PET study are also shown.
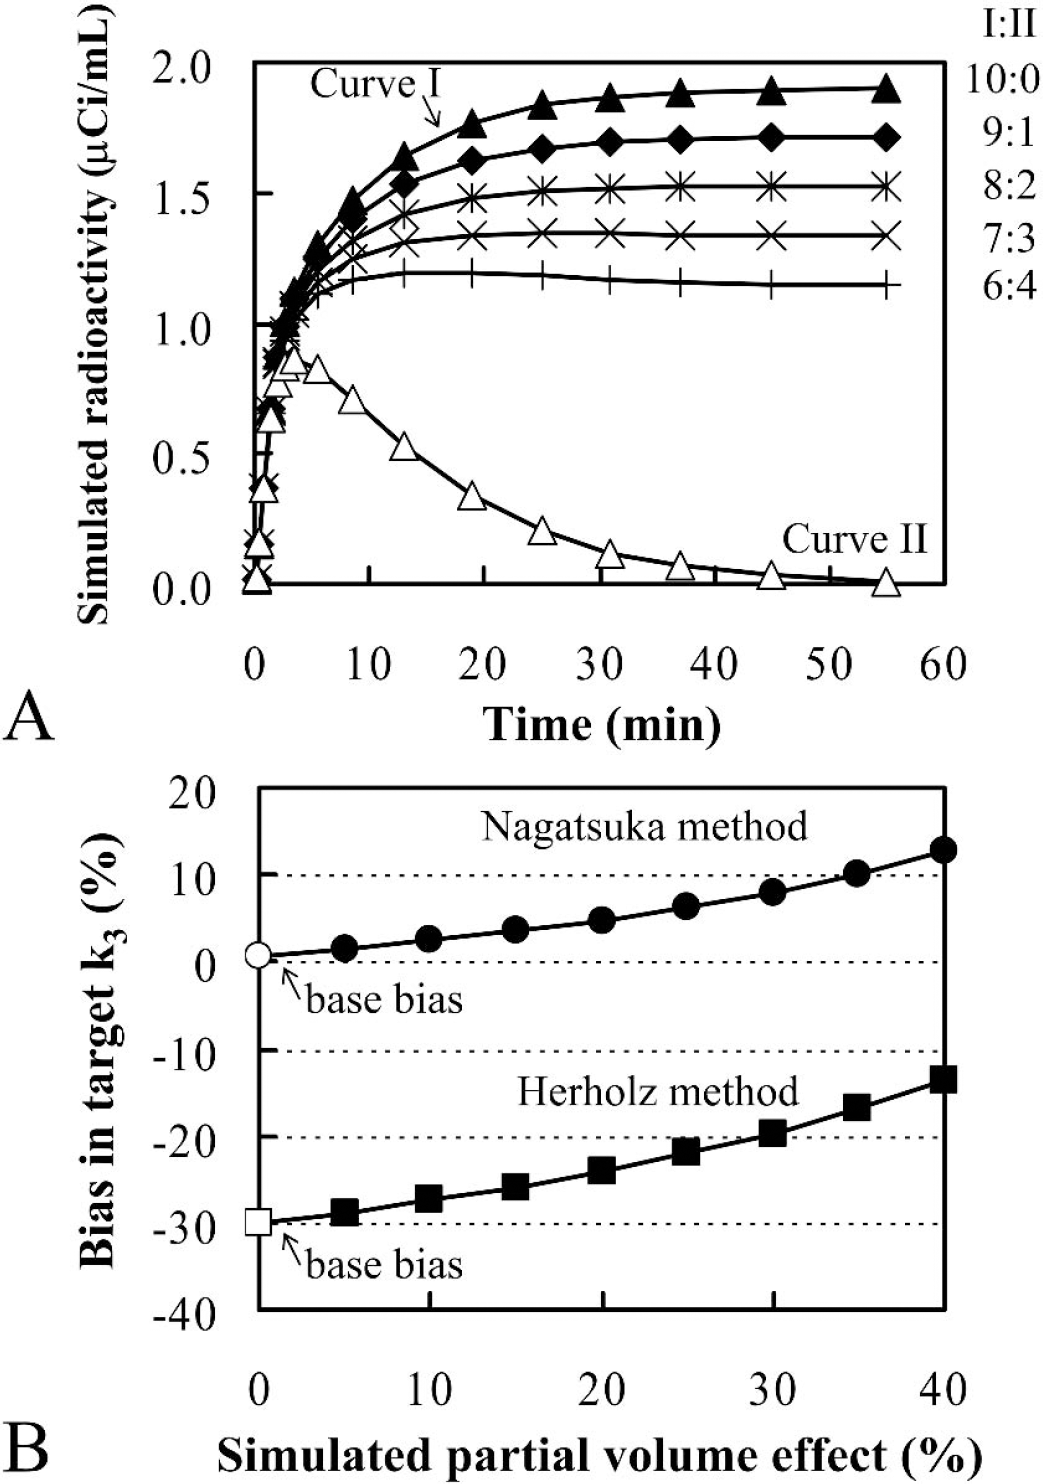
In the second simulation, the partial volume effect in the reference region was considered. The target time-radioactivity curve was obtained as described previously. To obtain the simulated reference time-radioactivity curves with a partial volume effect, two time-radioactivity curves were prepared; that is, an ideal time-radioactivity curve with k3 of 512 min−1 and a time-radioactivity curve of a region with no AChE activity by using a k3 value of 0. Part of the latter data was combined with the ideal data to generate the time-radioactivity curves with a partial volume effect. The percent content of the latter fraction was used as an index of the simulated partial volume effect.
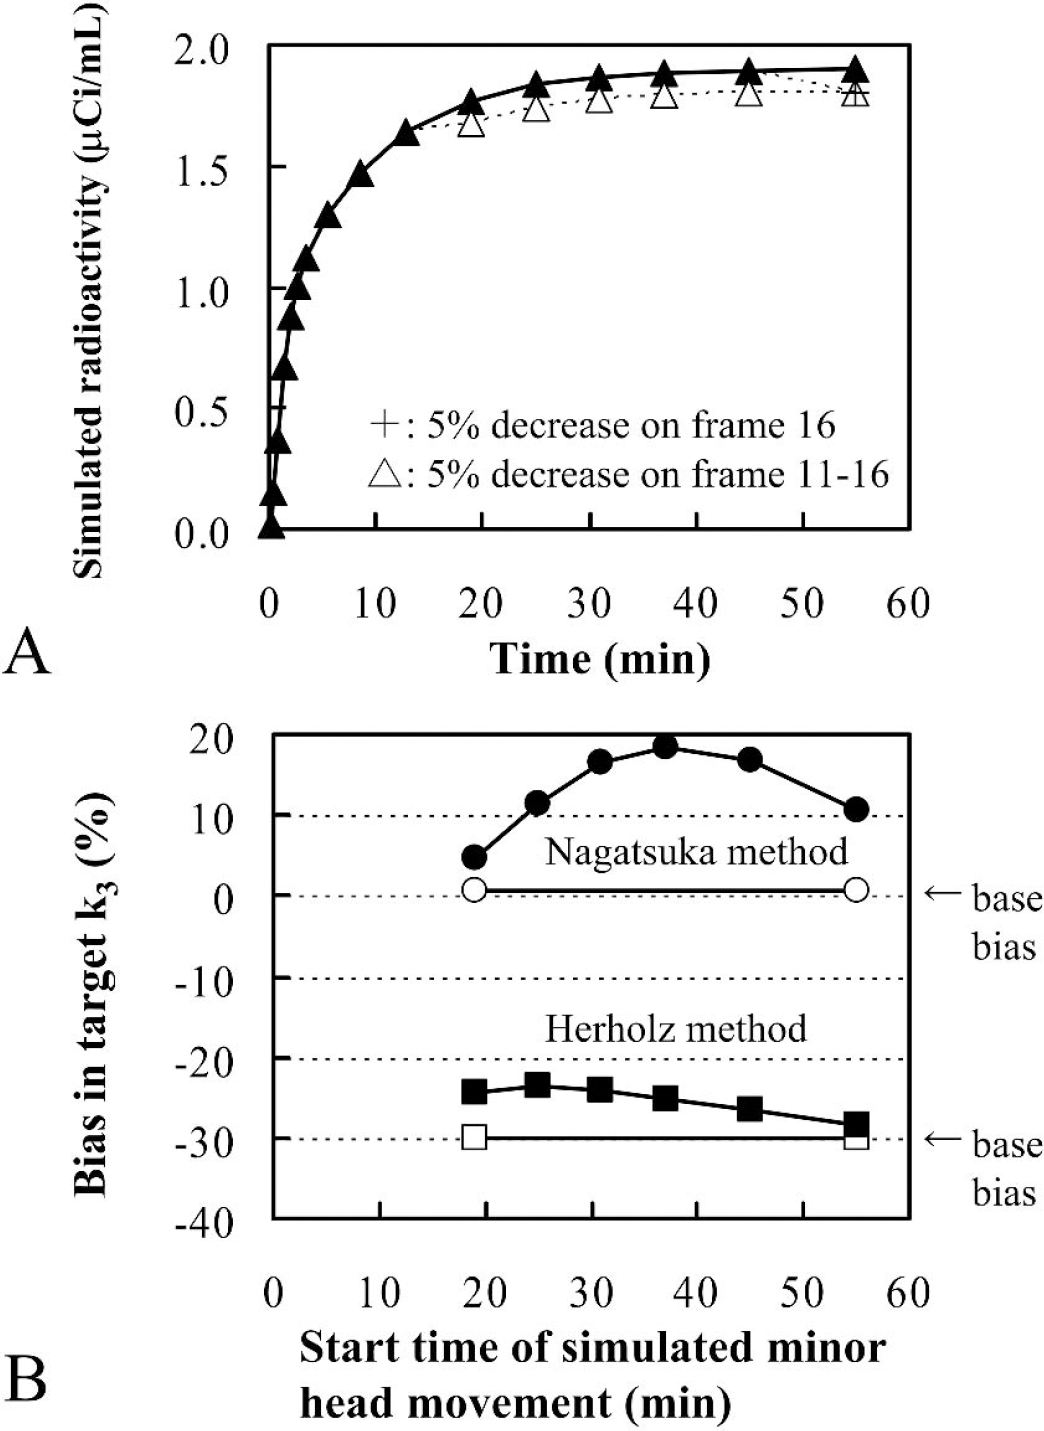
In the third simulation, the effect of minor head movement was investigated, whereby it was simplified so that a slight head movement occurred in a particular scan time frame and the head position was maintained until the last time frame. Target and ideal reference time-radioactivity curves were obtained as described previously. To obtain the simulated reference time-radioactivity curves with head movement artifacts, a 5% decrease was applied to each ideal reference time-radioactivity datum from a particular time frame to the last time frame.
RESULTS
Measurement of input function and parameter estimation by standard nonlinear least squares analysis
Figure 1 shows a typical arterial input function for [11C]MP4P in one subject. Total and metabolite-corrected plasma radioactivity up to 30 minutes after intravenous injection of [11C]MP4P was plotted on logarithmic scale. The input function after 30 minutes was estimated by extrapolation because the authentic tracer was rapidly decreased to below 1% of maximum after 30 minutes.
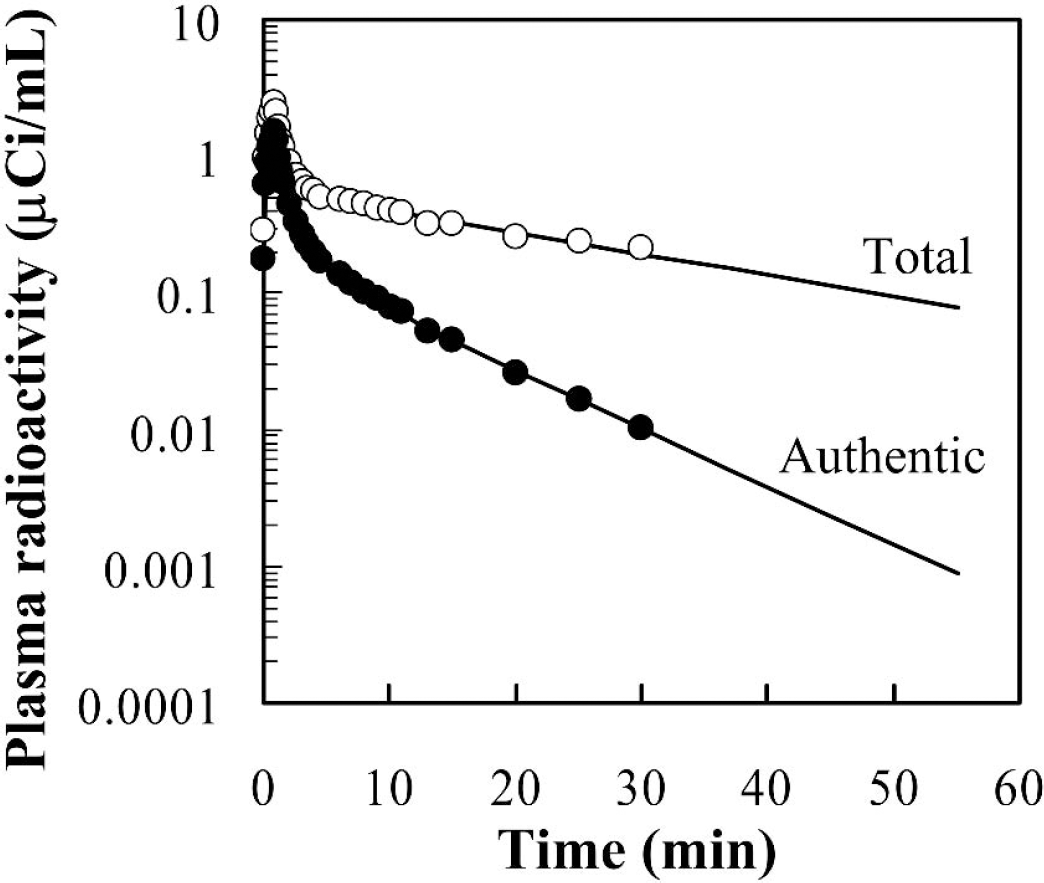
Brain radioactivity time courses, plotted against mid-time of scan frame, in the same subject as in Fig. 1 are shown in Fig. 2. Solid lines represent the fitted curves by standard nonlinear least squares analysis without DV constraint, and the dotted lines for cerebellum and striatum represent those with DV constraint. A biphasic washout pattern was clearly shown in the radioactivity of the cerebral cortex and thalamus. However, an accumulation pattern was seen in the striatum and cerebellum. A plateau phase was generally observed after approximately 25 to 30 minutes on each regional time-radioactivity curve.
Time-radioactivity data in the temporal cortex (∘), thalamus (▪), cerebellum (▴) and striatum (♦) in the same healthy subject as in Fig. 1 after an intravenous injection of 20.0 mCi [11C]MP4P. No significant hemispheric differences were observed; data in only the left side are shown. Solid lines represent the fitted curves without DV constraint and dotted lines for the cerebellum and striatum represent those with DV constraint. The region volume is 3.0 mL for temporal cortex, 1.9 mL for thalamus, 4.0 mL for cerebellum, and 3.2 mL for striatum.
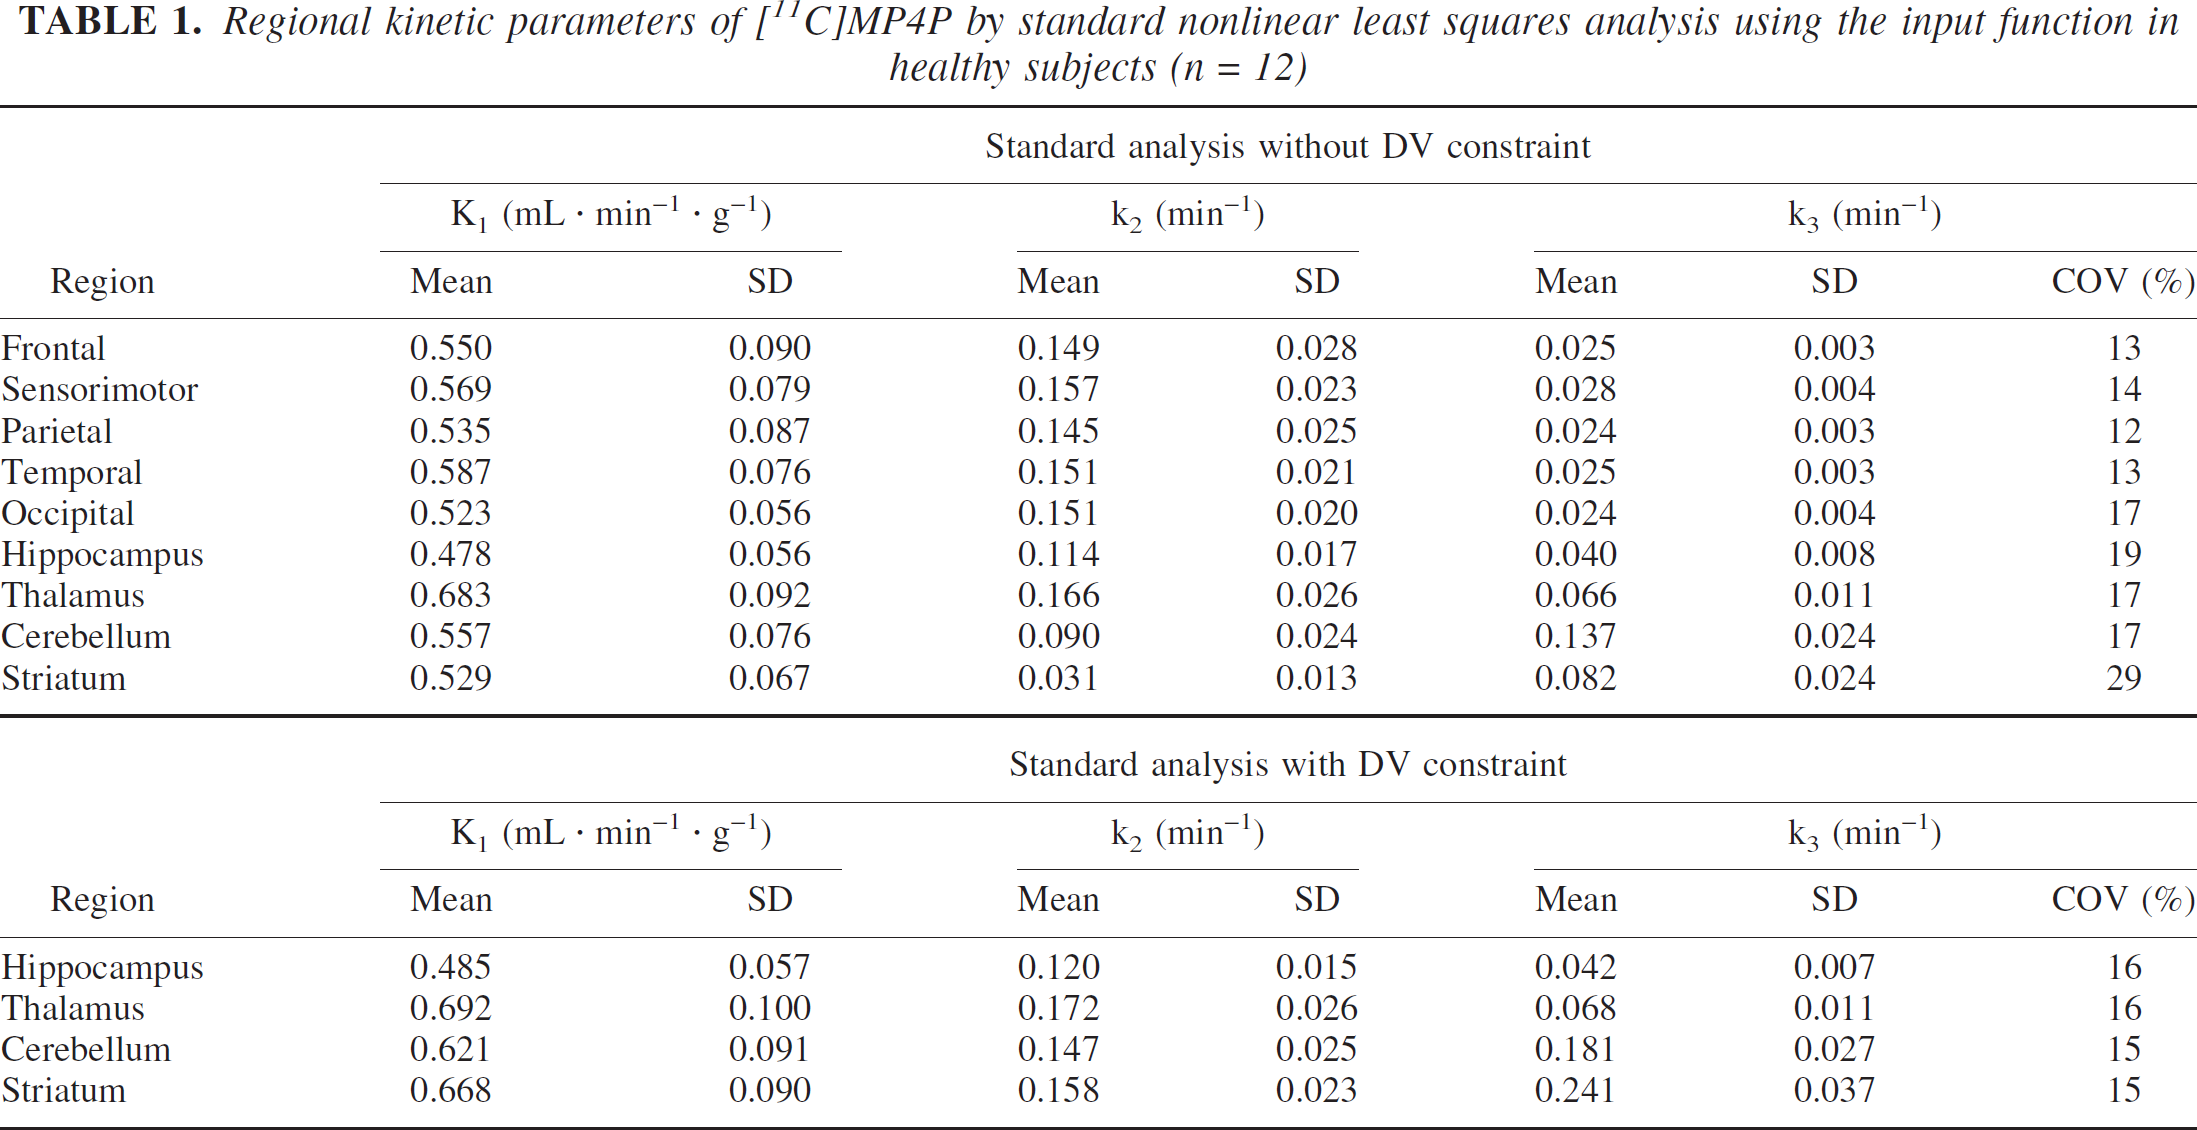
Regional kinetic parameters calculated by the standard analysis are summarized in Table 1. The mean value, SD, and COV (n = 12) of each parameter are shown. Because no significant hemispheric differences were observed in any of the estimated parameters of any regions examined (data not shown), the averaged parameter estimates of left and right sides for given regions for each subject were used. K1 ranged from 0.478 to 0.683 mL·min−1·g−1 and k2 ranged from 0.114 to 0.166 min−1 without DV constraint among all regions except for the cerebellum and striatum. The k3 values were estimated with COV of within 20% for cerebral cortices, thalamus, and cerebellum by analysis without DV constraint, whereas striatal k3 was calculated with COV of 30%. Among 24 values (both hemispheres in 12 subjects), recalculation with DV constraint was required for all calculations in the striatum and cerebellum, for 9 in the thalamus, and 11 in the hippocampus. DV of neocortices were calculated to be 3.7 mL/g on average. With DV constrained analysis, where DV was constrained to be within mean ± 2SD of DV in neocortices, COV was decreased to below 16% for all recalculated regions. The k3 in the thalamus and hippocampus were almost equal to those without constraint, whereas k3 estimates with DV constraint in the cerebellum and striatum were 25% and 66% greater, respectively, than those without constraint. Relative k3 value ratios (temporal cortex/thalamus/cerebellum/striatum) were 1:2.6:5.5:3.2 without DV constraint and 1:2.7:7.2:9.6 with DV constraint. The striatal k3 value was calculated to be the highest among the regions examined with DV constraint, which corresponds, though not linearly, to the highest in vitro AChE activity in the striatum (Arai et al., 1984; Atack et al., 1986); however, the model adaptation, that is, goodness-of-fit of striatal time-radioactivity curve became slightly worse with DV constraint as shown in Fig. 2. Therefore, the striatum was excluded from among the target regions for calculation of k3 values. Hereafter, the parameter values without DV constraint analysis are shown as the standard values except for the cerebellum for which the parameter values with DV constraint are shown.
Regional kinetic parameters of [11C]MP4P by standard nonlinear least squares analysis using the input function in healthy subjects (n = 12)
Regional k3values of [11C]MP4P by striatal reference analyses and shape analysis in healthy subjects (n = 12)
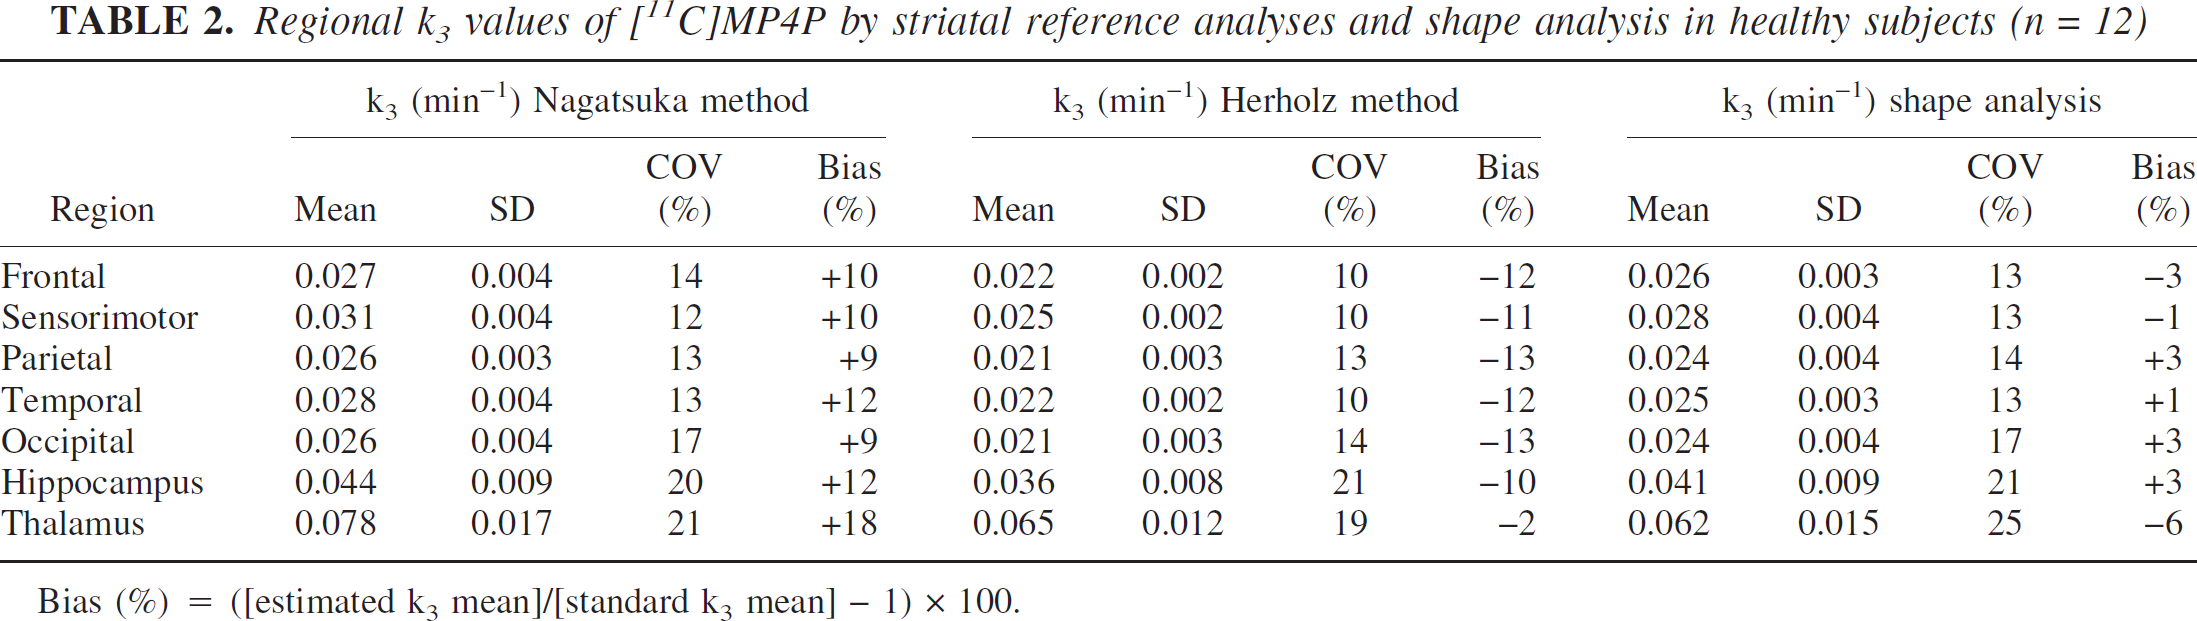
Bias (%) = ([estimated k3 mean]/[standard k3 mean] − 1) × 100.
The k3 in sensorimotor cortex was significantly higher than that in parietal and occipital cortices (Bonferroni/Dunn test, significance level 5%). Significant differences of the regional k3 value within all cerebral neocortices except for the sensorimotor cortex were not observed. The hippocampal k3 was estimated to be approximately 1.6 times larger than that in the temporal cortex.
Parameter estimation by reference tissue-based analyses and shape analysis
The regions that have high AChE activity, such as the striatum and cerebellum, are candidates for the internal reference in reference tissue-based analyses. Regional k3 calculated by striatal reference analyses, where averaged time-radioactivity data of the left and right striatum for each subject were used as reference data, are summarized in Table 2. The mean value, SD, COV (n = 12), and bias are shown. The k3 values, estimated with COV of within 21% by both methods for all calculated regions, were similar to those of standard analysis, ranging from 12% to 19%. The COV within neocortical regions in the Herholz method is slightly smaller than that in the Nagatsuka method and standard analysis. The k3 was overestimated by the Nagatsuka method (+9% to +18%), whereas it was underestimated by the Herholz method (−2% to −13%) compared with standard analysis. The Nagatsuka method gave KR ranging from 0.90 to 1.21 with COV ranging from 8% to 10%, and k2 ranging from 0.078 to 0.109 min−1 with COV ranging from 14% to 22%. The Herholz method gave k2 ranging from 0.068 to 0.108 min −1 with COV ranging from 14% to 25%. Using striatal reference analyses, a reliable calculation of cerebellar k3 was not obtained; the k3 values were calculated with the significantly larger COV (data not shown). When the cerebellum was used as a reference, a moderate-to-large under-estimation was observed for k3 estimations with a larger COV in both methods (data not shown); thus, in this study, the cerebellum was not a suitable reference when using [11C]MP4P.
By using shape analysis, k3 estimates for cerebral cortices and thalamus were also obtained, and showed COVs ranging from 13% to 25% (Table 2). A reliable k3 estimation for the cerebellum by shape analysis was not obtainable.
The regional distributions of k3 within cerebral neocortices, hippocampus, and thalamus in striatal reference analyses and shape analysis were almost the same as that in the standard analysis. The ratio of the k3 value in thalamus to temporal cortex was almost the same across all analyses, ranging from 2.4 to 3.0, which are in good agreement with the ratio of postmortem AChE activity of 2.7 (Arai et al., 1984; Atack et al., 1986). AChE activity in temporal and frontal cortices was reported to be higher than that in parietal and occipital cortices (Arai et al., 1984; Atack et al., 1986). This rank order of the regional k3 value was observed in all analyses, though the difference was not significant.
Computer simulation study for reference tissue-based analyses
The k3 value of 512 min−1 gave an ideal reference curve with a retention fraction equal to 1 (Fig. 3A). In this case, an underestimation of approximately 30% for target k3 estimates relative to true k3 was predicted in the Herholz method, whereas the Nagatsuka method provided only +0.7% of k3 bias (open symbol in Fig. 3B). This bias in the Herholz method was owing to the assumption of sufficiently rapid monoexponential decline of plasma authentic tracer (Eq. 8 in Materials and Methods). Such an assumption was not presented in the Nagatsuka method; the slight bias (+0.7%) in the Nagatsuka method was explained by the errors in numerical integration. Therefore, these biases were used as “base biases” when the additional factors of the reference were considered.
(
The effect of a decreasing retention fraction value of the reference region on the target k3 bias in reference tissue-based analyses was examined (Fig. 3AB). If true k3 values in the cerebellum and striatum were roughly assumed to be 10 and 40 times larger than temporal k3 values for [11C]MP4P as expected from the in vitro AChE activity, k3 values for cerebellum and striatum would be calculated as 0.25 and 1.0 min−1, and retention fraction values would become 0.67 and 0.89 in the cerebellum and striatum, respectively. When the validity of assumption of a markedly greater k3 than k2 was insufficient in the reference region, the underestimation of target k3 in both methods was observed; the effect was larger in the Nagatsuka method than in the Herholz method. A reduction in the retention fraction to 0.89 would produce only a 3% minus-bias in k3, whereas a retention fraction to 0.67 causes 21% underestimation for the Nagatsuka method (Fig. 3B). For the Herholz method, underestimation of k3 was approximately 10% even when the retention fraction was 0.67. In this simulation, the fundamental assumption of an extremely larger k3 relative to k2 in the reference region was assured for both striatal reference analyses.
Next, the partial volume effect of the reference time-radioactivity curve on the target k3 estimates was examined (Fig. 4AB). Simulated biases in target k3 estimates were positive and increased with an increasing partial volume fraction in the reference region. In both methods, the degree of positive bias due to the partial volume effect was similar.
(
A 5% decrease in each reference time-radioactivity data from a particular scan time frame to the last time frame was given to simulate the effect of slight and continuous head movement (Figs. 5A and 5B). The Nagatsuka method gave a relatively large plus-bias (up to 20%) to k3 estimates under the present simulation of minor head movement. In the Herholz method, the k3 bias was also positive, but the degree was relatively small compared with that seen in the Nagatsuka method.
(
Age-associated changes in the normal k3 value
As an application of reference tissue-based analyses for practical study, the age-associated changes in normal k3 values were examined by these analyses as well as standard analysis. The mean k3 values in the neocortical regions of each subject were plotted against age (Fig. 6). In the standard analysis, there was a tendency toward decreasing k3 values with age (r = 0.573), where decline occurred at the rate of 0.33% of the value of the intercept per year. Similar age-associated changes in neocortical k3 values were shown in the Nagatsuka and Herholz methods. The Nagatsuka method showed a 0.42% decrease in k3 per year (r = 0.734, P < 0.05) and the Herholz method showed a 0.27% decrease in k3 per year (r = 0.613, P < 0.05). Age-associated decreases in k3 values were observed in all brain regions examined (data not shown).
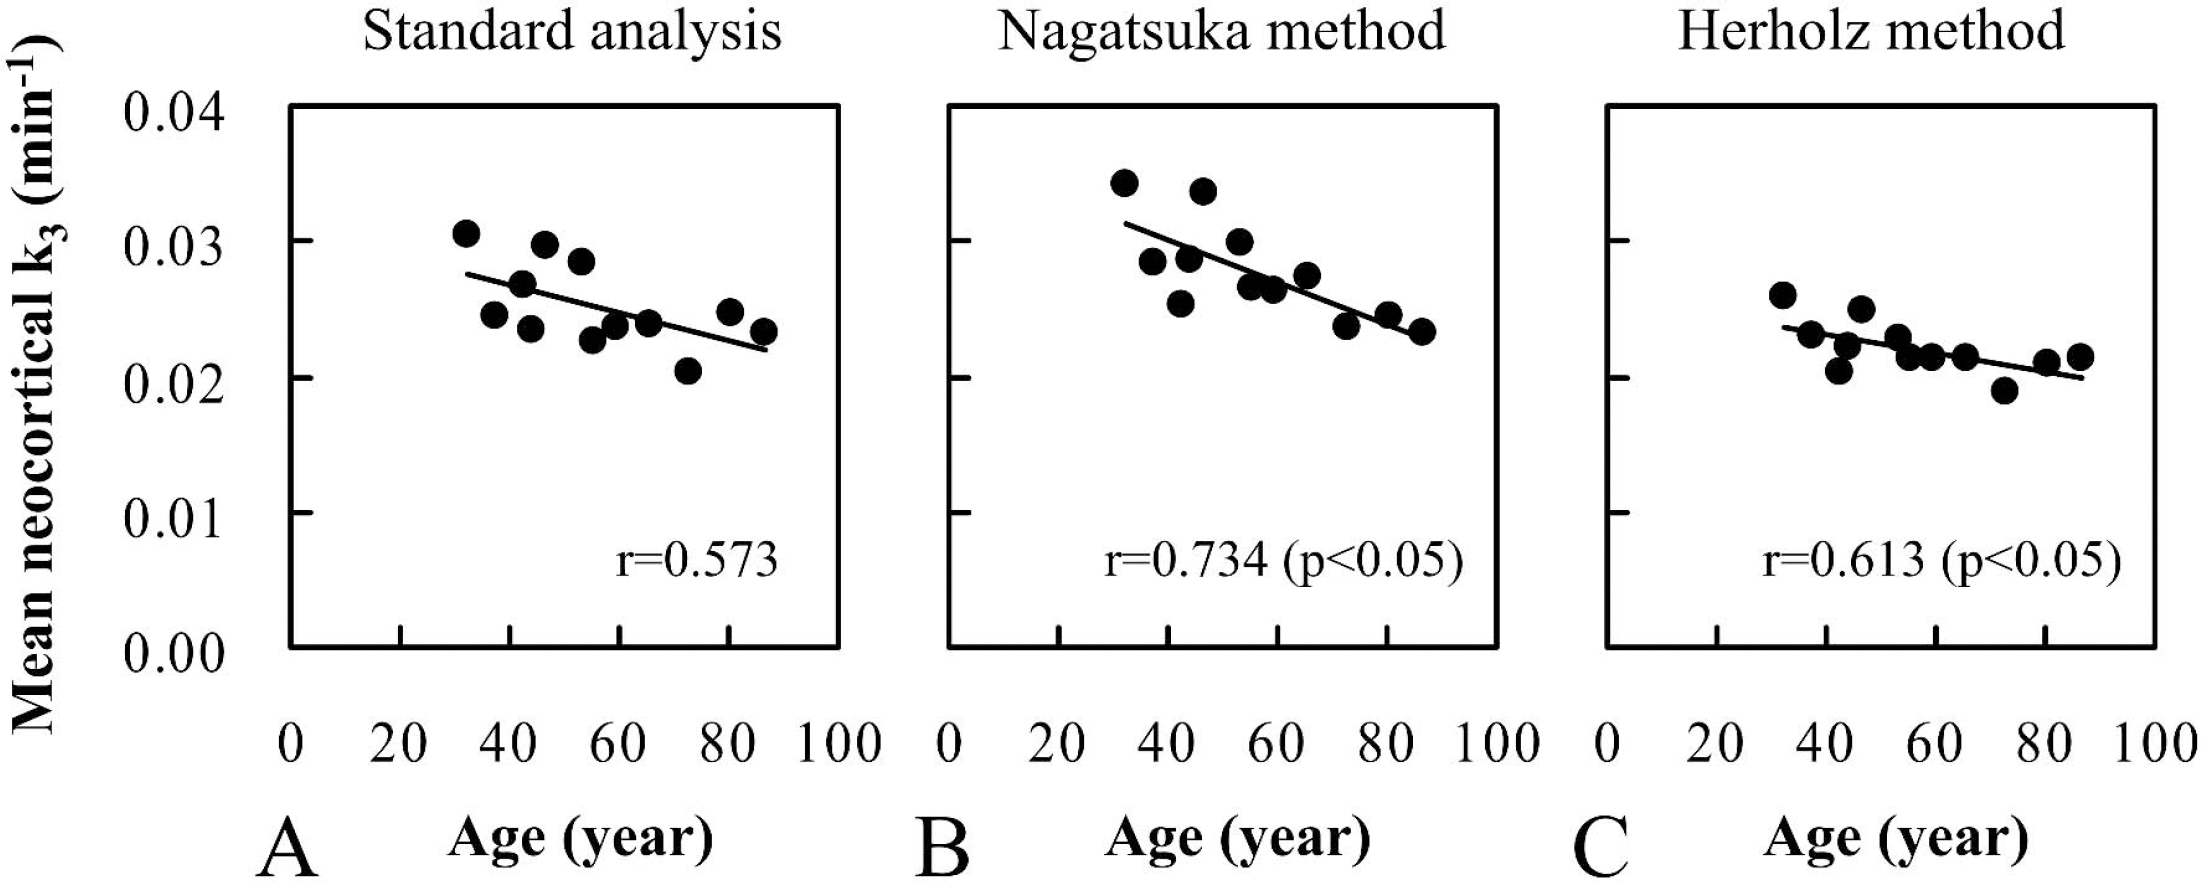
Relationship of mean neocortical k3 values with age in 12 healthy subjects aged 32 to 86 years. The k3 values were calculated by standard analysis (
DISCUSSION
Measurement of input function
[11C]MP4P was rapidly hydrolyzed in plasma after injection, showing δ-function-like disappearance, but its hydrolysis rate was slow compared with that of another acetylcholine analog-type tracer, [11C]MP4A; thus, [11C]MP4P required longer arterial blood sampling time. The authentic-to-total radioactivity ratio in arterial plasma remained at a constant level during the infusion period, and the half-life of [11C]MP4P estimated from this ratio was 62 ± 11 seconds, which is almost twice as long as that of [11C]MP4A (35 seconds) (Namba et al., 1999). Blood data up to 15 minutes were obtained in the case of [11C]MP4A, whereas a sampling time of 30 minutes was necessary to obtain an accurate input function for [11C]MP4P. The area under the time-radioactivity curve (integrated input function) was almost twice as large as that in [11C]MP4A when the same dose was injected to the same subject (data not shown). Because the authentic tracer decreased to below 1% of maximum at 30 minutes in all cases in this study, the uncertainty of extrapolation after 30 minutes would have little effect on the k3 estimates. The feature of input function of [11C]MP4P was in relatively good agreement with that of the previous report with the same tracer (Koeppe et al., 1999).
Appropriateness of nonlinear least squares analysis using input function as a standard analysis
There is a large difference in AChE activity across brain regions; the interrelation of temporal cortex/thalamus/cerebellum/striatal AChE activities is 1/3/8/38, as determined in normal brain postmortem (Atack et al., 1986; Arai et al., 1984). In this [11C]MP4P study, the relative k3 values of thalamus and cerebellum to temporal cortex obtained by nonlinear least squares analysis using arterial input function were approximately 3 and 7, respectively, which corresponded well with the AChE activity and were very close to those obtained by Koeppe et al. (1999) using the same tracer. These results support the validity of the measurement in this study and it is reasonable to regard compartment analysis with the input function as the standard procedure for the evaluation of simplified kinetic analyses, at least in the regions with low (cerebral cortex) and moderate-to-high (thalamus and cerebellum) AChE activity.
Applicability of a high-radioactivity region as a reference region
For the regions with relatively high AChE activity, such as the striatum, the standard compartment analysis would not always yield a precise k3; it results in a larger COV owing to the flow-limitation effect (Koeppe et al., 1999). In this study, for [11C]MP4P, standard analysis without DV constraint also showed a COV of approximately 30% in striatal k3. Moreover, the k3 value did not respond linearly to the AChE activity in that region, and the relative k3 of striatum to temporal cortex was significantly underestimated to be approximately 3. In a region with a high AChE activity, the k2 value was often markedly underestimated because of the increase in the amount of the specifically bound tracer, resulting in a large underestimation in k3 with decreasing k2. Even in the calculation with DV constraint to restrict the underestimation of k2, the ratio of striatal k3 to that of temporal cortex was estimated to be approximately 10, which was still less than the value obtained in postmortem studies. These results suggest that reliable quantification of k3 could not be obtained in the striatum; however, the time-radioactivity curve in the striatum could represent K1 times the integral of the input function due to the sufficiently high hydrolysis rate for [11C]MP4P by AChE, and the striatum was suitable as a reference region in the reference tissue-based analyses of [11C]MP4P.
The fact that a reliable k3 was obtained in the cerebellum by standard analysis suggests the unsuitability of this region as a reference region, which requires a sufficiently high hydrolysis rate for [11C]MP4P by AChE. Actually, when the cerebellum was taken as the reference region, an unreliable target k3 with a significant under-estimation and a large COV was obtained in both reference tissue-based analyses (data not shown). In the case of [11C]MP4A, which has a relatively high hydrolysis rate, quantitative k3 estimates in the cerebellum and striatum were not obtained; however, both regions were applicable as a reference region in the reference tissue-based analyses (Herholz et al., 2001; Nagatsuka et al., 2001). Considering the measurement of AChE activity for patients receiving AChE inhibitors, such as donepezil hydrochloride, the cerebellum in [11C]MP4A PET measurement and the striatum in [11C]MP4P may not be suitable as the reference region, whereas the striatum in [11C]MP4A is likely applicable even in this case.
Tracer comparison with respect to the in vitro hydrolysis rate and in vivo k3
The relative regional distribution of obtained k3 by [11C]MP4P was similar to that of [11C]MP4A (Nagatsuka et al., 2001). The ratio of mean k3 of [11C]MP4A to [11C]MP4P was calculated to be nearly 3 to 4 among cortical regions and thalamus; for example, 3.5 in the temporal cortex by the standard analysis. This ratio was slightly less than the ratio of the rate of hydrolysis between MP4A and MP4P (4 to 5) obtained from brain homogenate assay (data not shown). The average neocortical DV obtained by standard analysis was 3.7 mL/g for [11C]MP4P and 4.3 mL/g for [11C]MP4A, where the difference was mainly due to the somewhat larger k2 estimates for [11C]MP4P. As described previously, k3 estimates tend to increase with increasing k2 estimates, and tend to decrease with decreasing k2 (Koeppe et al., 1999), which may affect the apparent in vivo k3 ratio between [11C]MP4A and [11C]MP4P.
Evaluation of reference tissue-based analyses
The reliability of the Nagatsuka and Herholz methods were evaluated with respect to actual bias and COV in k3 estimates in comparison with the standard analysis. Herholz et al. (2001) proposed their method for [11C]MP4A, which has a high hydrolysis rate; however, the suitability for tracers with a less rapid hydrolysis rate has not been clarified as they described. In this study, the applicability of the Herholz method for [11C]MP4P was also evaluated. There is a certain amount of k3 bias in both striatal reference analyses; that is, +9% to +18% in the Nagatsuka method and −2% to −13% in the Herholz method. Even if an analysis has a moderate bias, it is thought to be efficient with respect to the diagnosis power for patients with decreased AChE activity, as long as the COV of normal k3 value is not so large. Referring to nearly the same COV as with the standard analysis, reliable k3 values were estimated in the cortex and thalamus by striatal reference analyses. A similar COV in k3 measure indicates that there is almost equal efficiency for detecting regions with abnormal AChE activity between the Nagatsuka and Herholz methods. Linear analysis has an advantage to facilitate the calculation for parametric images requiring a large amount of computation time; this is a characteristic feature of Nagatsuka method. The moderate biases in both methods were also appropriately explained by the results of computer simulation as discussed in the following section. In the Herholz method, an underestimation of k3 for [11C]MP4P was expected to be larger than that for [11C]MP4A (Herholz et al., 2001). In the case of lateral or bilateral striatal disorders, the appropriateness of the striatum as the reference region should be carefully examined before analysis and the use of shape analysis should be considered as simplified kinetic analysis (Koeppe et al., 1999; Tanaka et al., 2001).
Evaluation of shape analysis
Shape analysis provided k3 estimates similar to the standard analysis in cortical regions and thalamus with a somewhat larger COV of 13% to 25%. Biases in k3 estimates relative to standard k3 were −6% to +3% among all calculated regions, possibly improved by optimization of the shape analysis procedure (Tanaka et al., 2001). The measurable range was relatively comparable to that in striatal reference analyses. Although the obtainable information was restricted only to be k3 and the k3 values by shape analysis showed a somewhat larger COV than those by striatal reference analyses, the shape analysis is thought to be important as a choice of simplified kinetic analysis, especially when no internal reference region is available.
The base bias in reference tissue-based analyses
Both the Nagatsuka and Herholz methods are based on the assumption of an extremely rapid hydrolysis of tracer in the reference region (Eq. 5). The second approximation in the Herholz method (Eq. 8) refers to the rapid monoexponential decline of authentic tracers in the plasma; that is, markedly larger kp than (k2 + k3). Calculation with an ideal reference showed −30% of the base bias in target k3 in the Herholz method (Fig. 3B), which was a result of the second approximation. Because the half-life of [11C]MP4P estimated from the arterial authentic-to-total radioactivity ratio was approximately 1 minute, kp is roughly estimated to be 0.7 min−1. For target tissue, (k2 + k3) is 0.15 min−1 in this simulation. The approximation of kp − (k2 + k3) by kp probably resulted in the large underestimation of k3 values.
In the case of [11C]MP4A, Herholz and coworkers suggested that 19% to 24% underestimation of k3 would be produced by the second approximation (Zündorf et al., 2002), which is relatively small compared to that estimated for [11C]MP4P, likely because of the more rapid disappearance of plasma [11C]MP4A. In our calculation for [11C]MP4P, the base bias for the Herholz method k3 was shown to be nearly zero by the direct calculation of Eq. 7, instead of using the approximation of Eq. 8 (data not shown). Herholz and coworkers not Only Acknowledged The Kp assumption as a source of bias, but proposed and reported an alternative that removes this bias; the bias of the Herholz et al.'s second assumption is avoidable (Zündorf et al., 2002).
Considering the actually measured k3 biases in striatal reference analyses, there were +9% to +18% bias in the Nagatsuka method and −2% to −13% in the Herholz method. The difference in the actual bias between both methods was approximately 25% for cortical regions. As a rough estimation, it was noted that the 30% of the difference in the base bias between the two methods was generally conserved in the difference in the actual bias, shifting simultaneously to the plus direction by approximately 15%, which suggested that the effects on bias were almost equal and related in the two methods. The cause of such plus-bias effects of a reference time-radioactivity curve was investigated in the following computer simulation study.
Explanation of actual k3 biases in reference tissue-based analyses
Ideal reference time-radioactivity curve with a retention fraction almost equal to 1 represents the integrated input function. If the validity of the assumption of a sufficiently high hydrolysis rate (i.e., an extremely larger k3 than k2 in the reference region is not sufficient), an underestimation in target k3 would result, as shown in Fig. 3AB. The minus-bias effect due to an insufficiently high AChE activity in the reference region indicated by the first simulation did not explain the actual bias in both striatal reference analyses.
The second simulation results, where the partial volume effect of reference time-radioactivity curve on the target k3 estimates was examined, suggested that the partial volume effect produced similar plus-biases in k3 estimates in both the Nagatsuka and Herholz methods (Figs. 4A and 4B). Actual biases in both methods could be partly explained by these effects. Because the shape of the simulated reference curves with the partial volume effect look like that of the actual striatal curve (Fig. 2), the actual striatal curve is probably affected by a partial volume effect. When the additional simulation using actual measured striatal curve was performed with the simulated cortical curve, positive k3 biases were also obtained in both methods (data not shown).
The effects of slight and continuous head movement were considered in the third simulation (Figs. 5A and 5B). The Nagatsuka method is sensitive to unsteadiness of reference time-radioactivity curve as compared to the Herholz method and a moderate plus-bias is thus produced. These changes caused relatively slight effects on k3 estimates in the Herholz method, likely because an exponential curve-fitting process is included in this method.
When the simulation study was summarized, by the Herholz method nearly − 30% of the base bias in k3 was observed without the effect of reference time-radioactivity curve. The base bias in the Nagatsuka method k3 was nearly zero. When the both base biases were shifted simultaneously to the plus-direction by approximately 15%, the resultant biases appropriately explained the actual biases for both methods. Therefore, the first simulation predicting minus-bias in both methods did not explain the actual bias, whereas the second and the third simulations predicted plus-bias and explained the actual biases.
Comparison between striatal reference linear analysis of [11C]MP4P and cerebellar reference linear analysis of [11C]MP4A
Almost bias-free k3 estimates by the Nagatsuka method were previously reported in [11C]MP4A, where the k3 was calculated using the cerebellum as a reference (Nagatsuka et al., 2001). Because the cerebellum is a very large region, it is likely less affected by the partial volume effect and head movement artifacts than the striatum, and the time-radioactivity curve in the cerebellum could be available as more stable. Although striatal reference linear analysis of [11C]MP4P seems to be rather sensitive to such effects as compared with cerebellar reference linear analysis of [11C]MP4A, the appropriateness of using the striatum as a reference was assured in this [11C]MP4P study, showing a nearly equal COV of k3 in striatal reference linear analysis and in standard analysis. To improve the actual plus-bias due to minor head movement artifacts in the Nagatsuka method with [11C]MP4P, the reference time-radioactivity data was fitted with exponential function, resulting in a decrease of plus-bias by 50% at maximum with a nearly equal COV (Fig. 7). In general, the biexponential saturation function provided a better goodness-of-fit. To decrease the partial volume effect, a more precise selection of the caudate nucleus and putamen is necessary. However, this would add another factor of unsteadiness in the reference time-radioactivity curve due to the smaller region size and it may increase COV despite decreasing bias; thus, the improvement is likely restricted.
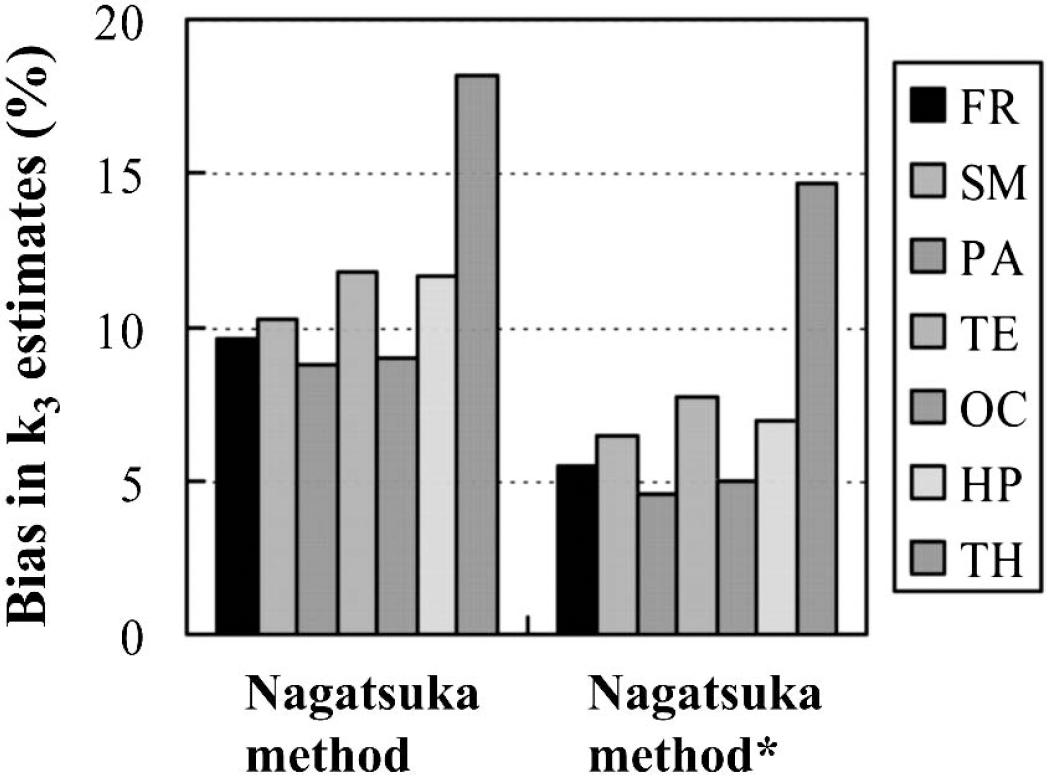
Improvement of bias in k3 estimates in the Nagatsuka method. Biases were calculated as percent differences of the mean k3 by the Nagatsuka method relative to that by standard analysis in 12 healthy subjects. Asterisk indicates the modified procedure, where the reference time-radioactivity data was fitted to a biexponential saturation function and the fitted data points were used for calculation. The regions represented are frontal (FR), sensorimotor (SM), parietal (PA), temporal (TE) and occipital (OC) cortices, hippocampus (HP), and thalamus (TH), from left to right, respectively.
Age-associated changes in the normal k3 value
In the standard analysis, the tendency toward decreasing k3 values with age was shown in all brain regions examined. Similar age-associated effects in regional k3 values were also obtained by reference tissue-based analyses, which support the validity of reference tissue-based analyses. Because the apparent age-associated effects in k3 values were not negligibly small, such effects in the control k3 values should be considered for the study of detecting abnormal changes in AChE activity. The previous studies using [11C]MP4A (Namba et al., 1999) and [11C]MP4P (Kuhl et al., 1999) reported no decreases of k3 values in aged subjects. The discrepancy with the previous studies may be caused by selection bias or random differences due to small sample size.
Conclusions
In the current study, the applicability of two reference tissue-based analyses without arterial blood sampling for measuring brain AChE activity was evaluated in 12 healthy subjects by using [11C]MP4P and PET. Standard compartment analysis provided reliable quantification of k3 estimates in regions with low (neocortices and hippocampus), moderate (thalamus), and high (cerebellum) AChE activity. However, the precise k3 value in the striatum, where AChE activity is the highest, was not obtained. The striatum was used as a reference because the time-radioactivity curve in the striatum corresponded to K1 times the integral of the input function. Reliable k3 estimates were also obtained in regions with low-to-moderate AChE activity by striatal reference analyses. Moderate overestimation of k3 in the Nagatsuka method and moderate underestimation in the Herholz method were appropriately explained by the results of computer simulation. In conclusion, simplified kinetic analyses are practical and useful for the routine analysis of clinical [11C]MP4P studies and should be almost as effective as the standard analysis for detecting regions with abnormal AChE activity.
Footnotes
Acknowledgements
The authors thank Dr. K. Suzuki and the production team staff for their production of isotopes, and the PET operation staff for their acquisition of PET images.