
Abstract
N-[11C]methylpiperidin-4-yl acetate ([11C]MP4A) is a radiotracer that has been used successfully for the quantitative measurement of acetylcholinesterase (AChE) activity in the human brain with positron emission tomography (PET) using a standard compartment model analysis and a metabolite-corrected arterial input function. In the current study, the authors evaluated the applicability of a simple kinetic analysis without blood sampling, namely shape analysis. First, the authors used computer simulations to analyze factors that affect the precision and bias of shape analysis, then optimized the shape analysis procedure for [11C]MP4A. Before shape analysis execution, the later part of dynamic PET data except for the initial 3 minutes were smoothed by fitting to a bi-exponential function followed by linear interpolation of 8 data points between each of adjacent scan frames. Simulations showed that shape analysis yielded estimates of regional metabolic rates of [11C]MP4A by AChE (k3) with acceptable precision and bias in brain regions with low k3 values such as neocortex. Estimates in regions with higher k3 values became progressively more inaccurate. The authors then applied the method to [11C]MP4A PET data in 10 healthy subjects and 20 patients with Alzheimer's disease (AD). There was a highly significant linear correlation in regional k3 estimates between shape and compartment analyses (300 neocortical regions, [shape k3] = 0.93 × [NLS k3], r = 0.89, P < 0.001). Significant reductions in k3 estimates of frontal, temporal, parietal, occipital, and sensorimotor cerebral cortices in patients with AD as compared with controls were observed when using shape analysis (P < 0.013, two-tailed t-test), although these reductions (17% to 20%) were somewhat less than those obtained by compartment analysis (22% to 27%). The sensitivity of shape analysis for detecting neocortical regions with abnormally low k3 in the 20 patients with AD (92 out of 200 regions, 46%) also was somewhat less than compartment analysis (136 out of 200 regions, 68%). However, taking its simplicity and noninvasiveness into account, the authors conclude that quantitative measurement of neocortical AChE activity with shape analysis and [11C]MP4A PET is practical and useful for clinical diagnosis of AD.
The neocortical and hippocampal cholinergic projections in patients with Alzheimer's disease (AD) have been reported to be degenerated in postmortem studies (Davies and Maloney, 1976; Perry et al., 1978; Bierer et al., 1995). The degeneration of the cholinergic nerve system appears biochemically as reduced activity of two cholinergic marker enzymes, choline acetyltransferase and acetylcholinesterase (AChE). The reduction of AChE activity in the cerebral cortex is seen not only in AD, but also in other neurologic disorders such as Parkinson's disease with dementia (Ruberg et al., 1986). Memory and cognitive dysfunction seen in AD and other demented disorders is thought to be linked to abnormal cholinergic function, although other neurotransmitter systems are also involved in these higher order brain functions. In fact, current drug therapy for AD aims at enhancing cholinergic neurotransmission through inhibition of cerebral AChE activity. In vivo determination of cerebral AChE activity, therefore, is of importance not only for diagnostic or biochemical assessment but also for evaluating therapeutics for neurodegenerative disorders.
N-[11C]methylpiperidin-4-yl acetate ([11C]MP4A), an analog of acetylcholine, is selectively hydrolyzed by AChE (Irie et al., 1994, 1996). This tracer is highly lipophilic and passes through the blood-brain barrier in proportion to regional cerebral blood flow (Fig. 1). A portion of [11C]MP4A diffuses back into blood, whereas the remainder is hydrolyzed specifically by AChE into the hydrophilic metabolite, N-methyl-4-piperidinol ([11C]MP4OH), which is trapped in the brain at the site of metabolic reaction. The entire process is described by three functional parameters: K1, representing the rate of tracer penetration into the brain; k2, representing the rate of tracer back-diffusion; and k3, representing the rate of tracer hydrolysis by AChE. In standard compartment model analysis, these parameters are obtained by fitting the time-course of cerebral radioactivity concentration measured by positron emission tomography (PET) with a theoretical function derived from the compartment model and the metabolite-corrected arterial plasma input function using nonlinear least squares (NLS) optimization. The authors have quantified the hydrolysis rate constant k3 for [11C]MP4A in several regions of the living human brain by using NLS analysis (Namba et al., 1998, 1999; Nagatsuka et al., 1998a). Using this method, the authors have shown reduced k3 estimates reflecting decreased AChE activity in the cerebral cortex of patients with AD (Iyo et al., 1997; Shinotoh et al., 2000) and decreased AChE activity in the cerebral cortex and thalamus in patients with Parkinson's disease and progressive supranuclear palsy (Shinotoh et al., 1999). The reduction of cerebral cortical AChE activity in patients with AD has also been demonstrated by PET studies with N-[11C]methylpiperidin-4-yl propionate ([11C]PMP), a tracer similar to [11C]MP4A but with slower AChE hydrolysis rate (Kuhl et al., 1999).
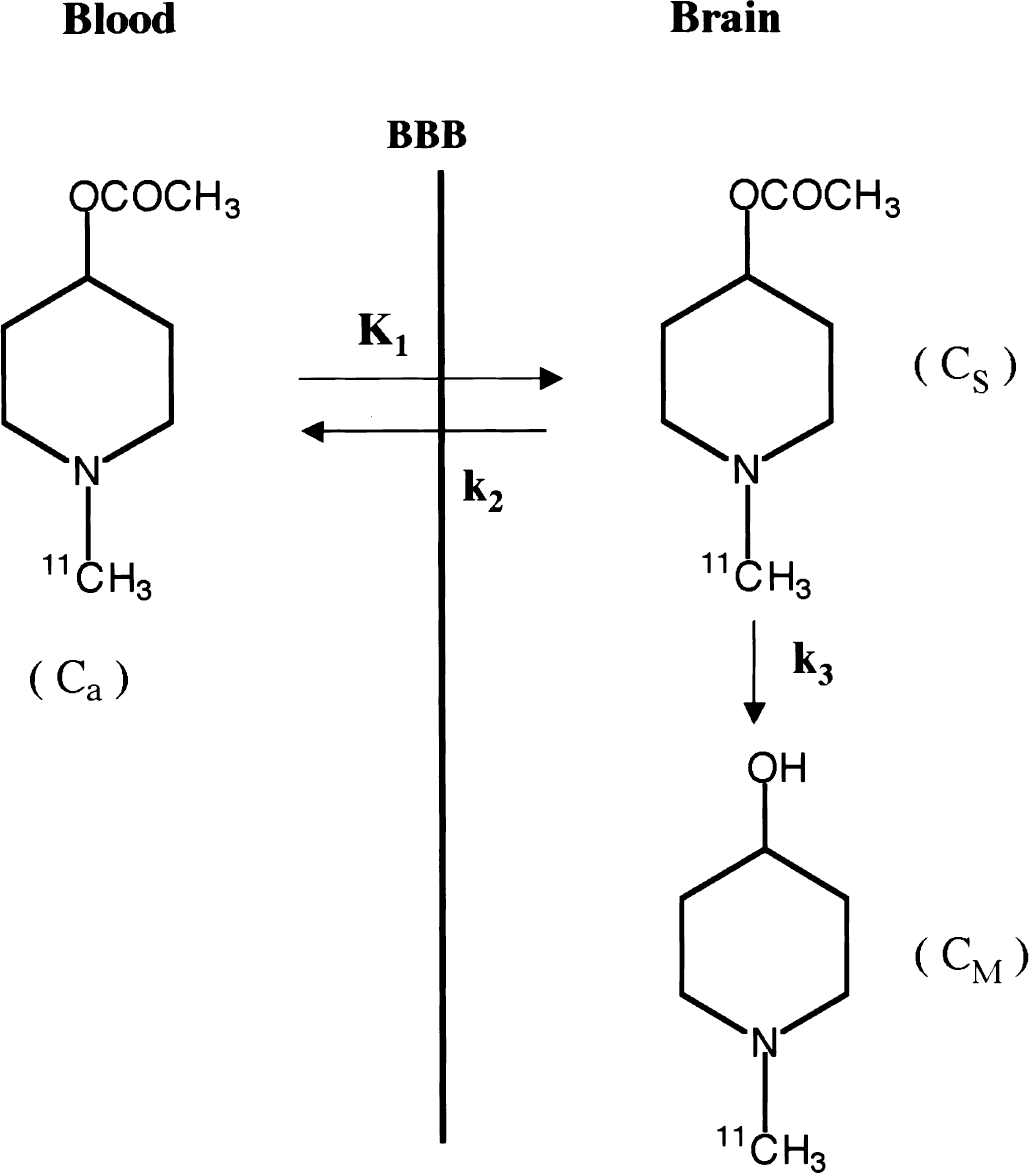
Schematic representation of the three-compartment model of N-[11C]methylpiperidin-4-yl acetate ([11C]MP4A) kinetics. Ca is the concentration of [11C]MP4A in the arterial plasma, CS is the regional cerebral [11C]MP4A concentration, and CM is the regional cerebral metabolite ([11C]MP4OH) concentration. K1, k2, and k3 are transfer rate constants between compartments.
Although standard compartment model analysis is the most reliable method for estimating k3, it requires several people and considerable technical expertise for the arterial blood sampling, which is invasive to patients, and subsequent separation of radioactive metabolites in the plasma from authentic tracer. Precise determination of the arterial input function is of primary importance for standard compartment model analysis. However, difficulties in its measurement prevent routine application of compartment model analysis in clinical practice. Recently, a novel method for direct estimation of k3 without the use of an arterial input function, namely shape analysis, has been proposed (Frey et al., 1997; Koeppe et al., 1999). This method allows quantitative measurement of the inhibition effect of physostigmine on brain AChE activity in human [11C]PMP PET studies, but the detail of the method has not been reported.
The current study evaluates the applicability of shape analysis to the measurement of brain AChE activity using [11C]MP4A. The original shape analysis protocol was modified to fit the properties of [11C]MP4A based on the results of computer-simulation studies. Monte Carlo simulations were performed to determine the precision and bias of k3 estimates by shape analysis as well as by NLS analysis. A clinical evaluation study then was performed on 10 healthy subjects and 20 patients with AD to compare k3 estimates determined by the 2 methods.
Principles of shape analysis
Shape analysis is a method for direct estimation of the rate constant describing an irreversible process, k3, solely from the shape of tissue time-radioactivity curve without the use of an arterial input function. The method is applicable to the category of irreversible radiotracers that satisfy the assumptions outlined below.
Assumption (1)
There is no metabolic product in the brain at the time of the first scan frame, that is, CM(1) = 0 (initial condition), and no substrate remains at the time of the final scan frame, that is, CS(final) = 0 (final condition). The initial condition is satisfied when the duration of the first scan frame is short enough. [11C]MP4A well satisfies the final condition, because AChE activity in red blood cells is very high. The concentration of [11C]MP4A in the blood plasma decreases very rapidly, less than 50% of the initial level by 2 minutes after injection, less than 10% by 5 minutes, and less than 1% by 30 minutes (Fig. 2); thus, a negligible amount of tracer enters the brain after 30 minutes. In addition to the delta-function-like arterial plasma input, elimination of authentic tracer from the brain tissue is rapid, occurring by both back-diffusion (k2) and enzymatic hydrolysis (k3) processes.
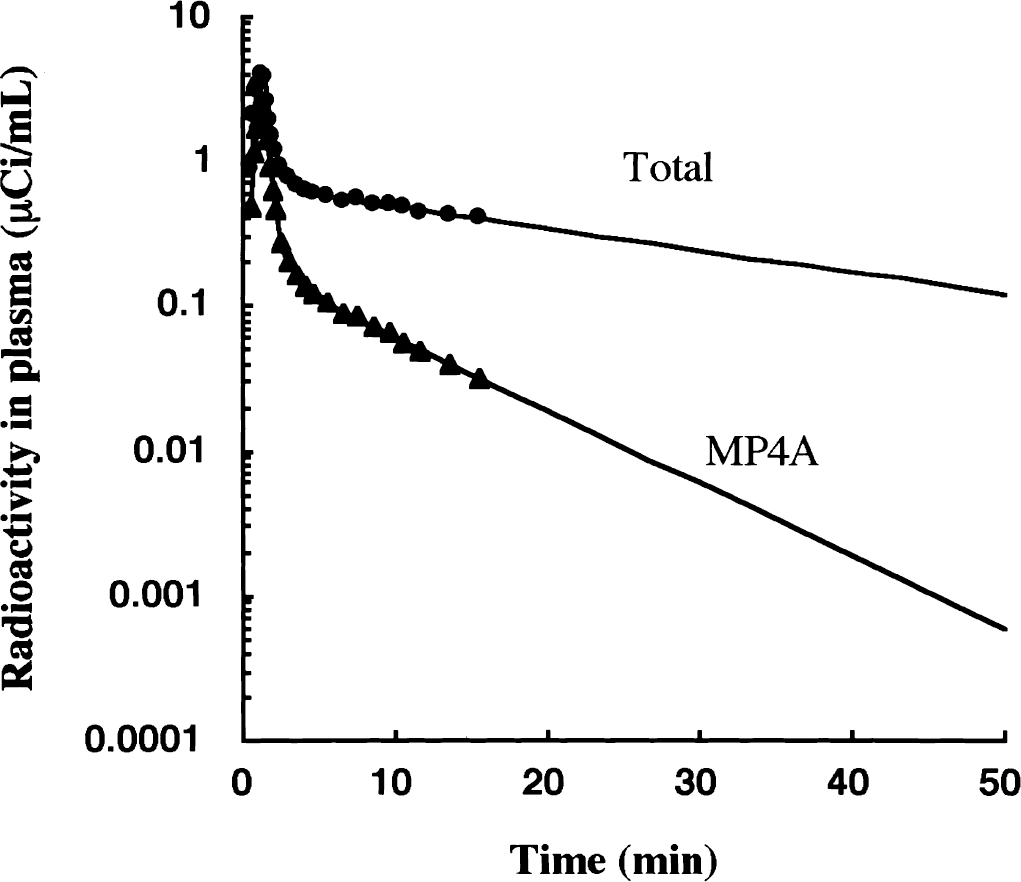
Time-course of total arterial plasma radioactivity (filled circle) and metabolite-corrected input function (filled triangle) after intravenous infusion of N-[11C]methylpiperidin-4-yl acetate ([11C]MP4A) in one particular normal subject. [11C]MP4A is very rapidly hydrolyzed by acetylcholinesterase (AChE) in the blood. The authentic [11C]MP4A concentration is detectable up to 15 minutes after the starting of infusion. The input function after the 15 minutes is obtained by extrapolation of the time-course of measured [11C]MP4A concentration.
Assumption (2)
The metabolite produced within the target tissue is retained completely and also the metabolite produced in the blood does not cross the blood-brain barrier. [11C]MP4A satisfies this assumption. In all brain regions, the time-activity curve reaches a plateau before the end of the PET scan. Animal experiments showed that the metabolite of MP4A, [14C]MP4OH, did not enter the brain because of its hydrophilic nature (Irie et al., 1996).
Assumption (3)
Total radioactivity in the target tissue (CT) consists of authentic tracer (CS) and metabolite (CM), that is, CT(n) = CS(n) + CM(n), where n is the scan frame number. This assumption is not entirely valid for any tracer, especially during the early scan frames in which radioactivity in the cerebral vascular pool is relatively high. The effect of ignoring the vascular pool radioactivity on the k3 bias was, however, less than a few percent for cerebral vascular pool fraction up to 0.05 mL/g in both NLS and shape analyses of [11C]MP4A kinetics. Thus, in the current study, the authors neglect the contribution of vascular pool radioactivity in both methods.
Assumption (4)
The increment in the metabolite radioactivity concentration during scan frame n (n >1) is determined by the amount of substrate in the previous scan frame, the enzyme activity, and the duration of the scan frame-that is, CM(n) - CM(n −1) = k3 × CS(n −1) × DT(n), where DT(n) is duration of the scan frame n. This assumption is valid only when the durations of individual scan frames are short enough so that the regional radioactivity concentration does not change considerably over the course of any frame.
Repeated calculations based on assumption 4 are performed with varying the k3 value. The calculation is terminated when the calculated final metabolite radioactivity becomes equal to the measured (or fitted) final radioactivity in the final scan frame, thus satisfying assumption 1. This shape analysis procedure yields a single estimate of k3. Figure 3 depicts the process of shape analysis calculation for the case when the successful k3 estimate is finally obtained.
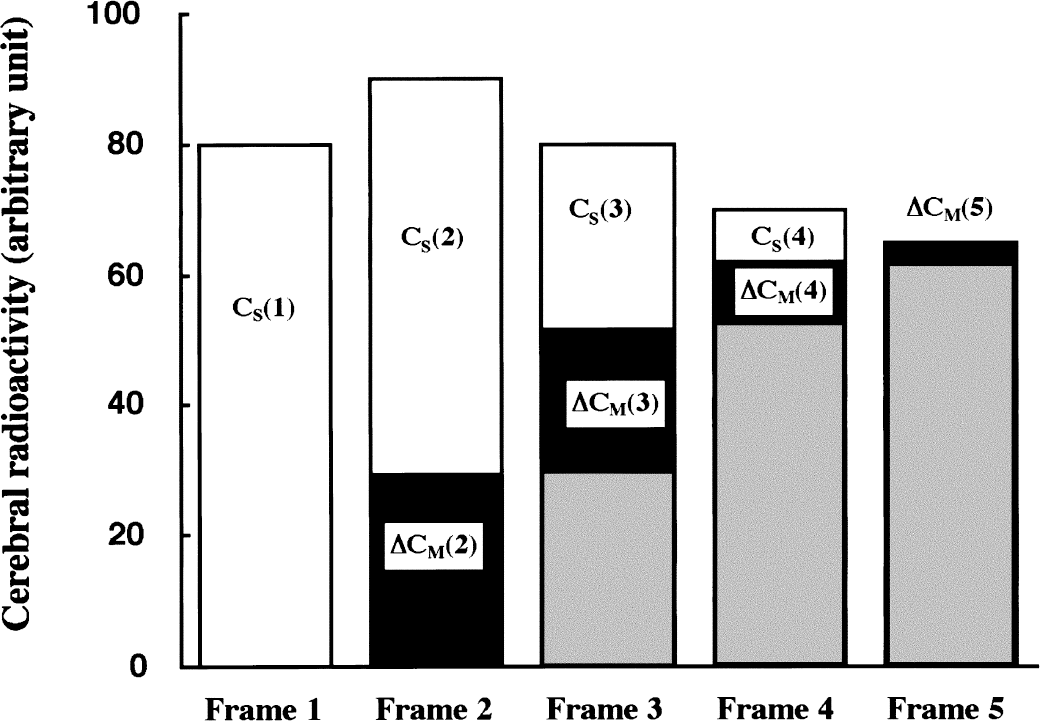
Procedure for obtaining k3 estimate in shape analysis from a simplified cerebral time-radioactivity curve with five scan frames. In each frame (n), the bar represents total radioactivity, CT(n); white area represents authentic tracer, CS(n); and black area represents increment of metabolite, ΔCM(n). Sum of black and gray areas represents accumulated metabolite, CM(n). In the first frame, there is no metabolite and CS(1) = CT(1). In the second, ΔCM(2) is calculated as ΔCM(2) = k3 × CS(1) × DT(2), where DT(2) is the duration time of the second frame. Then, CS(2) is obtained as CT(2) - CM(2). The same calculation is performed in each of the subsequent scan frames.
MATERIALS AND METHODS
Subjects
Two groups of subjects, 10 healthy subjects (normal control, NC group) and 20 patients with AD (AD group), participated in this study. The ages of NC subjects ranged from 48 to 79 years (61 ± 11, mean ± SD). Their Mini-Mental State Examination (MMSE) scores ranged from 28 to 30 (29.4 ± 0.7). None of the subjects had a history of central nervous system disease or psychiatric disorder.
The ages of patients with AD ranged from 47 to 80 years (66 ± 8). Their MMSE scores ranged from 0 to 20 (14.0 ± 4.9). All patients met the National Institute of Neurological and Communicative Disorders and Stroke-Alzheimer's Disease and Related Disorders Association criteria for probable AD (McKhann et al., 1984). Magnetic resonance imaging confirmed the absence of focal cerebral abnormalities in all patients.
This study was approved by the Ethics and Radiation Safety Committee of the National Institute of Radiological Science in Japan. Written informed consent was obtained from each subject and/or a family member.
Positron emission tomography scanning and input function measurement
[11C]MP4A was synthesized as described previously (Namba et al., 1999). Specific activity exceeded 18 GBq/μmol. After a 10-minute transmission scan using a 68Ge-68Ga external standard, each subject received a constant intravenous infusion of tracer in 5 mL of physiologic saline over 60 seconds through an infusion pump. Injected radioactivity was approximately 740 MBq (20 mCi). Data were acquired in two-dimensional mode as a sequence of 16 PET scans (3 × 20 seconds, 3 × 40 seconds, 1 × 1 minute, 2 × 3 minutes, 5 × 6 minutes, 2 × 10 minutes) over a total duration of 60 minutes on a Siemens/CTI ECAT EXACT-47 scanner (CTI PET Systems, Knoxville, TN, U.S.A.). Image reconstruction was performed using a Hanning filter with 0.5 (cycles/projection ray) cutoff with no axial smoothing. Measured attenuation correction was performed on all image sets. After the image reconstruction, regions of interest (ROIs) were placed manually on the summed PET image and transferred to all of the scan frames to generate brain time-radioactivity curves. The corresponding magnetic resonance images were used as anatomic landmarks for frontal (FR), temporal (TE), parietal (PA), occipital (OC), and sensorimotor (SM) cerebral cortices, thalamus, striatum, and cerebellar cortex. No correction for patient motion was applied.
Twenty-four blood samples were withdrawn rapidly through a radial artery catheter into heparinized 1.5 mL tubes containing 0.1 mg physostigmine, an inhibitor of cholinesterases, in 0.01 mL heparinized saline. Blood sampling was started at the time of tracer arrival in the brain and continued for 15 minutes according to the following protocol: 0, 10, 20, 30, 40, 50, 60, 70, 80, 90, 120, 150, 180, 210, 240, 300, 360, 420, 480, 540, 600, 660, 780, and 900 seconds. Plasma was separated from red blood cells by centrifugation and counted in a NaI well counter. A portion of each plasma sample (0.05 mL) was mixed with ethanol (0.1 mL) and centrifuged again to remove proteins. The authentic-to-total radioactivity ratios in the ethanol extracts were measured by an imaging phosphor plate system (BAS-1800; Fuji Photo Film, Tokyo, Japan) after thin layer chromatographic separation on a silica-gel plate developed for 5 minutes using a mixture of ethylacetate-isopropanol-ammonia (15:5:1, v/v) as a solvent system.
The concentration ratio of [11C]MP4A and [11C]MP4OH in both arterial blood and plasma was identical over the time course of blood sampling. The recovery of radioactivity from the plasma by single ethanol extraction was almost complete and the plasma protein binding of MP4A determined in the presence of excess physostigmine was negligible (data not shown). Therefore, the current plasma analysis gives the true input function of [11C]MP4A from the arterial blood to the brain.
Parameter estimation by NLS method
A three-compartment model with an arterial blood compartment and two tissue subcompartments representing authentic tracer (CS) and the metabolite (CM) in the brain was used to estimate K1, k2, and k3 by NLS analysis. The input function (Ca) was obtained by fitting time-radioactivity curve of arterial plasma [11C]MP4A to the following theoretical functions:
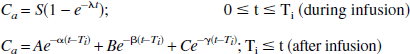
Regional brain time-radioactivity curves were fitted with the theoretic value of total radioactivity concentration (CT) which is calculated as:
The parameters K1, k2, and k3 were obtained by iterative calculations of NLS optimization using the weight factor of relative radioactivity disintegration number in each ROI. The time delay of input function between brain and blood sampling site was corrected in the NLS fitting process (Namba et al., 1999).
Parameter estimation by shape analysis
Based on the results of the optimization studies (see Results), the following conditions were used for k3 estimation. In practice, 15 scan frames (50 minutes) were used for shape analysis calculation. The last 9 scan frames of each time-radioactivity curve were fitted to a steadily decreasing bi-exponential function with negativity constraint for the exponents. The PET data consisting of observed (from 0 to 3 minutes) and fitted (from 3 to 50 minutes) data points were then linearly interpolated to yield an 8-fold increase in the number of data points before shape analysis calculation. In the case of simulation studies for optimization of shape analysis protocol, simulations were performed without brain curve fitting.
Using the interpolated time-radioactivity curve and the equation described above, the radioactivity of authentic tracer and metabolite in each time point was calculated with varying the k3 value. The calculation was terminated when a difference between the calculated and the measured (or fitted) final metabolite radioactivity became less than 0.0001% using numerical least squares optimization (quasi-Newton method included in Solver/Microsoft Excel 98).
Figure 4 shows an example of k3 estimation using NLS (Fig. 4A) and shape (Fig. 4B) analyses. In spite of using no information about the time course of arterial tracer concentration, shape analysis gives almost identical theoretic curves of total, authentic tracer, and metabolite radioactivity as those in the NLS analysis.
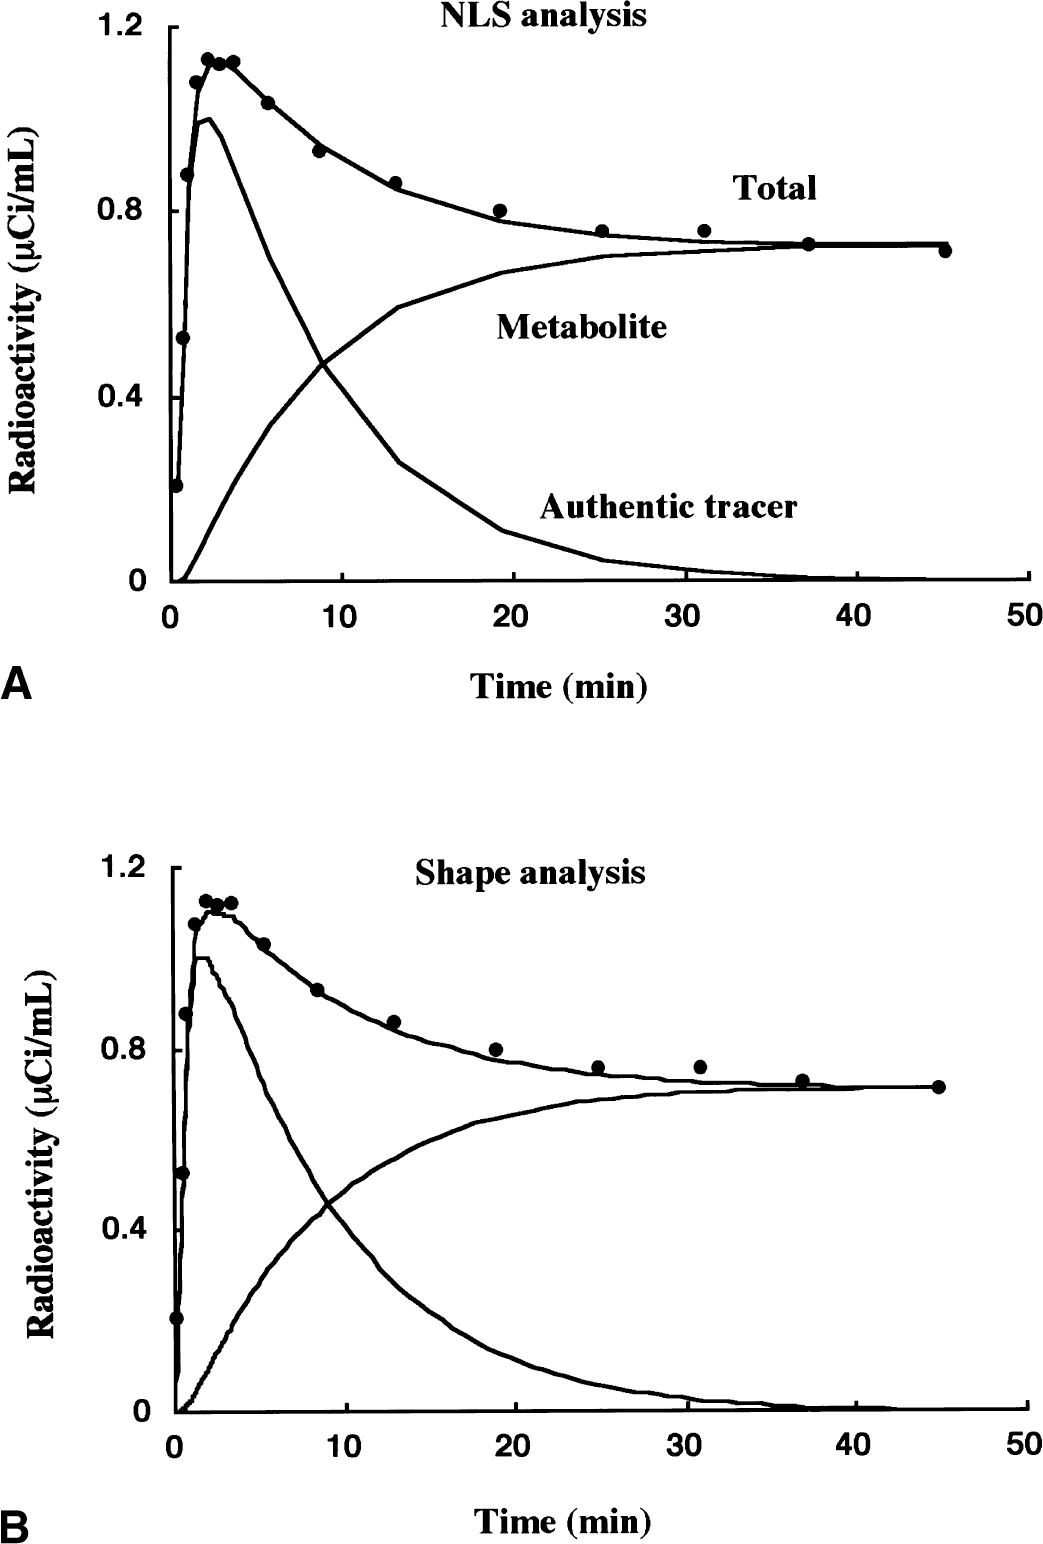
Examples of k3 estimation by nonlinear least squares (NLS)
Optimization of the shape analysis protocol
To perform simulation studies to optimize the shape analysis procedure, two standard time-radioactivity curves were generated from the three-compartment model configuration. The first curve representing the kinetics of normal cortex (NC curve) was generated using a typical arterial input function obtained from 1 particular normal subject and the averaged kinetic parameters of the temporal cortex obtained from the 10 NC subjects (K1, 0.559 mL g−1 min−1; k2, 0.125 min−1; k3, 0.087 min−1). The second curve representing AD cortex kinetics (AD curve) was generated with the same input function used for the NC curve and the averaged kinetic parameters of the temporal cortex obtained from the 20 patients with AD (K1, 0.422 mL g−1 min−1; k2, 0.102 min−1; k3, 0.065 min−1). These curves were subjected to subsequent optimization studies for shape analysis without smoothing the later data using a bi-exponential function. The effects of data interpolation were examined with various linear interpolation levels. The effects of errors in individual data points and total scan duration required for shape analysis calculation were examined with linear data interpolation of eight points. The evaluation of bias was performed by calculating the difference between the k3 estimate obtained by shape analysis and the true k3 value-that is, bias (%) = ([shape k3] / [true k3] − 1) × 100.
Monte Carlo simulations
Monte Carlo simulation studies were performed to assess the precision and bias of k3 estimates obtained from NLS and shape analyses. A series of standard time-radioactivity curves were generated from the three-compartment model configuration using the same input function as was used for the optimization simulations. In this approach, fixed K1 (0.559 mL g−1 min−1) and k2 (0.125 min−1) values with k3 values varying from 0.02 to 0.20 min−1 were used to derive standard error-free time-radioactivity curves. For each k3 condition, 100 different time-radioactivity data sets were generated by adding Gaussian random error derived from the estimated PET data error to each time point of the error-free time-radioactivity curve. Data sets were subjected to NLS analysis and shape analysis with smoothing of the later data using a bi-exponential function and linear data interpolation of eight points. The mean and SD of the 100 k3 estimates then were used to calculate the bias as percent difference of the mean k3 estimate relative to the true k3 value, and the precision as the coefficient of variation (COV) of 100 k3 estimates.
Positron emission tomography data error was estimated from the relation between ROI count and pixel COV in 96 human ROI data (two cortical ROI from 16 scan frames of 3 NC subjects) (Fig. 5). Count COV (in an arbitrary unit) was calculated as:
where ROI count represents the total number of 11C disintegration in a ROI, which was calculated from radioactivity concentration (Bq/mL), ROI volume (mL), duration of time frame (seconds), and the decay constant of 11C. Region of interest COV was calculated as:
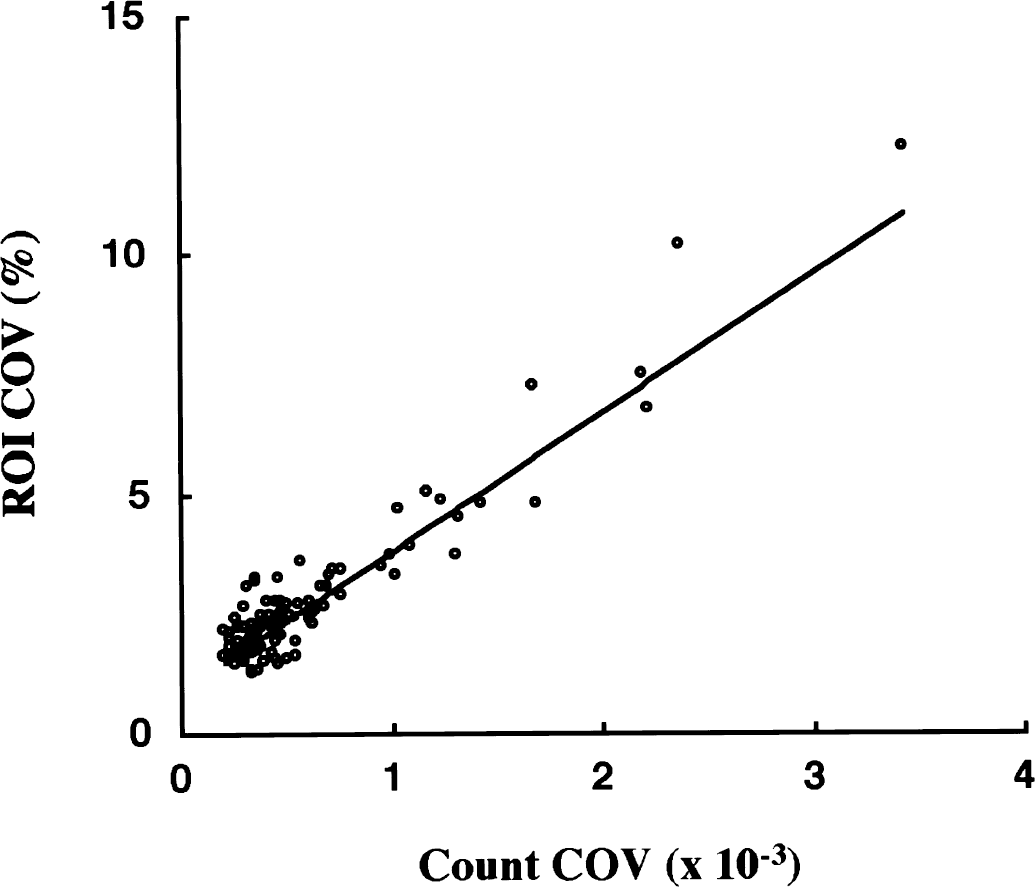
Relation between count coefficient of variation (COV) and region of interest (ROI) COV. Each data point represents one ROI in one scan frame of a dynamic positron emission tomography (PET) study measured in each of three NC subjects. By using the weighted linear regression equation, [ROI COV] = 2910 × [count COV] + 0.90, COV of PET data was estimated to generate data for Monte Carlo simulation studies.
The calculated ROI COV for 96 human ROI data ranged from 1.2% to 12% (mean = 2.8%). The relation between the count COV (X) and ROI COV (Y) was expressed as Y = 2910X + 0.90 (r = 0.94, P < 0.001) using weighting factors of Y−1. This equation was used to derive PET data error from the standard time-radioactivity curves in Monte Carlo simulations.
Clinical evaluation study
Kinetic parameters were estimated by NLS analysis using cerebral time-radioactivity curves containing 14 (40 minutes), 15 (50 minutes), and all 16 (60 minutes) scan frames. Kinetic parameters obtained from 16 scan frames were used in the current study because NLS analysis gave identical k3 values in these scan frame conditions (Namba et al., 1999).
Estimation of k3 by shape analysis was performed for 10 cortical regions (FR, TE, PA, OC, and SM in each hemisphere) of both NC and AD subjects. For the thalamus, striatum, and cerebellar cortex, shape analysis gave unreliable k3 estimates because AChE activities of these regions are too high for k3 estimation by shape analysis (flow-limitation effects, see results of Monte Carlo simulation). The comparison of k3 values obtained from NLS and shape analyses was, therefore, restricted to these 10 cortical regions.
The relation of k3 estimates between NLS and shape analyses obtained from 10 NC subjects (100 cortical ROI data) and 20 AD subjects (200 cortical ROI data) was examined by a linear regression analysis without y-intercept and with no weighting factor. Reductions in k3 estimates of five cortical regions (FR, TE, PA, OC, and SM; mean of both hemispheres) in the AD group as compared with the NC group were evaluated by using two-tailed t-test with Bonferroni correction.
The diagnostic power of shape analysis was evaluated by the following method. By using NLS analysis, 200 cortical ROI from 20 patients with AD (5 cortical regions in both right and left hemispheres) were classified as positive (A) or nonpositive (Ac) by whether their k3 values were significantly low (z-test; P < 0.05) or not as compared with the NC population. Similarly, by using the shape analysis, 200 ROI were classified as positive (B) or nonpositive (Bc). As for shape analysis, the authors define true-positive (TP) ROI, false-negative (FN) ROI, and false-positive (FP) ROI as:

As a measure of the diagnostic power of shape analysis, the authors define the sensitivity of shape analysis as:
RESULTS
Optimization of the shape analysis protocol
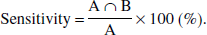
In shape analysis, calculation of k3 is achieved based on the difference equation, CM(n) - CM(n − 1) = k3 × CS(n − 1) × DT(n), which describes the metabolite formation process. To estimate a k3 measure accurately, the PET data must be interpolated so that the length of each scan frame is short enough to avoid significant radioactivity concentration change over the duration of PET scan. The actual scan frames were too long to meet this requirement; thus, the effect of PET data interpolation was examined (Fig. 6). Greater interpolation effects were seen for the NC curve (more rapid hydrolysis) than the AD curve. At interpolation levels less than a factor of 4, significant biases in k3 were observed. These were −24% and −10% with no interpolation, −13% and −5.9% at 1, −8.5% and −3.8% at 2, −6.2% and −2.5% at 2, and −4.8% and −1.7% at 4 points of interpolation, for NC and AD curves, respectively. When the interpolation density was increased further, the bias became nearly constant at approximately −2% for NC and +1% for AD. In the current study, data interpolation of 8 points was used for shape analysis giving less than 3% underestimation for regions with normal kinetics and almost no bias for regions with AD kinetics.
Simulation of the effect of linear data interpolation on k3 estimates by shape analysis in the normal control (NC) curve (open circle) and the Alzheimer's disease (AD) curve (filled triangle). Dependence of the k3 biases on the level of interpolation added between each consecutive positron emission tomography (PET) scan frame is shown. The true k3 value is 0.087 min−1. Negligible bias was achieved at interpolation number of 6 in the AD curve and approximately 20 in the NC curve, respectively.
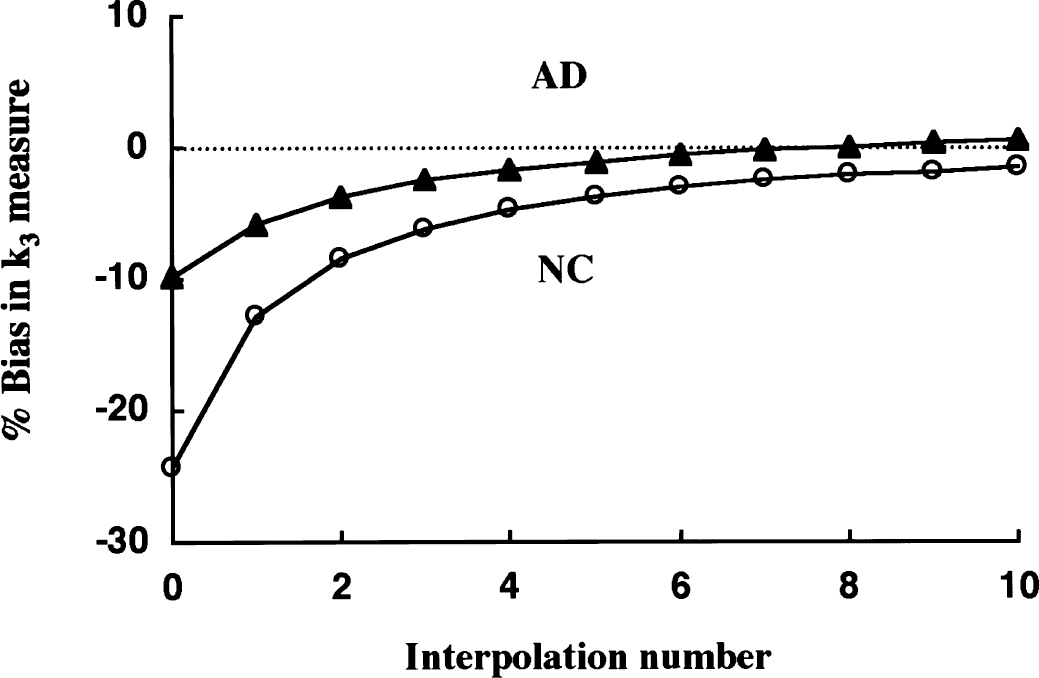
The final value of the brain time-radioactivity curve is of critical importance for shape analysis because the operative equation requires that the total calculated accumulation of metabolite in the brain must equal the final measured PET concentration. A simulation study was performed to examine how errors in a single PET scan frame propagate into the shape analysis estimate of k3 (Fig. 7). Using the NC curve, either a +3% or −3% error was added to a single scan frame and the k3 value of this biased curve was estimated by the shape analysis. When errors were applied to early scan frames, the k3 bias was rather small and was of the opposite sign (that is, a positive error in the PET data caused an underestimation of k3). This is because a positive error in PET before the end of the scan results in an overestimation of C
Simulation of the effect of errors of single scan frames on the k3 estimates by shape analysis in the normal control (NC) curve
Shape analysis assumes that there is no authentic tracer at the end of PET scan. When the metabolic rate of the tracer (k3) is slow, and/or when the rate of back-diffusion (k2) is slow, and/or when the PET scan duration is too short, this assumption no longer may be valid. In such cases, shape analysis will give greater k3 estimates than the true value. A suitable PET scan duration for k3 calculation by shape analysis, therefore, is dependent on the hydrolysis rate and the blood-brain barrier transport rates of the tracer used and on the enzyme activity of the ROI in question. For this reason, the effect of PET scan duration on the k3 estimation by shape analysis was examined. Estimates of k3 were calculated with both NLS and shape analyses using from 12 (28 minutes) to 18 scan frames (80 minutes). In the case of NLS analysis, no dependence of k3 estimates on total scanning time was observed (Namba et al., 1999). However, considerable scanning time effects were observed when using shape analysis (Fig. 8). The k3 biases were −5% to −2% between 80 and 50 minutes, then increased gradually, reaching 16% and 27% when only 28 minutes of data was used in NC and AD curves, respectively. Because the smallest k3 bias was observed at approximately 50 minutes, this condition was selected for the shape analysis calculation of human [11C]MP4A PET data.
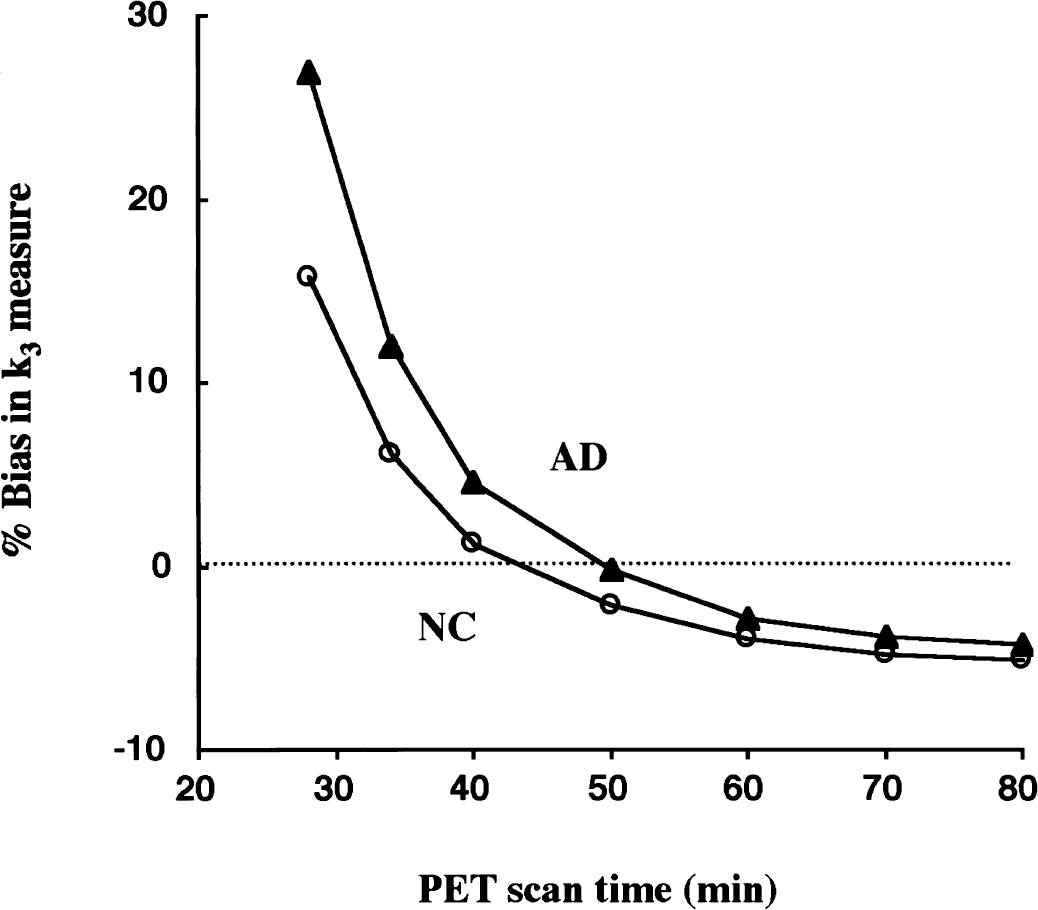
Simulation of the effect of total positron emission tomography (PET) scan duration on k3 estimates by shape analysis. The k3 biases are shown as a function of scan duration used as the calculation time for shape analysis in each of normal control (NC) curve (open circles) and Alzheimer's disease (AD) curve (filled triangles). The k3 bias at shorter scan duration is large and almost zero bias is observed at approximately 45 to 50 minutes.
Monte Carlo simulations
In the Monte Carlo simulation studies, the effect of the magnitude of k3 value on the precision and bias of k3 estimates was examined for both NLS and shape analyses. The COV of k3 estimates (Fig. 9A) by NLS analysis remained less than 10% across the k3 range tested, although the COV gradually increased with increasing k3. The k3 COV for shape analysis was dependent more dramatically on the value of k3. Although the COV was less than 10% up to k3 value of 0.10 min−1, COV increased steeply above the k3 value of 0.10 min−1: 12% at 0.12 min−1, 23% at 0.14 min−1, and 27% at 0.16 min−1. The bias in k3 estimates (Fig. 9B) by NLS analysis was less than 2% for k3 values ranging from 0.02 to 0.20 min−1. In contrast, much larger k3 effects were observed with shape analysis in which the bias ranged from −6% at k3 value of 0.02 min−1 to 10% at 0.2 min−1.
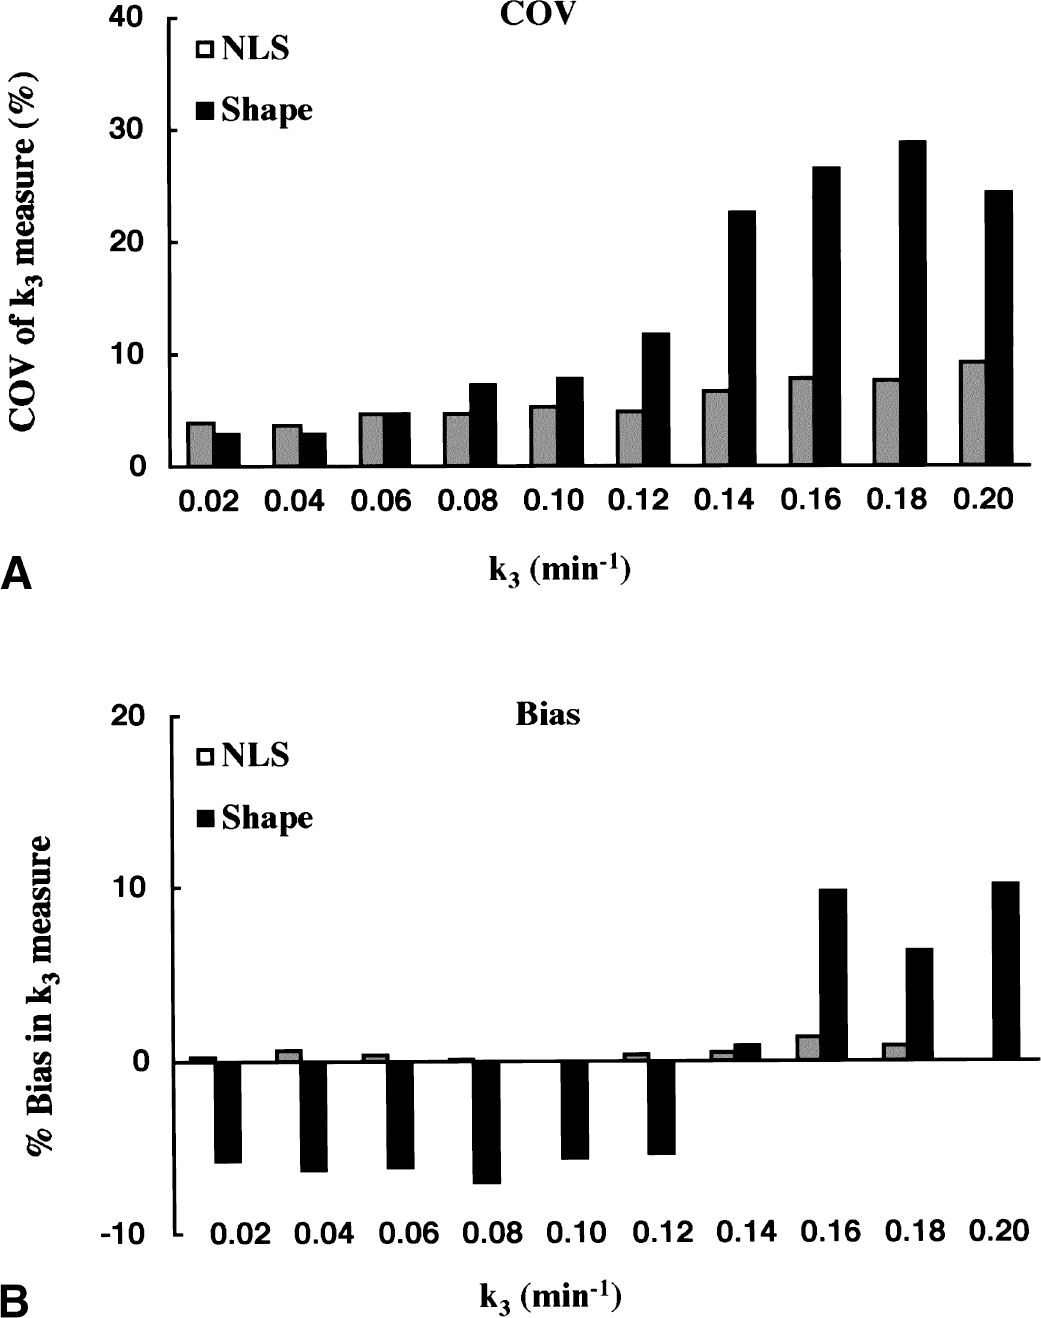
Monte Carlo simulation studies showing the effect of region of interest (ROI) k3 value on coefficient of variation (COV)
Clinical evaluation study
Correlation of k3 estimates obtained from NLS and shape analyses (Fig. 10) was examined for 10 cortical ROIs of the NC group (n = 10, 100 ROIs) and the AD group (n = 20, 200 ROIs). The correlation coefficient of k3 across all 300 ROIs was r = 0.89, with a regression line of [shape k3] = 0.93 X [NLS k3]. Shape analysis gave lower k3 estimates when compared with NLS analysis. The regression line and correlation coefficient were [shape k3] = 0.89 X [NLS k3] with r = 0.85 for the NC group alone and [shape k3] = 0.96 X [NLS k3] with r = 0.89 for the AD group alone. Most of the ROIs deviated from the regression line in the NC group were in the sensorimotor cortex, which has greater k3 values than other cortical regions.
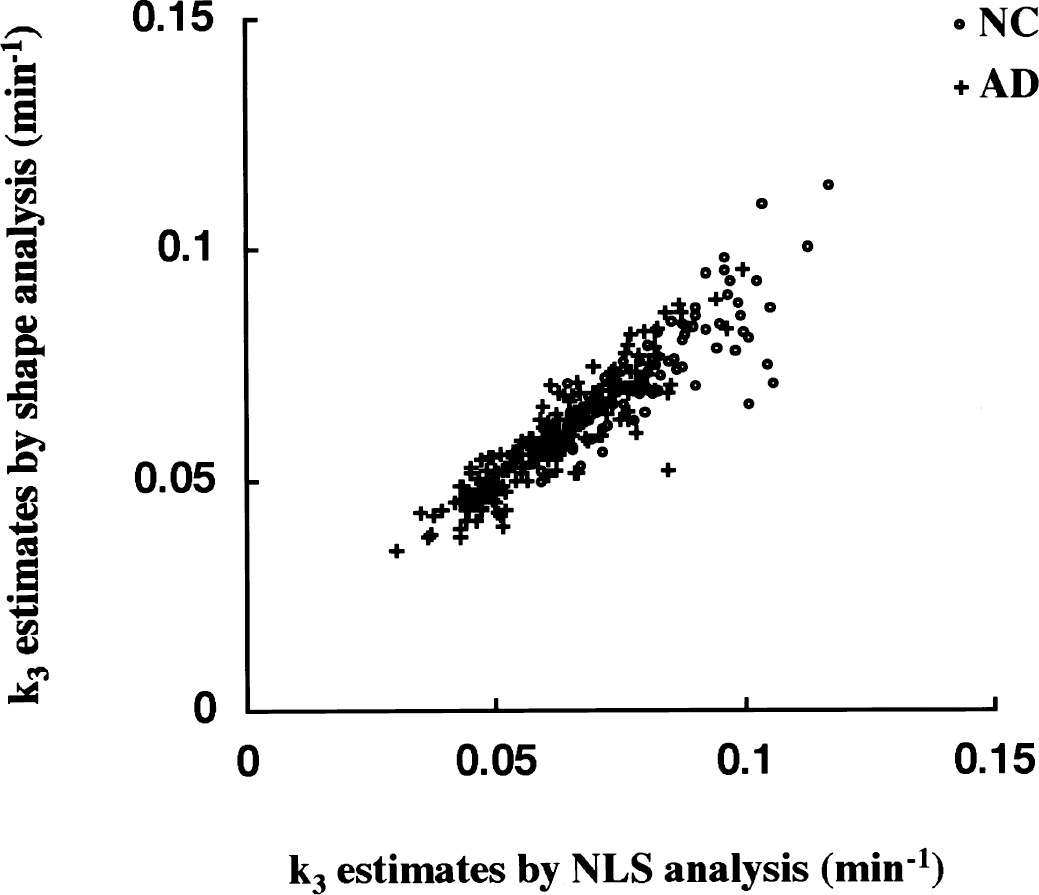
Correlation of k3 estimates between nonlinear least squares (NLS) and shape analysis in cerebral cortical regions (frontal, sensorimotor, temporal, parietal, and occipital cortices; right and left sides). Open circles show region of interests of NC subjects (n = 100) and plus signs show those of Alzheimer's disease (AD) patients (n = 200).
Regional k3 values were compared between NC and AD groups using NLS (Fig. 11A) and shape (Fig. 11B) analyses. Of the five cortical regions examined, NLS analysis gave the highest k3 values for the NC group in SM (0.096 ± 0.012 min−1) followed by TE (0.087 ± 0.009 min−1), FR (0.078 ± 0.009 min−1), PA (0.072 ± 0.008 min−1), and OC (0.067 ± 0.008 min−1). The order was in accordance with the reported AChE distribution in human brains (Arai et al., 1984; Atack et al., 1986). With NLS analysis, the AD group showed significant k3 reductions in all regions (P < 0.001): 23% in SM, 26% in TE, 23% in FR, 27% in PA, and 22% in OC. For shape analysis, the rank order of k3 values for the five cortical regions of the NC group was the same as for NLS analysis: SM (0.084 ± 0.015 min−1) > TE (0.077 ± 0.009 min−1) > FR (0.072 ± 0.007 min−1) > PA (0.065 ± 0.007 min−1) > OC (0.061 ± 0.007 min−1). Reductions of cortical k3 values in the AD group were also significant (P < 0.013 in SM, and P < 0.001 in TE, FR, PA, and OC): 17% in SM, 19% in TE, 19% in FR, 20% in PA, and 17% in OC. Mean reduction in cortical k3 obtained by shape analysis was 18.4%, which was approximately 76% of that obtained by NLS analysis (24.2%).
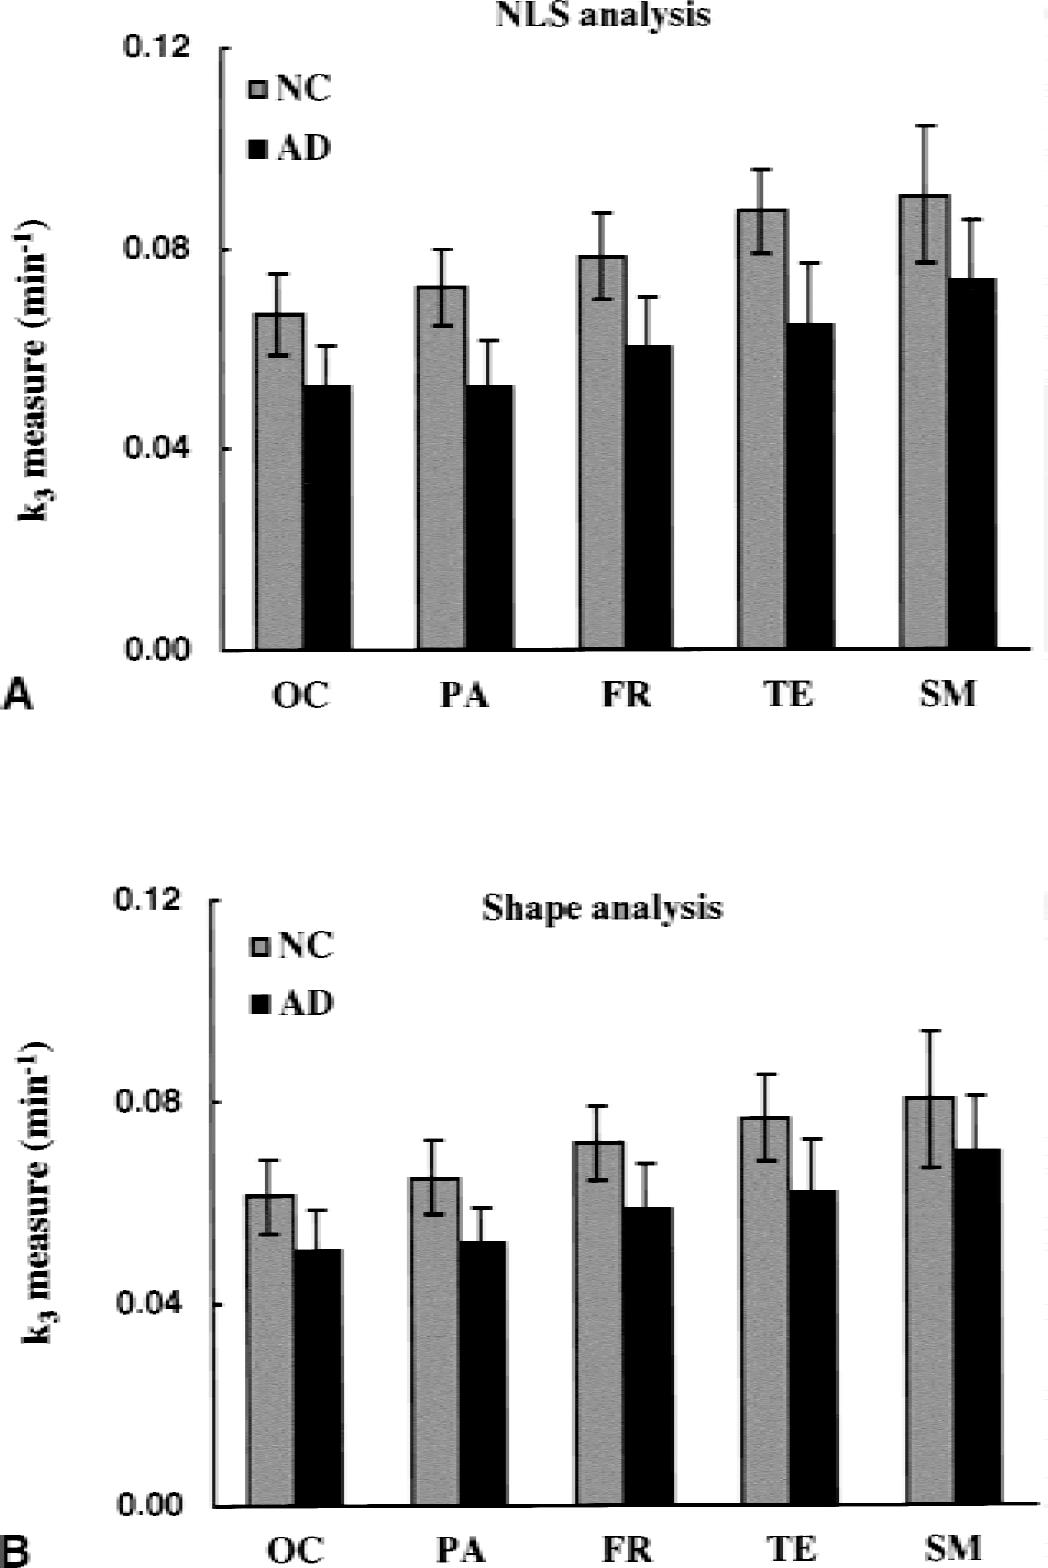
Comparison of regional k3 values (mean and SD) between normal control (NC) and Alzheimer's disease (AD) groups. The k3 values are estimated by using nonlinear least squares (NLS)
Figure 12 shows the distribution of positive ROI identified by NLS analysis, and of true-positive and false-negative ROI classified by shape analysis in 20 patients with AD. The patients are aligned in ascending order of the mean k3 value of 10 cortical regions in NLS analysis from left (Case 1: mean k3, 0.041 min−1) to right (Case 20: mean k3, 0.069 min−1). Nonlinear least squares analysis detected 4 or more positive ROIs in all of 20 AD patients tested, and shape analysis detected 2 or more true-positive ROIs except in 1 patient (Case 18). The number of positive ROIs identified by NLS analysis was larger in AD patients showing lower k3. The rate of true-positive ROIs identified by shape analyses was also higher in these AD patients with low cortical k3 values. Across the 20 patients with AD, 136 of the 200 ROIs were classified as positive by NLS analysis. By using shape analysis, 95 ROIs were classified as positive, including 92 true-positive and 3 false-positive ROIs. The sensitivity of shape analysis, therefore, was calculated as 67.6% (92/136 × 100).
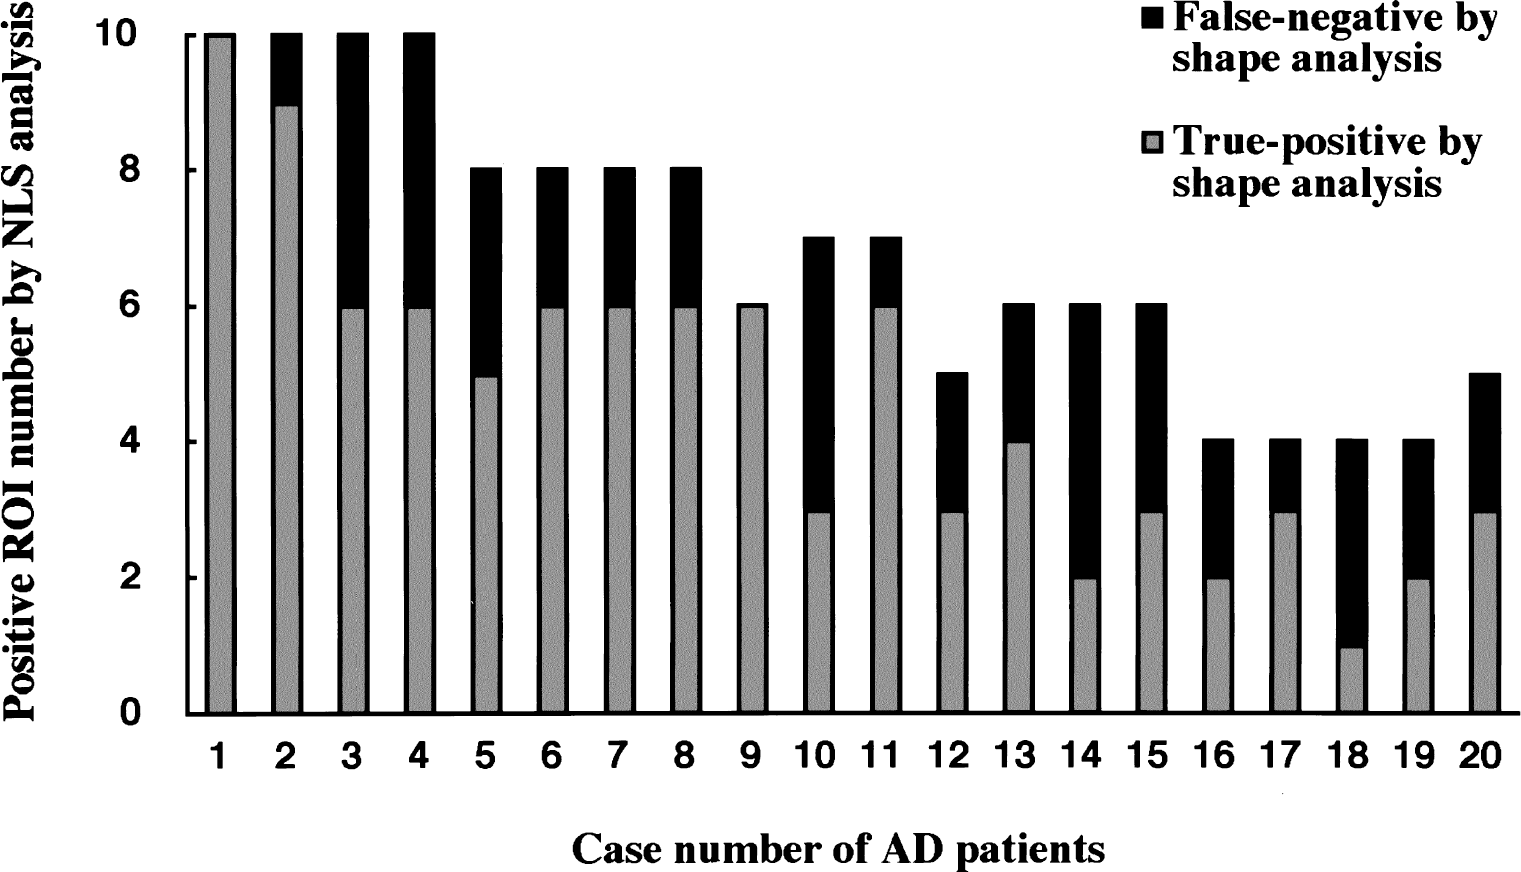
Sensitivity of the shape analysis in detecting abnormal regions of interest (ROIs) in 20 patients with Alzheimer's disease (AD). Patients are aligned in the ascending order (from left to right) of mean cortical k3 value in nonlinear least squares (NLS) analysis. Each bar represents number of positive ROI in each patient by NLS analysis (total 136 ROIs), that is, ROI with significantly low k3 as compared with NC group (z-test, P < 0.05) in NLS analysis. Gray area represents true-positive ROIs in shape analysis (total 92 ROIs), that is, ROIs identified as positive by both shape and NLS analyses. Black area represents false-negative ROIs in shape analysis, that is, ROIs identified as positive in NLS analysis but identified as nonpositive in shape analysis. In this case, the relative sensitivity of shape analysis is 67.6%.
DISCUSSION
Optimization of the shape analysis protocol
Shape analysis is based on the ability to differentiate the two tissue components that comprise the brain time-radioactivity curve. In this approach, lower bias is achieved by increasing the temporal density of these curves. Therefore, data interpolation is indispensable for this method of analysis. The degree of interpolation required obviously depends on how long the scan frames were in the original PET acquisition. Furthermore, the appropriate level of interpolation may differ between the shorter early scan frames and the longer later scan frames. However, the same level of data interpolation was used in the current study (that is, 8-point interpolation between frames). As seen in Fig. 6, the bias in k3 estimates obtained by shape analysis decreased with increasing levels of interpolation. The greater the interpolation, however, the greater the calculation time. In addition, when the hydrolysis rate was more rapid, there was a greater need for interpolation as indicated by the slower approach of the NC curve to an asymptotic value than was seen for the AD curve. In the current study, data interpolation between scan frames of eight points resulted in, at most, a 3% underestimation in k3 for the NC curve.
The effect of error in the measured PET data on the bias of k3 estimates was examined by giving to a single scan frame an error of ±3% relative to the true scan value. Figure 7 shows that shape analysis estimates have larger biases when PET errors occur at later scan frames, particularly in the final scan frame. This is expected because the shape analysis procedure is terminated when the calculated metabolite concentration in the final scan frame becomes equal to the observed PET value of the final scan frame, hence satisfying the assumption that no substrate exists at the end of the study. To obtain more precise k3 estimates, data from the later scan frames should be fitted with a smooth function before performing the shape analysis calculation. This becomes especially important as the hydrolysis rate increases, as seen by the larger k3 biases in the NC (Fig. 7A) than the AD curve (Fig. 7B). In the current study, the authors used a bi-exponential function to fit the data from the last nine scan frames, which includes all data beginning just after peak radioactivity concentration occurs in the majority of cortical regions for these [11C]MP4A PET studies.
The authors also examined the appropriate scan duration for the shape analysis procedure. If the scan duration is shorter or longer than the time it takes for the PET time-radioactivity curves to become completely flat, k3 is overestimated or underestimated. As seen in Fig. 8, the NC curve showed no bias for a scan duration of approximately 45 minutes, whereas the AD curve showed no bias for a 50-minute scan time. The AD curve was derived to represent the reduced kinetic parameter values corresponding to patients with AD. The lower values of both k2 and k3 in AD lengthen the time for the data to reach its final constant value. The optimal scan duration for shape analysis, therefore, varies with the regional k3 value, that is, regions with lower k3 values require longer scan duration. In the current study, the authors used 50 minutes for the scan duration not only for patients with AD but also for all regions of NC subjects because a priori information should not be used in clinical analysis for determining unknown k3 values. One possible approach is to determine the scan duration from the shape of fitted time-radioactivity curve, that is, to determine the time where the fitted function has a negligible slope. In addition, it may be possible to use fewer data frames (ending before the final PET value is reached) and then taking the fitted function and extrapolating the data to determine the final value. Further examination of these issues is needed.
It should be noted that the results of Figs. 6 to 8 are interrelated. Data presented in Fig. 6 were produced using a simulated scan duration of 50 minutes, hence, the higher values in the AD case, where the overestimation due to scan duration more completely cancels the underestimation due to limited interpolation than it does in the NC case. Figure 7 data were produced with an interpolation factor of 8 and a 50-minute scan duration, again causing NC values to be slightly underestimated in general. Figure 8 data were produced using an interpolation factor of 8; thus, at long scan duration, when the overestimation effects from limited scan duration are removed, slight underestimation, caused by limited interpolation, is observed in both curves.
Monte Carlo simulations
In the current study, the authors assumed that the ROI COV approximates to the practical PET data error (Fig. 5). The Monte Carlo simulations showed that NLS analysis produced 4.6% COV for k3 values ranging from 0.04 to 0.10 min−1 corresponding to those in cortical regions (Fig. 9A). A similar value (approximately 8% COV in TE) is reported based on a sensitivity matrix describing error transfer and a weight matrix calculated from sum of fitting residuals (Nagatsuka et al., 1998b), suggesting that the magnitude of ROI COV used in the current study approximates to the practical PET data error.
Nonlinear least squares analysis produced gradually increasing COV of k3 estimate with increasing k3. Shape analysis of simulated [11C]MP4A PET data also produced reliable k3 estimates with COV less than 10% for k3 values ranging from 0.02 to 0.1 min−1, corresponding to cortical k3 values of AD and NC subjects (Fig. 9A). For k3 values greater than 0.14 min−1, the COV of shape k3 increased dramatically to more than 20%. In contrast, the COV of NLS k3 remained less than 10% for k3 values up to 0.2 min−1, although the COV also increased steeply for higher k3 values. These results suggest that shape analysis has considerably greater susceptibility to flow-limitation effects than does NLS analysis.
The Monte Carlo simulations showed that NLS analysis produced much smaller biases (less than ±2%) than shape analysis for all k3 values examined (Fig. 9B), again indicating higher reliability of NLS analysis than shape analysis. Shape analysis produced bias of approximately −5% for k3 values ranging from 0.02 to 0.10 min−1, corresponding to cerebral cortical regions of AD and NC subjects, but produced a large and significant positive bias (approximately +10%) for higher k3 values than 0.14 min−1. For higher k3 values, the later part of time-radioactivity curve after the initial increase of tissue radioactivity is relatively flat and the washout phase is unclear. This makes k3 estimates by shape analysis very unstable and the k3 bias varies by the conditions of k3 calculation such as brain-curve fitting function or precision in numerical calculation. For instance, when the precision level of numerical least squares optimization was less than the level used in the current study, the sign of bias for higher k3 values changed from positive to negative. For k3 values less than 0.12 min−1, however, both the COV and the bias were stable and independent of the conditions of k3 calculation.
Monte Carlo simulations showed shape analysis is applicable only to regions with lower k3 values than NLS analysis and, for [11C]MP4A, is restricted to cerebral cortical regions.
Clinical evaluation study
Because of large k3 variance in regions with high AChE activity, the authors restricted their examination in the clinical evaluation study to neocortical regions. In this study, 10 NC subjects (total 100 ROIs) and 20 patients with AD (total 200 ROIs) were subjected to [11C]MP4A PET followed by k3 estimation using the NLS and shape analyses.
Across all 300 neocortical ROIs, the relation between k3 estimates from NLS analysis and those from shape analysis was nearly linear. The slope of the regression line in the NC group (0.89) was smaller than that in the AD group (0.96), indicating larger negative biases of k3 values obtained from shape analysis in the NC group. In the optimization of the shape analysis protocol, a scan duration of 50 minutes was shown to give negligible bias. However, this scan duration was based on the AD curves corresponding to the temporal cortex of patients with AD. As mentioned above, the appropriate scan duration for the shape analysis might vary with the regional k3 value. The present scan duration of 50 minutes might be slightly longer than the appropriate scan duration for most of the ROI in the current clinical study, particularly for NC subjects. However, the high correlation between k3 values obtained by NLS and shape analyses suggests that shape analysis can provide a practically useful index of neocortical AChE activity. The lower correlation coefficient in the NC group than in the AD group was mainly because of the deviation of the data from sensorimotor cortices where the k3 values were the highest of those neocortical regions tested. This suggests that flow-limitation effects are beginning to be observed in k3 estimates by shape analysis at k3 values of approximately 0.1 min−1.
The rank order of neocortical k3 values in the NC group obtained from both NLS and shape analyses was identical and corresponded to the reported order of neocortical AChE activity in necropsy samples. In the NC group, k3 estimates obtained from shape analysis were also lower than those obtained from NLS analysis, again indicating the larger negative k3 bias of shape analysis in the NC group. The reduction in neocortical k3 values of patients with AD compared with NC subjects was, however, significant for both NLS and shape analyses. The results of the NC group in Fig. 11 showed that the across-subjects variance in cortical k3 estimates in shape analysis (12.4%) was almost identical with that in NLS analysis (11.6%). This indicates that in areas of low AChE activity, intersubject variance of AChE activity is predominant in variability of k3 estimates by shape analysis as well as NLS analysis, and that the shape analysis is a practically useful method yielding k3 estimates with a precision comparable with NLS analysis for cerebral cortical regions.
The ability of shape analysis to detect positive ROI in AD patients is somewhat lower than NLS analysis, but the false-positive rate of shape analysis is low. The reduced sensitivity of shape analysis is because of smaller mean difference between NC group with negative k3 biases and AD group with almost no bias (Fig. 11B). In the patients with AD tested, NLS analysis detected 6.8 positive ROI and shape analysis detected 4.6 true-positive ROI in an AD patient. Of the 20 patients with AD, shape analysis gave 2 or more true-positive ROIs in 19 patients with AD. The probability of appearance of 2 or more positive ROIs out of 10 cortical ROIs in a NC subject is less than 8.6% at the current significance level of z-test (P < 0.05). The ability of shape analysis to distinguish AD patients with abnormally reduced cortical AChE activity from NC subjects is, therefore, high enough for clinical diagnosis.
Tracer comparison
The major difference between [11C]MP4A and [11C]PMP is the rate of hydrolysis by AChE in the brain. The difference in tracer hydrolysis rate is implicated in the duration of PET scanning needed for kinetic analysis. Because the hydrolysis rate of [11C]PMP is one third to one fourth of that of [11C]MP4A (Irie et al., 1996), [11C]PMP PET allows more precise determination of k3 values in regions with moderate AChE activity such as the thalamus, however, a PET scan usually takes 80 minutes (Kuhl et al., 1999; Koeppe et al., 1999). On the other hand, in the case of [11C]MP4A, a 40-minute PET scan is enough for NLS analysis (Namba et al., 1999), and a scan duration of 50 minutes is shown to be suitable for shape analysis in this study. The shorter scan duration is preferable because shape analysis may be more susceptible to head movement than NLS analysis, especially in the case of demented patients.
The specificity of [11C]MP4A against AChE in human cerebral cortex is 94%, which is greater than that of [11C]PMP (86%) (Irie et al., 1996). The high specificity against AChE is important for the detection of abnormal AChE activity in patients with AD because butyrylcholinesterase activity is known to be increased in postmortem AD brains (Perry et al., 1978). Higher AChE specificity and higher hydrolysis rate of [11C]MP4A than [11C]PMP may be preferable for monitoring effects of AChE-inhibitor type therapeutics in patients with AD.
Conclusions
The authors examined the applicability of shape analysis, a simple approach without blood sampling, for the determination of a quantitative index of brain AChE activity by using N-[11C]methylpiperidin-4-yl acetate ([11C]MP4A) and PET. Computer simulation studies showed that shape analysis provides a precise index of AChE activity in brain regions with low AChE activity (for example, cortex). However, the accuracy of the estimates is progressively reduced with increase in AChE activity, suggesting that this method is incapable of applying for regions with moderate (for example, thalamus) and high (for example, basal ganglia, cerebellum) AChE activity. In clinical evaluation studies, the shape analysis showed sensitivity (68% as compared with NLS analysis) enough to detect abnormality of AChE activity in the cortical ROI in AD patients. Considering its simplicity and noninvasiveness, the authors conclude that the shape analysis with [11C]MP4A is a practically useful method for the detection of abnormal AChE activity in patients with AD.
Footnotes
Acknowledgments
The authors are grateful to Prof. R. A. Koeppe, University of Michigan, School of Medicine, MI, U.S.A., for his helpful discussions and for assistance in preparing the manuscript. They are also grateful to Drs. K. Suzuki, H. Murayama, T. Hasegawa, T. Nakajima, and H. Ikehira at National Institute of Radiological Sciences for their helpful discussions, supports in tracer preparation, and PET data acquisition.