
Abstract
Previous work has demonstrated that cerebral echo contrast enhancement can be assessed by means of transcranial ultrasound using transient response second harmonic imaging (HI). The current study was designed to explore possible advantages of two new contrast agent specific imaging modes, contrast burst imaging (CBI) and time variance imaging (TVI), that are based on the detection of destruction or splitting of microbubbles caused by ultrasound in comparison with contrast harmonic imaging (CHI), which is a broadband phase-inversion—based implementation of HI. Nine healthy individuals with adequate acoustic temporal bone windows were included in the study. Contrast harmonic imaging, CBI, and TVI examinations were performed in an axial diencephalic plane of section after an intravenous bolus injection of 4 g galactose-based microbubble suspension in a concentration of 400 mg/mL. Using time-intensity curves, peak intensities and times-to peak-intensity (TPIs) were calculated off-line in anterior and posterior parts of the thalamus, in the region of the lentiform nucleus, and in the white matter. The potential of the different techniques to visualize cerebral contrast enhancement in different brain areas was compared. All techniques produced accurate cerebral contrast enhancement in the majority of investigated brain areas. Contrast harmonic imaging visualized signal increase in 28 of 36 regions of interest (ROIs). In comparison, TVI and CBI examinations were successful in 32 and 35 investigations, respectively. In CHI examinations, contrast enhancement was most difficult to visualize in posterior parts of the thalamus (6 of 9) and the lentiform nucleus (6 of 9). In TVI examinations, anterior parts of the thalamus showed signal increase in only 6 of 9 examinations. For all investigated imaging modes, PIs and TPIs in different ROIs did not differ significantly, except that TVI demonstrated significantly higher PIs in the lentiform nucleus as compared with the thalamus and the white matter (P < 0.05). The current study demonstrates for the first time that CBI and TVI represent new ultrasonic tools that allow noninvasive assessment of focal cerebral contrast enhancement and that CBI and TVI improve diagnostic sensitivity as compared with CHI.
Keywords
Many clinical applications of ultrasound contrast agents in neurosonology have been explored and demonstrated (Baumgartner et al., 1997; Bogdahn et al., 1994; Gerriets et al., 1999; Goertler et al., 1998; Nabavi et al., 1998; Postert et al., 1999a). In most studies the capability of these agents to increase the backscattered ultrasound signal was used to improve diagnostic confidence of large vessel pathology. More recently, the potential diagnostic benefit of echo contrast agents in connection with harmonic imaging (HI) to assess parenchymal perfusion of various organs has been evaluated (Hancock et al., 1999; Porter et al., 1997, 1999). Only a few studies on the assessment of cerebral perfusion in humans with HI have been published. Using air-based ultrasound contrast agents, Seidel et al. and the authors' group observed a signal increase in several brain areas of healthy individuals, such as the lentiform nucleus and the white matter (Seidel et al., 1999; Postert et al., 1998). However, in both studies, large variations of quantitative parameters and other physical properties, such as depth-dependent attenuation of the ultrasound signals, rendered interpretation of this technique difficult. As compared with air-based microbubbles, a perfluropropane-containing contrast agent produced a more reliable and reproducible contrast effect in another study on healthy volunteers (Seidel et al., 2000). To date quantification of harmonic imaging parameters is not possible using the dye dilution principle. Nevertheless, semiquantitative analysis demonstrated a reliable parenchymal cerebral contrast enhancement in all studies on healthy individuals. In a preliminary study on acute stroke patients, HI has been shown to be potentially useful in identifying the localization and extent of brain ischemia (Postert et al., 1999b).
Insufficient resolution and signal-to-noise ratio, insufficient sensitivity, and the nonlinear relation between microbubble concentration and image intensity limited the diagnostic value of all harmonic imaging studies of the brain. Therefore, it would be useful to find more sensitive contrast specific ultrasonic tools. Contrast burst imaging (CBI) detects the changes in the acoustic properties of microbubbles that are caused by ultrasound-induced shrinking, splitting, and destruction while suppressing tissue and clutter signals by multiple pulse echo measurements (Hauff et al., 1997). Time variance imaging (TVI) also depicts the time variant acoustic properties of microbubbles by analyzing multiple pulse echo measurements (Wilkening et al., 1998a,b), but TVI uses a contrast agent specific analysis strategy to improve the suppression of noise and artifacts. The authors performed a study on three different contrast agent specific imaging modes (contrast harmonic imaging (CHI), CBI, TVI) to investigate and compare the potential of these techniques to assess parenchymal cerebral contrast enhancement.
MATERIALS AND METHODS
Subjects
The current study included 9 healthy volunteer subjects (6 women, 3 men; mean age = 35.6 years, range 24 to 39 years). Exclusion criteria were galactosemia, pregnancy, and history of cerebrovascular diseases. Informed consent was obtained from all individuals before entering into the study. Extracranial and transcranial color-coded real-time examinations were normal in all individuals. Eyes were closed during the examination period; blood pressure and heart rate were normal.
Ultrasound examinations
Because ultrasound techniques used in the current study are not yet established in neurosonology, a short description of physical properties of these methods is helpful for a better understanding of the study.
Protocol of the ultrasound examination
A Siemens Sonoline Elegra ultrasound system equipped with a 2.5 MHz phased array transducer (Siemens Medical Systems, Ultrasound Group, Issaquah, WA, U.S.A.) was used for all ultrasound examinations. Series of 45 to 70 images were acquired at a frame rate of 0.5 Hz. Ultrasound investigations were performed unilaterally using the transtemporal approach, where the field of view was set to an imaging depth of 10 cm and a sector angle of 90 degrees. Mechanical indices were less than 1.0 for all investigation modes. Examinations were performed according to the following protocol. First, a diencephalic plane of section was adjusted with the third ventricle as a landmark for orientation. The adjacent thalamus was visualized as a semi-circular hypoechogenic structure. In shallower insonation depths, the region of the lentiform nucleus and the white matter were depicted according to previously suggested criteria (Postert et al., 1998; Bogdahn et al., 1990).
Evaluation of quantitative parameters using time-intensity curves
All investigations were digitally recorded and evaluated off-line. Regional cerebral echo contrast was quantified using time-intensity curves (TICs). Because the signal-to-noise ratio was considerably less for smaller regions of interest (ROIs) and because the acquisition was performed at a low frame rate without electrocardiographic triggering, a model function (Fig. 1) for the TIC was fitted to the measured curve in at least mean square sense. Unlike filter approaches that are commonly used for “smoothing” curves by eliminating and replacing measurements that are “out of range” or by eliminating, for example, the high frequency content of the measured curve, this model-based approach does not eliminate or disregard any of the information in the measurements. The improvement with respect to signal-to-noise ratio and artifact suppression is achieved by incorporating knowledge about the expected signal into the model function. The most critical requirement for the model function is that it must be adaptable to the noise free and artifact free signal with negligible error under all conditions. The authors chose the model function
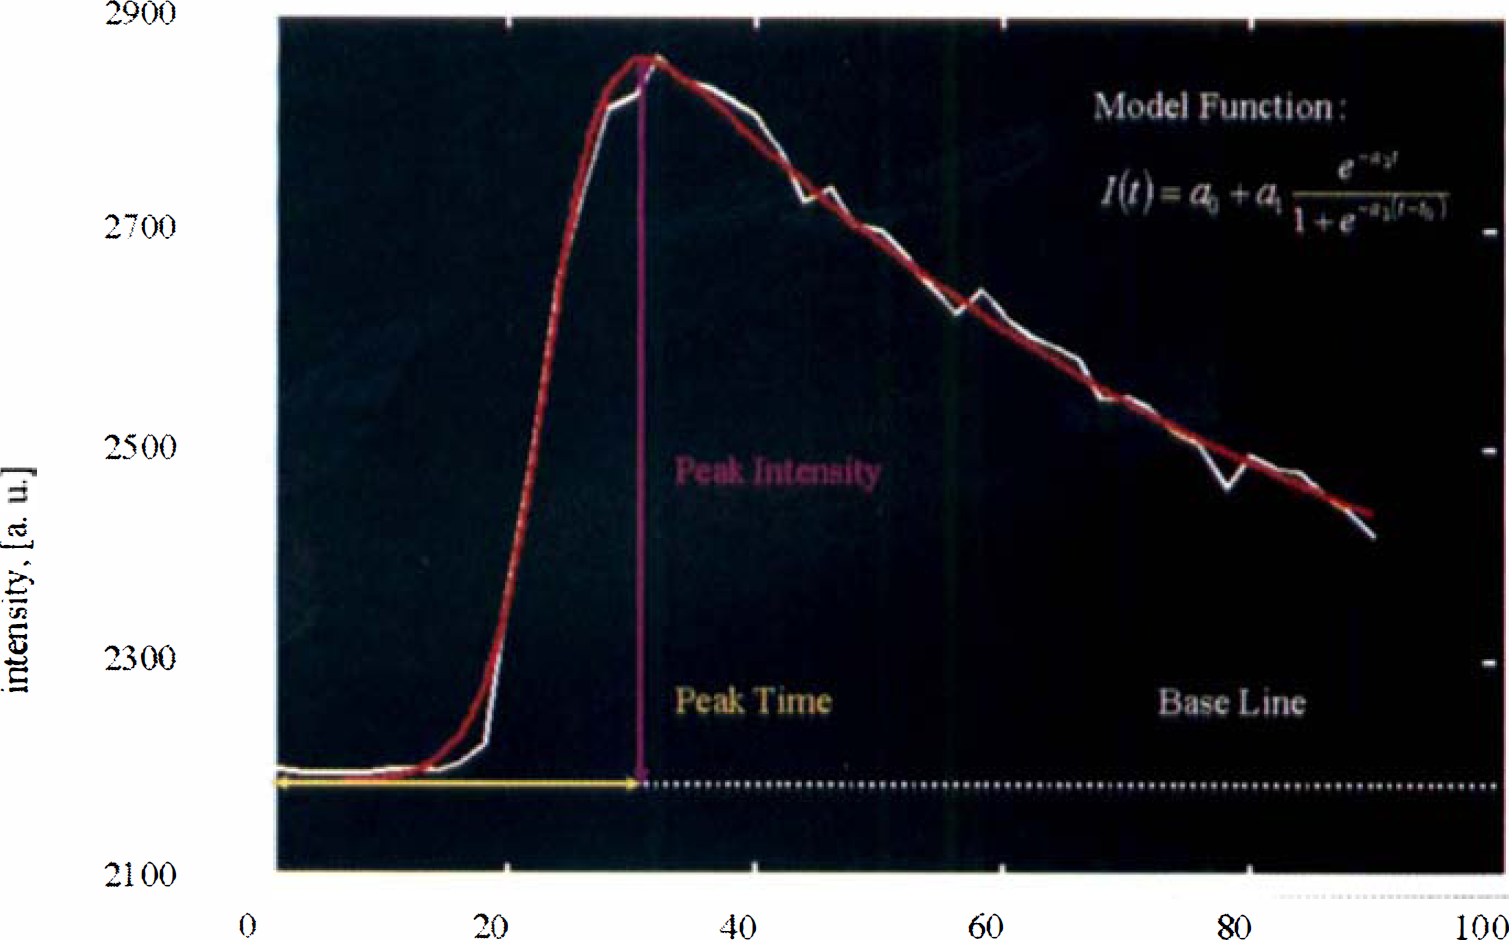
Calculation of peak intensity and time-to-peak intensity from model function.
where I(t) describes the intensity as a function of time to comply with the following considerations:The intensity in an image without contrast agent is not necessarily zero. This “baseline intensity” is taken into consideration by a0. As a consequence, the algorithm provides automatic baseline subtraction.
The bolus injection leads to an increase in the image intensity. The transition is modeled by a step:

where a3 determines the steepness (slope, rise time) of the step, and to the position of the transition in time.
After the injection, the microbubbles will be distributed in the whole blood volume. Also, the number of bubbles in the blood pool will decrease because of dissolution and destruction. This degradation is represented by the term e −a2t, where a2 determines the half-life of the bubbles.
The factor a1 adjusts the maximal change in intensity. (Note that a1 a2, a3, and t0 cannot be chosen independently.)
The proposed model function was found to be in good agreement with all measured TICs. Thus, further evaluation of the TICs can be based on the fitted model function rather than the original measurement. The advantage is that parameters like the peak intensity can be calculated directly from the model parameters, whereas the original measurements exhibit many local maxima and minima that create ambiguities. A disadvantage of the model function approach is the computation time that is necessary to optimize the five parameters of the model function.
Peak intensities (PIs) and times-to-peak intensities (TPIs) were calculated from that model function. The curves typically show a baseline phase before contrast enhancement, a sudden increase in the optic intensity to a peak level followed by a slow washout phase. The units for the PIs depend on the imaging mode. Maximal intensity in CHI and CBI images was defined to be 4095, minimal intensity was 0 (corresponding to −76 to 0 dB for CHI, and to −50 to 0 dB for CBI). In TVI examinations, corresponding AU ranged from 1 to 64. Quantitative data were calculated for the following manually placed rectangular ROIs: posterior parts of the thalamus (ROI-a), anterior parts of the thalamus (ROI-b), lentiform nucleus (ROI-c), and the white matter (ROI-d). Size of ROI-a and ROI-b varied between 0.2 and 0.4 cm2, corresponding areas for ROI-c and ROI-d were 0.7 cm2 and 1 cm2. Peak intensities and TPIs in different ROIs using identical imaging modes and TPIs of different examination modes in identical ROIs were compared with the Wilcoxon signed rank test (paired nonparametric test). Finally, parameter images were formed by dividing each image within a series into regions of 1 mm × 1 mm. For each of these regions, TICs were extracted and evaluated as described above. This analysis yielded PIs and TPIs of all regions. The parameters (PI, TPI) were visualized in a color-coded parameter image.
RESULTS
The echo contrast agent injections were well tolerated, no side effects could be observed. All subjects had adequate acoustic temporal bone windows enabling visualization of the third ventricle and the thalamus in transcranial real-time images. In general, the authors observed an increase of acoustic intensities in the majority of ROIs and in almost all areas of the ipsilateral brain hemisphere that were not systematically evaluated and categorized in ROI, because they are insufficiently defined in transcranial B-mode images. No contrast enhancement could be found in the near field of the ultrasound beam and in the contralateral hemisphere, as far as it was visualized on the sector image.
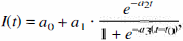
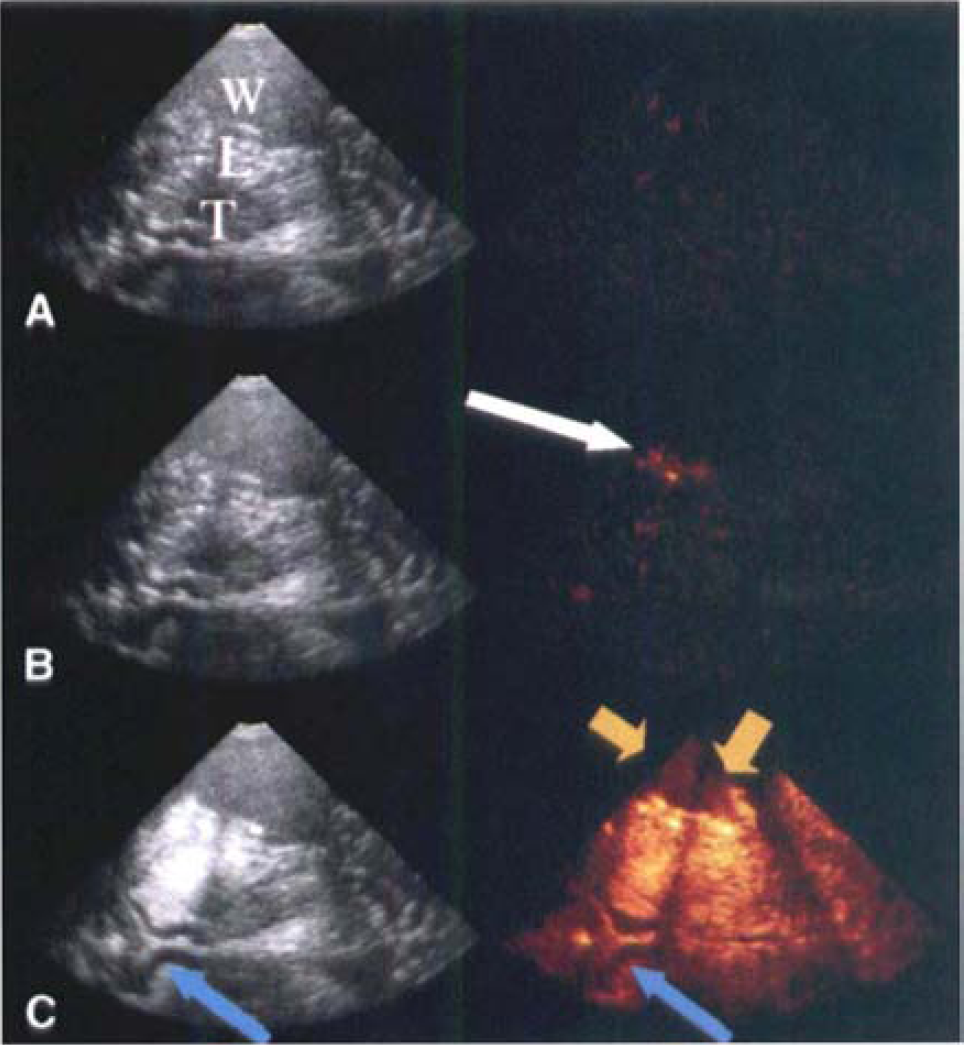
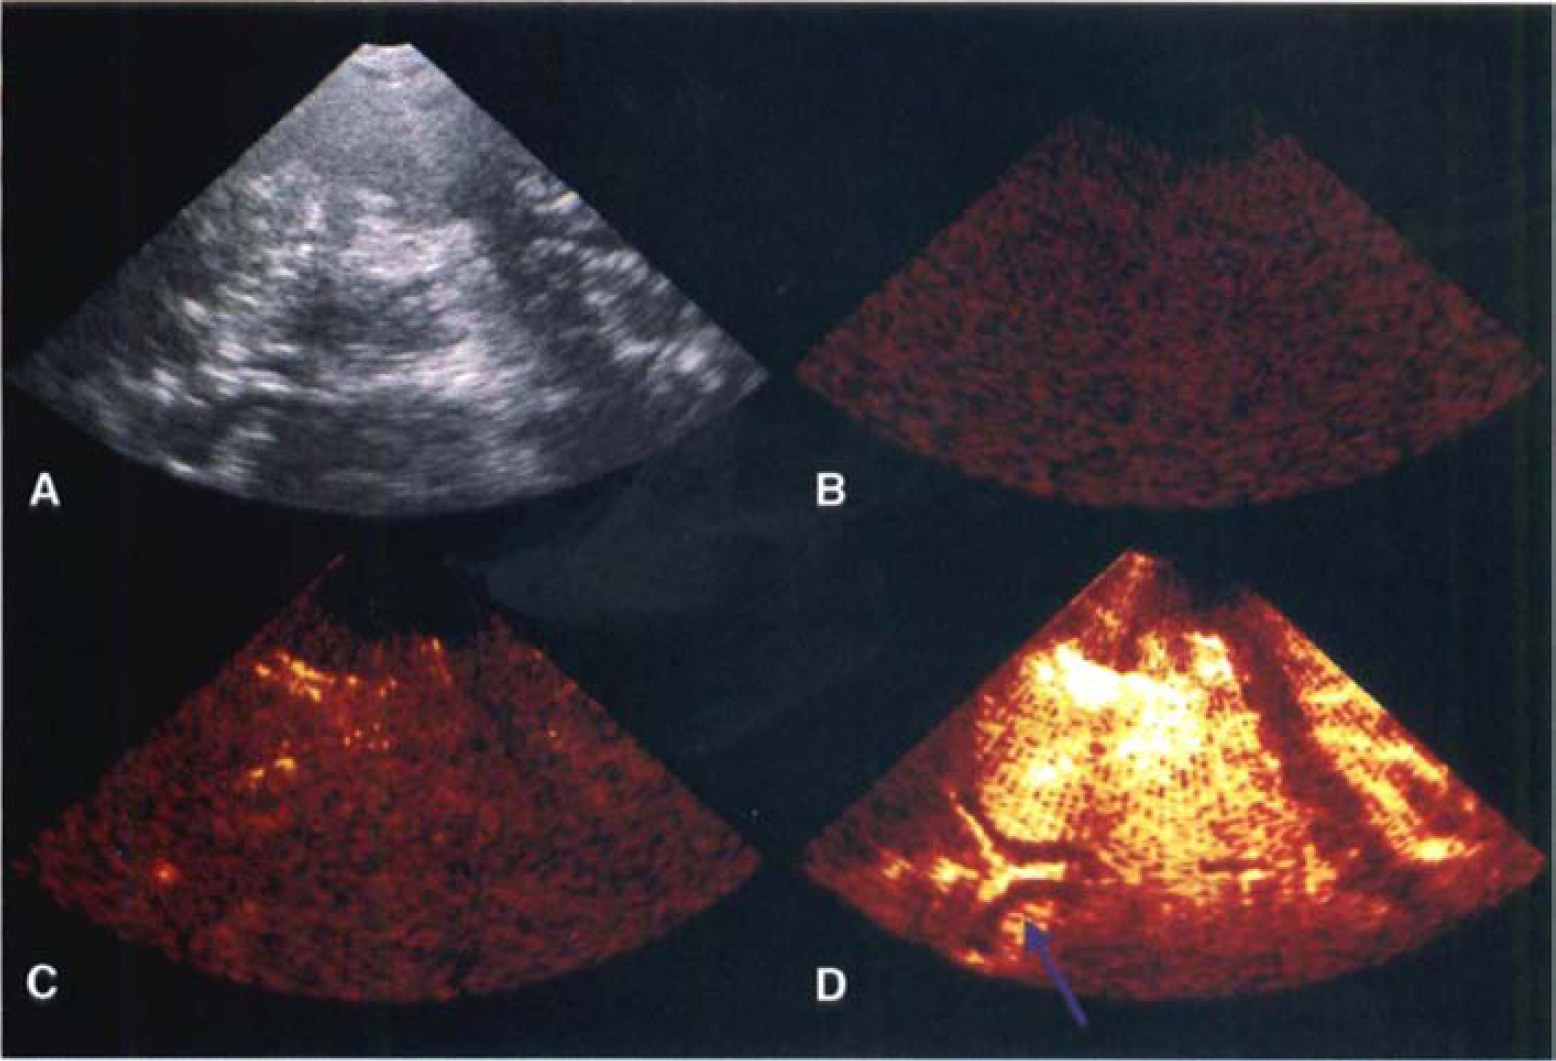
In four volunteers, CHI examinations demonstrated characteristic TICs in all ROIs. In 3 and 2 individuals, 2 or 1 ROI, respectively, did not exhibit contrast enhancement. Characteristic TICs could be derived from 28 of 36 ROIs. In ROI-a and ROI-c, an increase in the optic intensity after echo contrast application was most difficult to assess (6 of 9 examinations). Time variance imaging demonstrated a clear increase of optic intensities in 32 of 36 ROIs; in 6 individuals, all 4 ROIs showed contrast effect. In ROI-b, signal increase could be observed in only six subjects. Most reliable cerebral echo contrast enhancement could be demonstrated in CBI examinations. Thirty-five of 36 investigated regions exhibited a clear increase of optic intensities. Examples for CHI, TVI, and CBI examinations are given in Figs. 2 and 3. Quantitative CHI, TVI, and CBI results are summarized in Tables 1 to 3. Time-to-peak intensities varied between 17.0 and 70.9 seconds (TVI), 14.1 and 96.6 seconds (CHI), and 17.4 and 64.6 seconds (CBI). Time intervals of contrast appearance were not significantly different in any ROI considering the three examination modes. In TVI examinations. PIs in ROI-c were significantly elevated as compared with ROI-a and ROI-d (P < 0.05). No significant differences of PIs could be found between other ROIs in TVI examinations and between any ROI in CHI and CBI examinations, respectively. Peak intensities showed large interindividual differences. For example. PIs in CBI investigations of ROI-b ranged from 1031 AU to 2744 AU. In all patients it was possible to calculate parameter images of PI and TPIs based on TICs in areas of 1 mm × 1 mm. Because semiquantitative information is displayed color-coded in one single images, analysis of echo contrast agent distribution was possible at first sight in one image without the need to calculate TICs (Fig. 4). Furthermore, parameter images are less sensitive for artifacts than single CHI, CBI, or TVI images. because they are calculated from an entire examination period, whereas evaluation of parenchymal perfusion based on the information of single images is particularly susceptible to the influence of motion artifacts.
Contrast harmonic imaging (CHI, left) and time variance imaging (TVI, right) examination.
Contrast burst imaging examination. Basic gray scale and color-coded images showing accurate signal increase in the ipsilateral brain hemisphere (images are taken according to Fig. 2).
Quantitative parameters in contrast harmonic imaging examinations
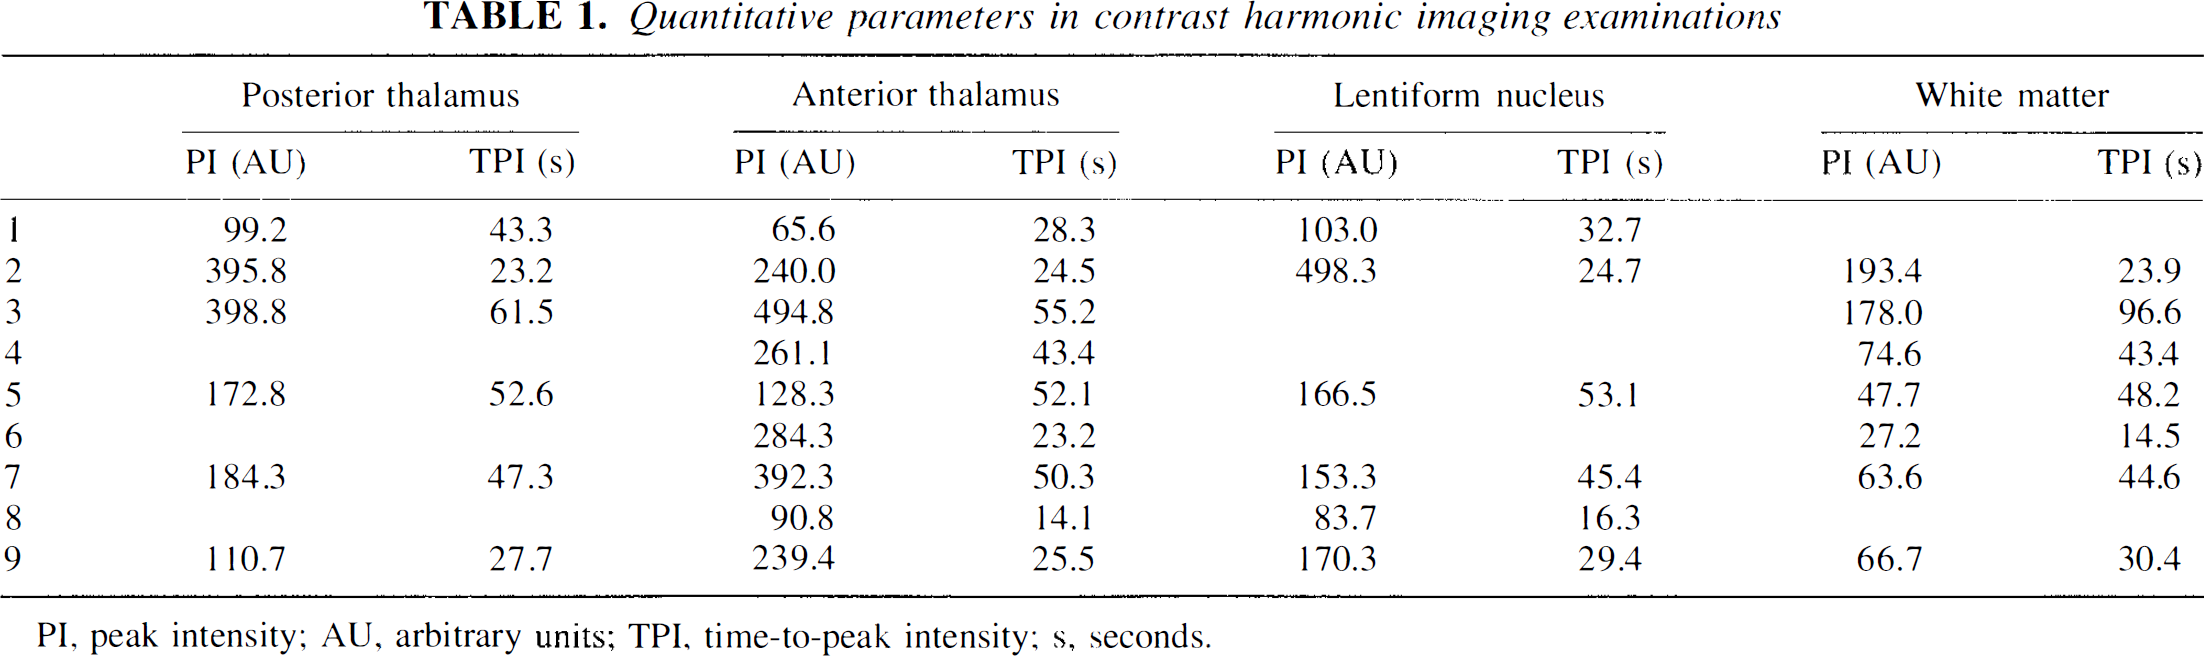
PI, peak intensity; AU, arbitrary units; TPI, time-to-peak intensity; s, seconds.
Quantitative parameters in contrast burst examinations
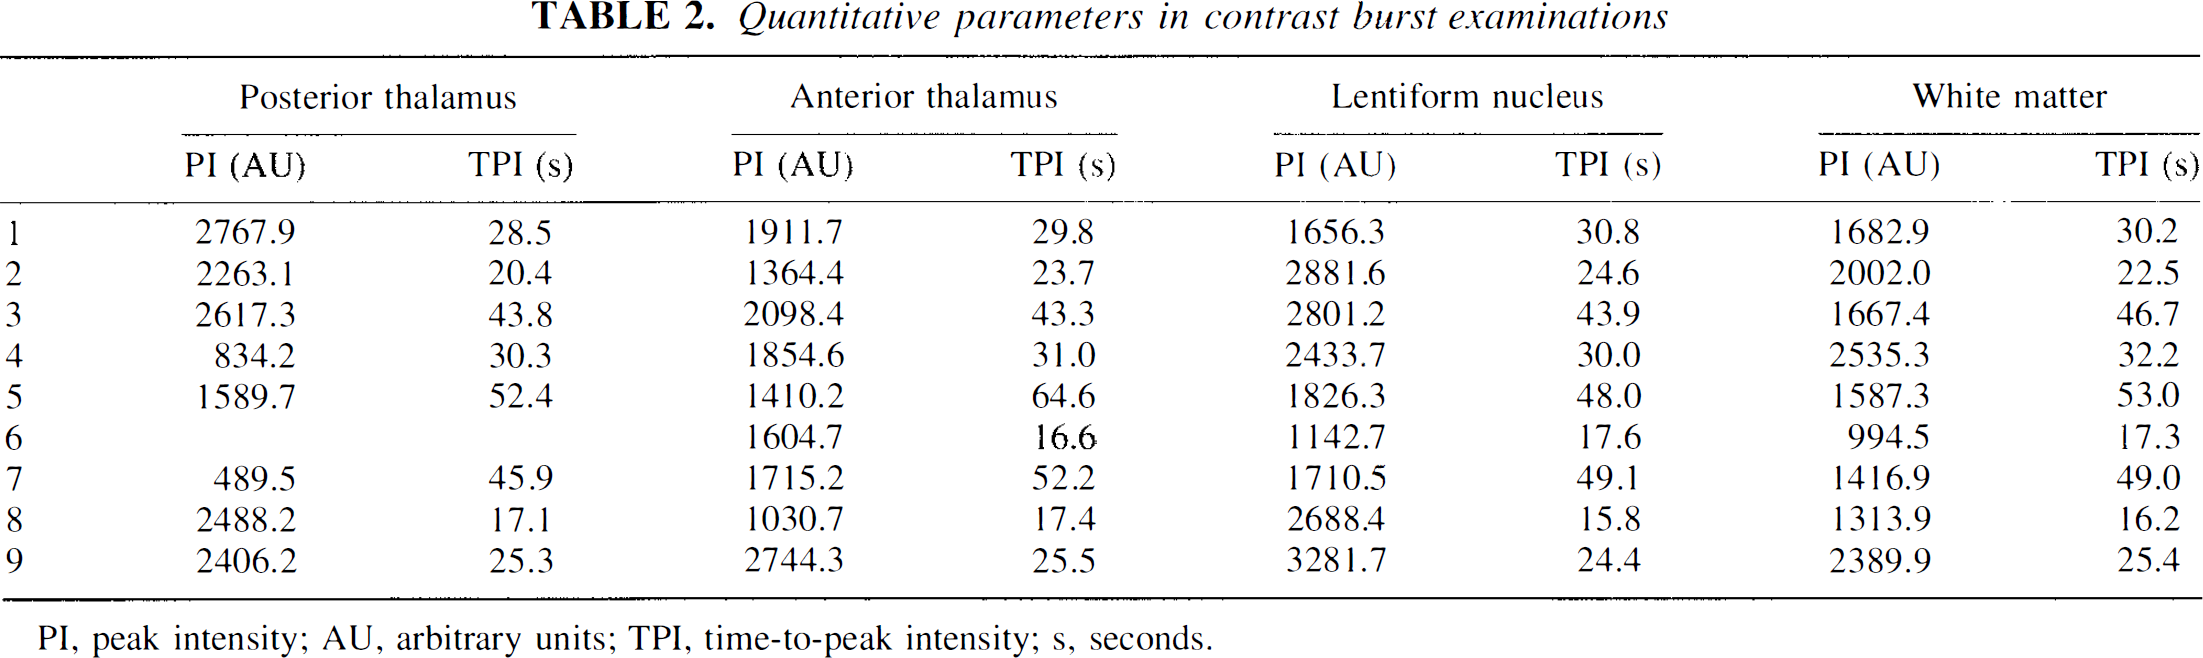
PI, peak intensity; AU, arbitrary units; TPI, time-to-peak intensity; s, seconds.
Quantitative parameters in time variance examinations
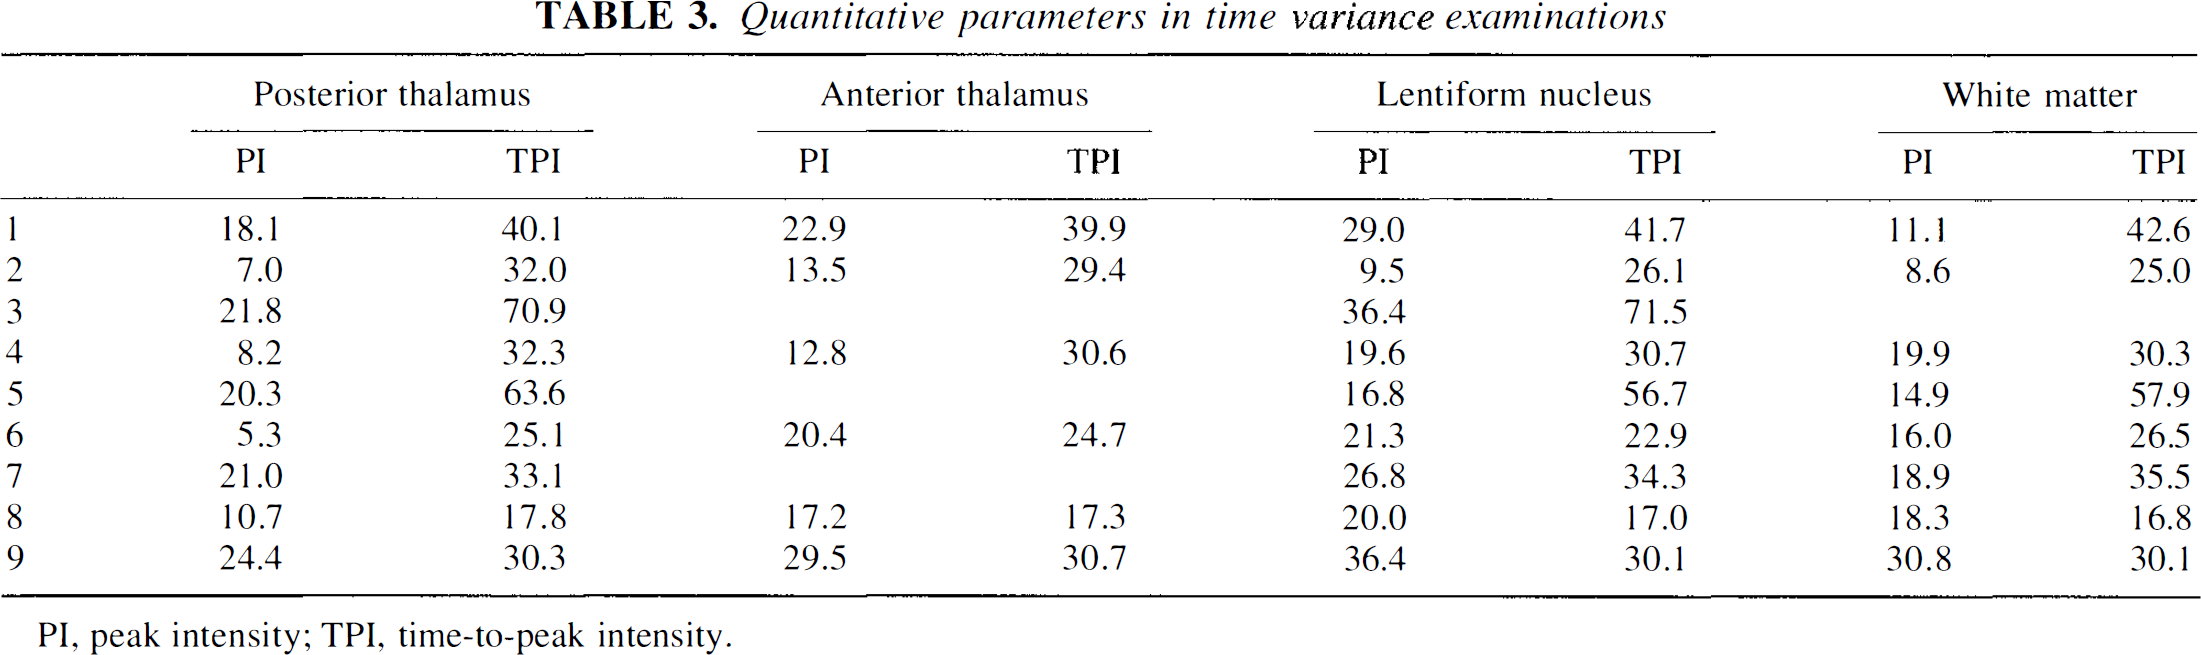
PI, peak intensity; TPI, time-to-peak intensity.
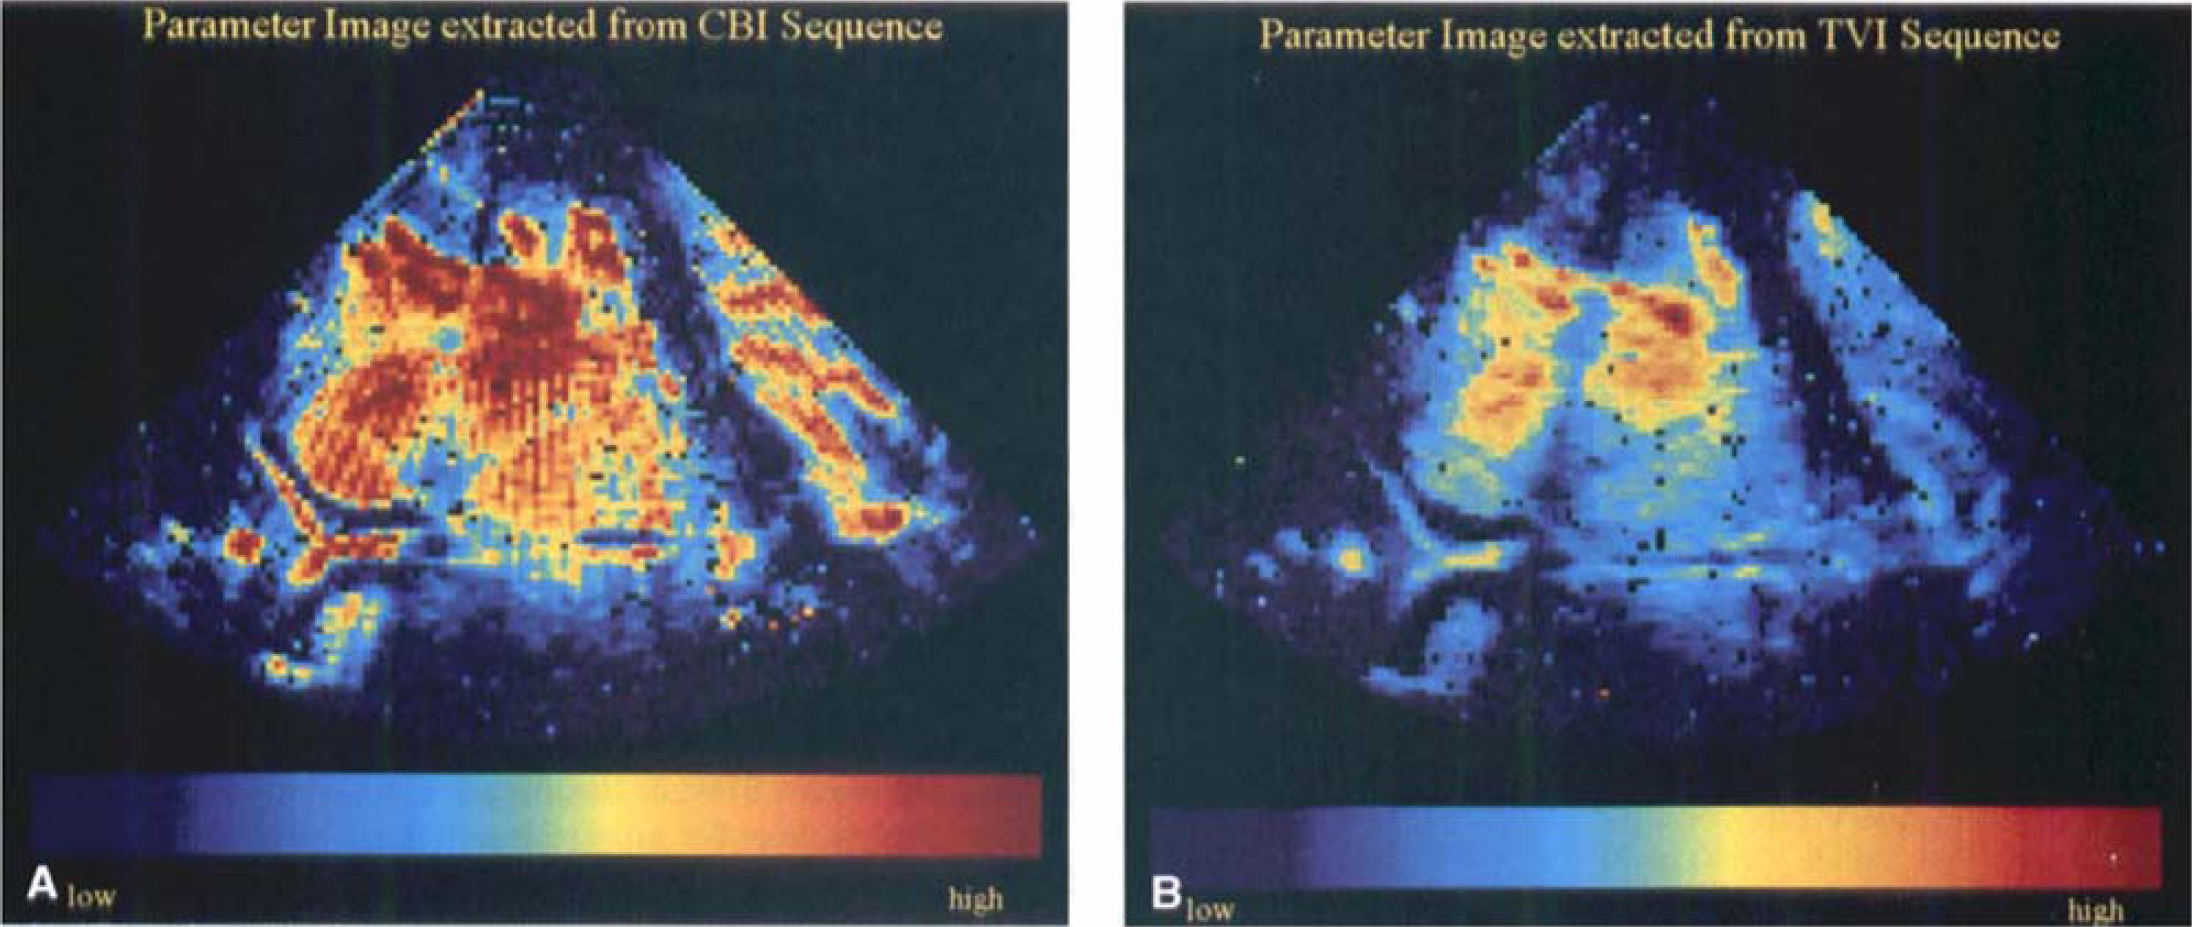
Parameter images (peak intensities in contrast burst imaging (CBI) examination
DISCUSSION
The assessment of cerebral parenchymal perfusion is limited by the inadequate depiction of microbubbles within tissue using conventional ultrasound techniques. Contrast agent specific imaging modes have to be based on those acoustic properties of microbubbles that differ significantly from the acoustic properties of scatterers in tissue (Burns, 1996; Jansson et al., 1999; Schwarz et al., 1997). Imaging modes that meet these requirements and that are able to detect nonlinearity or destruction of microbubbles are CHI, CBI, and TVI (Wilkening et al., 1998). The current study demonstrates that CHI, CBI, and TVI enable the identification of parenchymal cerebral echo contrast enhancement in healthy individuals, All three methods reliably detected increases in acoustic intensities in various anatomic brain areas. Time variance imaging and CBI demonstrated signal increase in a higher portion of examined ROIs as compared with CHI. Time-to-peak intensities were not statistically different between different examination modes. Peak intensity could not be directly compared because of inhomogeneous intensity parameters—that is, strongly nonlinear relations between image intensity and concentration of microbubbles and different depth dependencies between examination modes. All quantitative data of the current study showed large variations between different individuals. The most important factors that contribute to these variations and that have to be considered when evaluating ultrasonic brain perfusion are thickness of the temporal bone, blood pressure, heart rate, and echo contrast agent specific phenomena such as depth-dependent attenuation of signals (“shadowing”). No adverse events were observed in the current study, Nevertheless. in transcranial ultrasound continuous insonation over a long time period with high energy may increase the temperature of adjacent brain structures and cause cavitation phenomena (Brayman et al., 1999; Wu et al., 1995), In the current study. occurrence of those phenomena is unlikely because of relatively low energy levels below a mechanical index of 1.0, which is comparable to conventional Power Doppler, and caused by short pulse sequences with large triggering intervals. In the current study. large inter- and intraindividual fluctuations of intensity increases as well as the difficulty to assess contrast enhancement in areas with high insonation depth made accurate rating of cerebral perfusion impossible in some individuals. This finding may be explained by the fact that CHI was acquired in parallel with CBI or TVI, respectively. The longer pulse sequences of these modes presumably destroy much of the contrast agent and, therefore, degrade the quality of the CHI images. A further factor that influences interpretation of ultrasonic brain perfusion studies are the acoustic properties of the echo contrast enhancer. Levovist (Schering AG, Berlin, Germany) provides microbubbles with an air filling and a relative fragile shell. Therefore, unlike microbubbles with stiffer shells and gases that reduce diffusion of gas through the shell like perfluoropropane, it is especially well suited for destructive modes such as CBI and TVI. In contrast, HI may visualize a more distinct and reproducible cerebral echo contrast enhancement when more stable agents are used (Seidel et al., 2000).
The fact that CHI displays tissue harmonic images facilitated permanent anatomic orientation in the current study. This could be particularly important for the examination of restless and uncooperative patients because position of the ultrasound probe can be corrected to compensate for patient motions. However, the morphologic information in the CHI images that is caused by the tissue harmonics renders rapid assessment of contrast enhancement more difficult and makes background subtraction necessary that may induce errors in quantitative interpretation (Bos et al., 1995). In this case, fitting a model function to the measured TIC, as described above, is especially advantageous, because it eliminates the necessity for image subtraction and, at the same time, yields the baseline intensity as well as other parameters. In CBI and TVI, the tissue signal is suppressed and the detected contrast agent signals are displayed color-coded making on-line detection of contrast enhancement very easy. However, unintentional movements of the ultrasound probe are easily overlooked and may considerably reduce the diagnostic value of these techniques. All three examination techniques have in common that data derived from TICs in different ROIs cannot be directly converted into quantitative information about focal brain perfusion (Wiencek et al., 1993). Because sound pressures are influenced by the attenuation through the temporal bone and parenchymal structures, acoustic pressures in different anatomic localizations will show large variations. Furthermore, all methods are based on nonlinear effects of echo contrast agents that cause a non-proportional relation between optic intensities and microbubble concentration. Nevertheless, in the current study, use of parameter images for PI and TPI made it possible to rapidly evaluate focal perfusion in an easily interpreted way based on the information condensed in a single parameter image. A further disadvantage of all transcranial ultrasound examination modes is the limited anatomic resolution. The high attenuation of the temporal bone requires the use of low-frequency transducers, which also have less bandwidth. The bone window also leads to phase aberrations that result in a defocusing of the ultrasound beam. These effects not only limit the resolution in the image plane, but also increase the slice thickness represented by the image. Furthermore, as confirmed by the current study, the distribution of acoustic pressures in sector scans is very inhomogeneous so that microbubbles are hardly detectable in the near field.
Previously published studies have shown that the acoustic signal that is generated or reflected during the destruction of microbubbles at high transmit power levels produces diagnostically relevant contrast, for example, for the identification of liver metastases in human and in animal studies (Blomley et al., 1999; Hauff et al., 1997). In comparison, the current study demonstrates for the first time that CBI and TVI produce accurate parenchymal cerebral contrast enhancement in healthy individuals and may be superior to HI modes. Reliability of those methods under physiologic and pathologic conditions has to be investigated in further studies, including more patients and reference methods like diffusion- and perfusion-weighted magnetic resonance imaging. However, echo contrast agent specific imaging modes may enable noninvasive and bedside measurement of cerebral parenchymal perfusion and may considerably influence therapeutic decisions such as thrombolysis and hemicraniectomy in acute stroke patients.