
Abstract
Methods for imaging of cerebral blood flow do not typically resolve the cortex and thus underestimate flow. However, recent work with high-resolution MRI has emphasized the regional and depth-dependent structural, functional and relaxation times variations within the cortex. Using high-resolution Arterial Spin Labeling (ASL) and T1 mapping acquisitions, we sought to probe the effects of spatial resolution and tissue heterogeneity on cortical cerebral blood flow (CBF) measurements with ASL. We acquired high-resolution (1.6mm) 3 whole brain ASL data in a cohort of 10 volunteers at 3T, along with T1 and transit-time (ATT) mapping, followed by group cortical surface-based analysis using FreeSurfer of the different measured parameters. Fully resolved regional analysis showed higher than average mid-thickness CBF in primary motor areas (+15%,p<0.002), frontal regions (+17%,p<0.01) and auditory cortex, while occipital regions had lower average CBF (-20%,p<10−5). ASL signal was higher towards the pial surface but correction for the shorter T1 near the white matter surface reverses this gradient, at least when using the low-resolution ATT map. Similar to structural measures, fully-resolved ASL CBF measures show significant differences across cortical regions. Depth-dependent variation of T1 in the cortex complicates interpretation of depth-dependent ASL signal and may have implications for the accurate CBF quantification at lower resolutions.
Introduction
The modest spatial resolution of in-vivo cerebral blood flow (CBF) imaging is a challenge both for accurate quantification of cortical CBF and for the study of function within cortical layers. When the spatial resolution exceeds the thickness of the cortex, measures of cortical blood flow are all reduced by a factor related to the partial volume of cortex within the voxel. Further errors are introduced when quantification involves nonlinear calculations as in conventional positron emission tomography. 1 Higher resolution CBF imaging could overcome these errors and ultimately enable the study of heterogeneity of function across cortical regions and cortical layers to mirror developments with structural 2 and blood-oxygenation 3 imaging.
Arterial Spin Labeling (ASL) MRI is an appealing CBF imaging technique for high resolution studies in part because it can be acquired in the same session with high resolution structural MRI. Most ASL acquisitions are performed at low spatial resolution where partial volume effects significantly affect CBF measures. Though the linear effects of partial volume may be addressed by image analysis methods,4,5 non-linear factors including partial volume of CSF in the reference image, which is included as a divisor in quantification,6,7 and variable T1 across the voxel, also may affect quantification. Fortunately, the spatial resolution of ASL is fundamentally limited primarily by signal-to-noise ratio, so improved sensitivity with higher field, array coils and higher resolution image acquisitions make it possible to resolve the cortex.
Here we employed a recently reported ASL volumetric image acquisition method 8 to explore the implications of higher resolution acquisition for cortical CBF imaging. An important advantage of this acquisition is the absence of susceptibility induced spatial distortions such that highly accurate registration with quantitative T1 imaging and cortical surface-based analysis were readily possible across the whole brain.
Material and methods
Experiments
We recruited N = 10 healthy volunteers (6M, 4F, 30 ± 7 y.o, 7 self-declared right-handed, 1 left-handed, 1 ambidextrous with a right predominance and 1 without collected handedness information) for this study. All studies followed a protocol compliant with state and federal regulations governing the conduct of human subject research (45 Code of Federal Regulations(CFR) Part 46 and 21 CFR Parts 50 and 56), adhering to the ethical principles set forth in the Belmont Report and approved by the Beth Israel Deaconess Medical Center Committee on Clinical Investigations (protocol number 2011P000108). Written informed consent was obtained from all subjects.
All scans were performed on a 3T scanner (Discovery MR750, GE Healthcare, Waukesha, WI) using body coil RF transmission and the commercial 32-channel receive-only head coil for signal reception and using cushion pads to enforce immobilization in the coil.
Prior to perfusion imaging, we acquired fast, low-resolution 2D-Time-of-Flight (TOF) MRA localizers covering the base of the skull and neck to visualize the vascular anatomy for optimal labeling plane positioning (TR/TE = 12/4.4 ms, flip-angle = 90°, FOV =300mm, 1.6 × 2.3 mm2 in-plane resolution, 5-mm slice thickness, acquisition time = 23 s), as well as high-resolution 1 mm3 T2-weighted Fluid Attenuated Inversion Recovery (FLAIR) using a 3D-FSE sequence and T1-weighted Magnetization Prepared 2 Rapid Acquisitions of Gradient Echoes (MP2RAGE) for simultaneous high-resolution T1-weighted and quantitative T1 imaging
9
(174 sagittal slices, FOV =256 × 256 × 170mm3). Specific parameters were:
T1-MP2RAGE: TI1/TI2/TRMP2RAGE/TR/TE = 700/2000/4500/3.4/1.3 ms, flip angles α1/α2 = 4 and 5°, acquisition time = 9 min 36 s T2-FLAIR: TI/TR/TE = 1746/6200/103 ms, variable refocusing flip-angles, ETL = 200, receiver bandwidth = 50 kHz, parallel-imaging with R = 2 in both phase and slice-encoding directions, acquisition time = 5min 38s.
To estimate ATT and ensure absence of major artifacts linked to poor labeling efficiency, we acquired lower resolution (642 matrix, 34 sagittal slices, 4 × 4 ×5mm3) multi-delay ASL volumes using a multi-shot 3D-FSE sequence with regular sampling and parallel-imaging acceleration only (8 shots, R = 2 in both phase/slice direction) with a labeling duration of 2.2s and post-labeling delays of 0.7, 1.5 and 2.2s in 2min for each delay. The labeling plane was positioned based on the TOF localizer as high as possible at the base of the skull to label efficiently a straight section of the vertebral and carotid arteries. Vessel-suppression was employed to remove contamination from intravascular spins that have not exchanged with tissue at time of imaging with a cutoff velocity of Vc = 3.4 cm/s. 10
After the low-resolution transit-time mapping, we acquired a high-resolution, single-delay, vessel-suppressed ASL volume using a variable-density FSE sequence described earlier 8 using a labeling duration of 2.2s and a PLD of 1.8s, same vessel suppression and labeling position as the low-resolution scans used for transit-time mapping. Compared to its previous implementation, the VD sampling included an oversampled k-space central region acquired during each echo-train to enhance motion robustness (region size 42).
An interleaved labeling and background suppression scheme was used, optimized as described in 11 leading to the use of a pre-saturation quadrature phase pulse immediately prior to the beginning of labeling (Tsat =4s before imaging), 2 selective inversions (C-shaped FOCI) at T = 2978 and 1445 ms and 2 non-selective inversions (hyperbolic secant) at T = 521 and 111 ms.
Imaging parameters were: FOV = 230 × 230 ×172 mm3, bandwidth 41.7 kHz, 108 sagittal slices, 140 × 140 matrix (isotropic 1.6 mm nominal resolution), TR/TE = 7000–7200/13 ms, acquisition time of 20.5–21 min. All subjects were instructed to close their eyes and relax to minimize unwanted brain activations during all ASL scans. 12 We also acquired separately a pre-saturated (Tsat = 4s) proton-density weighted (PD-w) reference scan with vessel-suppression with regular sampling and parallel-imaging acceleration only (R = 2.5 acceleration factor in both phase and slice dimensions) for coil sensitivity and fully-relaxed magnetization (M0) estimation. This was acquired with the same imaging parameters and system adjustments in 3 minutes. An illustration of typical data quality from this protocol is shown in Figure 1.
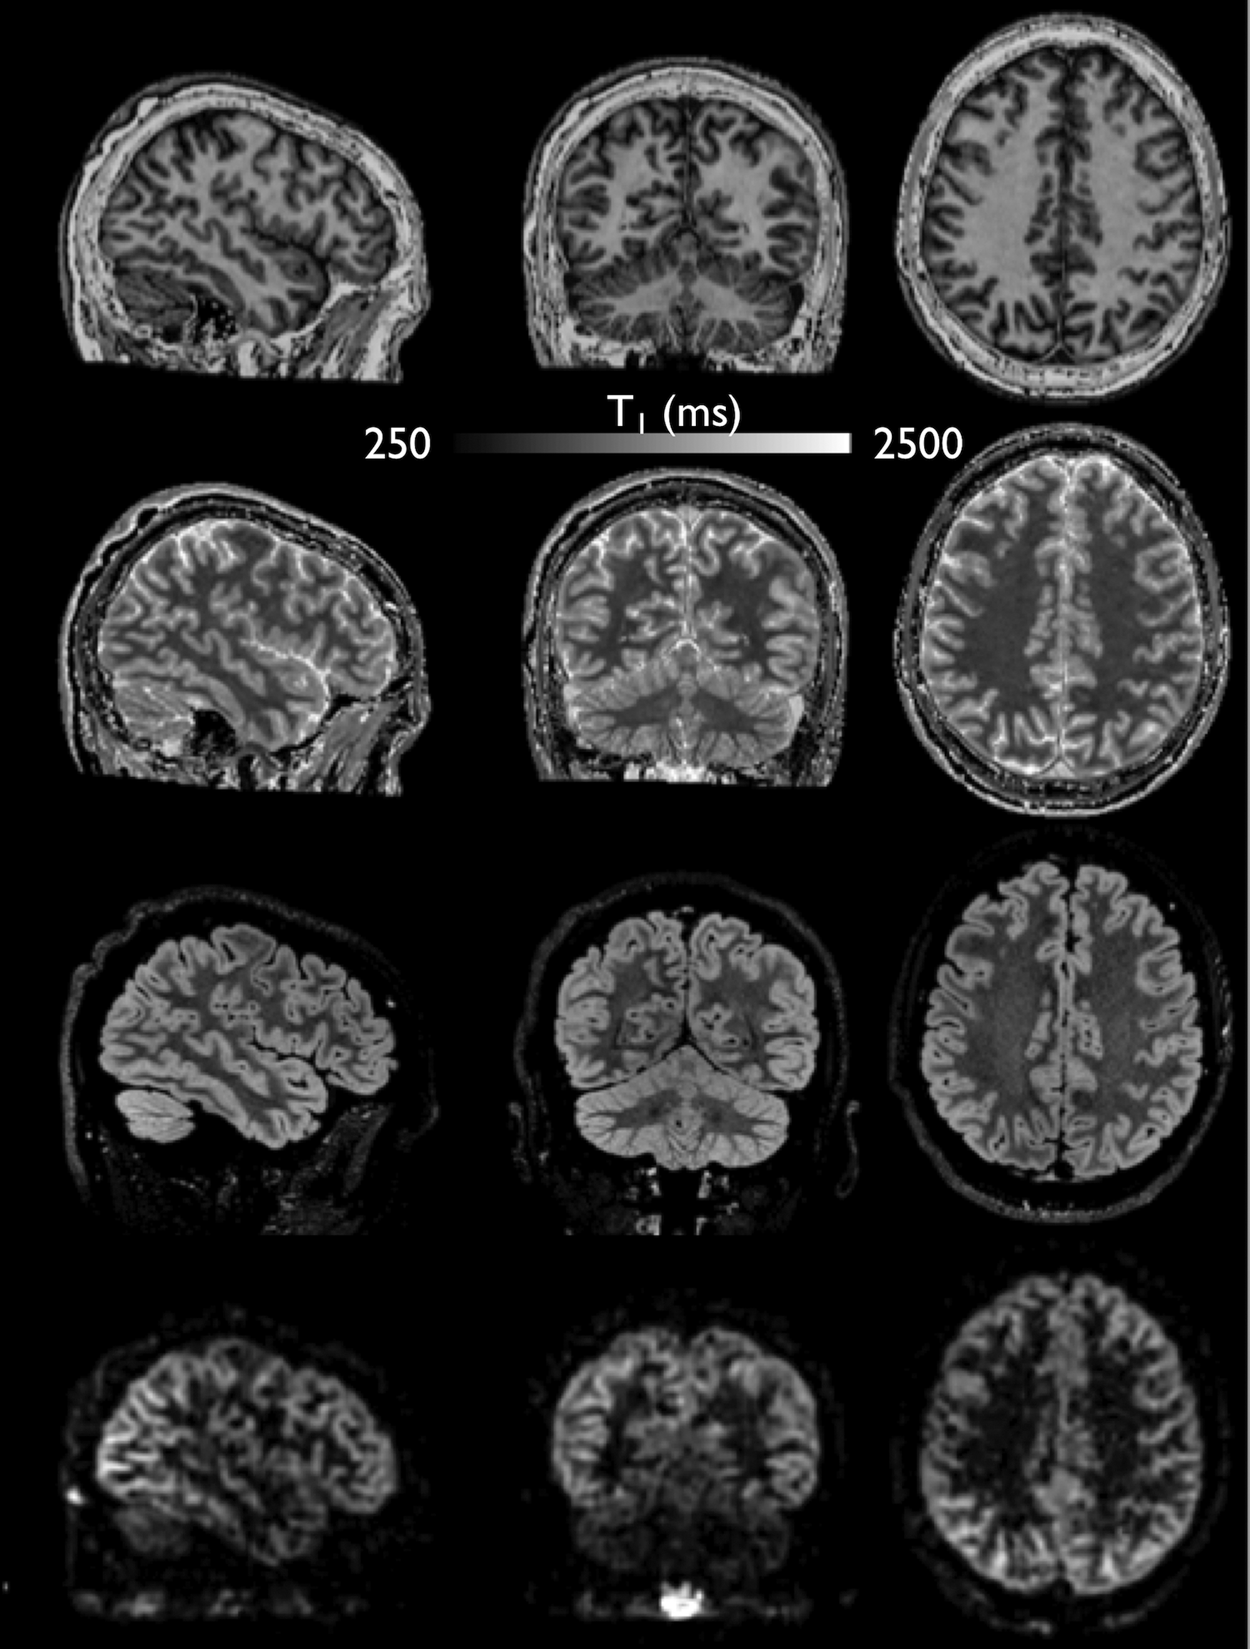
Example of (a) T1-weighted, (b) T1 map, (c) T2-FLAIR and (d) high-resolution 1.6mm isotropic ASL perfusion-weighted data.
Image reconstruction
All ASL data were saved as raw k-space data for offline reconstruction using MATLAB (R2017b, MathWorks, Natick, MA).
We first reconstructed T1-weighted volumes from the two MP2RAGE inversion time images by combining them as following

With GRETI1 and GRETI2 representing the 2 individual GRE volumes and GRETI1* the complex conjugate of GRETI1. From this volume, the quantitative T1 map was calculated using a lookup table approach as reported previously. 9
Following this, the low-resolution multi-delay ASL scans were reconstructed using an L1-ESPIRiT regularized reconstruction implemented in the Berkeley Advanced reconstruction Toolbox (BART, release 0.4).
13
The ATT was then calculated using the weighted-delay approach as a time-efficient and robust method as shown previously
14
For the high-resolution ASL data, prior to any reconstruction, a k-space filter was applied combining echo amplitude scaling to compensate for T2-blurring during the echo-train 15 assuming T1 = 1600 ms and T2 = 100 ms (corresponding to gray matter) and a 3D Fermi filter.
After estimating the coil-sensitivity using ESPIRiT on the reference PD-weighted volume, 16 we reconstructed perfusion-weighted volumes using a L1-wavelet regularized Compressed-Sensing reconstruction as described previously. 8
Group cortical surface-based analysis and statistics
For each individual subject, we reconstructed the cortical surfaces using FreeSurfer (v6.0, https://surfer.nmr.mgh.harvard.edu/)17–19 using the recon-all pipeline on the T1-weighted volume using also the T2-FLAIR for correction of the pial surface. Following this, a boundary-based registration of the ASL perfusion-weighted, ATT and M0 volumes to the T1-weighted volume was performed, followed by projection on an averaged surface and averaged across subjects, followed by smoothing along the surface with a 5-mm full width at half maximum (FWHM) Gaussian kernel.
An absolute cortical surface-based (measured at a 50% depth between the pial and white matter surface) CBF was calculated using a kinetic model accounting for regional variations in ATT and T17,20

With dM and M0,t the ASL perfusion-weighted difference and fully-relaxed magnetization estimated from the PD-w reference volume, corrected for incomplete T1 recovery as following
In (3)
To understand the effects of ATT and T1 on cortical CBF quantification, we also calculated a CBF with a single-compartment model assuming T1,b = T1,t, e.g.
We also computed two additional CBF maps with:
T1,t = T1,b but using the calculated transit time map ATT = 1.4s
14
and using the calculated T1 map
This allows separating the contribution of ATT and T1 to variations in CBF between the two models.
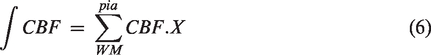
We additionally calculated an integrated CBF over the whole cortex, defined as the sum of CBF values at different sampling points multiplicated by the cortical thickness X
We compared CBF calculated with both models and with only T1 or ATT correction in each of the 74 ROI of the Destrieux atlas 21 included in FreeSurfer using paired t-tests. We also assessed potential correlations between both corrected/uncorrected CBF and T1 and cortical thickness using Spearman’s correlation.
To assess the regional CBF variations, we performed paired t-tests across subject comparing each ROI to the median CBF sampled at mid-thickness and integrated CBF across all ROIs, also comparing CBF values in the left and right hemisphere for each ROI. A Bonferroni correction was applied for multiple comparisons leading to an adjusted significance level of p = 0.0007.
We also calculated a surface-based Z-score map to provide a spatial representation of the regional CBF variations, defined as

Finally, we studied the distribution of both corrected/uncorrected CBF through the cortex by sampling the different parameters by 5% steps from the white matter to the pial surface. This allows providing a continuous visualization of the potential depth-dependence of CBF although at our 1.6mm nominal resolution, a reasonable assumption of 3 steps at 25, 50 and 75% depth are what can be accurately measured.
We then plotted each parameter against cortical depth averaged across ROIs, as well as T1 (we considered the ATT resolution too coarse to perform such analysis). We also plotted both parameters in one individual ROI (precentral gyrus), known to be one of the thickest cortical areas.
Statistics were performed using JMP 14 Pro (SAS, Cary, NC), with a significance level set at p<0.05.
Results
Regional distribution of resting cerebral blood-flow
The regional distribution of resting mid-distance sampled and integrated CBF over the cortex, as well as T1 and ATT is displayed in Figure 2. The average ± STD/median cortical CBF (across subjects and regions) were 72.8 ± 14/72.9 mL/100g/min in the left and 70.7 ± 14/69.6 mL/100g/min in the right hemisphere. Detailed ROI statistics are displayed for both hemispheres in Table 1 (corrected CBF measured at 50% cortical depth) and Table 2 (Integrated corrected CBF). A visual representation of those results is displayed in Figure 3 through Z-score maps, confirming ROI-based statistics.
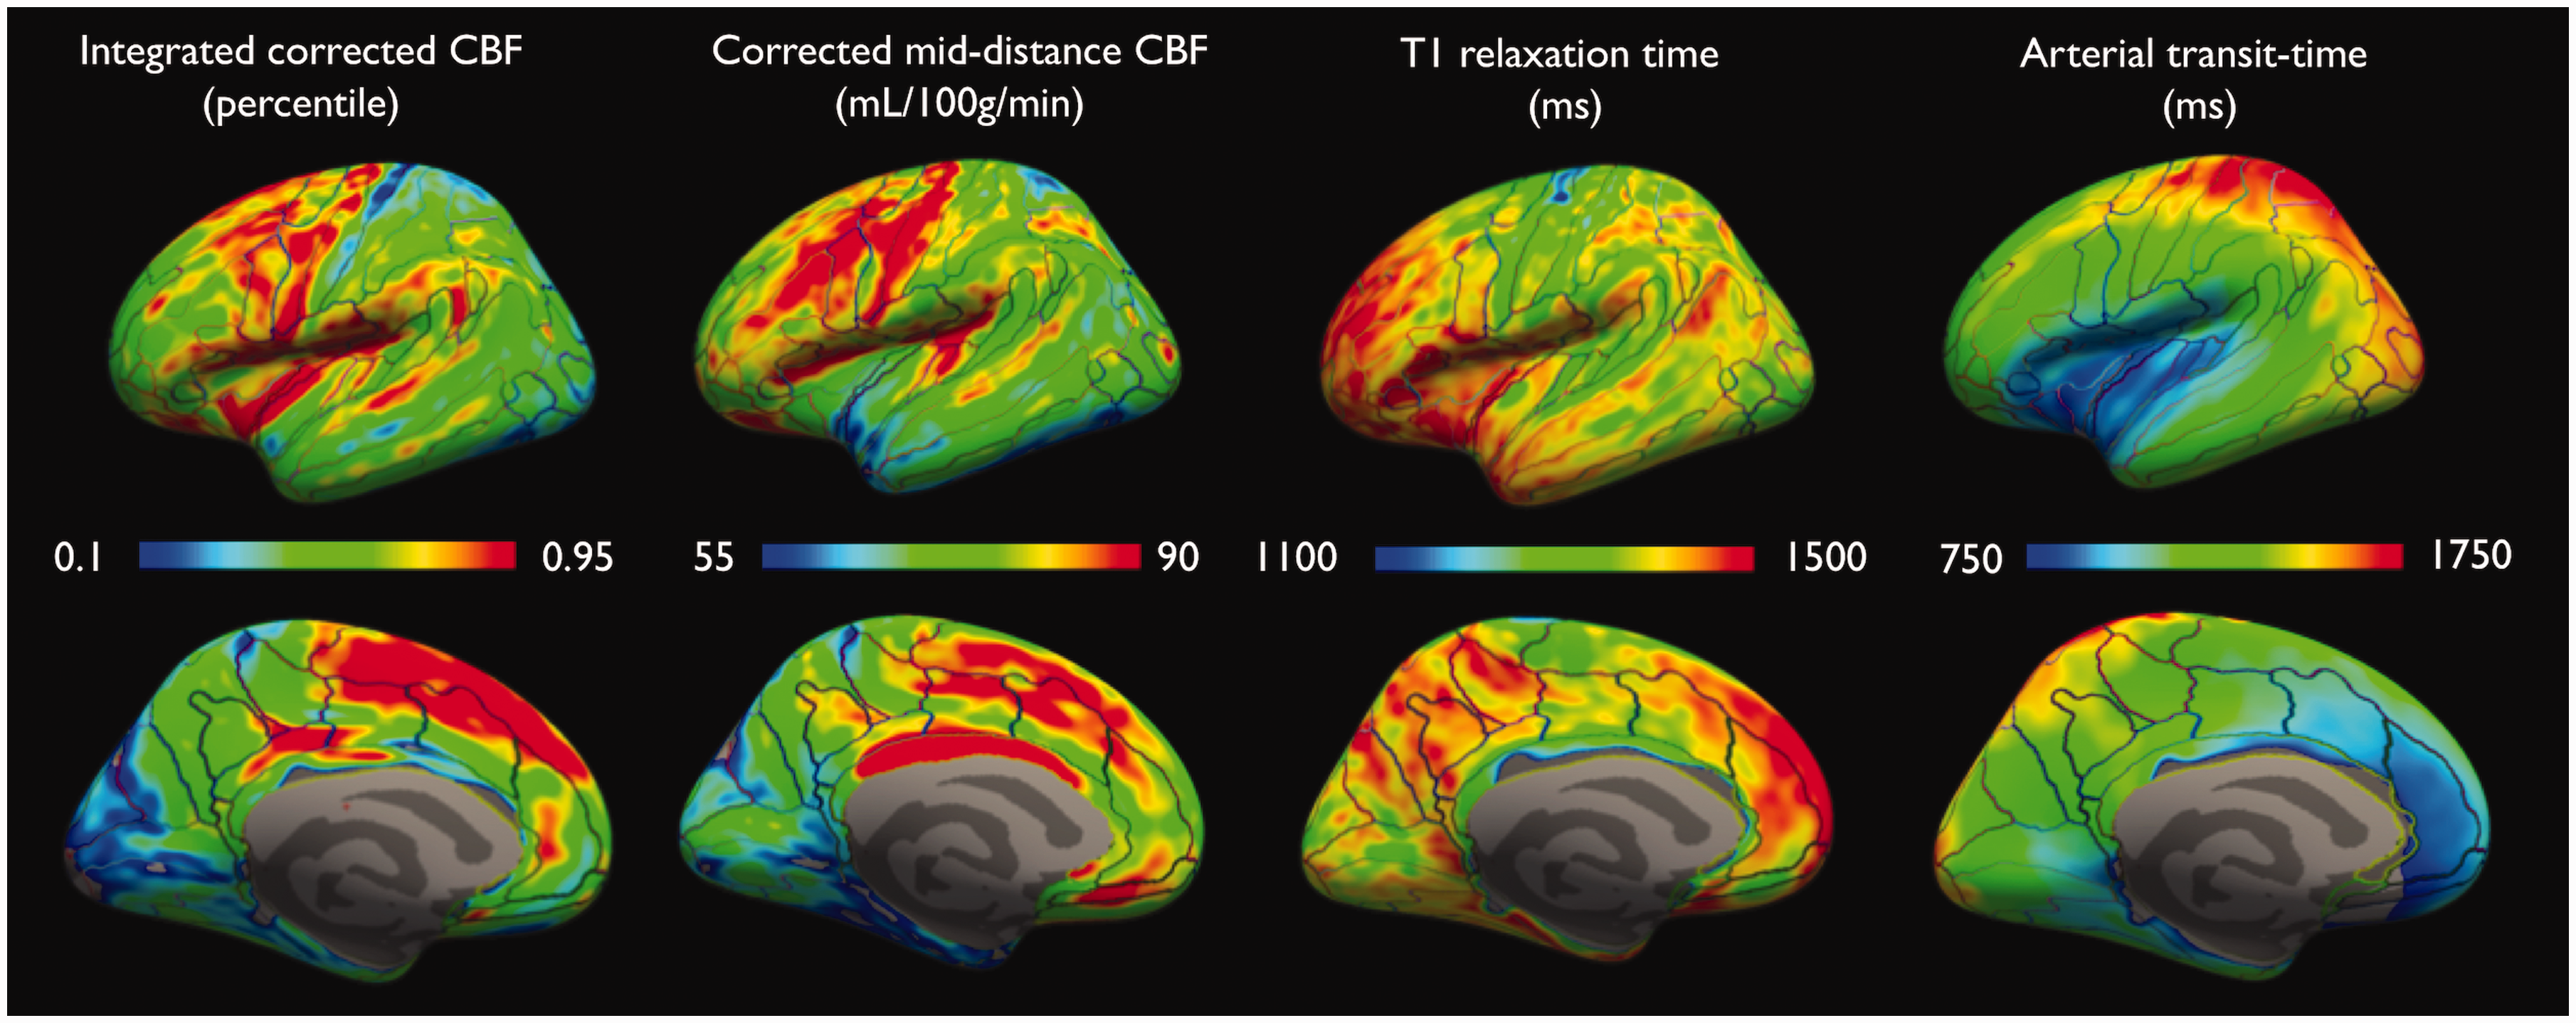
Integrated and mid-distance sampled CBF, T1 and ATT projected on an inflated pial surface of the left hemisphere
Results of paired t-tests across subjects in each of the 74 ROI in each hemisphere for the corrected CBF measured at 50% cortical depth.
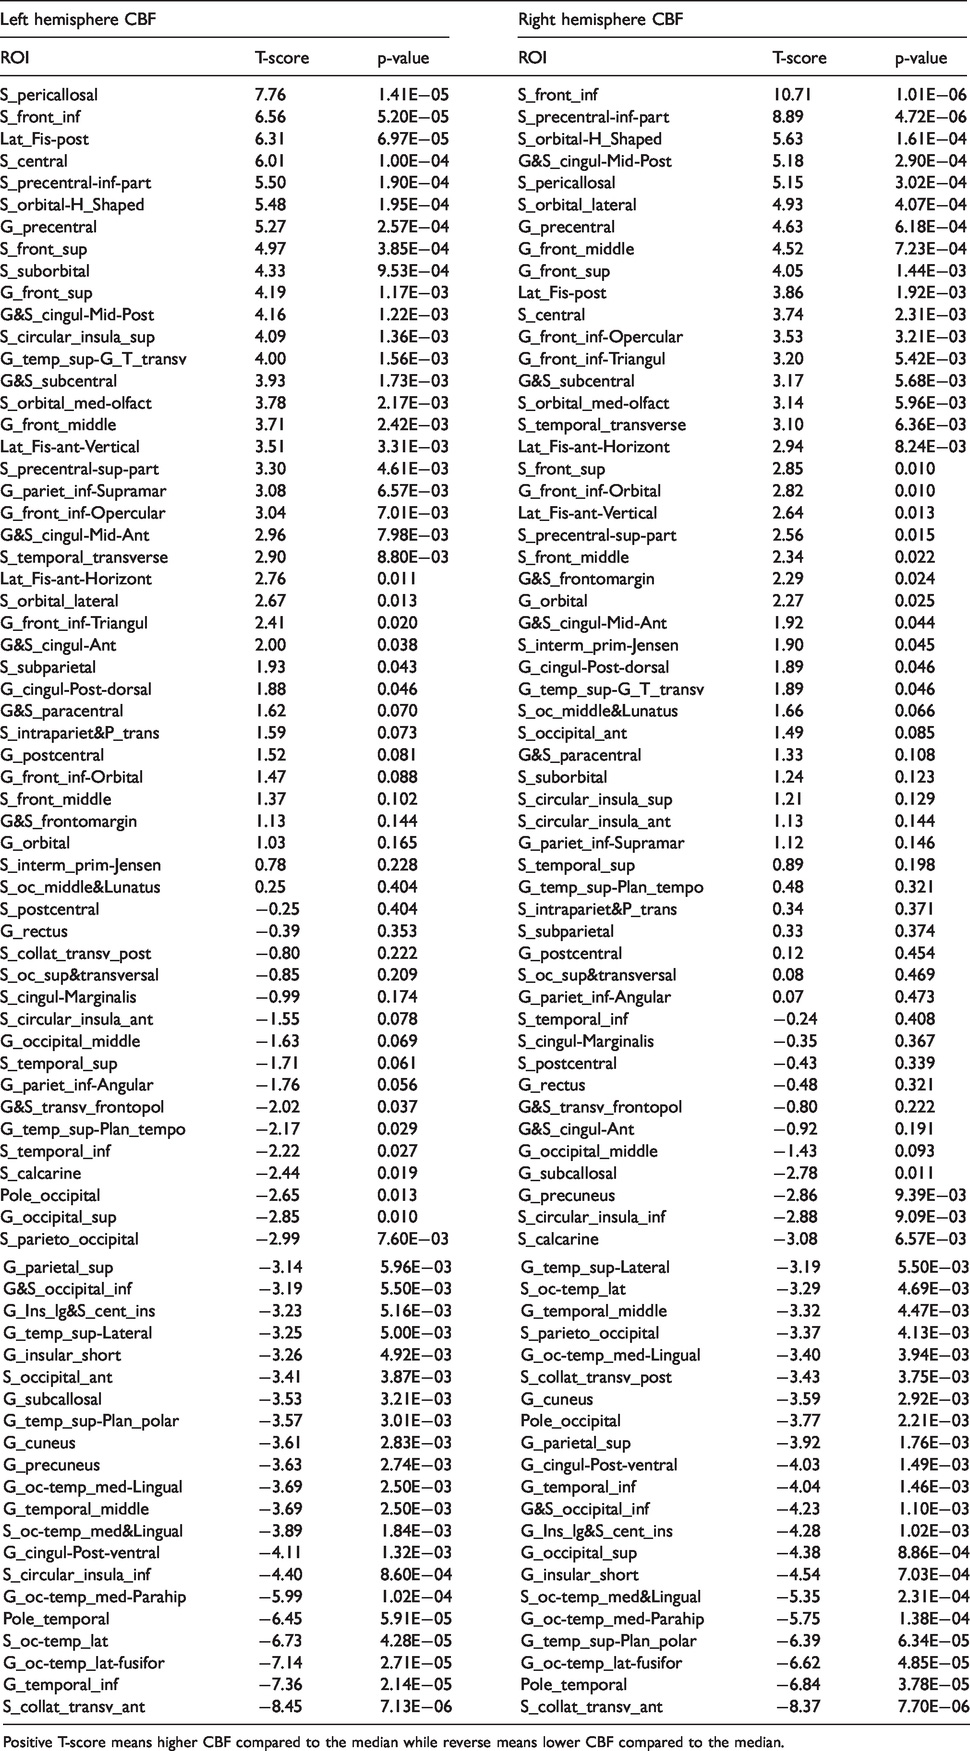
Positive T-score means higher CBF compared to the median while reverse means lower CBF compared to the median.
Results of t-tests across subjects in each of the 74 ROI in each hemisphere for the corrected integrated CBF.
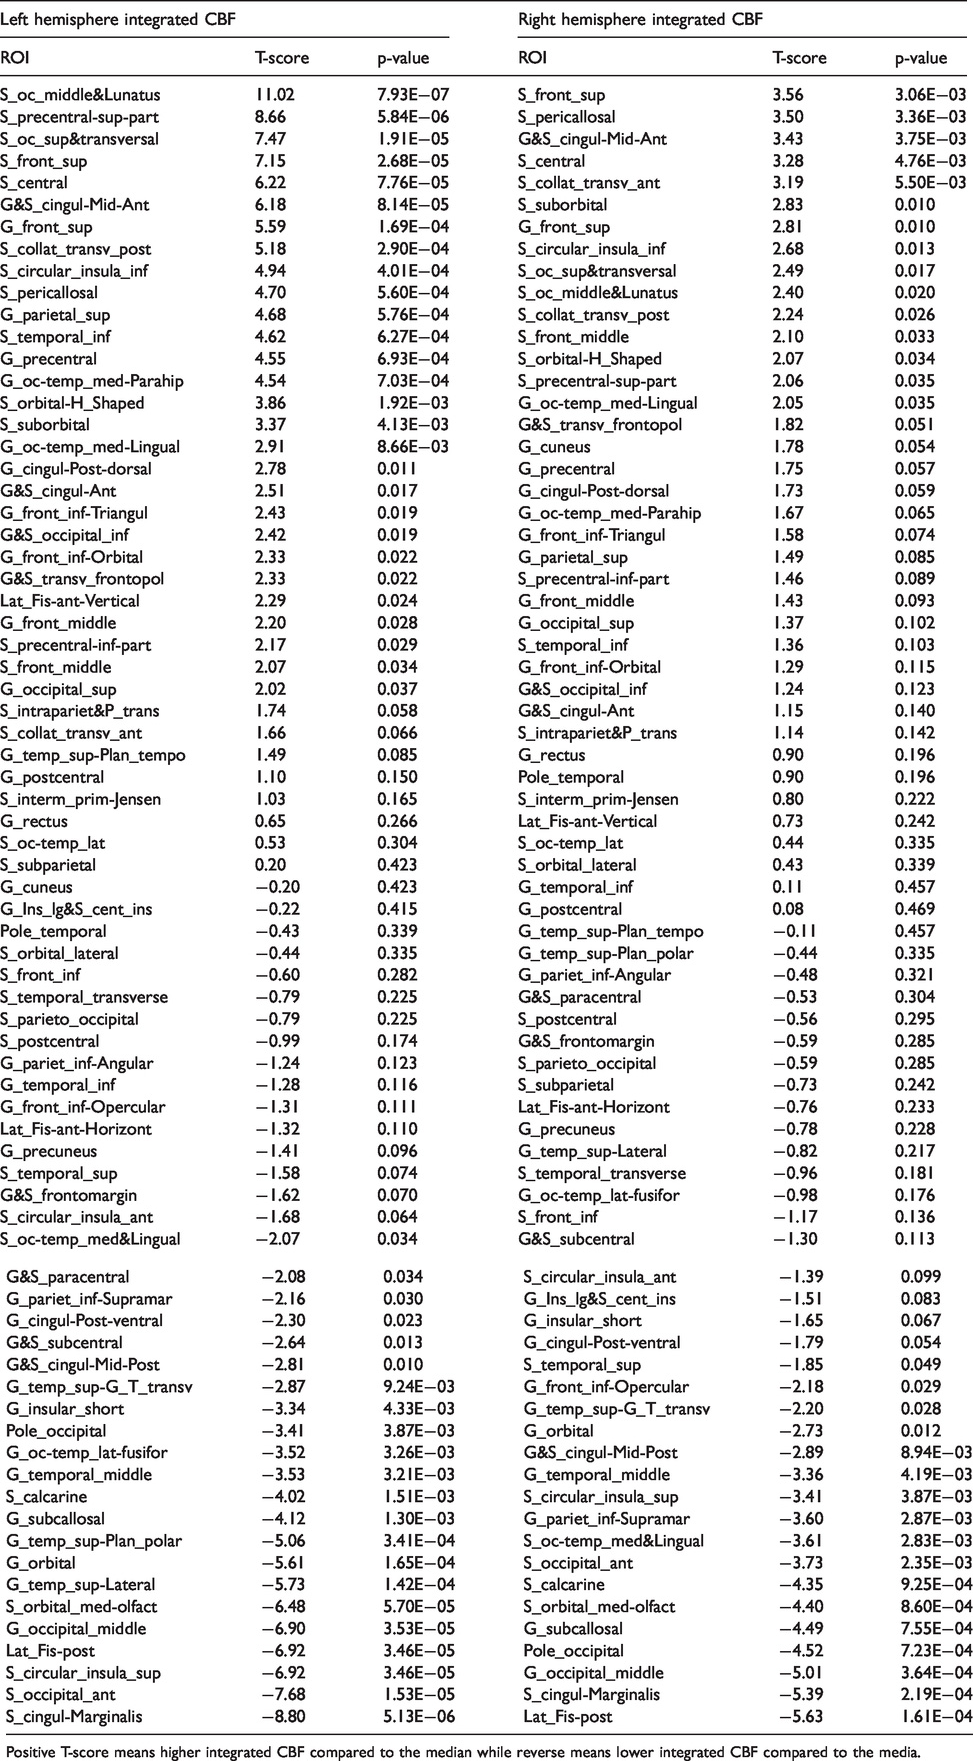
Positive T-score means higher integrated CBF compared to the median while reverse means lower integrated CBF compared to the media.
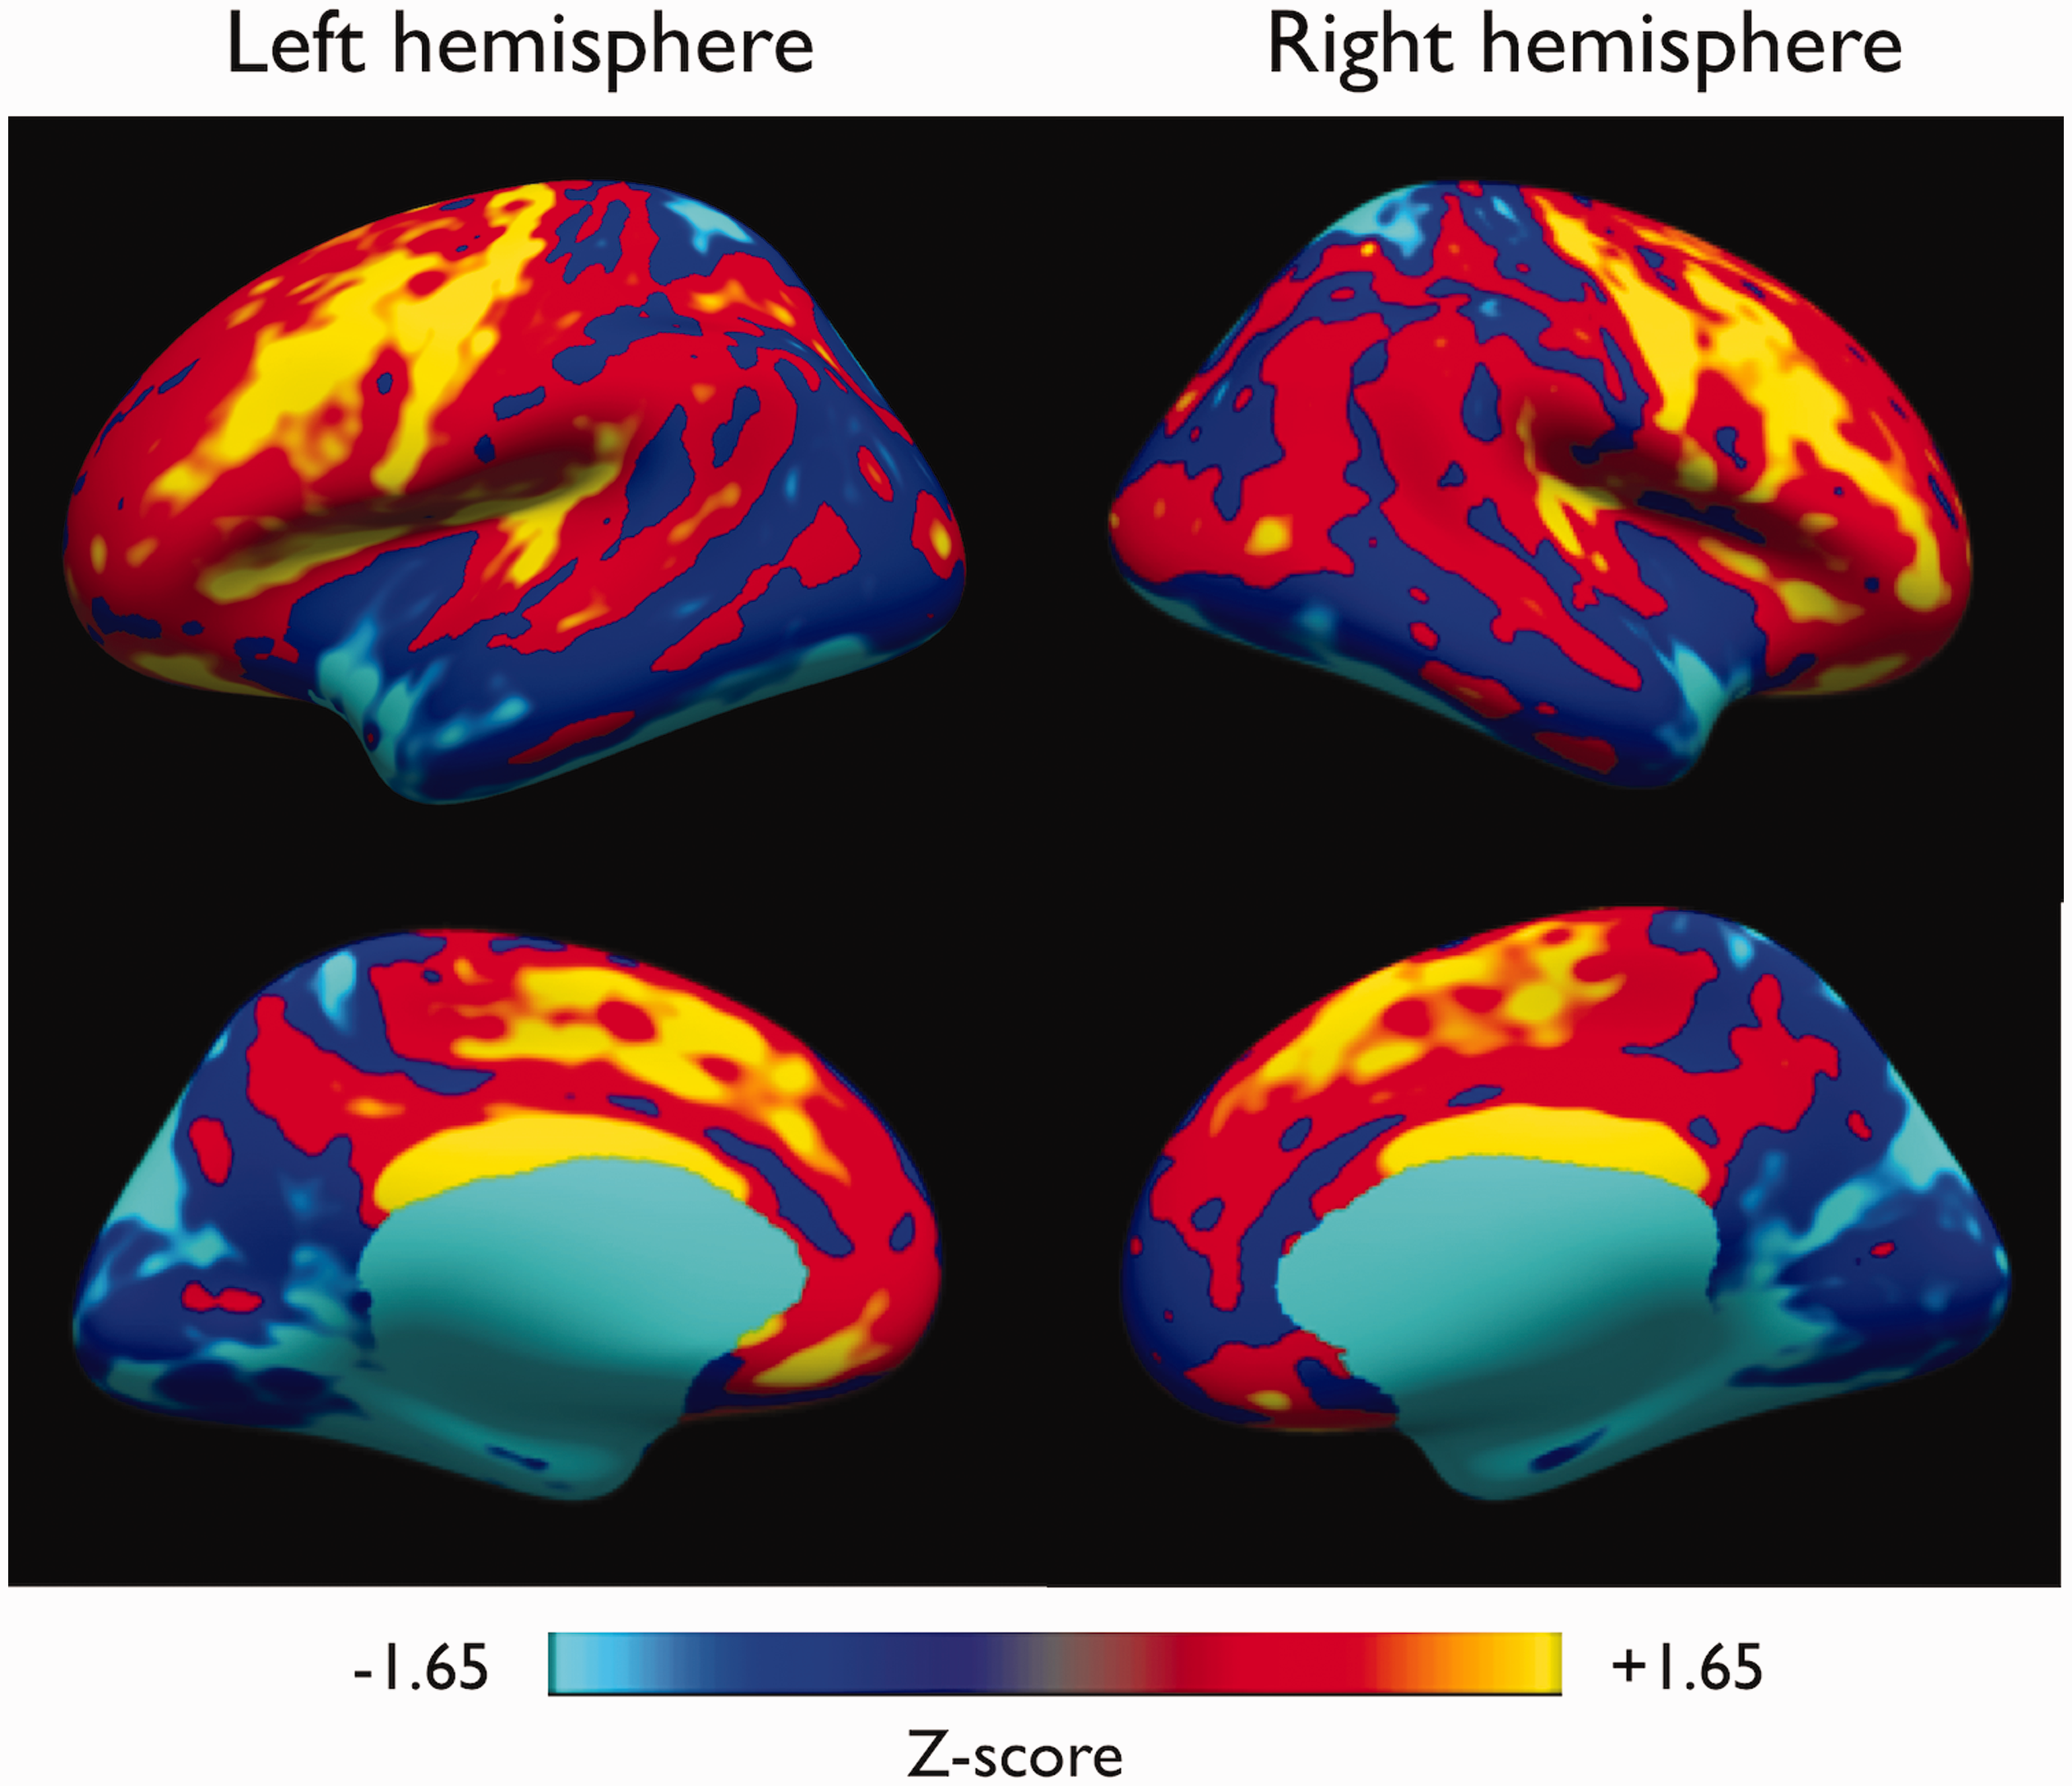
Group Z-score maps showing CBF regional variation.
Analysis of the regional CBF distribution highlighted higher than median flow in the primary motor areas in both hemispheres, i.e. in the central sulcus (S_central, left/right average = 83 ± 11 mL/100g/min, p = 0.0001 and 0.002 respectively), precentral gyrus (G_precentral, left/right average = 82 ± 10 mL/100g/min, p = 0.0003 and 0.0006 respectively), but also bilaterally in the primary auditory cortex (G_temp_sup_G_T_transv, left/right average = 79 ± 8 mL/100g/min, p = 0.0015 and 0.046) although non-significant after Bonferroni correction. We also observed higher than median flow in frontal associative areas such as inferior and superior frontal sulci and gyri (S_front_inf, G_front_inf, S_front_inf, G_front_sup, p-values ranging from 0.01 to < 10−6). Conversely, lower than median flow was observed in occipital and temporal regions such as the occipital pole (Pole_occipital, left/right average = 64 ± 14 mL/100g/min, p = 0.013 and 0.002 respectively, non-significant after Bonferroni correction) and the temporal pole (Pole_temporal, left/right average = 57 ± 8 mL/100g/min, p < 10−5)
Hemispheric CBF comparison also showed some significant left-to-right differences (details in Supplementary Material). For instance, we found a significantly higher mid-distance sampled and integrated CBF in the left central sulcus (T = −2.24, p = 0.02) as well as postcentral sulcus (T = −2.78, p = 0.01) and gyrus (T = −2.01, p = 0.04) while the precentral gyrus was close to significance (T = −1.82, p = 0.051). Nonetheless, those results became non-significant after Bonferroni correction.
When looking at the transit-time distribution, as expected, parietal and occipital regions tend to have longer transit times compared to frontal and temporal regions due to different vascular supply, with the shorter ATT found in the insula (825ms) and longer ATTs found in the superior parietal gyrus (1685ms).
The T1 distribution in the cortex shows lower T1 in primary cortices while associative areas tend to have longer T1, consistent with known myelination features of the cortex. Importantly, it is worth noting that the average T1 across cortical gray matter, measured at 1360 ± 80 ms, is 15% shorter than the estimated T1 of blood, defined here as T1,b = 1600 ms.
Impact of T1 and transit-time corrections on CBF quantification
Comparison between corrected and uncorrected CBF maps shows that overall the flow topology looks similar with some regional variations mostly in the cingulate and frontal regions. Quantitatively, the group-averaged corrected cortical CBF was found to be 38 ± 7% higher than the uncorrected CBF (72.2 ± 8.4 vs 52.1 ± 5.4 mL/100g/min, p<0.0001) in the left hemisphere, with similar observations in the right hemisphere (70.0 ± 8.8 vs 50.5 ± 5.7 mL/100g/min, p<0.0001). This increase in CBF was driven by the correction for tissue T1, as ATT-corrected CBF assuming T1,t = T1,b was not significantly different than the uncorrected CBF (p = 0.65) while T1-corrected CBF assuming a constant ATT was significantly higher than the uncorrected CBF (p<0.0001). This agrees with theoretical calculations that show that for a similar ASL signal, a 25% difference in ATT or T1 will lead to a calculated CBF difference of 1 or 20% respectively for our imaging parameters. The CBF regional distribution can be appreciated with the various corrections in Figure 4, confirming quantitative results showing significant changes associated with T1 variations for example in the cingulate or frontal regions. For more details, all ROI-based data are provided in a spreadsheet as Supplementary Material.
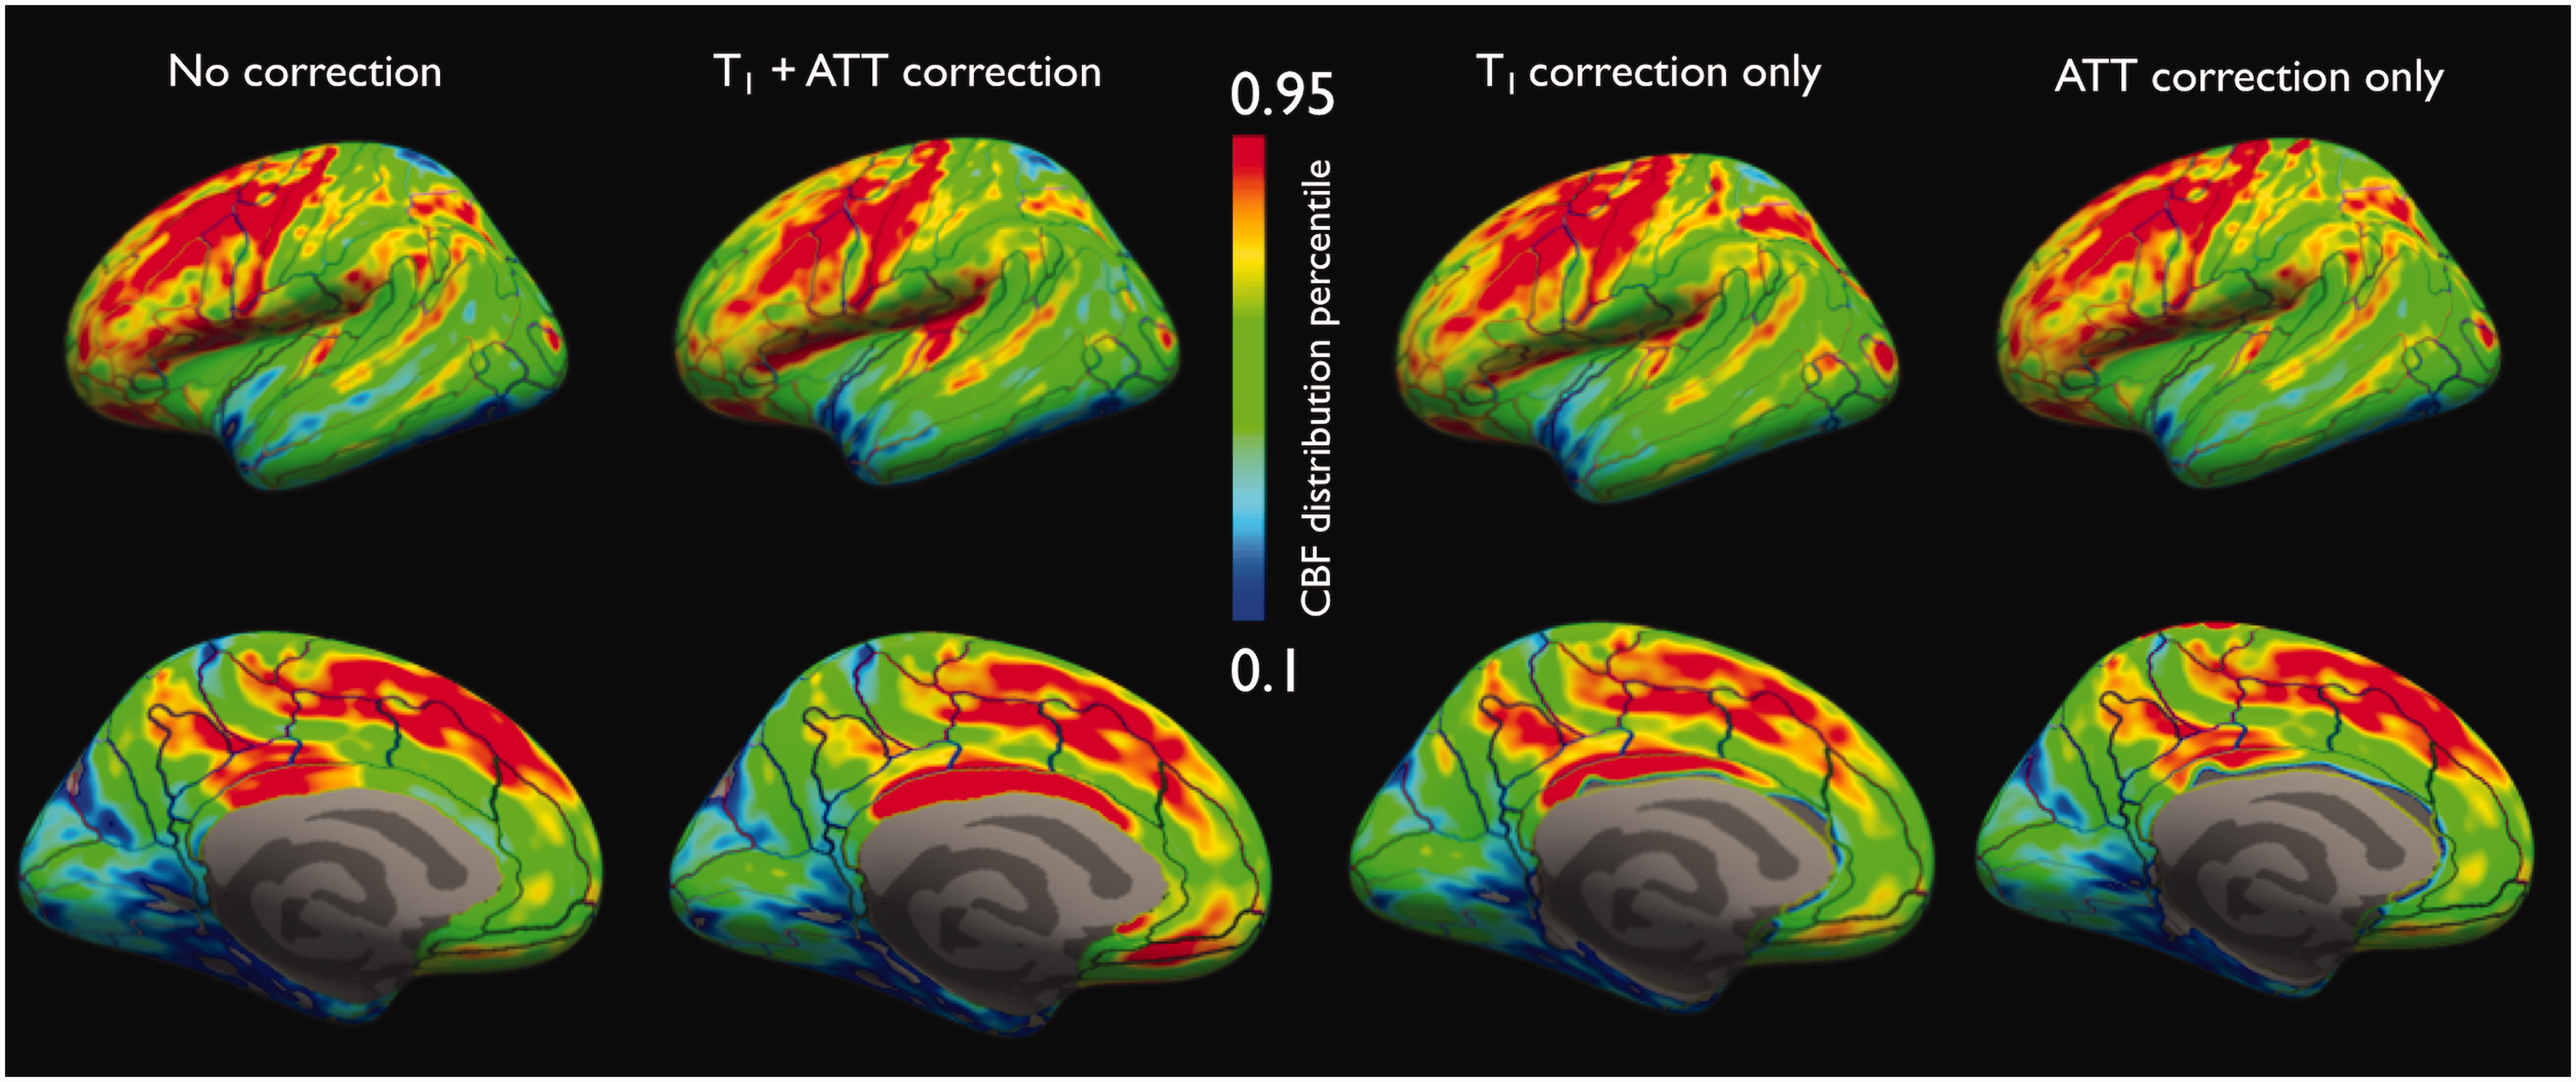
Uncorrected, as well as T1/ATT, T1 only and ATT-only corrected CBF sampled at mid-distance in the cortex (left-hemisphere). A relative color scale is shown because of different CBF values depending on which correction is used.
No significant correlation was observed between corrected/uncorrected CBF and the cortical thickness.
Depth-dependence of cortical blood-flow
Uncorrected and corrected CBF presented different depth profiles as seen on Figure 5. In the uncorrected case, we observe a moderate increase in blood-flow followed by a decrease when moving deeper into the cortex towards the white matter. Interestingly, when correcting for tissue T1 and ATT, we observe a different behavior, with an opposite trend of lower flow that increases when moving towards deeper cortical layers. The T1 profile across the cortex is also shown averaged across regions to be able to understand the nature of changes associated with the use of T1-correction. Indeed, T1 shortens when moving from superficial to deeper cortical layers, loosing between 20 and 40ms every 10% of cortical thickness.
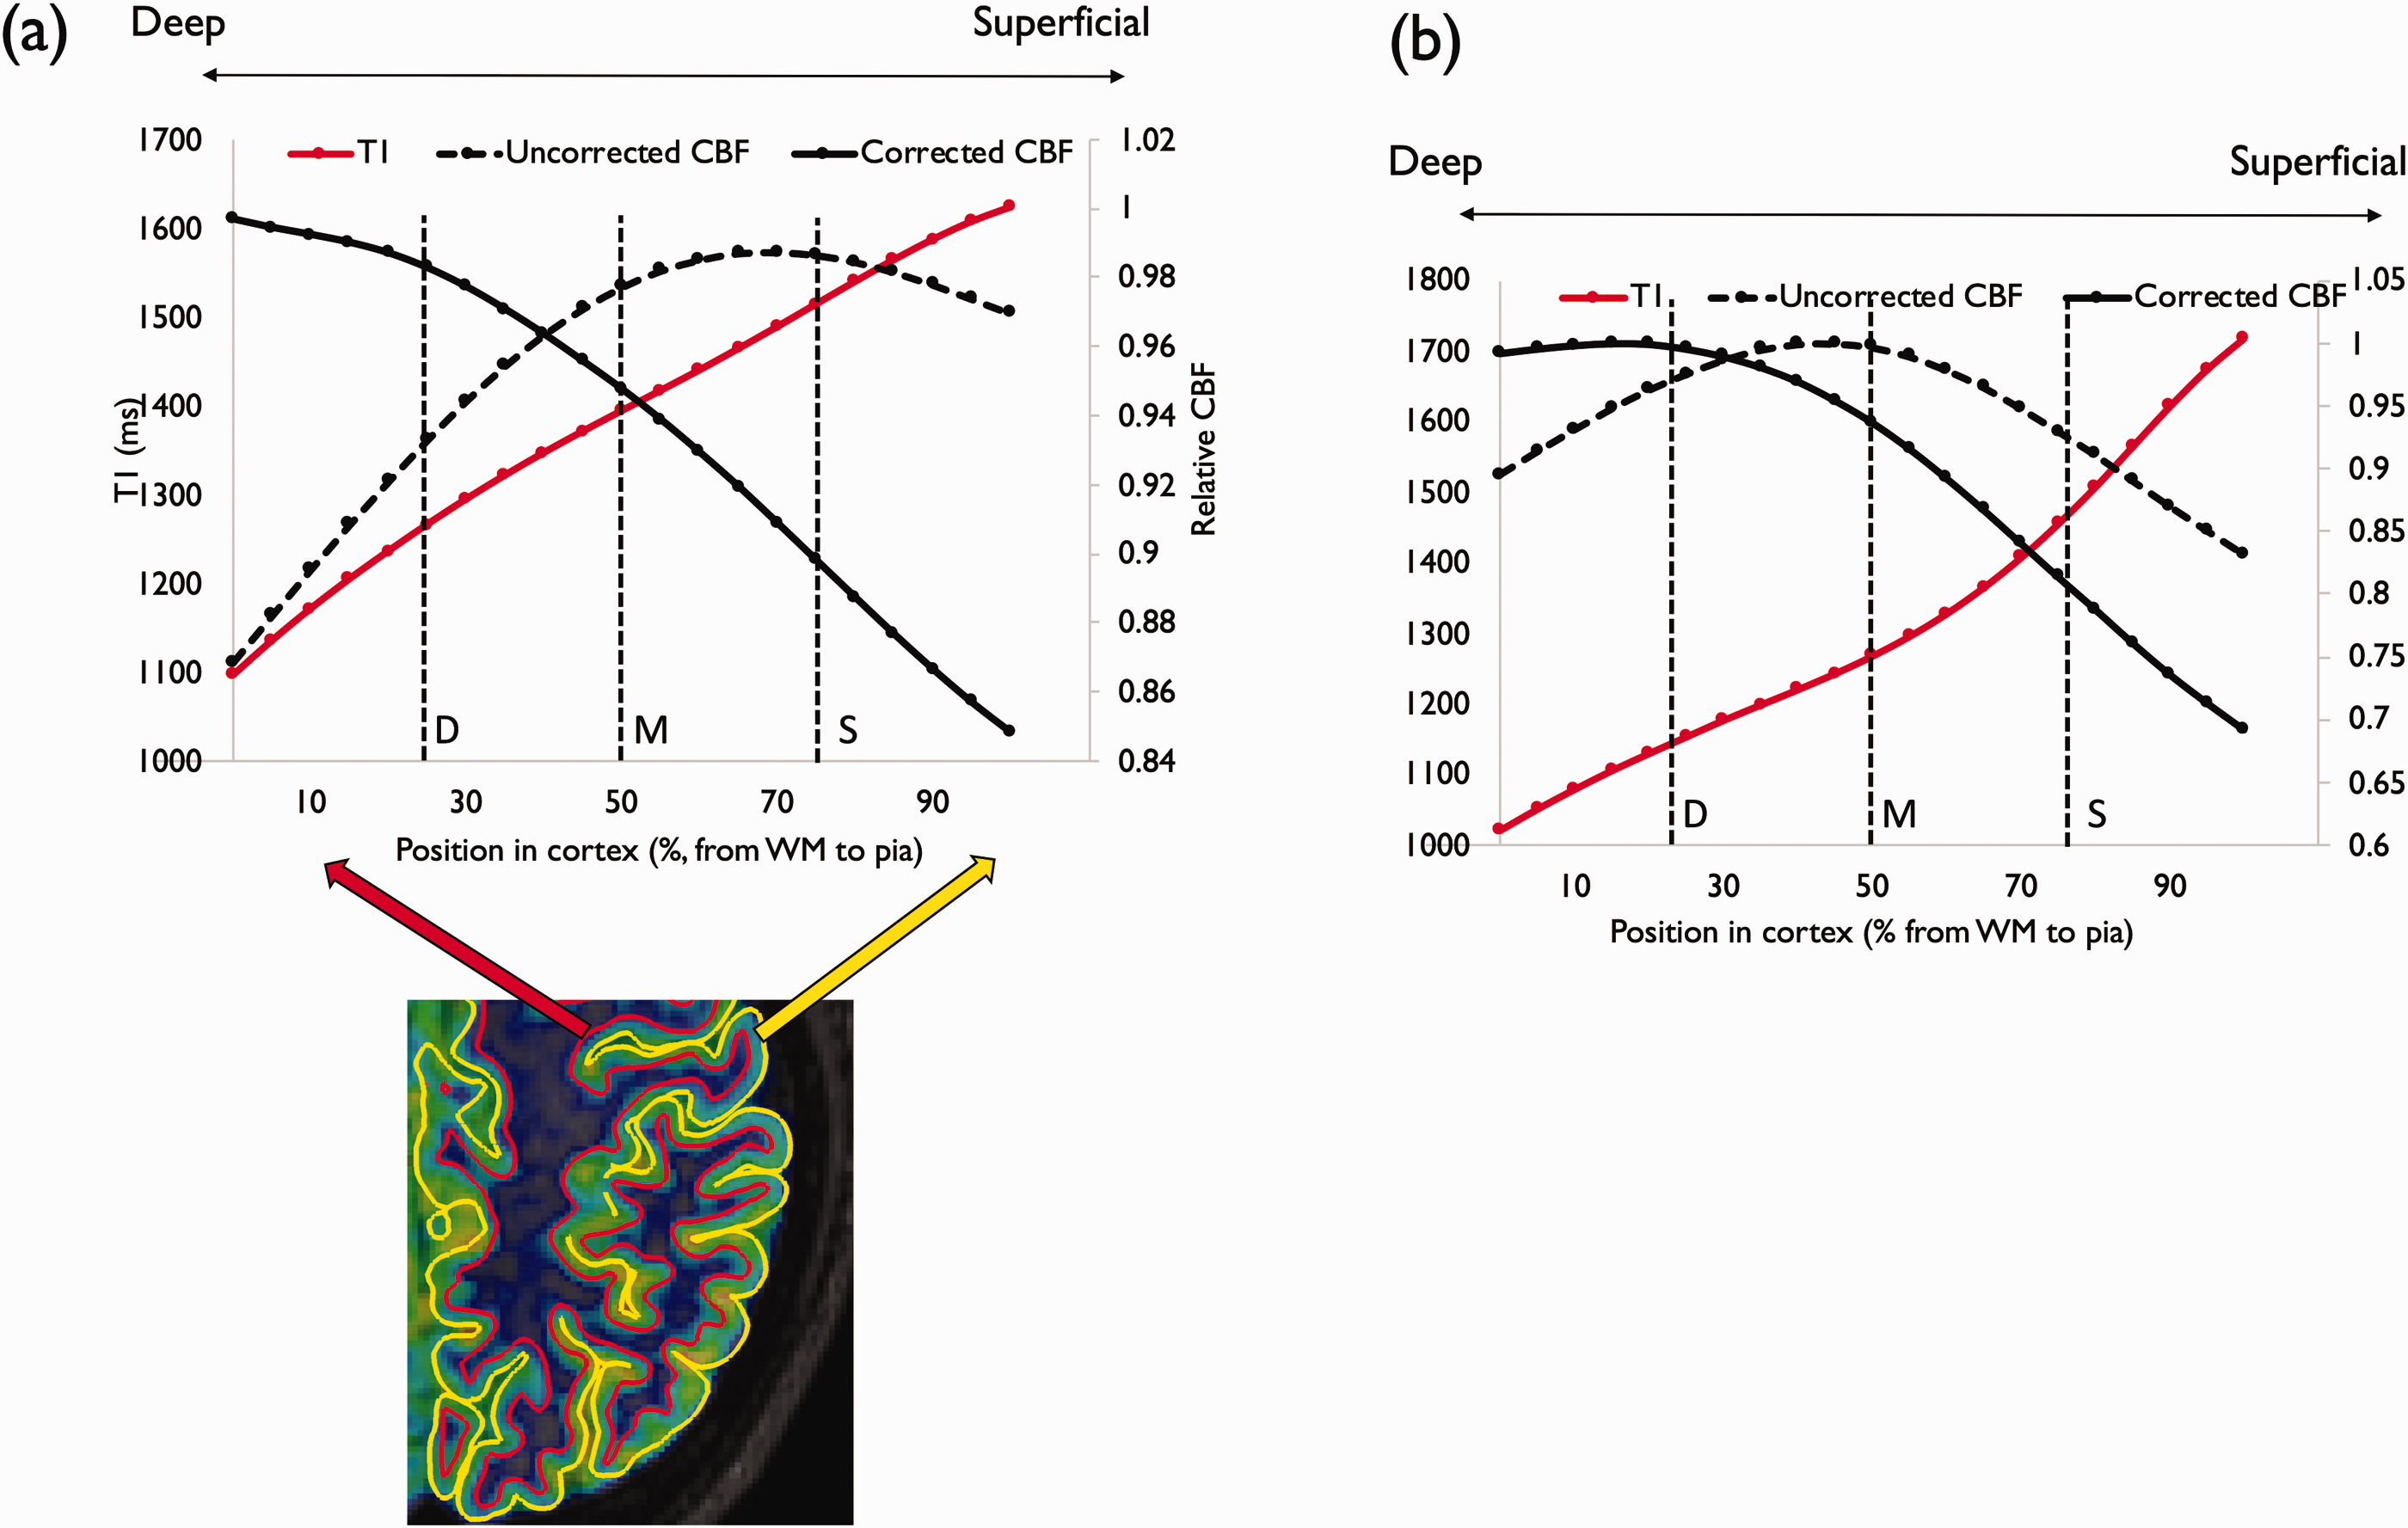
depth-dependence of cortical blood-flow before and after T1/ATT correction as well as T1, averaged across cortical ROIs (a) and in the precentral gyrus (b). The S/M/D marks represent grouping into superficial, middle and deep cortical layers.
In both cases, the depth profile of the CBF could be fit with a 2nd degree polynomial with high coefficients of determination (R2>0.99), suggesting a two-phase variation of the CBF in the cortex.
As an example, we also provided the same data in one specific ROI located in the primary motor area (in the precentral gyrus, G_precentral) which is one of the thickest cortical areas (average thickness of 2.9 ± 0.2mm), hence less subject to partial volume effects.
Discussion
This study sought to push the limits of volumetric ASL resolution to be able to study the distribution of spatially resolved resting cortical perfusion and give first insights into the in vivo depth dependence of cortical blood-flow with whole brain coverage. We used for that purpose an FSE-based sequence that allows collecting high-resolution (1.6mm isotropic, i.e. nominal voxel size of 4.1mm3) whole brain perfusion-weighted volumes without spatial distortion, as well as robust CBF quantification thanks to measurement of whole brain T1 and transit-time. This work complements earlier work looking at specific brain regions at ultra-high-field.22,23 It is worth noting that a previous study provided 0.7mm isotropic ASL perfusion-weighted images at 7T, but on a single-subject using multiple separate scanning sessions. 24
This study provided a mapping of the regional distribution of cortical blood-flow confirming earlier reports at lower-resolution showing high resting CBF in primary cortices (primary motor and auditory cortices) but also associative regions such as the posterior cingulate and superior frontal region.25–27 Interestingly, we also observed some different results most notably the absence of higher blood-flow in the primary visual area as in previous work by. 25 This may be explained by the instructions to keep the eyes closed for the duration of the scan in the current work. Hemispheric comparison also showed some interesting features, especially in the primary motor cortex with higher flow observed on the left side. Whether this reflects a metabolic asymmetry that could be associated with functional lateralization remains to be further investigated. 28
The cortically resolved acquisition helped to demonstrate the effects of partial volume 4 on low resolution CBF images. When the acquired resolution is lower than the cortical thickness, the signal intensity represents the integrated signal from the cortex instead of the cortically resolved flow. As seen in Figure 2, the spatial distribution of integrated CBF is substantially different than that of the cortically resolved CBF, with regions such as the insula and the primary motor cortex most prominent. Acquisition of high-resolution images such as ours allows the study of both these quantities, which may provide insights into the intensity and concentration of neuronal activity.
We have shown the impact of ATT and T1 correction on CBF quantification, with mostly higher absolute CBF when compensating for tissue T1 and transit-time, leading to higher average CBF (around 70 mL/100g/min) compared to literature studies usually reporting CBF ≈ 50 – 60 mL/100g/min as in the uncorrected case in the present work. In regions presenting shorter T1 such as the primary motor cortex (precentral gyrus) due to heavy myelination, we observed even more significant effect of T1-correction, showing that using a simple model assuming T1,t = T1,b leads to lower calculated CBF. Additionally, the substantial T1 variations across different cortical regions also suggests that assuming a single gray matter T1 can lead to substantial errors of calculated CBF potentially biasing analyses studying regional CBF distribution. While separate T1 mapping is usually time-consuming, sequence developments such as MP2RAGE 9 allowed overcoming this by providing simultaneously a T1-weighted volume that can be used for brain segmentation and cortical parcellation but also high-resolution T1 mapping.
While the spatial resolution was still in the range of the cortical thickness in some regions (≈2mm) leading to potentially significant partial volume-effects (PVE), the use of surface-based projection at a group-level allowed studying for the first time in the whole brain the depth-dependence of the resting cerebral perfusion. A previous study indeed used high-resolution 7T with inner-volume reduced field-of-view excitation to study the depth-dependence of the blood-flow in the left motor cortex only, 23 highlighting a profile that resembles our uncorrected CBF results, with lower flow going into deep layers (closer to the white matter). Interestingly, this could be potentially linked to the variations in microvascular density through the cortex. 29 However, when correcting for T1 and arterial transit time, the depth profile inverted itself suggesting higher flow in deeper cortical layers. But this quantification assumes immediate, uniform and total exchange of labeled blood throughout the cortex which may be inaccurate and relies on low-resolution transit-time mapping, precluding resolving the depth-dependence of transit-time. Replacing a single transit-time with a two transit times 20 or a continuous distribution in the kinetic model 30 may be necessary to determine the true depth dependence of CBF. Because of the large variations in T1 from pial to white matter surfaces (estimated in this work on average at 48%) and across cortical regions that can also be potentially biased by residual partial volume effects, further study of water exchange times and their modulation of T1 effects on quantification are needed to accurately quantify layer dependent and even global CBF.
Some limitations of this study should be considered. First and foremost, as a functional imaging technique, ASL is highly dependent on the subject condition and might be subject to confounders due to the difficult definition of a resting-state during a 20-minutes scan in an environment presenting different sources of potential brain stimulation. We tried to limit as much as possible avoidable stimuli by restricting auditory (not providing music) or visual (asking the subjects to close their eyes) stimulations but could not ensure total compliance with instructions. The high CBF in the primary auditory cortex may reflect the inherent sound produced by the gradient coils of the MRI scanner that could induce some activation. Additionally, regarding the blood-flow quantification, two potential sources of biases should be considered in addition to the one mentioned previously. First, the absence of labeling efficiency measurement could be impairing the accuracy of the CBF quantification as it can vary between the left and right carotid and vertebral arteries that were labeled. A fast pre-scan measurement of labeling efficiency could be a solution that could be envisioned to tackle this issue. 31 Additionally, while limiting signal contamination from intravascular spins, our vessel-suppression used a relatively high cutoff velocity ≈ 3 cm/s to improve its robustness towards off-resonance and eddy-currents, hence potentially causing remaining signal from unexchanged labeled blood. Also, while being optimized to minimize bias related to B1 inhomogeneous transmission, the T1 maps derived from the MP2RAGE sequence are not totally immune to transmit field inhomogeneities; acquiring fast low-resolution B1 maps would enable a fast B1 correction of the T1 maps. The image reconstruction should also be considered when addressing limitations. Indeed, Compressed-Sensing reconstructions rely on user-specified regularization terms that are SNR and potentially sequence dependent and also suffer from long reconstruction times.
To conclude, cortically resolved ASL imaging demonstrates region and layer specific heterogeneity of blood flow, complementing similar heterogeneity in structural imaging measures. Higher resting mid-thickness CBF was found in primary motor and auditory cortices and associative frontal regions, while occipital and temporal regions showed lower resting mid-thickness CBF. Furthermore, this study provided some early insights into the depth-dependence of cortical blood-flow, although further investigations are warranted to more fully assess the links between the depth dependence of ASL signal and tissue T1.
Supplemental Material
sj-pdf-1-jcb-10.1177_0271678X20982382 - Supplemental material for Regional and depth-dependence of cortical blood-flow assessed with high-resolution Arterial Spin Labeling (ASL)
Supplemental material, sj-pdf-1-jcb-10.1177_0271678X20982382 for Regional and depth-dependence of cortical blood-flow assessed with high-resolution Arterial Spin Labeling (ASL) by Manuel Taso Fanny Munsch, Li Zhao and David C Alsop in Journal of Cerebral Blood Flow & Metabolism
Footnotes
Authors' note
Li Zhao is now affiliated to Key Laboratory for Biomedical Engineering of Ministry of Education, College of Biomedical Engineering & Instrument Science, Zhejiang University, Hangzhou, Zhejiang, China.
Acknowledgements
The authors gratefully acknowledge Fotini Papadopoulou RT(MR), Colleen McGrath BA and Stephanie Waldman BS for their support in conducting this study. We would also like to thank Arnaud Guidon PhD, Marc Lebel PhD and Daniel Litwiller PhD from GE Healthcare for fruitful discussions.
Authors’ contributions
MT and DCA conceived and designed the study. MT performed all MRI experiments and was assisted by LZ for image reconstruction. MT and DCA performed data analysis, assisted by FM. MT and DCA wrote revised the original manuscript and all authors commented on the article and approved its final version.
Funding
The author(s) received no financial support for the research, authorship, and/or publication of this article.
Declaration of conflicting interests
The author(s) declared the following potential conflicts of interest with respect to the research, authorship, and/or publication of this article: David C. Alsop is an inventor on patents related to the pseudo-continuous ASL method used in the current work. Consequently, he receives post-market royalties through his institution from GE Healthcare, Siemens Healthineers, Philips Healthcare, Hitachi Medical and Animage LLC. He additionally receives research support from GE Healthcare.
Supplementary material
Supplemental material for this article is available online.
References
Supplementary Material
Please find the following supplemental material available below.
For Open Access articles published under a Creative Commons License, all supplemental material carries the same license as the article it is associated with.
For non-Open Access articles published, all supplemental material carries a non-exclusive license, and permission requests for re-use of supplemental material or any part of supplemental material shall be sent directly to the copyright owner as specified in the copyright notice associated with the article.