
Abstract
Apoptosis-related cell death is linked to oxidative stress and caspases in experimental cerebral ischemia, However, the role of oxidative stress in caspase activation and subsequent apoptotic cell death after cerebral ischemia is unknown, The authors evaluated the role of oxidative stress in ischemic cerebral infarction after photothrombosis and the relation between oxidative stress and caspase-related cell death 6 and 24 hours after ischemia with and without U-74389G, a potent free radical scavenger (10 mg/kg, 30 minutes before and after ischemia induction). Reactive oxygen species, detected by hydroethidine oxidation, and cytosolic cytochrome c were detected in early ischemic lesions. Western blot analysis showed the cleaved form and the level of the proform of caspase-3 in the ischemic lesion 24 hours after ischemia. Decreased caspase-3 immunoreactivity was detected in the antioxidant-treated group after ischemia. Decreased DNA fragmentation and laddering were detected and the lesion was smaller in the treated group after ischemia compared with the untreated group. Oxidative stress and cytochrome c release occur in the ischemic lesion after photothrombotic ischemia. The free radical scavenger attenuated caspase-3 up-regulation, DNA fragmentation, and the final lesion. The authors concluded that oxidative stress may mediate caspase-related apoptotic cell death and subsequent cortical infarction after photothrombotic ischemia.
Oxidative stress has been implicated in the pathogenesis of ischemic neuronal injury (Chan, 1994). Ischemic neuronal cell death was once considered to be necrotic in nature, but recent studies suggest that apoptotic cell death could be involved in the pathogenesis. Apoptosis is a complex process involving activation of cysteine proteases of the caspase family, alterations in plasma membrane phospholipids, and nuclear DNA condensation and fragmentation (Bredesen, 1995; Thompson, 1995). During excitotoxicity, free radicals open the mitochondrial membrane permeability transition pore and mediate release of apoptotic factors and cytochrome c from mitochondria that activate caspases, finally producing apoptosis (Kluck et al., 1997; Chen et al., 1998; Enari et al., 1998; Yang and Cortopassi, 1998). It has been reported that apoptosis and necrosis in cultured tumor cells can be induced by oxygen radicals through the activation of a caspase-3–like protease (Higuchi et al., 1998), and that production of free radicals in Jurkat T-lymphocytes treated with hydrogen peroxide mediates the triggering of delayed apoptosis by caspase (Hampton and Orrenius, 1997). Caspase-3 (p32) is activated by cleavage into p20 and p12 fragments and cleaves several intracellular substrates (Nicholson and Thornberry, 1997). Activated caspase-3 causes DNA fragmentation through activation of a downstream factor (Liu et al., 1997).
A photochemical reaction was used to induce thrombosis leading to infarction in photothrombotic ischemia. Reaction between the photosensitive dye, Rose Bengal, administered intravenously, and light by illumination of the external skull, produced highly reactive singlet oxygen molecules that react with endothelial cells to cause platelet aggregation and blood—brain barrier breakdown. This model is very reproducible and does not impair long-term survival. Furthermore, this model has the advantage of the ability to simulate clinical stroke in a reproducible and physiologically relevant manner (Dietrich et al., 1987; Watson et al., 1985).
Oxidative stress and caspases have been implicated as potential mediators of cell death. However, their direct relation to focal ischemic stroke is not known. Therefore, the authors evaluated oxidative stress and cytochrome c release after photothrombotic ischemia changes in the caspase-3 protein as a factor in induction of apoptosis after ischemia. To clarify the role of oxidative stress in caspase-related cell death after ischemia, caspase-3 immunoreactivity, DNA fragmentation, DNA laddering, and lesion volume were evaluated in an untreated group of mice and a group treated with U-74389G, a lazaroid that is a potent, free radical scavenger (Huang et al., 1998; Massaeli et al., 1999).
MATERIALS AND METHODS
Male CD-1 mice (3 months old, weighing 35 to 40 g; Charles River, Wilmington, MA, U.S.A.) were used in each experiment. All procedures were in accordance with the National Institutes of Health Guide for the Care and Use of Laboratory Animals and were approved by Stanford University's Administrative Panel on Laboratory Animal Care.
Surgical procedure
Anesthesia was induced and maintained with xylazine (4 mg/kg) and chloral hydrate (350 mg/kg). Rectal temperature was kept constant at 36.5°C ± 0.5°C with a homeothermic blanket. The jugular vein was exposed under a surgical microscopic field and a custom-modified catheter (PE20 170 mm, PE10 65 mm, silastic 0.025 in OD, 37 mm; IITC, Woodland Hills, CA, U.S.A.) was placed into the jugular vein. Each animal was placed in a stereotaxic frame (Stoelting, Wood Dale, IL, U.S.A.). With the use of aseptic techniques, a midline scalp incision and pericranial tissue dissection were performed to expose the skull surface. A fiber-optic light guide (1.4 mm in diameter) from a low intensity, 150 W halogen lamp (model 180 illuminator; Dolan-Jenner Industries, Lawrence, MA, U.S.A.) that had a green lighting source with a 560-nm interference filter with a 10-nm bandwidth (Coherent, Auburn, CA, U.S.A.) was positioned on the skull at 1.5 mm posterior and 2 mm paramedian from the bregma. Irradiation intensity was fixed at 0.33 mW/cm2/nm. Rose Bengal dye (30 mg/kg; Aldrich Chemical, Milwaukee, WI, U.S.A.) was injected into the jugular vein while the skull was illuminated. Illumination was continuous for 5 minutes. Temperature was monitored in the temporal muscle. Then the scalp was sutured and the animals were returned to their cages to recover and kept on a feed-back controlled heating pad until they awoke. Sham operations (n = 2) were performed as above with Rose Bengal dye injected into the mice, with no illumination.
To evaluate the role of free radicals in photothrombotic ischemia, the authors used the free radical scavenger, U-74389G (10 mg/kg concentration; 3 mg/mL of the carrier: 20 mmol/L sodium citrate, 0.45 mol/L NaCl, pH 3.0; BIOMOL Research Laboratories, Plymouth Meeting, PA, U.S.A.), in the treated group or the carrier alone (100 μL) in the untreated group injected intraperitoneally 30 minutes before the surgical procedure and 30 minutes after ischemia induction (n = 15 in each group). The U-74389G dose was selected based on the authors' preliminary study showing that the lazaroid attenuated loss of the DNA repair enzyme, apurinic/apyrimidinic endonuclease Ref-1, after photothrombosis in mice (Chang et al., 1999). The change in CBF was evaluated in both groups with a laser—Doppler flowmeter (n = 4) (Laserflo BPM2; Vasamedics, St. Paul, MN, U.S.A.). The laser—Doppler probe was placed on the cranial window (made with a dental drill) above the same location as the lighting. Cerebral blood flow was monitored continuously until 90 seconds after ischemia induction. Disruption of the BBB was evaluated by Evans blue injection (4%, 100 μL; n = 8) to obtain basic information after ischemia.
In situ detection of free radical production
Production of reactive oxygen species (ROS) in the ischemic lesion after ischemia induction was investigated by in situ detection of oxidized hydroethidine (HEt) (Murakami et al., 1998; Kim et al., 2000). This method was reported to detect superoxide anion radicals (O.−2 (Bindokas et al., 1996; Benov et al., 1998). The mice treated with U-74389G or the carrier alone as an untreated control, as described above, were anesthetized 4 hours after ischemia induction, and 200 μL HEt (stock solution of HEt: 100 mg/mL in dimethyl sulfoxide was finally diluted to 1 mg/mL with phosphate-buffered saline [PBS]) were intravenously administered through the jugular vein under the surgical microscope (n = 5 in each group). Two hours after the HEt injection, the animals were killed under anesthesia by transcardial perfusion with 200 mL of 10 U/mL heparin in saline and 200 mL of 3.7% formaldehyde in PBS. After postfixation overnight in 3.7% formaldehyde, brain sections 50-μm thick were cut at the level of the mid-striatum using a vibratome and placed on glass slides. They were then incubated with 2.5 × 10⁻³ mg/mL Hoechst 33258 (Molecular Probes, Eugene, OR, U.S.A.) in PBS for 15 minutes in a dark chamber, rinsed in distilled H2O, and mounted with aquamount (Shandon, Pittsburgh, PA, U.S.A.). The sections were observed with a microscope under fluorescent light (HBO/100; Zeiss, Thornwood, NY, U.S.A.) and photographed using a digital camera system (AxioVision; Zeiss) and double exposure to produce images of oxidized HEt and Hoechst 33258. Intensity and expression patterns of the oxidized HEt in the lesioned cortex and contralateral side were observed using an image analysis program (AxioVision; Zeiss) and compared between the groups. To quantify ROS production, cells with oxidized HEt extending to the cytosol were counted and averaged in the entire field after randomly being taken from four different sites under high magnification (X400) using an image analysis program (AxioVision; Zeiss). The percentage of these cells to the total cells stained with Hoechst nuclear staining was then calculated.
Cytochrome c immunohistochemistry
To evaluate cytochrome c redistribution from mitochondria after ischemia induction, cytochrome c immunohistochemistry was performed according to method of Fujimura et al. (1998) (n = 4). Four hours after ischemia induction, the animals were killed under anesthesia by transcardial perfusion with 200 mL of 10 U/mL heparin in saline and 200 mL of 3.7% formaldehyde in PBS. After sectioning, brain sections were kept in 0.1 mol/L PBS. Brain sections were incubated in 0.3% Triton X-100 in PBS for 30 minutes. After rinsing the sections in PBS, they were blocked by 20% normal goat serum in PBS for 1 hour. After another rinsing in PBS, sections were incubated with a primary antibody, rabbit anti-cytochrome c (Santa Cruz Biotechnology, Santa Cruz, CA, U.S.A.), in PBS with 1% goat serum at 4°C overnight. Sections then were rinsed three times in PBS and incubated with biotinylated anti-rabbit immunoglobulin G (IgG) (Vector Laboratories, Burlingame, CA, U.S.A.) in PBS with 1% goat serum for 1 hour. Thereafter, sections were incubated for 30 minutes with a complex of avidin and biotinylated horseradish peroxidase (VECTASTAIN Elite ABC Kit; Vector). Samples then were washed with PBS, and cytochrome c labeling was visualized using diaminobenzidine (0.25 g/L). Sections were dehydrated in an ascending ethanol series, immersed in xylene, and coverslipped with Permount (Fisher Scientific, Pittsburgh, PA, U.S.A.).
Western blot analysis of caspase-3
Whole cell protein extraction was performed using a previously described method (Fujimura et al., 1999b). Approximately 30 mg of tissue from the infarction and contralateral cortex were cut into pieces 24 hours after ischemia induction and put into 10X volume of Tris-glycine-sodium dodecyl sulfate sample buffer (Novex, San Diego, CA, U.S.A.). Samples then were gently homogenized by douncing 20X in a Teflon homogenizer (Wheaton, Millville, NJ, U.S.A.). Equal amounts of the samples (10 μL) were loaded per lane. The primary antibodies were either a 1:1000 dilution of polyclonal goat antibody against caspase-3, which can recognize the cleaved form of caspase-3, caspase-3p20, and the proform; a caspase-3p32 (Santa Cruz Biotechnology), or a 1:10,000 dilution of anti–β-actin monoclonal antibody (Sigma, St. Louis, MO, U.S.A.). For caspase-3 detection, Western blot analysis was performed with horseradish peroxidase—conjugated anti-goat IgG using the Boehringer-Mannheim (Indianapolis, IN, U.S.A.) chemiluminescence system. As the internal control, Western blot analysis of β-actin was performed with horseradish peroxidase—conjugated anti-mouse IgG reagents (Amersham International, Buckinghamshire, England).
Histologic evaluation and in situ detection of DNA-fragmented cells
After death through chloral hydrate and xylazine 1 and 3 days after ischemia, the brains were removed from the mice and sectioned 20-μm thick on a cryostat. At 300-μm intervals, the sections were stained with cresyl violet to measure the lesion volume. Unstained areas were scanned and measured in each section with an image analysis system (Bio-Rad Laboratories, Hercules, CA, U.S.A.). Lesion volume was calculated by multiplying each measured area by the distance between sections. Sections from the level of the anterior hippocampus were identified for histologic evaluation using terminal deoxynucleotidyl transferase-mediated uridine 5′-triphosphate-biotin nick end labeling (TUNEL) staining to detect DNA fragmentation in situ. The procedure was followed by a previously described method (Kondo et al., 1997). Sections were air-dried and fixed for 30 minutes in 3.7% formaldehyde in 0.1 mol/L PBS. Slides were incubated in 0.3% Triton X-100 in PBS for 30 minutes. After rinsing the sections in PBS, they were equilibrated for 15 minutes in terminal deoxynucleotidyl transferase (TdT) buffer containing 2.5 mmol/L cobalt chloride and 200 mmol/L potassium cacodylate (pH 7.2) The labeling reaction was performed at 37°C for 1 hour with TdT (300 U/mL; GibcoBRL, Gaithersburg, MD, U.S.A.) and 40 μmol/L biotinylated 14-dATP (GibcoBRL) in TdT buffer. Sections were washed twice for 15 minutes in a PBS solution containing 150 mmol/L sodium chloride, 15 mmol/L sodium citrate, and 2% bovine serum albumin (pH 7.4). Thereafter, sections were incubated for 30 minutes using the VECTASTAIN Elite ABC Kit. Samples then were washed with 0.175 mol/L sodium acetate, and TUNEL labeling was visualized using diaminobenzidine (0.25 g/L) and nickel chloride (10 g/L). Sections were dehydrated in an ascending ethanol series, immersed in xylene, and coverslipped with Permount.
Caspase-3 immunohistochemistry
After death with chloral hydrate and xylazine 6 and 24 hours after ischemia, the brains were removed and sectioned 20-μm thick on a cryostat. Sections from an identical area with TUNEL staining were used for evaluation of caspase-3 immunoreactivity between the groups. Sections were air dried and fixed for 10 minutes in cold acetone. Slides were incubated in 0.3% Triton X in PBS for 30 minutes. After rinsing the sections in PBS, the slides were blocked by 20% normal horse serum in PBS for 1 hour. After another rinsing in PBS, the sections were incubated with a primary antibody, anti-caspase-3 (the same antibody used for caspase-3 Western blot analysis, 1:100), in PBS with 1 % horse serum at 4°C overnight. After they were rinsed three times in PBS, the sections were incubated with biotinylated anti-goat IgG (Boehringer Mannheim) in PBS with 1% horse serum for 1 hour. Thereafter, sections were incubated for 30 minutes using the VECT ASTAIN Elite ABC Kit. Samples then were washed with 0.175 mol/L sodium acetate, and caspase-3 labeling was visualized using diaminobenzidine (0.25 g/L) and nickel chloride (10 g/L). Sections were dehydrated in an ascending ethanol series, immersed in xylene, and coverslipped with Permount.
DNA extraction and gel electrophoresis
To confirm the role of oxidative stress in the DNA fragmentation process, the authors used the antioxidant, U-74389G, to evaluate fragmentation patterns of DNA isolated from the ischemic lesion and from the contralateral side in the treated and untreated groups. The procedure followed a previously reported method (Kim et al., 2000). Immediately after decapitation, lesional tissue was removed from four animals and from the contralateral side. The tissue was homogenized in proteinase K (500 μg/mL), 10 mmol/L Tris HC1 (pH 8.0), 0.1 mol/L EDTA (pH 8.0), and 0.5% sodium dodecyl sulfate, and incubated overnight at 55°C. DNA was extracted with phenol:chloroform:isoamyl alcohol (25:24:1), precipitated overnight in 95% ethanol and 68 mmol/L NaC1 at −20°C, and resuspended in 10 mmol/L Tris HC1 and 1 mmol/L EDTA (pH 8.0), The DNA was incubated for 30 minutes at 37°C in 0.1 μg/μL DNase-free RNase (Boehringer Mannheim). The DNA concentration was measured with TO-PRO-1 iodide stain (Molecular Probes, Eugene, OR, U.S.A.) and 5 μg/lane was loaded onto a 1.8% agarose gel containing ethidium bromide (0.3 g/mL), and electrophoresed at 100 V for 2 hours. DNA was visualized and photographed using ultraviolet transillumination (300 nm wavelength).
Quantification and statistical analysis
TUNEL-positive cells per mm2, which displayed densely labeled, particles in the cytoplasm (apoptotic bodies), and different types of chromatin condensation around the margin of the nucleus forming either crescentic caps or rings, were quantified with a light microscope. They were counted in each of two areas of the inner and outer boundaries of the lesion under high magnification (X400) and were averaged. Caspase-3–positive cells were counted and quantified by the same method with TUNEL staining. The statistical of difference was evaluated by analysis of variance in percentage of oxidized HEt-positive cells, lesion volume, TUNEL-positive, and caspase-3–positive cells per mm2 at each time point and between the untreated and treated groups.
RESULTS
Reduction of CBF and BBB damage in focal cerebral ischemia
After ischemia induction, the mice displayed normal activity and there was no mortality in either group. The temperature in the temporal muscle was not increased during lighting with the green filter. Any change in regional CBF was measured indirectly by laser—Doppler flowmetry, which showed a gradual decrease to 50% thirty minutes after ischemia induction compared with preischemia and the contralateral side (Fig. 1A). There was no difference in local blood flow between the treated and untreated groups (data not shown). To evaluate BBB damage after ischemia, Evans blue was used. Extravasation of Evans blue (Fig. 1B, red area) was detected initially in the superficial cortex visualized by Hoechst 33258 nuclear staining (Fig. 1B, blue area). Evans blue staining without nuclear staining was located mainly in the superficial vessels and was slightly extravasated (box in Fig. 1B). After one day, the extravasation extended to the deep layer (Fig. 1C) and under high magnification some neurons were stained with Evans blue (box in Fig. 1C).
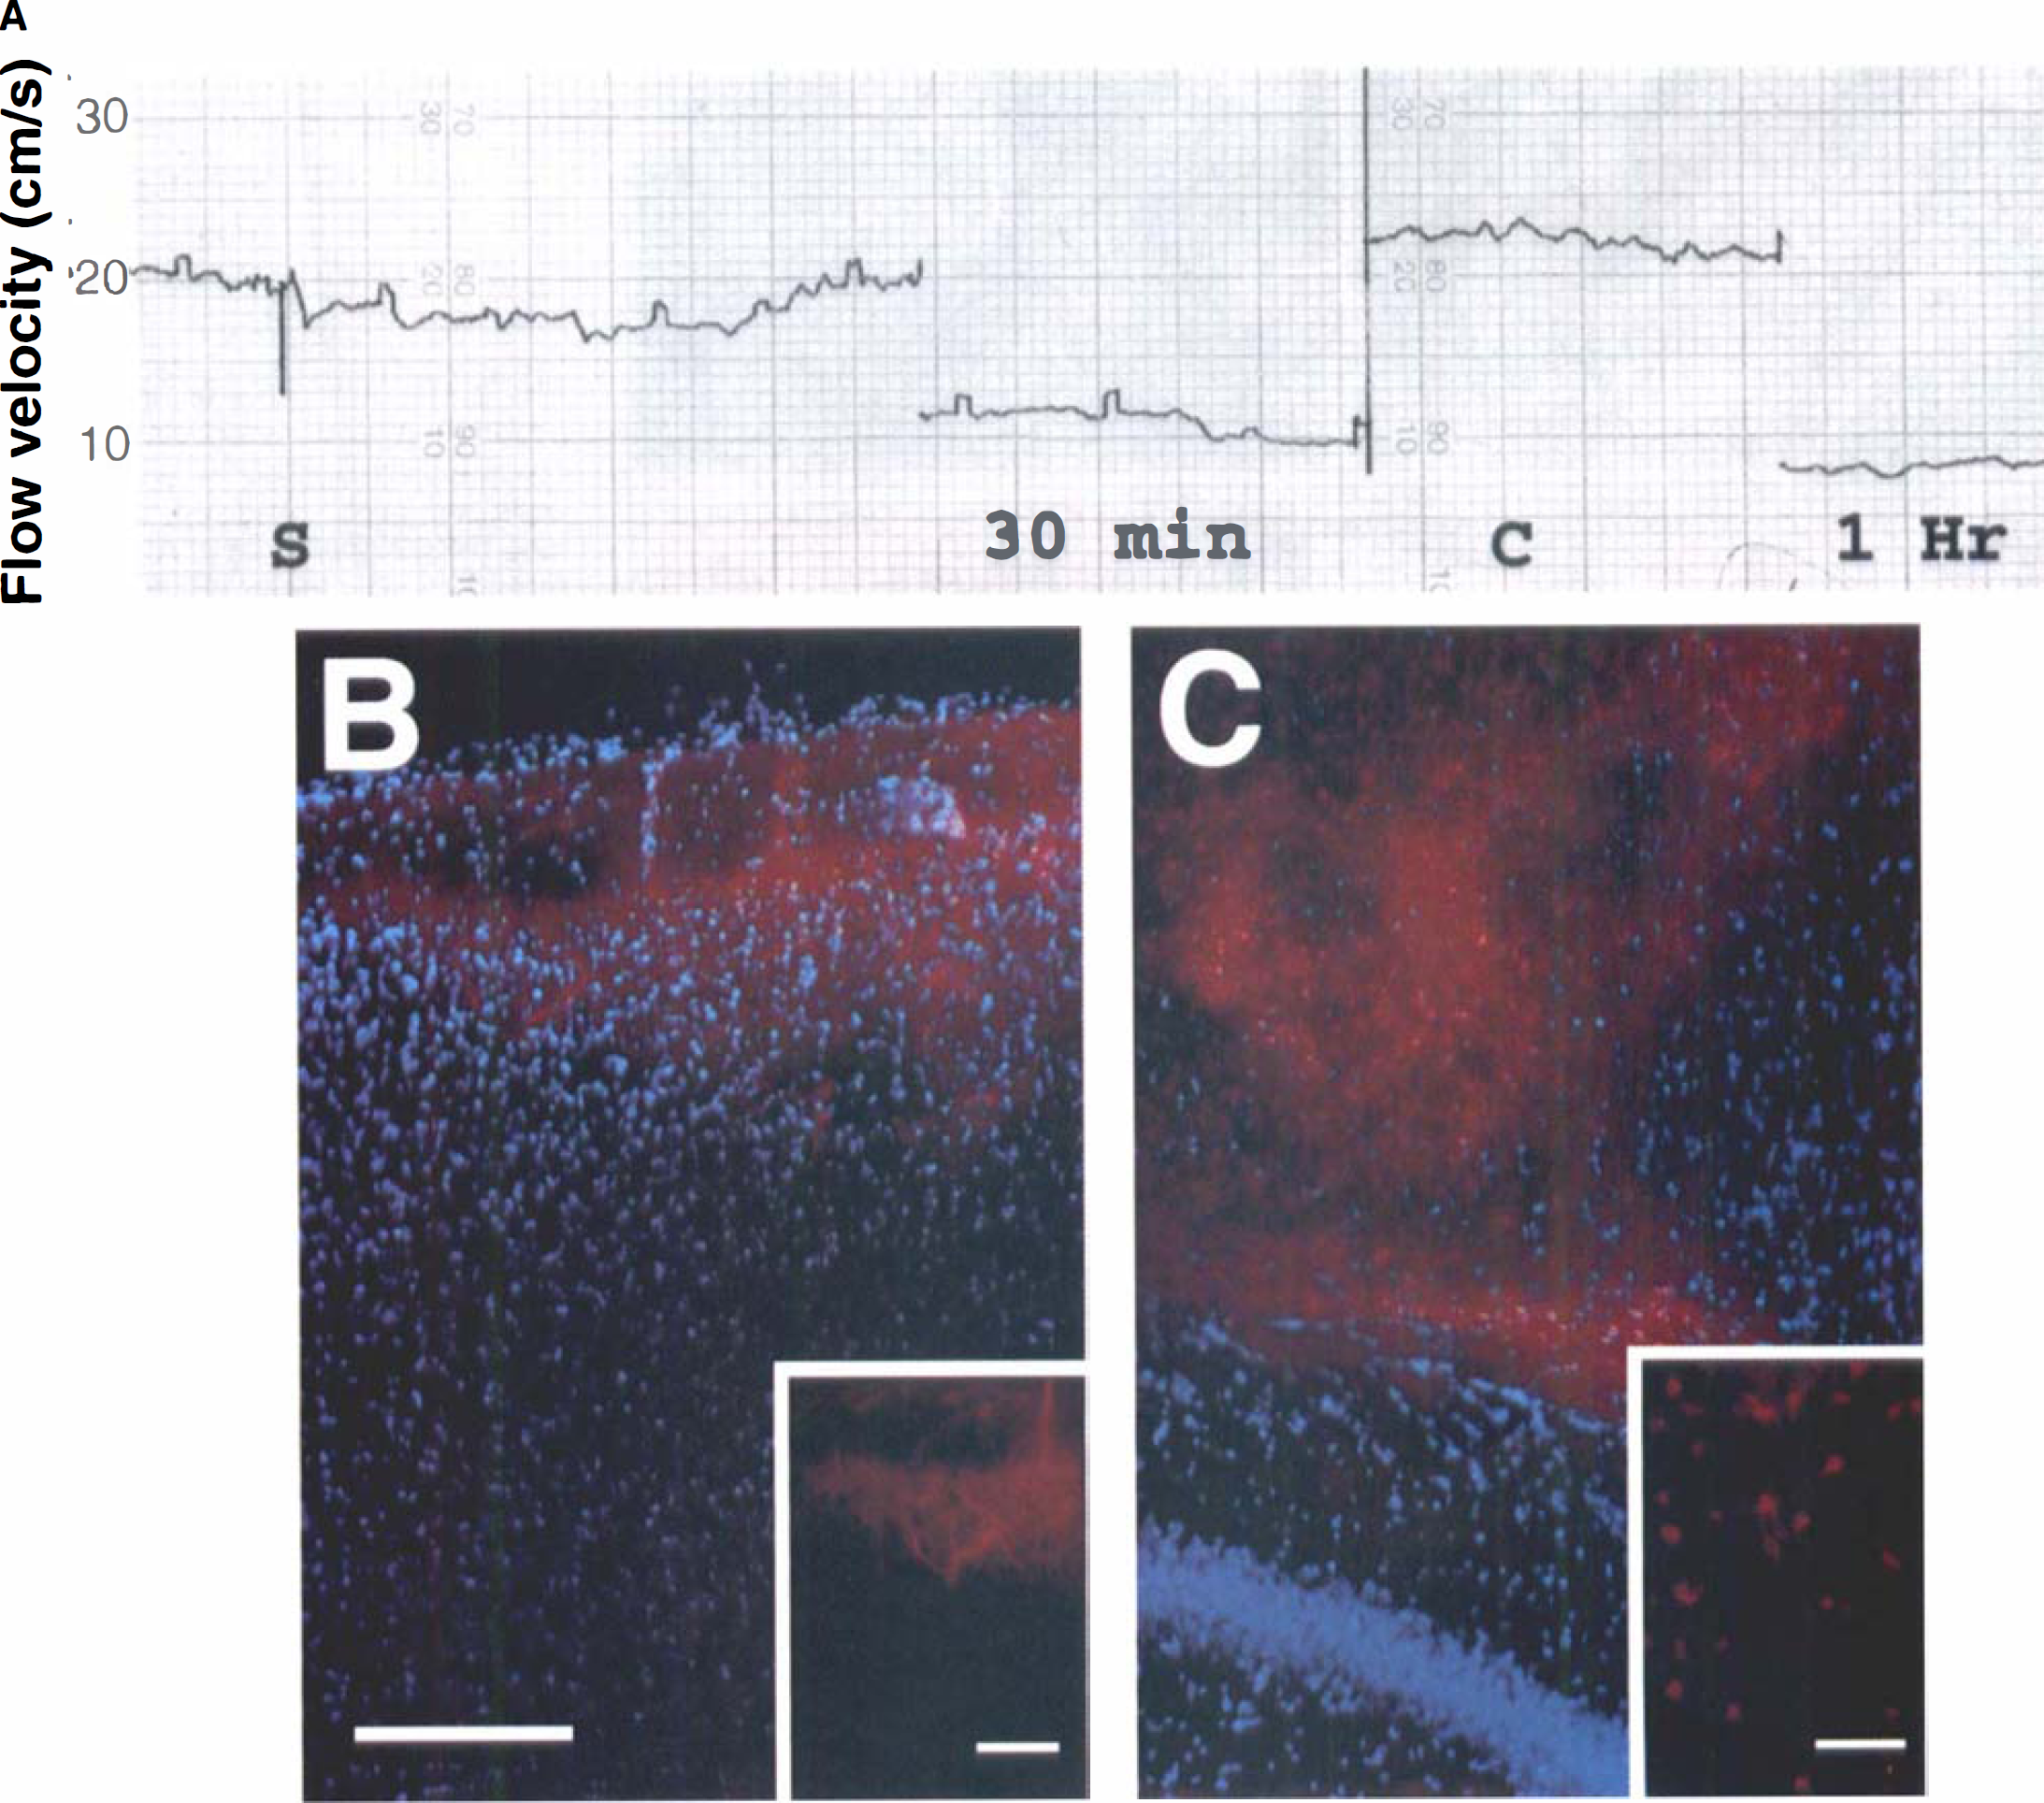
Change in regional cerebral blood flow (CBF) and blood—brain barrier damage after photothrombotic ischemia.
Increased production of oxidized HEt and cytosolic cytochrome c detection in the early ischemic lesion
To determine whether production of ROS (mainly superoxide radicals) occurs in photothrombotic ischemia, the authors evaluated ROS production by in situ detection with HEt 4 hours after ischemia. It was visible as small red particles in the cytosol and perinuclear area. Oxidized HEt signals were detected in the lesioned cortex and in the deeper layer (Fig. 2A, between arrows). Few or no oxidized HEt signals were detected on the contralateral side (Fig. 2B). Cytosolic cytochrome c immunoreactivity was detected in the lesioned cortex 4 hours after ischemia induction. In the same area, endothelial cytochrome c immunoreactivity was also detected (Fig. 2C). Under high magnification, cytosol- and axonlike processes showed diffuse immunoreactivity (Fig. 2C, box). On the contralateral side, there was no cytosolic cytochrome c immunoreactivity (Fig. 2D). Under higher magnification using double exposure of oxidized HEt (red) and Hoechst nuclear staining (blue), oxidized HEt signals into the cytosol were widely and intensively distributed in the ischemic lesion (Fig. 2E, upper left panel). In the treated mice, less oxidized HEt signals in the cytosol were detected compared with the untreated mice (Fig. 2E, upper right panel). The contralateral side showed fewer oxidized HEt signals that were primarily located in the perinuclear area (Fig. 2E, lower panel). Semiquantification showed that the lazaroid significantly attenuated oxidized HEt-positive cells compared with the untreated mice (untreated, 71.57 ± 6.08; treated, 26.70 ± 7.26; control, 3.77 ± 1.29; mean ± SD of percentage of oxidized HEt-positive cells, P < 0.0001).
Representative findings of O.−2 production and detection of cytochrome c immunoreactivity after ischemia induction. Oxidized hydroethidine (HEt) signals (red in
Detection of increased proform and cleaved form of caspase-3 by Western blot analysis in the ischemic lesion
To evaluate the changes in caspase-3, Western blotting was performed 24 hours after ischemia (Fig. 3). There was more of the 32-kDa band of the caspase-3 proform on the ipsilateral ischemic side (lane 1, upper panel) than on the contralateral side (lane 2, upper panel). The 20-kDa band of caspase-3, which was considered to be a cleaved caspase-3 (p20), was evident in the ischemic brain (Fig. 3, lane 1, upper panel), but was not detected on the nonischemic side (Fig. 3, lane 2, upper panel). There was no significant difference in the amount of β-actin between lanes I and 2 (lower panel), suggesting that the amount of protein loaded in each lane was equal. These data confirm the reactivity of the antibody to the mouse caspase-3 used in the current study and that the proform and cleaved form of caspase-3 increased after photothrombotic ischemia.
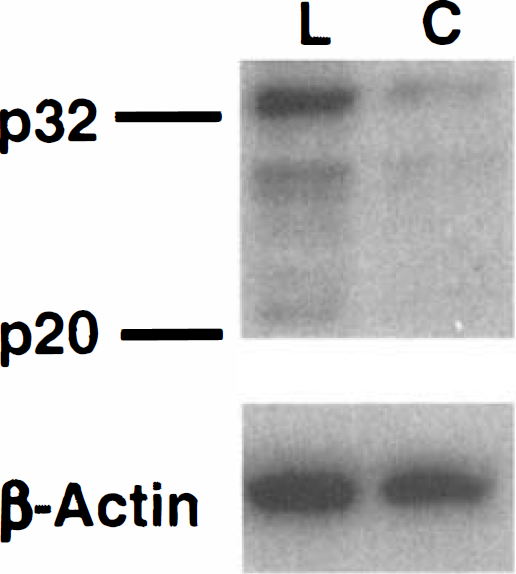
Western blot analysis of caspase-3 24 hours after ischemia. More of the caspase-3 proform (p32) was detected in the ischemic brain (lane 1; L, lesioned side) than in the contralateral nonischemic brain (lane 2; C, contralateral side). The cleaved form of caspase-3 (p20) was evident on the ischemic side (lane 1), but was not observed on the contralateral side (lane 2). There was no significant difference in the amount of β-actin between lanes 1 and 2 (lower panel), suggesting that the amount of protein loaded in each lane was equal.
DNA fragmentation after ischemia induction
To confirm the role of oxidative stress in apoptotic neuronal death, the authors evaluated gel electrophoresis of DNA isolated from the ischemic and contralateral cortices in the treated and untreated groups 24 hours after ischemia induction. DNA from the ischemic lesions of the untreated and treated groups showed signs of internucleosomal fragmentation, as evidenced by a ladder pattern caused by cleavage into segments that were multiples of approximately 200 base pairs in length; this is consistent with apoptosis. Internucleosomal fragmentation was also accompanied by some random fragmentation, as detected by an overlying continuous smear of DNA, which is consistent with necrosis (also see below, TUNEL staining in Fig. 4B and 4C). The amount of DNA laddering detected was less in the treated group (Fig. 4A, lane 3) than in the untreated group (Fig. 4A, lane 4). However, there was no evidence of random or internucleosomal fragmentation on the contralateral side (Fig. 4A, lane 2). With high magnification of TUNEL staining, there were densely labeled cells in the nuclei accompanied by chromatin condensation, and sometimes by small particles that resembled apoptotic bodies (Fig. 4B, arrow) and nuclear fragmentation (Fig. 4B, arrowhead). However, there were also diffuse and lightly stained TUNEL-labeled cells that were necrotic (Fig. 4C).
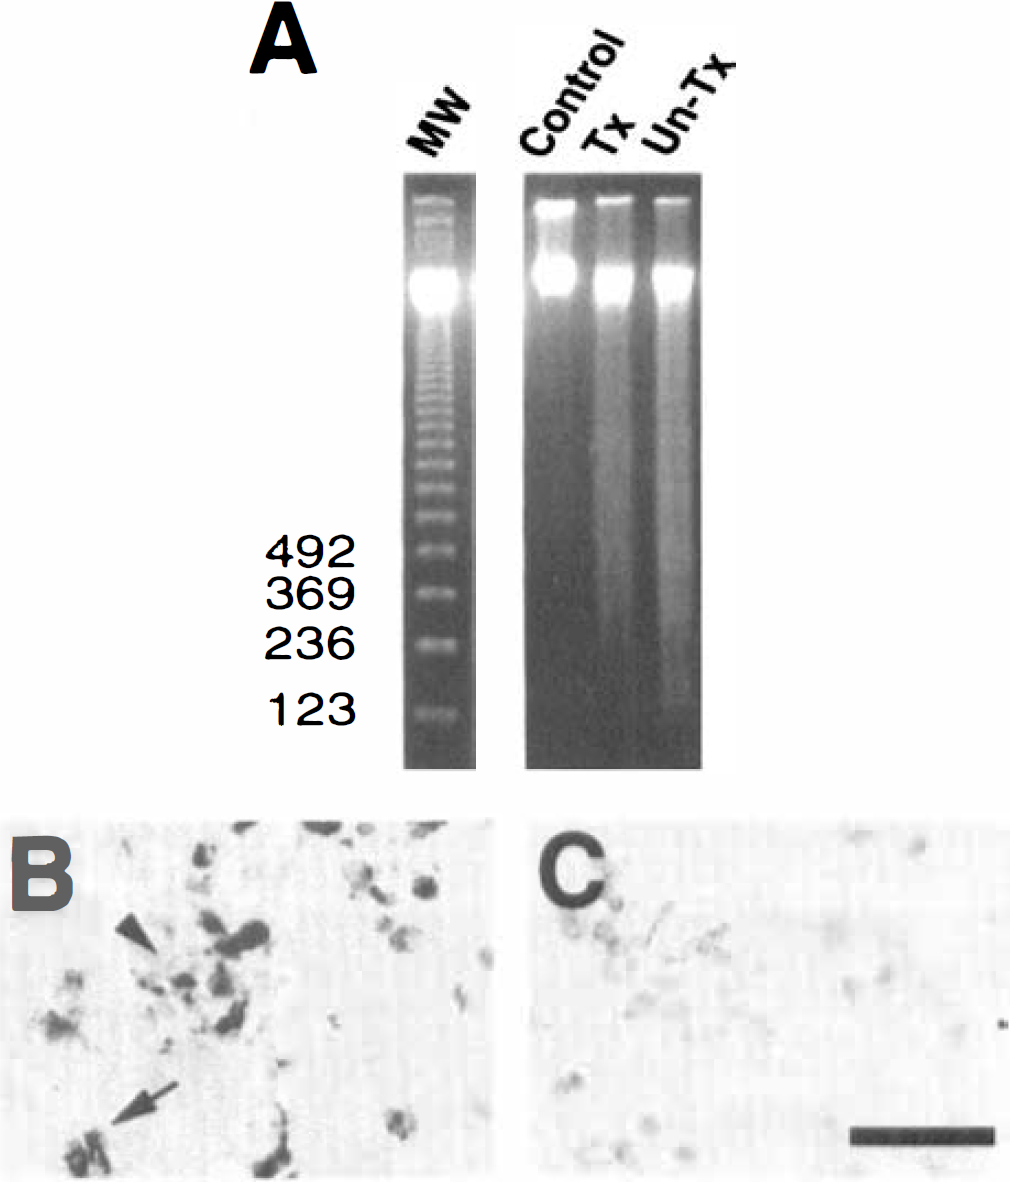
Representative findings of DNA fragmentation after ischemia induction.
Free radical scavenger attenuated caspase-3 immunoreactivity after ischemia induction
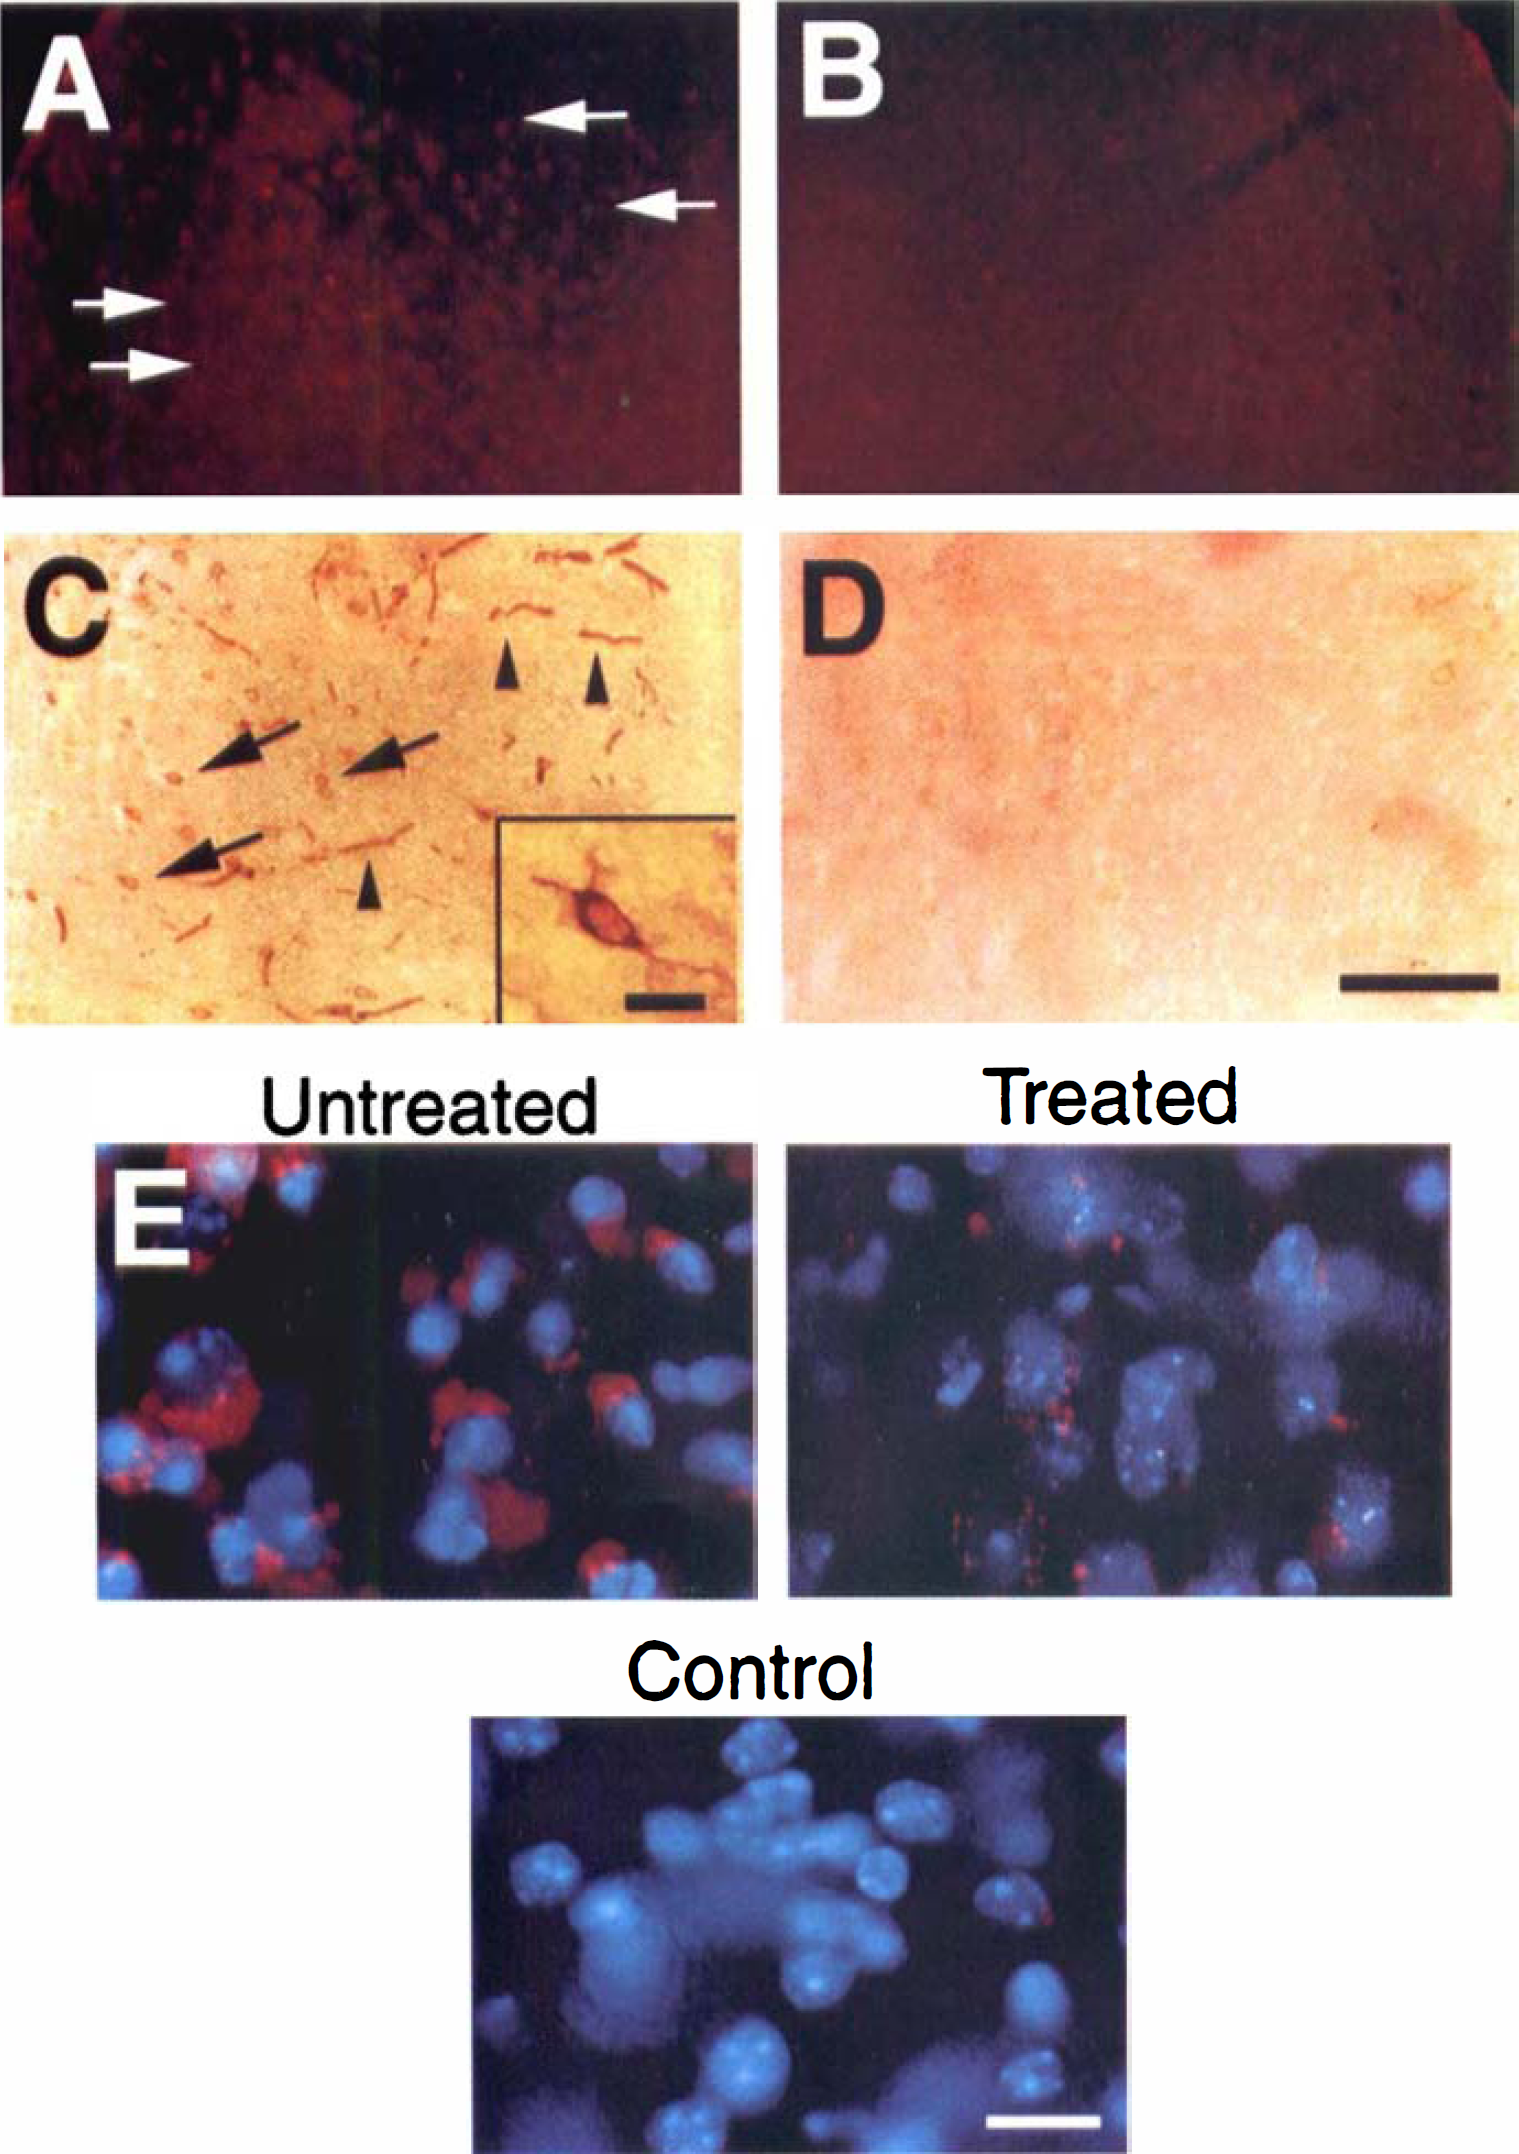
To determine the relation between the production of free radicals and the change in caspase-3 after ischemia induction, caspase-3 immunohistochemistry was performed in the U-74389G-treated and the untreated control groups. Caspase-3–positive cells in the untreated group were detected in the lesioned cortex 6 hours after ischemia induction (Fig. 5A). However, in the treated group, fewer caspase-3 immunostained cells were detected in the ischemic lesion 6 hours after ischemia than in the untreated group (Fig. 5B). On the contralateral side, immunoreactivity of caspase-3 was weak and diffusely expressed, but densely labeled caspase-3–positive cells were not detected (Fig. 5C). In the untreated group 24 hours after ischemia induction, caspase-3–positive cells, which had densely labeled nuclei, or coarse granular immunodeposits, or both, in the cytoplasm of neuronal cells and in the nuclei of shrunken cells, were widely distributed in the ischemic lesion (Fig. 5D, box for high magnification). In the treated group at 24 hours, more caspase-3–positive cells were detected than at 6 hours but were distributed less in the lesion area and were more weakly stained than in the untreated group (Fig. 5E). Immunoreactivity of caspase-3 was detected in the microvessel area and showed the morphologic characteristics of endothelial cells (Fig. 5F, box for high magnification). To quantify the changes in caspase-3 immunoreactivity after ischemia induction between groups, the authors counted and compared caspase-3–positive cells in the ischemic lesion 6 and 24 hours after ischemia induction (Fig. 5G). The treated group had significantly less caspase-3–positive cells 6 hours after ischemia than the untreated group (352.71 ± 14.65, 164.58 ± 10.12, untreated and treated groups, respectively; mean ± SD, P < 0.005). Twenty-four hours after ischemia, caspase-3–positive cells were increased in both groups, but the treated group had significantly less caspase-3–positive cells than the untreated group (507.16 ± 4.26, 348.45 ± 15.78, untreated and treated groups, respectively; mean ± SD, P < 0.005).
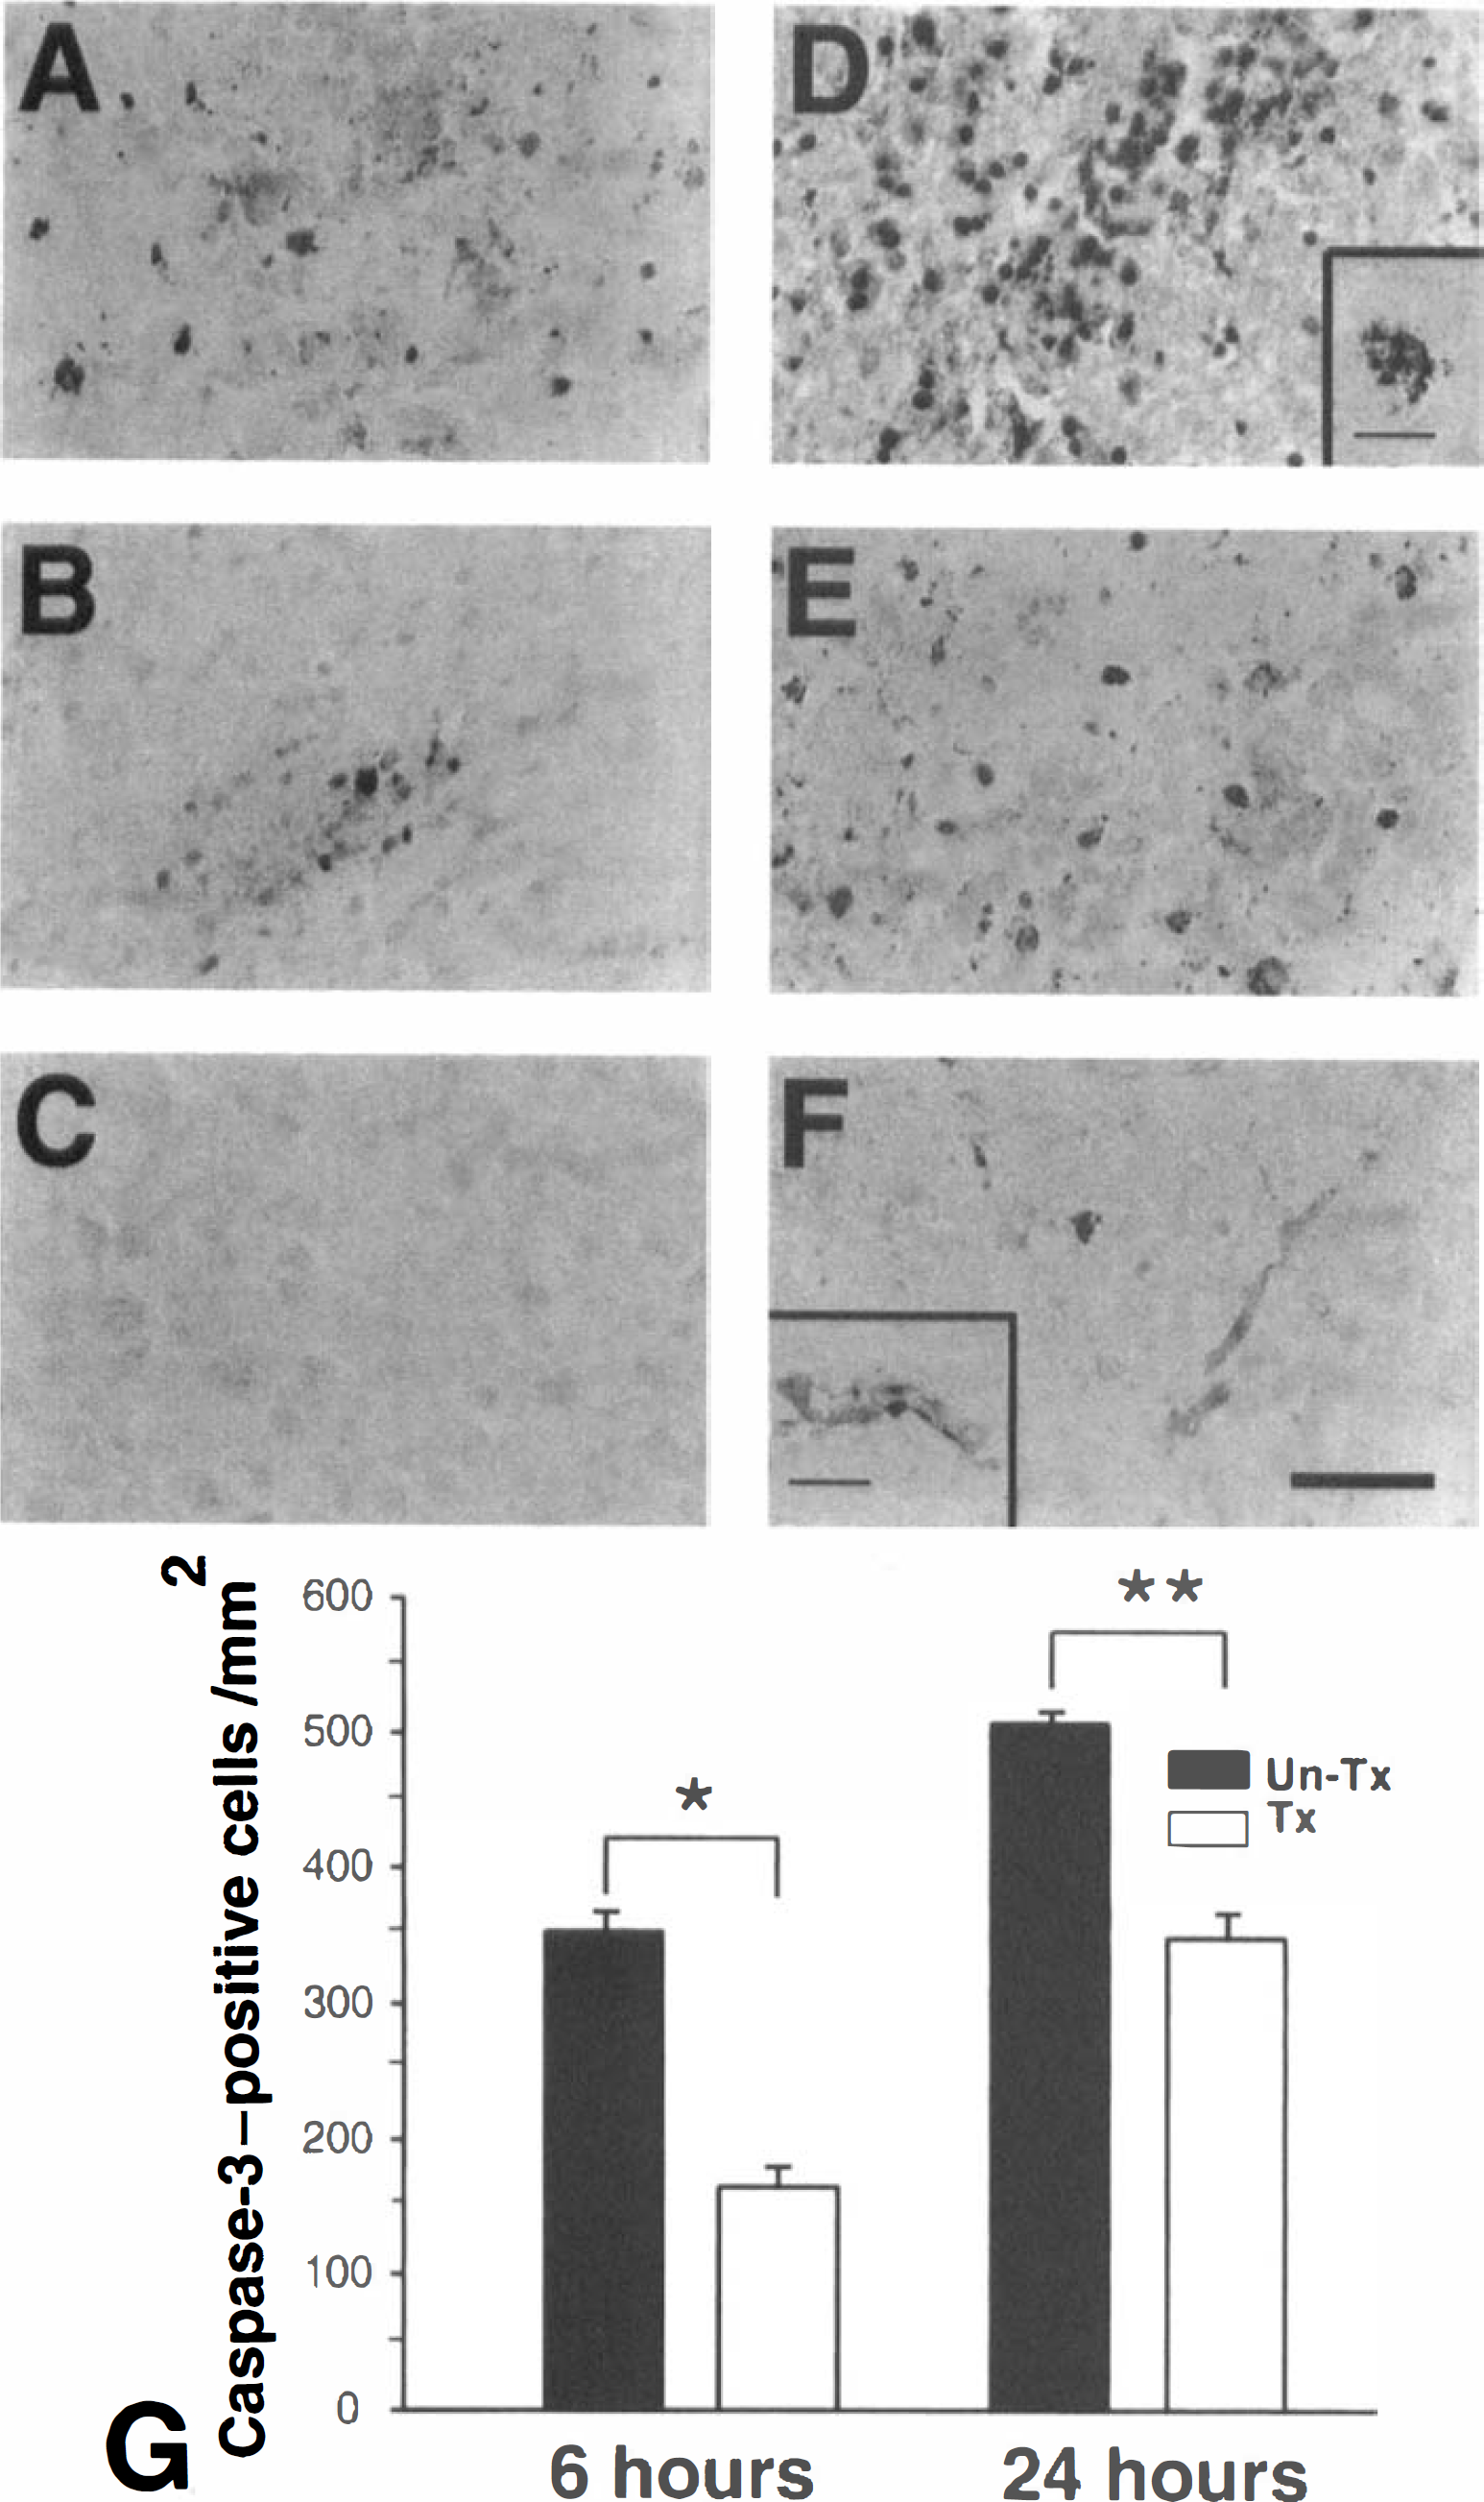
Representative findings of immunoreactivity of caspase-3 in the untreated group and the group treated with U-74389G after ischemia.
Lesion volume and TUNEL in situ detection between the treated and untreated groups
To determine the role of oxidative stress on the ischemic lesion after photothrombotic ischemia, the authors evaluated lesion volume and severity of DNA fragmentation between the treated and untreated groups after ischemia induction. Cresyl violet-stained sections showed a pale area in the cortex one day after ischemia induction. The untreated group had larger lesions than the treated group (Fig. 6A, upper panel). Three days after ischemia induction, the cortical lesion was larger than at one day, and the untreated group had larger cortical lesions than the treated group (Fig. 6A, lower panel). One and three days after ischemia induction, TUNEL staining was visualized by dark-field phase contrast microscopy using a red filter for evaluating distribution of apoptotic neurons and necrotic neurons in cortical infarction. Bright red represented apoptotic neurons and faint red represented necrotic neurons (Kondo et al., 1997). In the untreated group, apoptotic neurons were widely distributed in the lesioned cortex. Most of the bright red apoptotic neurons were observed in the peripheral area of the lesioned cortex. Necrotic neurons were also observed in the lesioned cortex. In the treated group, there were fewer apoptotic neurons under phase contrast microscopy than in the control group, and necrotic neurons were also fewer than in the control group 1 and 3 days after ischemia (Fig. 6B).
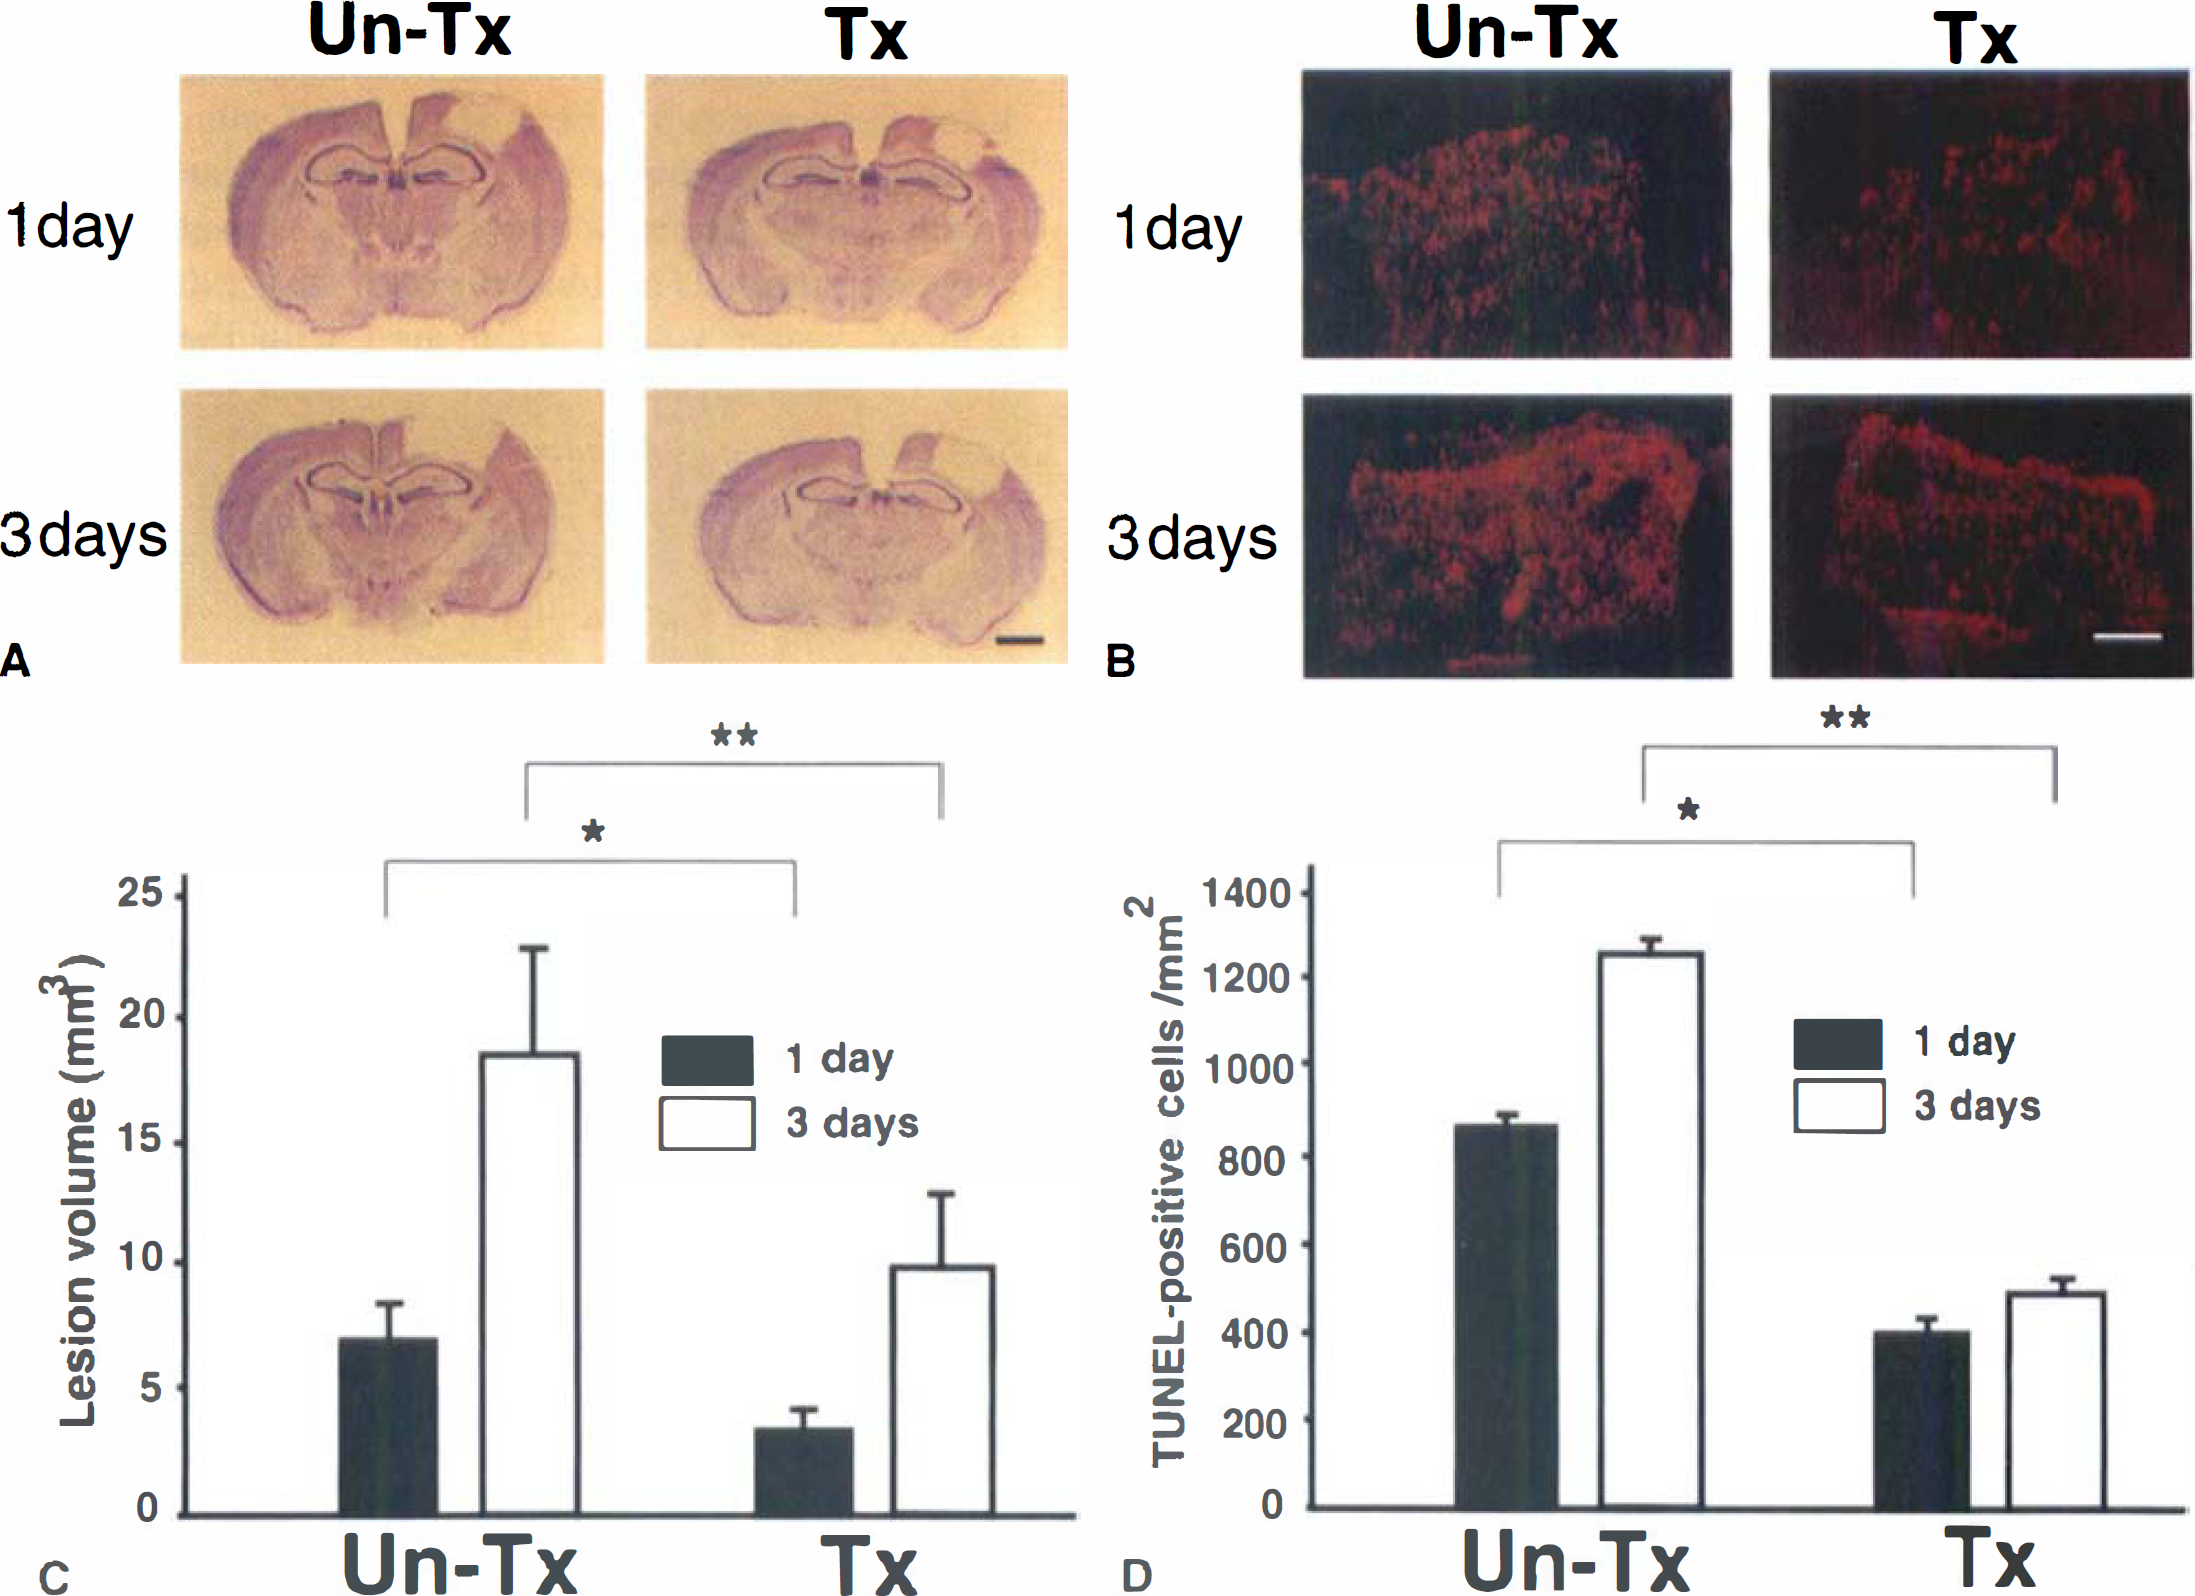
Representative findings of lesion volume and TUNEL in situ detection in the untreated group and the group treated with U-74389G.
After ischemia induction, lesion volume and TUNEL-positive cells per mm2 were quantified and compared between groups. The treated group had a significantly reduced lesion volume compared with the untreated group 1 and 3 days after ischemia (6.9 ± 1.4 vs. 3.3 ± 0.8 mm3, 1 day; mean ± SD, P < 0.05; 18.0 ± 4.3 vs. 9.9 ± 3.2 mm3, 3 days; mean ± SD, P < 0.05). In both groups, lesion volume significantly increased from 1 to 3 days (P < 0.05) (Fig. 6C). In the treated group, TUNEL-positive cells were detected significantly less often in the lesioned cortex compared with the untreated group 1 and 3 days after ischemia (856.5 ± 36.6, 381.2 ± 25.3 cells/mm2, 1 day; mean ± SD, P < 0.01; 1242.6 ± 5.3, 482.1 ± 28.6 cells/mm2, 3 days; mean ± SD, P < 0.05). In both groups, TUNEL-positive cells in the lesion increased from 1 to 3 days (P < 0.05) (Fig. 6D).
DISCUSSION
The current data demonstrate that focal ischemia induced by photothrombosis produces early oxidative stress and subsequent caspase-related apoptotic cell death, which may mediate evolving stroke. This conclusion is based on the finding that lesions and DNA fragmentation were increased until 3 days after the ischemic insult, whereas early production of ROS (as an indicator of oxidative stress) and cytochrome c release in the cytosol, and the cleaved form and increased proform of caspase-3, were detected in the ischemic brain 24 hours after ischemia. Furthermore, the free radical scavenger, U-743890, which decreased production of ROS, including superoxide radicals, after ischemia, attenuated DNA laddering, caspase-3 immunoreactivity, TUNEL-positive cells, and ischemic lesion volume, suggesting involvement of oxygen radicals and caspase-3 in ischemic infarction.
Free radicals generated from mitochondria have been implicated in the pathogenesis of ischemic neuronal injury through multiple mechanisms (Murakami et al., 1998). One mechanism is that free radicals activate the mitochondrial membrane permeability transition pore, which leads to rupture of the outer membrane of the mitochondria and release of substances such as apoptosis-inducing factor and cytochrome c that produce apoptotic cell death (Bindokas et al., 1996; Ellerby et al., 1997; Kroemer, 1997). Another mechanism is that ROS, such as superoxide radicals, alter the redox state of cytochrome c and its subsequent release (Cai and Jones, 1998). In the current study, ROS (superoxide radicals in particular) were increased in the ischemic lesion 4 hours after ischemia, and at the same time point, cytosolic cytochrome c was detected by immunohistochemistry. In the ischemic lesion, oxidized HEt signals, a possible index of ROS production, were seen as small red particles in the cytosol and perinuclear area after ischemia. On the contralateral side of the cortex, only a few HEt signals were detected that were usually located in the perinuclear area. This increase in oxidized HEt signals in the cytosol is probably attributable to mitochondrial ROS and superoxide radical production after ischemia. The authors have demonstrated with HEt in situ detection that decortication prevented O.−2– production in the striatum after treatment with the mitochondrial toxin, 3-nitropropionic acid (Kim et al., 2000), and that mice with manganese superoxide dismutase (MnSOD) deficiency showed increased mitochondrial damage and ROS production after ischemia (Murakami et al., 1998). The authors have also shown that MnSOD and ROS mediate the early release of mitochondrial cytochrome c and subsequent DNA fragmentation after permanent focal cerebral ischemia in mice (Fujimura et al., 1999a). Therefore, production of ROS could mediate the release of cytochrome c from mitochondria to the cytosol after thrombotic ischemia by either or both mechanisms. In the current study, immunoreactivity of cytochrome c was detected in the microvessel area and showed the morphologic characteristics of endothelial cells after ischemia. Also, immunoreactivity of caspase-3 was detected later in endothelial cells. Therefore, a caspase-related apoptotic process may also contribute to initial endothelial cell death and subsequent BBB damage. There is a report that showed that ischemia-induced apoptotic cell death in human umbilical vein endothelial cell cultures was correlated with p53 expression and prevented with a caspase inhibitor (Stempien-Otero et al., 1999). However, in ischemic tissue damage, apoptosis-related endothelial cell death has not been thoroughly evaluated. In the current study, BBB damage detected with Evans blue was mainly in the superficial cortex in early ischemic lesions and progressed to the deep cortex until one day after ischemia. Therefore, the initial event in ischemic lesions after thrombotic may be related to caspase activation in endothelial cells. This is supported by a previous report that showed that photochemically-induced endothelial alterations stimulate platelet activation and implicate abnormal endothelial function as a primary event in the pathogenesis of photochemically-induced cerebral infarction (Dietrich et al., 1987). In the current study, the lazaroid, which has a cellular affinity, could be delivered into the brain through early BBB disruption (Hall et al., 1994). The authors believe this is an important issue with regard to the mechanisms of stroke and brain edema and that further study in this area is warranted.
In the current study, increased ROS production was seen in the ischemic lesion and was similar to that in the ischemic penumbra area after permanent middle cerebral artery occlusion where flow is reduced to a critical level, thereby preventing neuronal cell survival, but where oxygen, as a substrate for reactive radicals, continues to be supplied to this area. It has been reported that copper zinc superoxide dismutase plays a protective role in transient focal ischemia followed by reperfusion, but not in permanent focal ischemia (Chan et al., 1993; Yang et al., 1994). In permanent middle cerebral artery occlusion by intraluminal suture blockade, regional CBF was reduced to 9.7% ± 2.6% and 8.0% ± 1.0% of the baseline in wild type and MnSOD knockout mutant mice, respectively (Murakami et al., 1998). In the current study, the regional CBF was decreased to 50% of the basal level, as measured indirectly by laser—Doppler flowmetry, until 90 minutes after ischemia induction. Although photothrombotic ischemia produced permanent cortical infarction by end arterial thrombosis, thrombus formation of small vessels was located partially in the ischemic lesion and less than 50% of the small vessels remained patent (Watson et al., 1985). Therefore, this photothrombotic ischemia model could be used to evaluate oxidative stress in ischemic lesions.
In the photothrombotic ischemia model, extreme technical caution must be taken to create a reproducible ischemic lesion. In the current study, the authors injected Rose Bengal dye into the jugular vein through a catheter, while simultaneously using green filter lighting for 5 minutes. The rationale is that the half-life of Rose Bengal is extremely short (~2 minutes), the wavelength of maximum absorption is 562 nm (Boquillon et al., 1992), and that positioning a mouse in a stereotaxic frame for dye injection without a catheter takes at least 2 to 5 minutes. In addition, the use of green filter lighting in this model is important because the wavelength from maximum absorption of Rose Bengal increases brain temperature and damages the BBB artificially creating brain damage when the dye enters through the damaged BBB (Wijsman and Shivers, 1993). In the preliminary results, a lighting system without a filter produced variable lesions involving the hippocampus and very edema and tissue damage (data not shown).
The lazaroid U-74389G is an inhibitor of membrane lipid peroxidation and a free radical scavenger (Umemura et al., 1994; Taylor et al., 1996). In the current study, the treated group showed attenuated ROS and possibly superoxide radical production. This is agreement with a previous report showing that U-74389G treatment reduced cerebral superoxide anion concentrations after fluid percussion brain injury (Fabian et al., 1998). The authors now have demonstrated that U-74389G attenuates up-regulation of caspase-3 immunoreactivity in the lesion area from 6 hours up to 24 hours after ischemia compared with the untreated group. It has been reported that apoptosis and necrosis could be induced by free radicals through the activation of caspase-3–like cysteine proteases (Higuchi et al., 1998) and mild oxidative stress, which can activate the caspase cascade (Hampton and Orrenius, 1997). In the authors' studies, the treated group had less DNA laddering 24 hours after ischemia and less TUNEL-positive cells 24 and 72 hours after ischemia. The treated group had less infarction than the untreated group 24 and 72 hours after ischemia. However, it is difficult to compare DNA laddering quantitatively between the groups because the DNA smearing pattern was accompanied by a DNA laddering pattern. There was a similar situation with TUNEL staining because this technique showed strongly labeled apoptotic cells and weakly stained necrotic cells. Nevertheless, in the untreated group, using an imaging optical density ratio of the 200 base ladder band, there was a much higher density ratio than in the treated group. Recently, it has been shown that apoptotic cell death can be detected by combining several different approaches, such as TUNEL staining, DNA laddering, and caspase-3 immunoreactivity, instead of TUNEL staining or genomic DNA analysis alone (Sastry and Rao, 2000). In the current study, the authors used several different ways to confirm apoptosis-related cell death after photothrombotic ischemia (such as TUNEL staining, genomic DNA analysis, and caspase-3 immunoreactivity). Therefore, the current results suggest that free radicals could activate a caspase cascade, subsequent DNA fragmentation, and finally, cortical infarction after ischemia.
The authors have demonstrated that caspase-3 and TUNEL-positive cells increased in the lesion, particularly in the outer boundary, 6 and 24 hours after ischemia. However, the expression of TUNEL-positive cells was greater than that of caspase-3–positive cells (under 50% of TUNEL-positive cells/mm2 1 day after ischemia). Thus, DNA fragmentation and apoptosis-related cell death are partially related to the caspase cascade. The authors' data correspond with a previous report that used TUNEL staining to show that over 50% of TUNEL-positive cells did not double stain with caspase-3 after ischemia and reperfusion in mice brains (Namura et al., 1998). In the current study, DNA gel electrophoresis and TUNEL staining showed apoptosis and necrosis patterns; thus, the lesions produced by photothrombotic ischemia may have both apoptotic and necrotic characteristics.
TUNEL-positive cells were increased from 1 day to 3 days after ischemia, and cortical infarction volume was also increased. Thus, the authors suggest that the ischemic lesions evolved after photothrombotic ischemia. Although evolving cortical infarction is not totally dependent on caspase-3, caspase-related cell death and oxidative stress may be involved in progressive stroke. The current data agree with a previous report that magnetic resonance imaging to show the evolution of cortical infarction induced after photothrombotic ischemia in mice (Lee et al., 1996).
Oxidative stress contributed to the increase in caspase-3 immunoreactivity and subsequent DNA fragmentation and progressive cortical infarction after photothrombotic ischemia. The current results suggest that antioxidant treatment could be a therapeutic agent that protects against caspase-related cell death and subsequent cerebral infarction after thromboembolic stroke.
Footnotes
Acknowledgments
The authors thank Dr. Brant Watson for advice on the photothrombotic ischemia model, Liza Reola and Bernard Calagui for technical assistance, Jane O. Kim for animal care, and Cheryl Christensen for editorial assistance.