
Abstract
DNA fragments of 50 and 10 kbp were found in ischemic brain in adult rats following two-vessel occlusion or in neonates following hypoxia–ischemia. These higher-order fragments were detected before any laddered oligonucleosomal DNA fragmentation characteristic of apoptosis. Both the 50- and 10-kbp fragments were also detected during necrosis produced by decapitation, but these led to smeared smaller fragments, not laddered patterns. End-group analysis showed the presence of both 3′-OH and 5′-OH ends in both the 50- and 10-kbp fragments but the predominance of 3′-OH ends in the laddered fragments. A higher proportion of 5′-OH to 3′-OH ends was found in the 10-kbp fragment compared to the larger 50-kbp fragment, suggesting a selective degradation of the 50-kbp DNA fragment to the laddered oligonucleosomal patterns. Overall, the mode of DNA fragmentation appeared different from that described in classic apoptosis of thymocytes.
Since the introduction of the term apoptosis in 1972, which was deemed necessary to distinguished a mode of cell death different from necrosis, a widely acceptable set of morphological and biochemical criteria has been established to aid in this description (Wyllie et al., 1980; Buja et al., 1993; Columbano, 1995). The apoptotic cell exhibits shrinkage, nuclear condensation and segmentation with chromatin clumping, and plasma membrane blebbing which pinches off cellular contents into apoptotic bodies. The major biochemical criterion is the presence of an ordered cleavage of the DNA backbone which is visualized as a laddered electrophoretic pattern of fragments. Based on these criteria, a wide variety of insults in myriad cell types have been shown to induce the apoptotic process (Buja et al., 1993; Bortner et al., 1995). Evidence of apoptosis is also present in neurons during development (Deckworth and Johnson, 1993; Diana et al., 1993; Lo et al., 1995; Ilschner and Waring, 1992) and in disease states such as Alzheimer's, epilepsy, Huntington's and Parkinson's (Cotman and Anderson, 1995; Pollard et al., 1994; Mitchell et al., 1995; Thomas et al., 1995), but in these diseases the evidence has been based solely on the histological criteria for this process.
Transient global cerebral ischemia induces selective delayed neuronal death which has long been described as necrotic. However, an impressive number of reports since 1993 have demonstrated the presence of apoptotic-like laddered DNA following an ischemic insult. These have been in both global (Ferrer et al., 1994; Heron et al., 1993; Iwai et al., 1995; Nitatori et al., 1995; Okamoto et al., 1993; Tortosa et al., 1994) and focal (Li et al., 1995a– c ; Linnik et al., 1993 and 1995; Tominaga et al., 1993; Sei et al., 1994) models of transient brain hemostasis. Some of this evidence came from this laboratory, where we concluded that a component of the apoptotic degradative machinery is at work in the ischemic neurons (Hill et al., 1995; MacManus 1993, 1994, 1995a). In general, an absence of the morphological hallmark in ischemic brain has precluded wide acceptance of an apoptotic mode of cell death being operative following ischemia (Deshpande et al., 1992). However, there have been a couple of reports of karyorrhexic nuclei reminiscent of punctate apoptotic nuclei following transient ischemia (Ferrer et al., 1994; Li et al., 1995b). The confusion of punctate apoptotic nuclei with karyorrhexic necrotic nuclei in the light microscope, which was emphasized by Wyllie et al. (1980) remains debatable.
The endonuclease(s) which generates the regular laddered fragments is unknown, although several candidates have been suggested such as DNase I, DNase II, or Nuc18 (Barry and Eastman, 1993; Peitsch et al., 1993; Montague et al., 1994; Torriglia et al., 1995). These laddered DNA fragments are the final evidence of endonucleolytic disassembly of the nuclear chromatin structures. Efforts to detect higher-order precursors of these small fragments have yielded pieces in the 300 to 700-kbp and 20- to 50-kbp range in many cell types dying in response to disparate insults (Bortner et al., 1995; Lagarkova et al., 1995; Walker et al., 1995; Zhivotovsky et al., 1994b). In some instances, these changes in the integrity of chromatin have been detected before laddered DNA fragmentation (Brown et al., 1993; Oberhammer et al., 1993; Desjardins and MacManus, 1995; Walker et al., 1994, 1995). In other cases, the chromatin disassembly halted at the stage of the 50-kbp fragment and no ladders were detected (Oberhammer et al., 1993; Beere et al., 1995; Watanabe et al., 1995). This has led to discussion that the generation of higher- and lower-order fragments are separate events (Bortner et al., 1995; Walker et al., 1995), which is supported by work on isolated nuclei (Sun and Cohen, 1994; Walker et al., 1994, 1995; Zhivotovsky et al., 1994a).
Since our own studies showed that apoptotic laddered DNA appeared in brain following transient ischemia (Hill et al., 1995; MacManus et al., 1993, 1994, 1995a), we undertook to detect higher-order chromatin fragments. While these studies were in progress [described in abstract form in MacManus et al. (1995b)], a report appeared describing the appearance of 300-kbp fragments of DNA following ischemia produced by middle cerebral artery occlusion, with evidence of subsequent breakdown to smaller pieces (Charriaut-Marlangue et al., 1995). In the present study, we used two-vessel occlusion (2VO) or neonatal hypoxia–ischemia and compared our results to frank necrosis produced by decapitation.
MATERIALS AND METHODS
Adult rat transient global ischemia by two-vessel occlusion
All procedures involving animals were approved as meeting acceptable standards by local committees for the Canadian Council on Animal Care. Transient cerebral ischemia by 2VO was produced in pentobarbital anesthetized male Sprague–Dawley rats (350–400 g) with bilateral carotid artery occlusion combined with hypovolemic arterial hypotension for 16 min as described previously (MacManus et al., 1995a). The 2VO-treated rats, with 3% fluothane, were decapitated for the biochemical studies. The brain was immediately removed, chilled, and dissected on a cold plate (0°C), and the cortex, hippocampus, and striatum were frozen and stored at −80°C until assay.
Neonatal rat hypoxia–ischemia
A cerebral hypoxia–ischemia episode was produced in 7-day-old Wistar rats by using a well-established neonatal model of hypoxia–ischemia similar to that described previously (Hill et al., 1995). Rats were anesthetized with isoflurane (4% for induction and 1.5–2.5% for maintenance), and the right carotid artery was isolated and ligated with 5-0 silk suture. A 2- to 3-h recovery period with the dam was followed by 2 h in a humidified hypoxic chamber (8% oxygen + 0.3% isoflurane for sedation/remainder nitrogen) which was maintained at 35.5°C, resulting in an axillary temperature of 36.5–37°C. The rats were returned to the dam, and 6, 12, or 18 h after the end of hypoxia were reanesthetized with pentobarbital (40 mg/kg) prior to being killed. The brain was quickly removed, and the hippocampus, striatum, and cerebral cortex were dissected and frozen in isopentane (−60°C) and subsequently stored at −75°C.
Necrosis by decapitation
Our previous studies found it informative to compare our experimental 2VO ischemic brain samples to brain samples which are definitely necrotic. The same method as before was used where rats were placed in a fluothane vapor box (3%) and, once deeply anesthetized, they were immediately decapitated (MacManus et al., 1995a). The heads were wrapped in plastic film to prevent drying and incubated at 37°C in a humid box.
Isolation of DNA in agarose plugs for pulse-field gel electrophoresis
Tissue was embedded in agarose plugs to avoid sheer or manipulation-induced breakage of DNA (Walker et al., 1993). Control and ischemic tissues that had been frozen at −80°C were used to prepare the plugs. Approximately 40–50 mg of frozen tissue was resuspended in 80 μl of TE buffer (10 mM Tris and 1 mM EDTA, pH 8.0) with the aid of a 1-ml pipette tip. This was immediately mixed with equal volume of 1.5% low-melting-point agarose (Incert Agarose; FMC, Rockland, ME, U.S.A.) held at 37°C. The mixture was cast into a 1-ml syringe and set at 4°C for 5 min. The plug was then immersed in lysis buffer (10 mM Tris, 125 mM EDTA, and 1.0% N-lauryl sarcosine, pH 9.0) containing proteinase K at 0.1 mg/ml (Gibco/BRL, Burlington, ON, Canada), and incubated with rotation at 37°C for 20–24 h. The next day, the plug wash was removed and the low molecular weight DNA precipitated with sodium acetate–ethyl alcohol for later use (see below for electrophoresis of laddered DNA fragments). The plug was rinsed in TE and incubated with 33 μg/ml RNase A (Sigma, Burlington) in TE buffer at 4°C for 1 h. After a rinse in TE, the plug was incubated with a protease inhibitor, 1 mM 4-(2-aminoethyl)benzenesulfonylfluoride hydrochloride (Pefabloc; Pentapharm, Basel, Switzerland) in TE at 4°C for 1 h. The plugs were then rinsed twice in TE at 4°C for 30 min each and pulled back into a 1-ml syringe and stored at 4°C.
Pulse-field gel electrophoresis of large DNA fragments
High molecular weight DNA was separated by using a pulse-field gel electrophoresis (PFGE) system as described (Walker et al., 1993). A slice of 0.02 ml of the prepared cast agarose plug was loaded onto a well in 0.8% agarose (FMC) gel in TBE electrophoresis buffer (0.089 M Tris, 0.089 M borate, and 2.5 mM EDTA, pH 8.3) and sealed in place with 1% low-melting-point agarose (FMC). The gel was subsequently run on a Q-Life Autobase PFG system with software-assisted ROM Card 3 (resolution, 8–500 kbp; Q-Life, Kingston, ON) in TBE buffer at 14°C. After staining with ethidium bromide, the gel was destained in distilled water and photographed under UV transillumination.
Agarose gel electrophoresis to detect laddered DNA fragments
The plug wash contained the low molecular DNA fragments from the entire sample rather than from the individual slice which was subjected to PFGE as just described. This gave an ∼10-fold increase in the amount of material analyzed compared to the single plug slice. The low molecular weight DNA was recovered from the retained plug wash just described by precipitation with 0.3 M sodium acetate and 2 vol ethyl alcohol. The DNA pellet was resuspended in TE buffer and treated with 0.3 mg/ml RNase A for 1–2 h at 37°C. Proteinase K buffer [10 mM Tris, 5 mM EDTA, and 0.5% sodium dodecyl sulfate (SDS), pH 7.6] and 1 mg/ml proteinase K were added and further incubated for 1–2 h at 37°C. The samples were then phenol (1:1 phenol–chloroform) and chloroform (24:1 chloroform –isoamyl alcohol) extracted and precipitated with sodium acetate–ethyl alcohol as just outlined. The final DNA was resuspended in TE buffer containing 10% glycerol, 0.2% SDS, 0.02% bromophenol blue, and 20 mM EDTA and heated at 65°C for 10 min prior to loading on a 1.8% Synergel (Diversified Biotech, Boston, MA, U.S.A.) in TAE electrophoresis buffer (40 mM Tris and 1 mM EDTA, pH 8.0, with acetic acid). The gels with DNA markers were run for 16–18 h at 30 V at room temperature, stained with ethidium bromide (1 μg/ml), and photographed by UV transillumination.
Determination of the nature of the ends in the DNA fragments
The nature of the ends of high molecular weight DNA was determined by labeling the DNA while still encased in an agarose plug (Incert Agarose; FMC). A slice of DNA plug approximating 0.02 ml was soaked in water overnight at 4°C to remove traces of SDS, proteinase K, RNase A, or salts. It was subsequently equilibrated in either terminal deoxynucleotidyl transferase (TdT) buffer [0.1 M potassium cacodylate, 2 mM CoCl2, and 0.2 mM 1,4-dithiothreitol (DTT), pH 7.3] or polynucleotide kinase (PNK) buffer (0.05 M Tris, 0.01 M MgCl2, 5 mM DTT, 0.1 mM spermidine, and 0.1 mM EDTA, pH 7.6) for 1 h at 4°C. The 3′-OH ends were identified by the TdT reaction by addition of 18–20 μCi α-32P-dideoxy-ATP and 22.5 units (U) TdT enzyme (Gibco/BRL) in 150 μl buffer. The reaction was stopped after 2 h at 37°C by addition of 8 μl 0.5 M EDTA, pH 8.0, for 15 min at room temperature. The 5′-OH ends were identified by the kinase reaction by addition of 18–20 μCi γ-32P-ATP and 15 U PNK (Pharmacia, Baie Durfe, PQ, Canada) for a period of 2 h at 37°C in 150 μl kinase buffer. The reaction was stopped with 8 μl of 0.5 M EDTA, pH 8.0, for 15 min at room temperature.
After labeling by either enzyme, the plugs were washed with distilled water three times before loading on a 0.8% agarose gel in TBE buffer and electrophoresed using the Q-Life PFG system. Following the run, the gel was stained with ethidium bromide, photographed under the UV trans-illuminator, and dried in a vacuum slab-gel drier. The gel was then exposed to X-OMat RP-5 X-Ray film (Eastman Kodak, Rochester, NY). The radioactivity in the 50- and 10-kbp fragments was quantitated as previously described (MacManus et al., 1995a).
The nature of the ends of the oligonucleosomal laddered fragments was determined on DNA prepared by standard methods (Schwartzman and Cidlowski, 1991). DNA samples (5–10 μg) were incubated in either 50 μl of TdT buffer containing 15 μCi α-32P-dideoxyATP and 15 U of TdT for 1 h at 37°C, or 50 μl kinase buffer containing 15 μCi γ-32P-ATP and 9.7 U of PNK for 1 h at 37°C. The reaction was stopped by the addition of 2 μl of 0.5 M EDTA. The DNA was precipitated, electrophoresed on a conventional agarose gel, and autoradiographed as described above.
RESULTS
Following 16 min of 2VO, the disintegration of DNA into large and small fragments was studied over time in the ischemic striatum by a combination of gel electrophoretic techniques (Fig. 1). Extremely large DNA fragments in the megabase range entered the gel just below the loading wells, but were outside the resolving range of this electrophoretic separation (see Materials and Methods). Because they also appeared in samples from control brain, the fragments were excluded from this study. However, by 6 h of reperfusion a large, clearly resolved, fragment of 50 kbp was detectable (Fig. 1A). The staining intensity of this band increased so that by 20 h it was prominent and remained so at 24 h. No fragments of 300–400 kbp were observed at any time, but by 20 h a fragment centered around 10 kbp was evident. The small fragments produced by internucleosomal cleavage were sought in the wash of each of the gel plugs from which the large fragments were subsequently electrophoresed from a gel slice. This procedure produced a 10-fold increase in the amount of sample compared to an individual slice. In Fig. 1B, a clear laddered pattern was observed but not until 20 h after the 16-min occlusion. No laddering of DNA fragments was seen at 6 or 8 h, but a clear laddered pattern appeared by 20–24 h in a similar fashion to the 50-kbp fragment in Fig. 1 A. These results suggest that the early cleavage of the DNA backbone can be detected by 6–8 h in the form of a higher-order fragment of 50 kbp well before the oligomeric laddering can be detected.
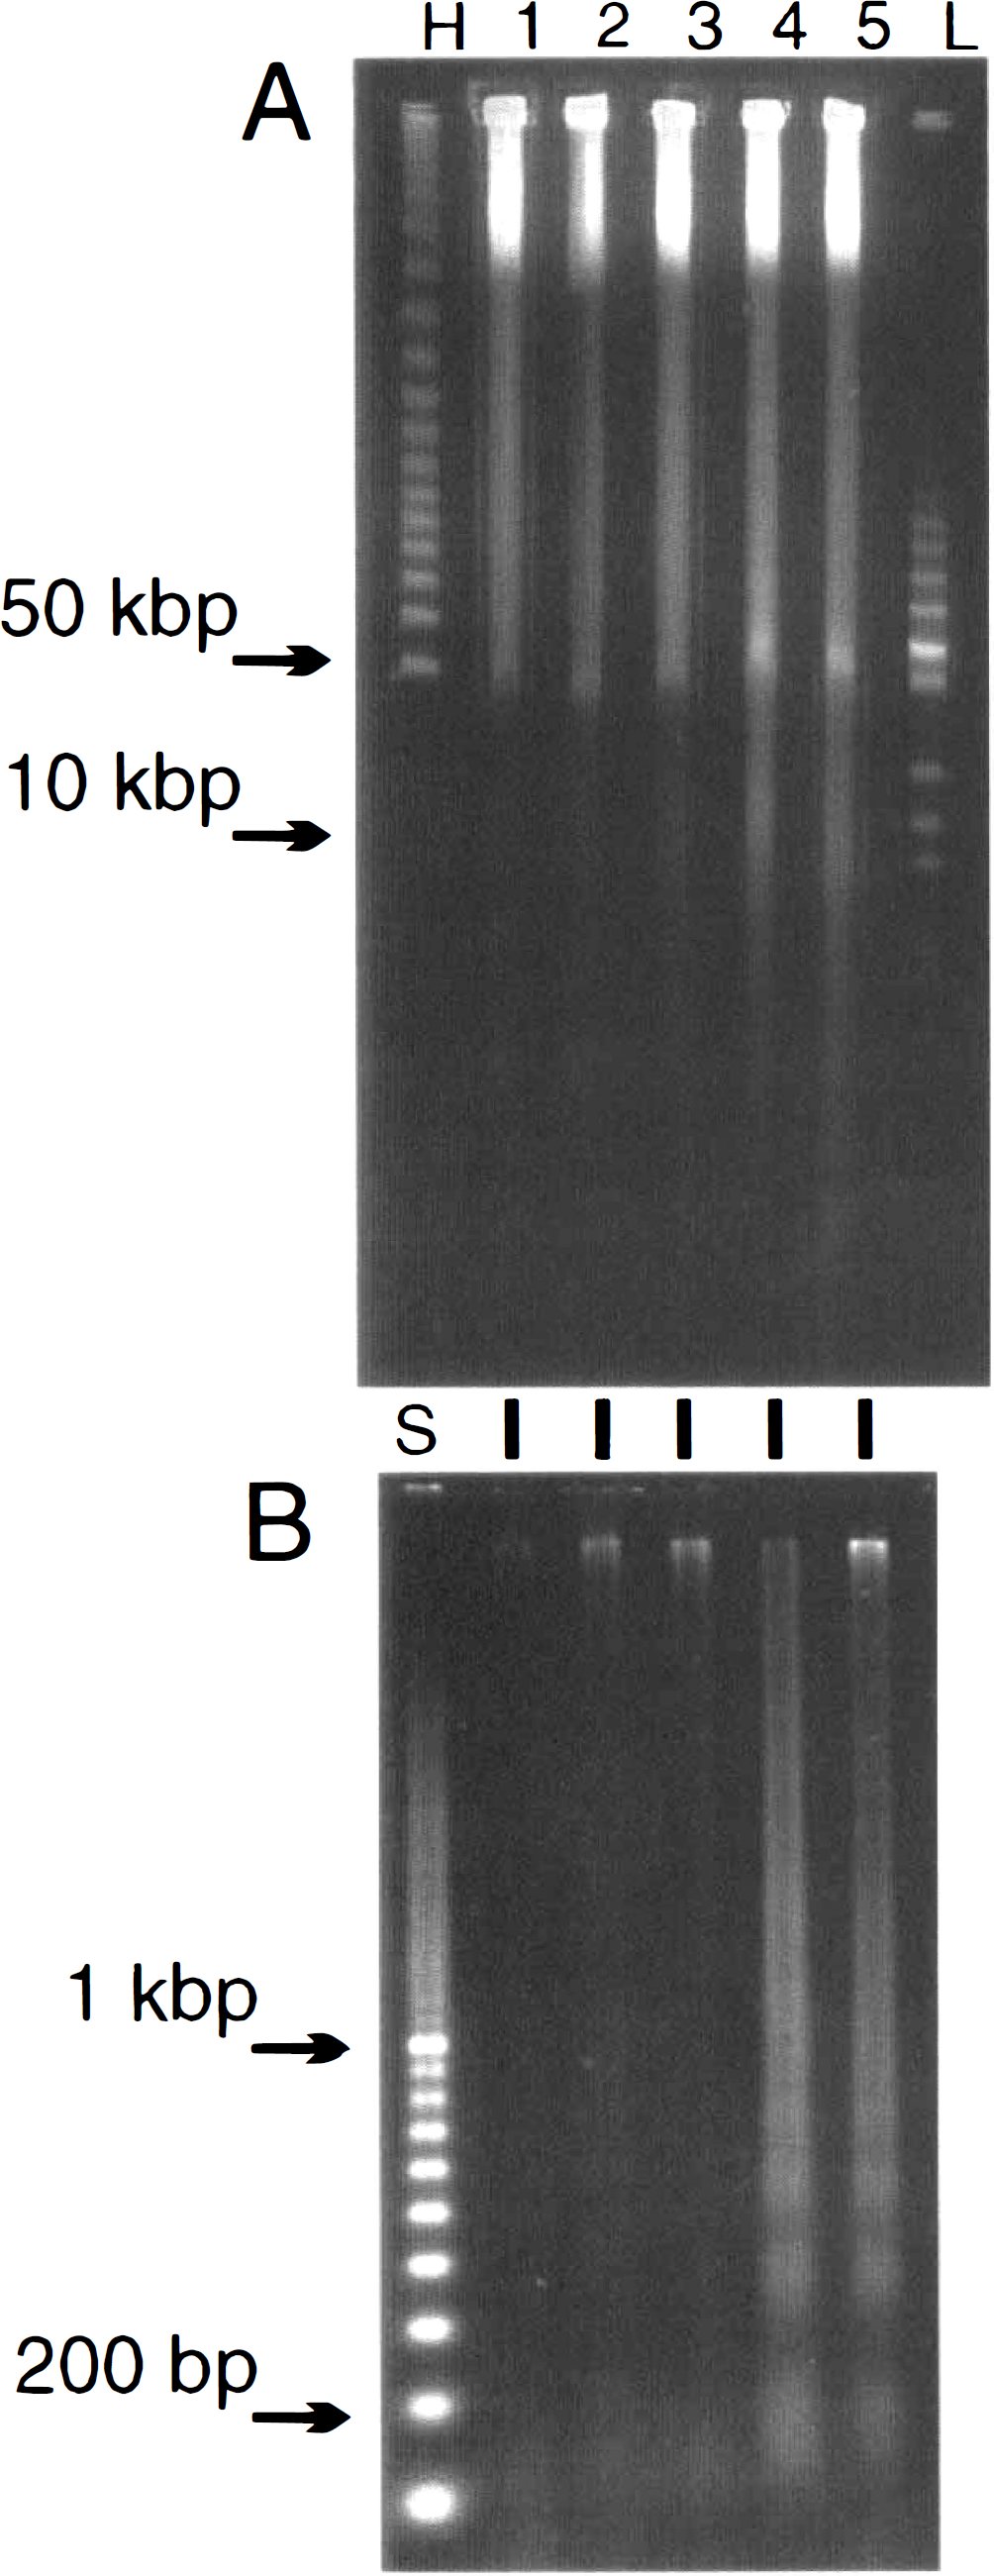
Detection of 50-kbp and 10-kbp DNA fragments before laddered 200-bp oligomers following two-vessel occlusion. (
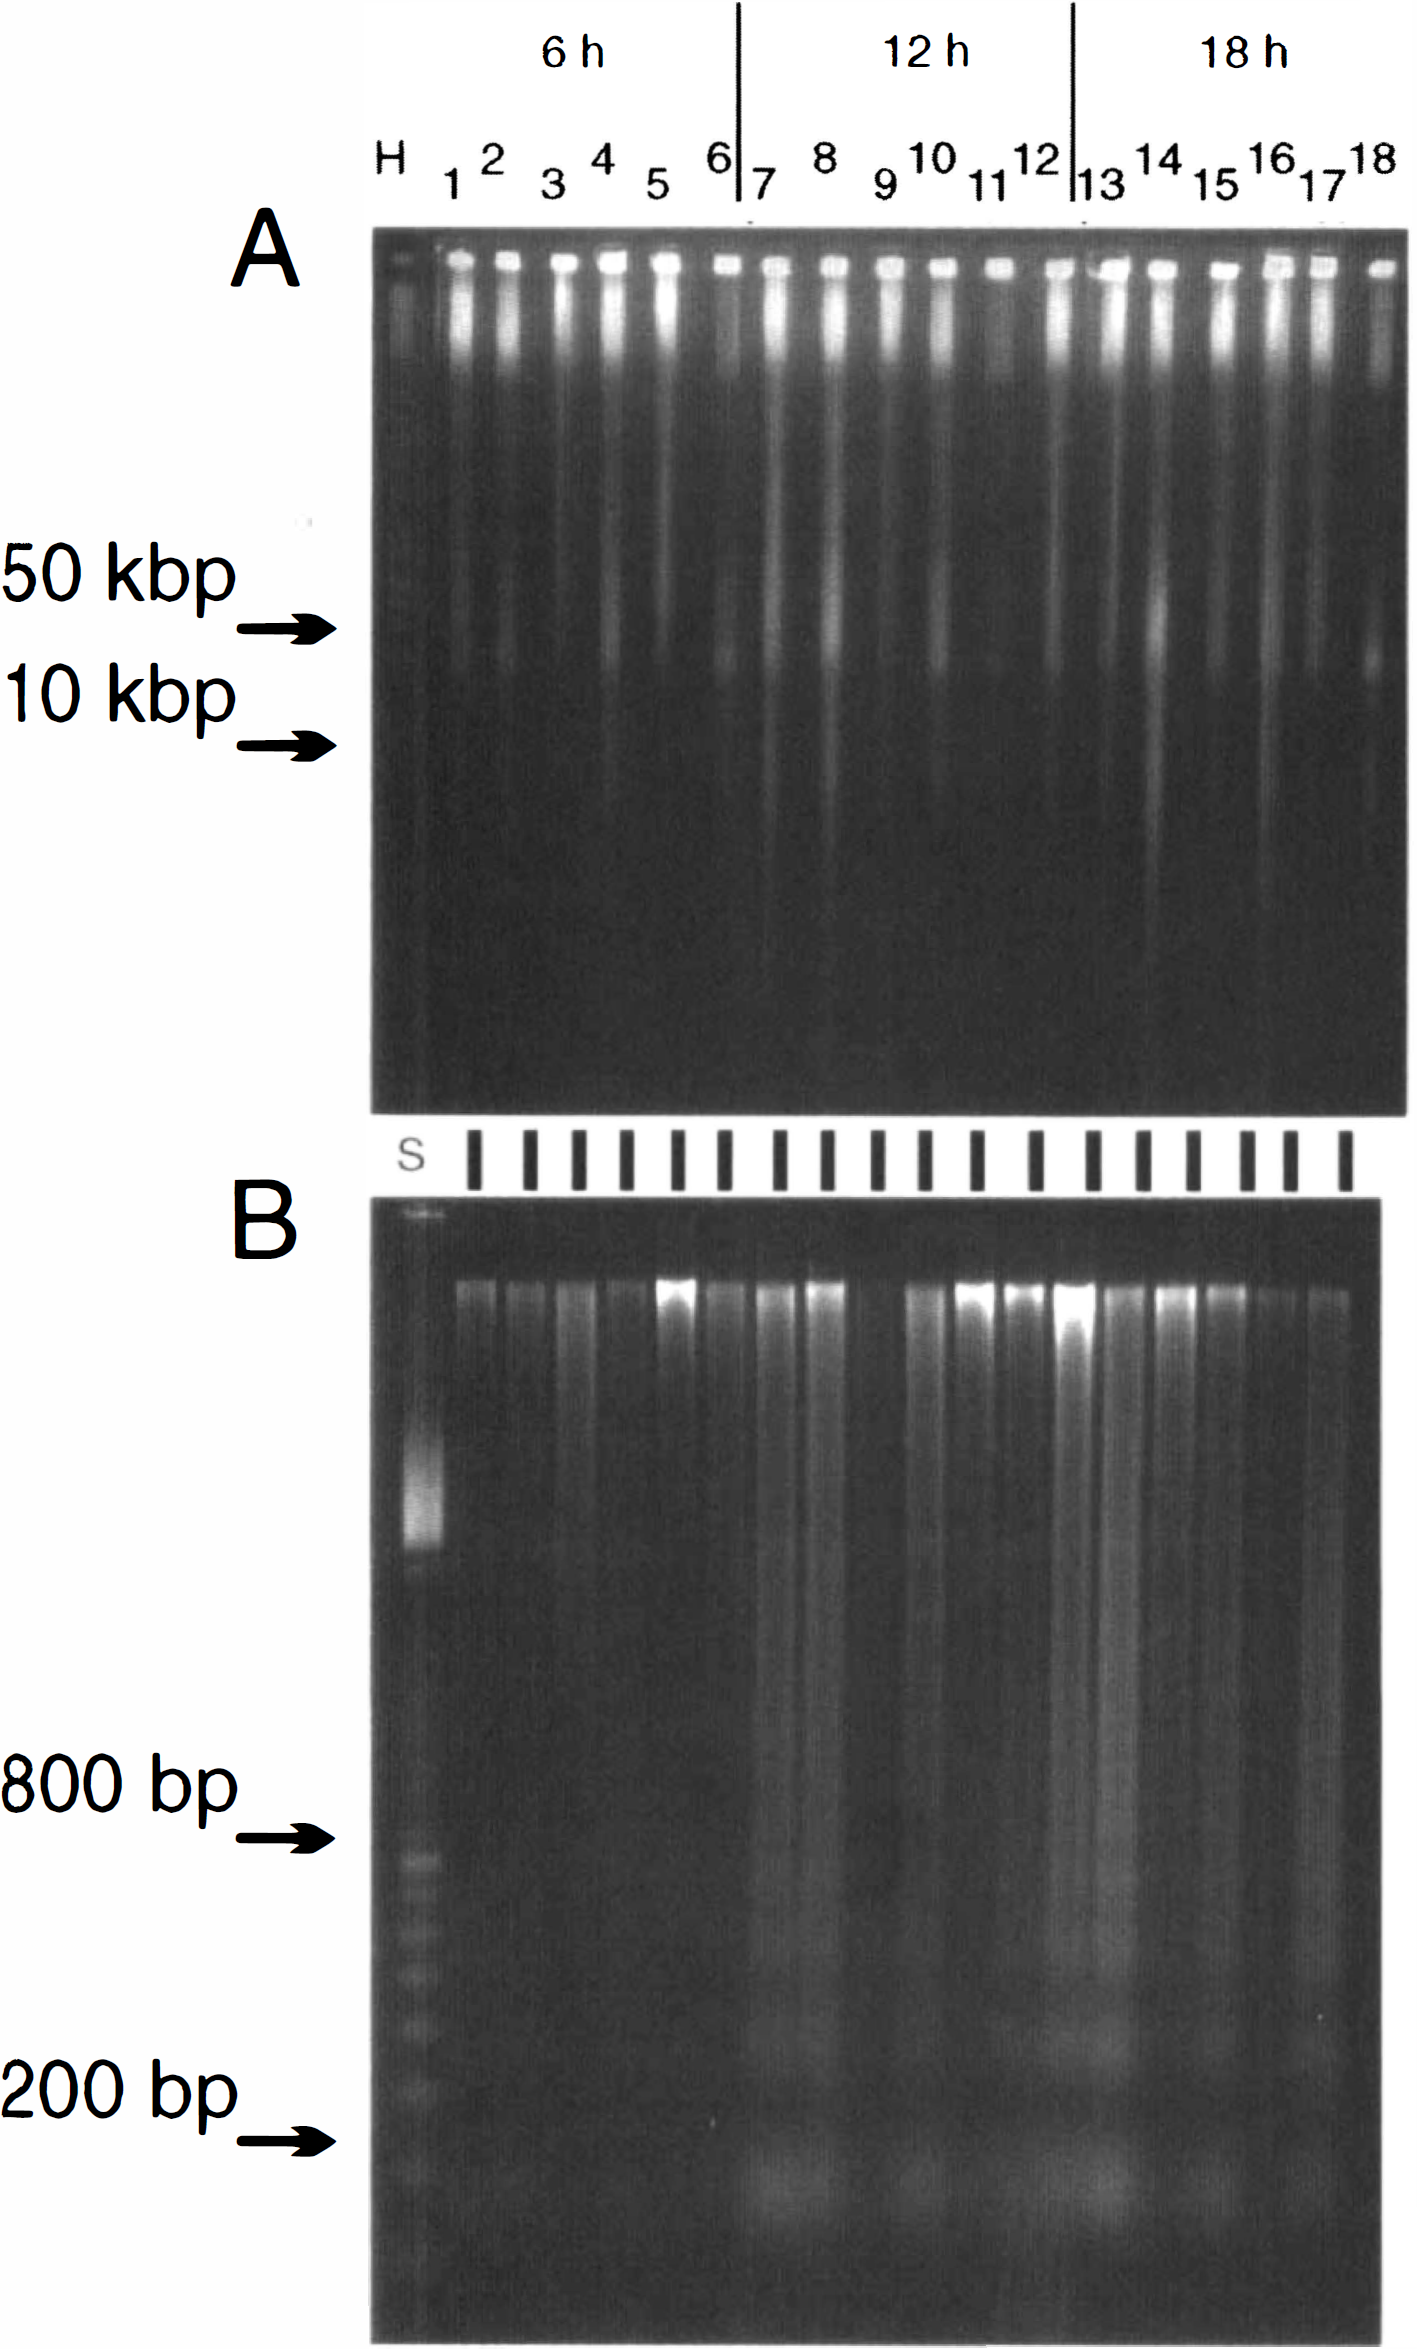
The studies on transient global ischemia were extended by a study with varied time of occlusion. The 50-kbp fragment from striatum increased in intensity as the duration of the ischemic episode was increased from 12 to 16 min (Fig. 2A). The 10-kbp fragment was barely visible after 12 min of ischemia but was obvious after 16 min (Fig. 2A). Likewise, the small oligonucleosomal fragments were barely visible after 12 min but obvious after 14 and 16 min of occlusion (Fig. 2B). The data in Figs. 1 and 2 are from striatum, but similar patterns were obtained with DNA from ischemic hippocampus (not shown). The intensity of the bands from hippocampus was less than striatum and proved difficult to illustrate consistently.
Effect of varying the duration of the ischemic period on appearance of high-order and laddered DNA fragments.
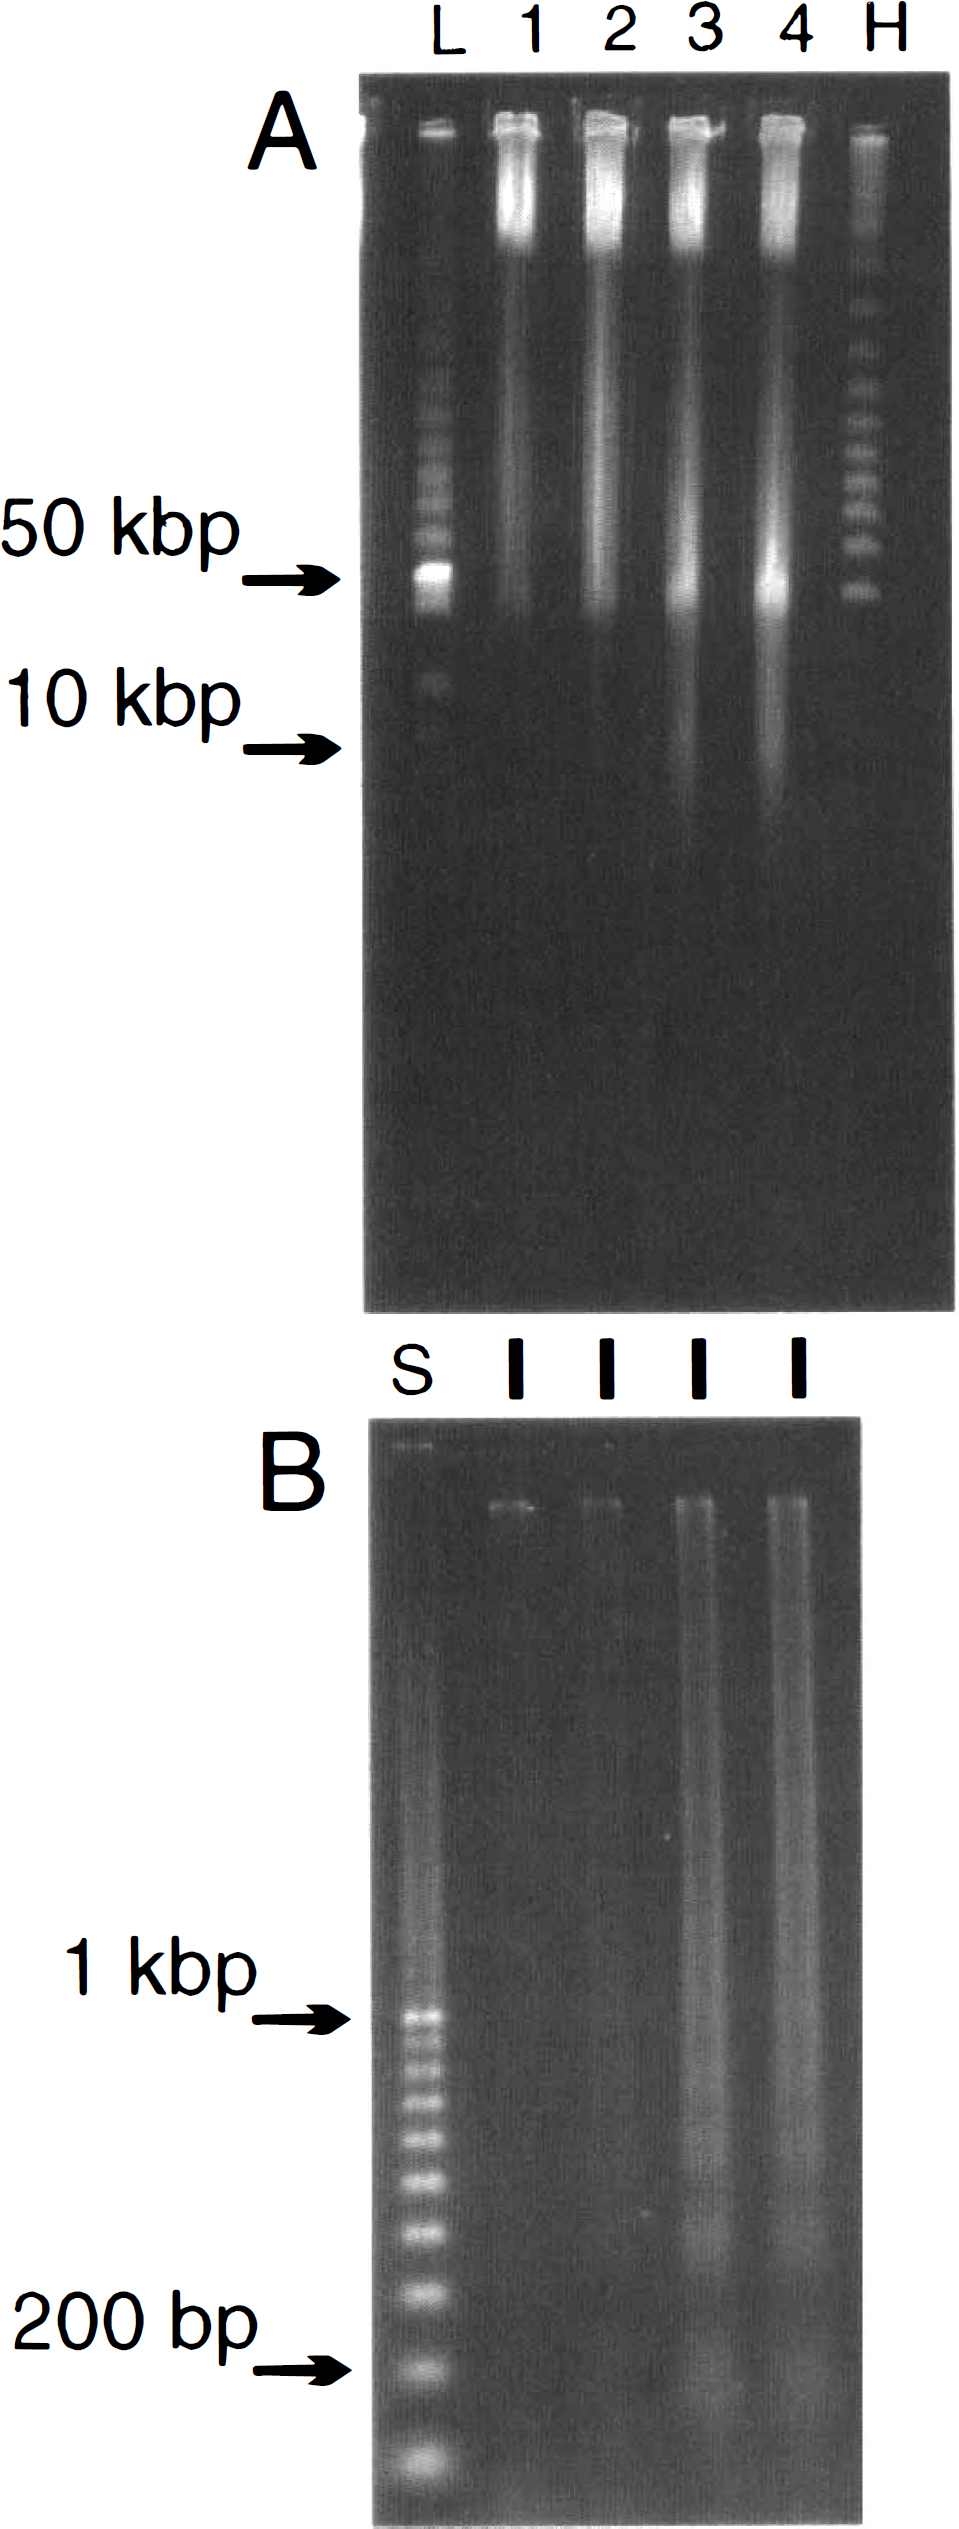
In addition to these studies in adult rats, a study in neonatal rats subjected to hypoxia–ischemia was also performed. In this model of unilateral occlusion, the right occluded side had the major DNA damage as would be expected (Ferrer et al., 1994; Hill et al., 1995). When the higher-order DNA fragmentation was studied at 6, 12, and 18 h following the end of hypoxia–ischemia, a similar picture to that following adult global ischemia was observed. The major large fragment was at 50 kbp and most obvious in the cortex (Fig. 3A). This 50-kbp fragment in the cortex was faintly stained at 6 h and became more intense by 12 h. DNA damage was also evident in the cortex of the contralateral side. The 50-kbp piece was restricted to the ipsilateral side in both the hippocampus and the striatum at all the times examined (Fig. 3A). As with the adult, the 10-kbp fragment was also visible in the ischemic neonatal brain. This fragment was most obvious in the 12-h or 18-h cortex (Fig. 3A). The small oligonucleosomal pieces were not visible at 6 h but were detected by 12 and 18 h (Fig. 3B). In a similar manner to the higher-order fragmentation, the contralateral cortex had laddered DNA, but the hippocampus and striatum had such laddered fragments only on the occluded side (Fig. 3B). These results on neonatal ischemic brain were similar to the adult studies in that the 50-kbp DNA fragment was detected as early as 6 h following the ischemic insult before any laddered DNA was visible.
Detection of 50-kbp and 10-kbp DNA fragments 6, 12, and 18 h following neonatal hypoxia–ischemia.
Since both the adult 2VO and the neonatal ischemic–hypoxic models were similar in displaying high-order and laddered oligonucleosomal DNA fragments which are associated with an apoptotic mode of cell death, a comparison was made to frank necrosis induced by decapitation. Unexpectedly, both a 50-kbp and a 10-kbp DNA fragment became visible between 1 and 6 h, and remained visible at 12 and 24 h following decapitation (Fig. 4A). The small DNA fragments were visualized in the gel plug wash (Fig. 4B), where a definite smear of DNA pieces of a multiplicity of sizes was seen most clearly at 24 h. No evidence of ordered laddered DNA fragmentation was observed as reported previously using alternative detection methods (MacManus et al., 1995a). Again, however, the higher-order 50-kbp fragment was detected by 6 h, long before any smaller fragments were visible.
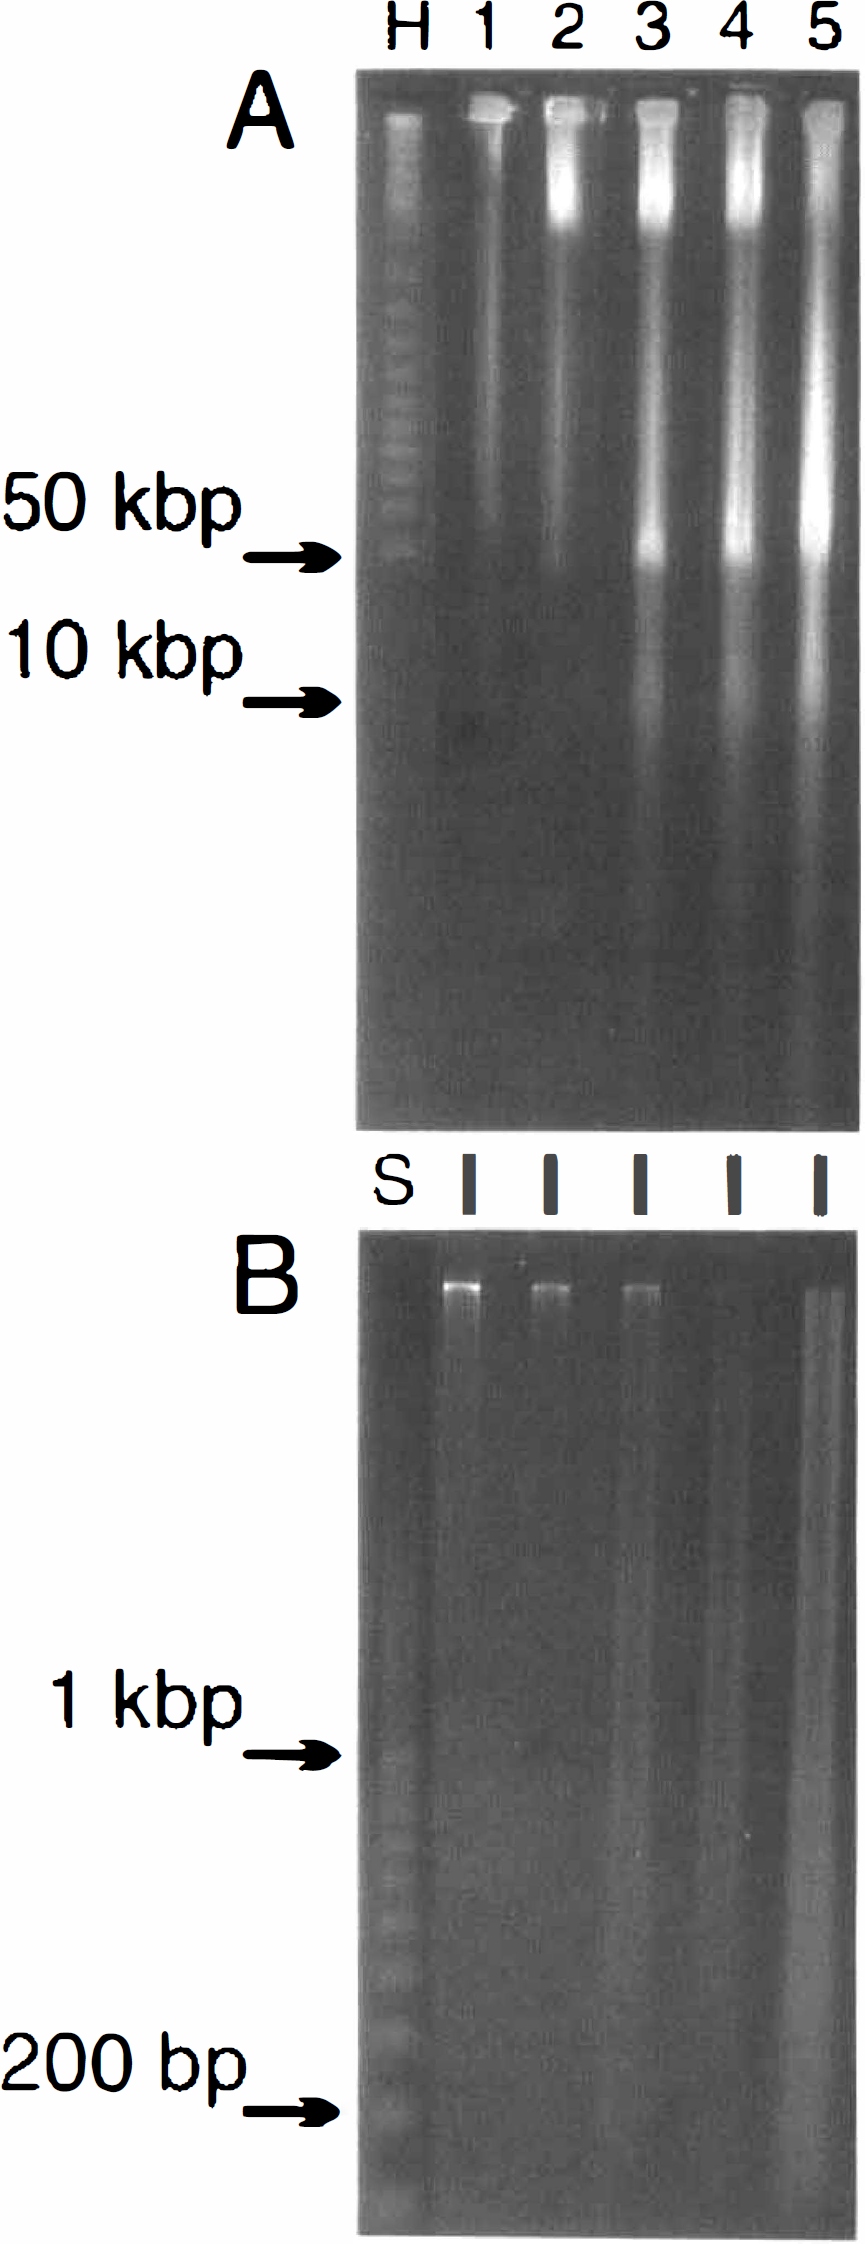
Detection of 50-kbp and 10-kbp DNA fragments by gel electrophoresis following decapitation.
The breaks in the DNA backbone, which are produced in well-established apoptotic models, such as thymocytes induced to die by radiation or glucocorticoids, have been shown to result from a DNase-I type of cleavage with generation of free 3′-OH ends in the laddered fragments (Alnemri and Litwack, 1990; Nikonova et al., 1993). No study on the nature of the ends in the large fragments of DNA has been undertaken to our knowledge. The DNA from striatum following 2VO, or from cortex following decapitation or neonatal hypoxia–ischemia, was end labeled before electrophoresis by either TdT for 3′-OH or PNK for 5′-OH end groups. The labeling was done while the DNA was still embedded in the agarose plug so production of free ends by handling was avoided. This procedure was effective since no labeling of DNA outside of the sample well by either TdT or PNK was observed either in material from sham-operated global rats (Fig. 5A,B, lane 1) or in material following 1 h of decapitation (Fig. 5A,B, lane 3), or in material from the nonoccluded hemisphere of the hypoxic/ischemic neonatal rats (Fig. 5A, B, lane 5). It can be seen that the 3′-OH end groups in the 50-kbp fragment of DNA produced following decapitation were clearly labeled by TdT (Fig. 5A, lane 4) with less intense labeling in the 2VO adult (lane 2) or hypoxic/ischemic neonate (lane 6). On the other hand, PNK labeling of 5′-OH end groups in the 50-kbp fragment was evident following all three treatments (Fig. 5B, lanes 2, 4, and 6). The 10-kbp fragment appeared to have few detectable 3′-OH ends (Fig. 5A, lanes 2 and 6), but 5′-OH ends were clearly labeled by PNK particularly following 2VO or decapitation (Fig. 5B). The possibility from the example shown in Fig. 5 that there was differential distribution of the 3′- and 5′-OH groups in the 50- and 10-kbp fragments was investigated further by quantitation of the ratio of radioactivity in the 50- and 10-kbp bands from several individual samples. The results of counting the radioactivity in bands dissected out of the gels from separate labeling experiments with different DNA preparations are presented in Table 1 and are consistent with the autoradiographic data in Fig. 5. There was a larger fraction of total labeling in the 3′-OH end groups in the 50-kbp band than in the 10-kbp band, whereas the distribution of labeled 5′-OH was nearly equal between these bands. This analysis indicates that there is a higher proportion of 5′-OH to 3′-OH ends in the 10-kbp fragment compared to the larger 50-kbp fragment. Although there appeared to be a greater amount of 5′-OH label than 3′-OH label in the 10-kbp fragment (Fig. 5B), such a direct conclusion is not possible. Although every effort was made to equate the reactions with both equal amounts of substrate and units of enzyme activity combined with similar specific activity of the radioactive donor, it is possible that a differential efficiency of the separate TdT and PNK enzyme reactions in labeling different-sized fragments may explain these differences. Further work with equal amounts of DNA isolated from the 10-kbp band and fully characterized enzyme-labeling reactions will be required for a definitive conclusion of differential distribution of 3′- and 5′-OH end-group availability.
Ratio of total radioactivity in 50 or 10-kbp bands after labeling with either terminal deoxynucleotidyl transferase or polynucleotide kinase as exemplified in Fig. 5
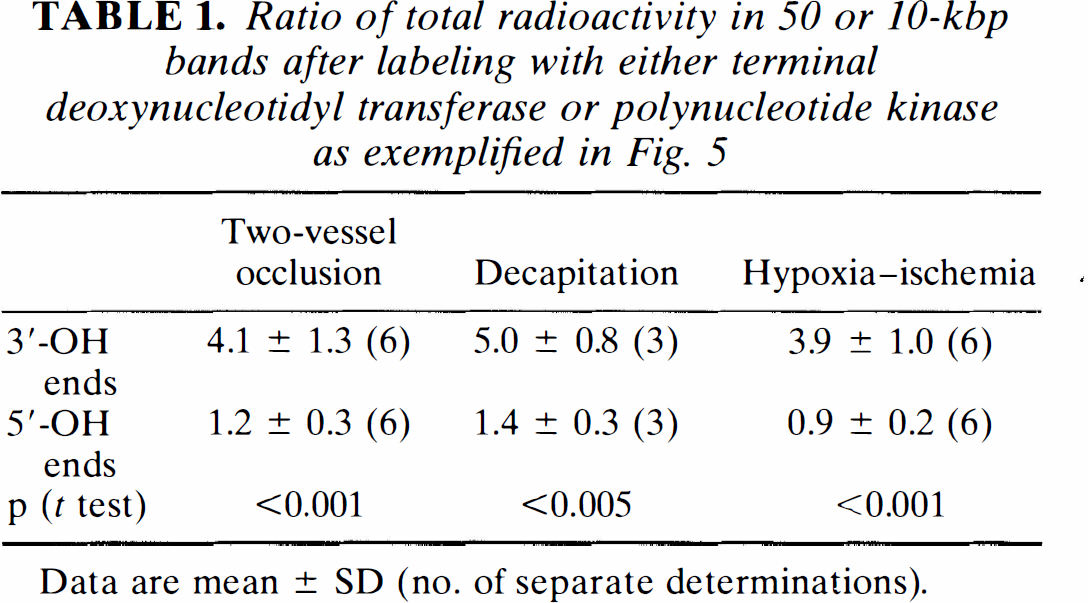
Data are mean ± SD (no. of separate determinations).
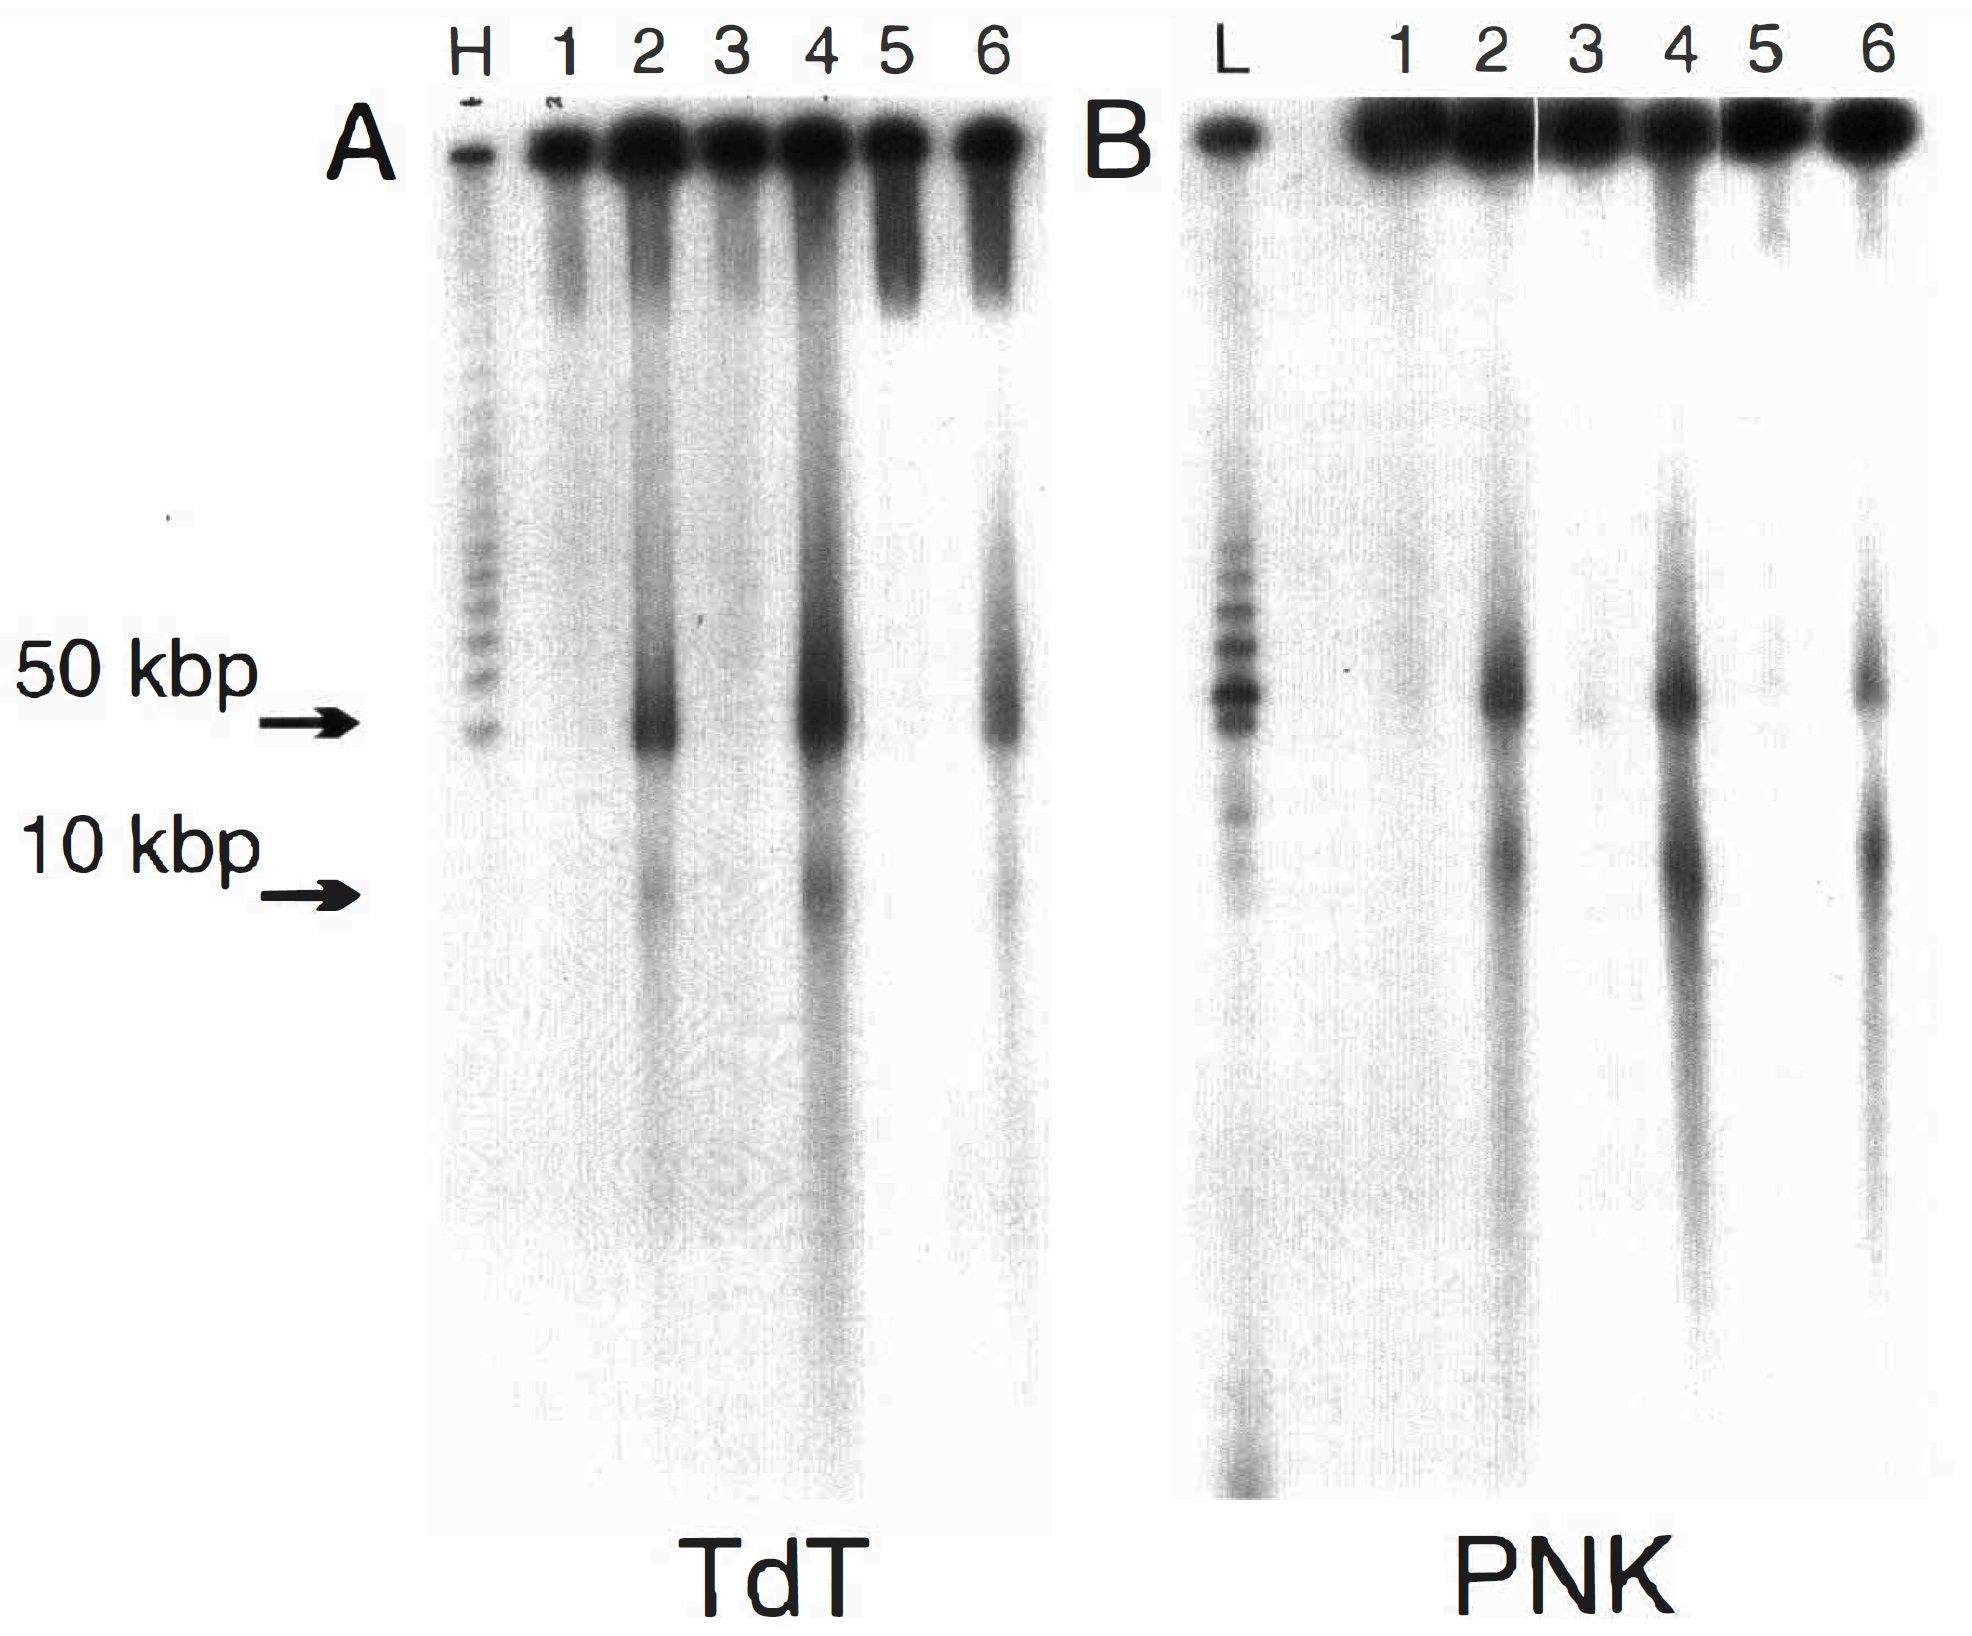
Presence of 3′-OH or 5′-OH end groups in the 50-kbp and 10-kbp DNA fragments after either two vessel occlusion (2VO), decapitation, or hypoxia–ischemia. A: 3′-OH end groups detected by terminal transferase labeling (TdT). B: 5′-OH end groups detected by polynucleotide kinase labeling (PNK). Lane 1 is DNA from sham 2VO (control) striatum, lane 2 is from striatum at 48 h after 16 min of 2VO, lane 3 is from cortex 1 h after decapitation, lane 4 is from cortex 6 h after decapitation, lane 5 is from left hemisphere (control cortex) 18 h after hypoxia–ischemia, and lane 6 is from the right occluded hemisphere (ischemic cortex) 18 h after hypoxia–ischemia. L, low; and H, high molecular weight markers in pulse-field gel electrophoresis.
To complete the study of the nature of the breaks in the DNA produced in ischemic brain, the laddered DNA fragments were also labeled (Fig. 6). TdT had previously been used extensively for enhanced DNA detection in our transient ischemia studies (MacManus et al., 1995a), and Fig. 6A (lanes 1 and 2) shows unequivocal labeling of the oligonucleosomal ladder which demonstrates the presence of 3′-OH ends in the striatal samples. However, no 5′-OH ends were detected (Fig. 6A,B, lanes 3 and 4). The DNA following decapitation also had prominent 3′-OH ends visualized by TdT labeling (Fig. 6B, lanes 1 and 2) in both cortical and striatal samples but no detectable 5′-OH ends (lanes 3 and 4). The failure to detect 5′-OH was not due to the failure of the labeling reaction since prior removal of the 5′-phosphate permitted PNK to label (Fig. 6A,B, lanes 5 and 6).
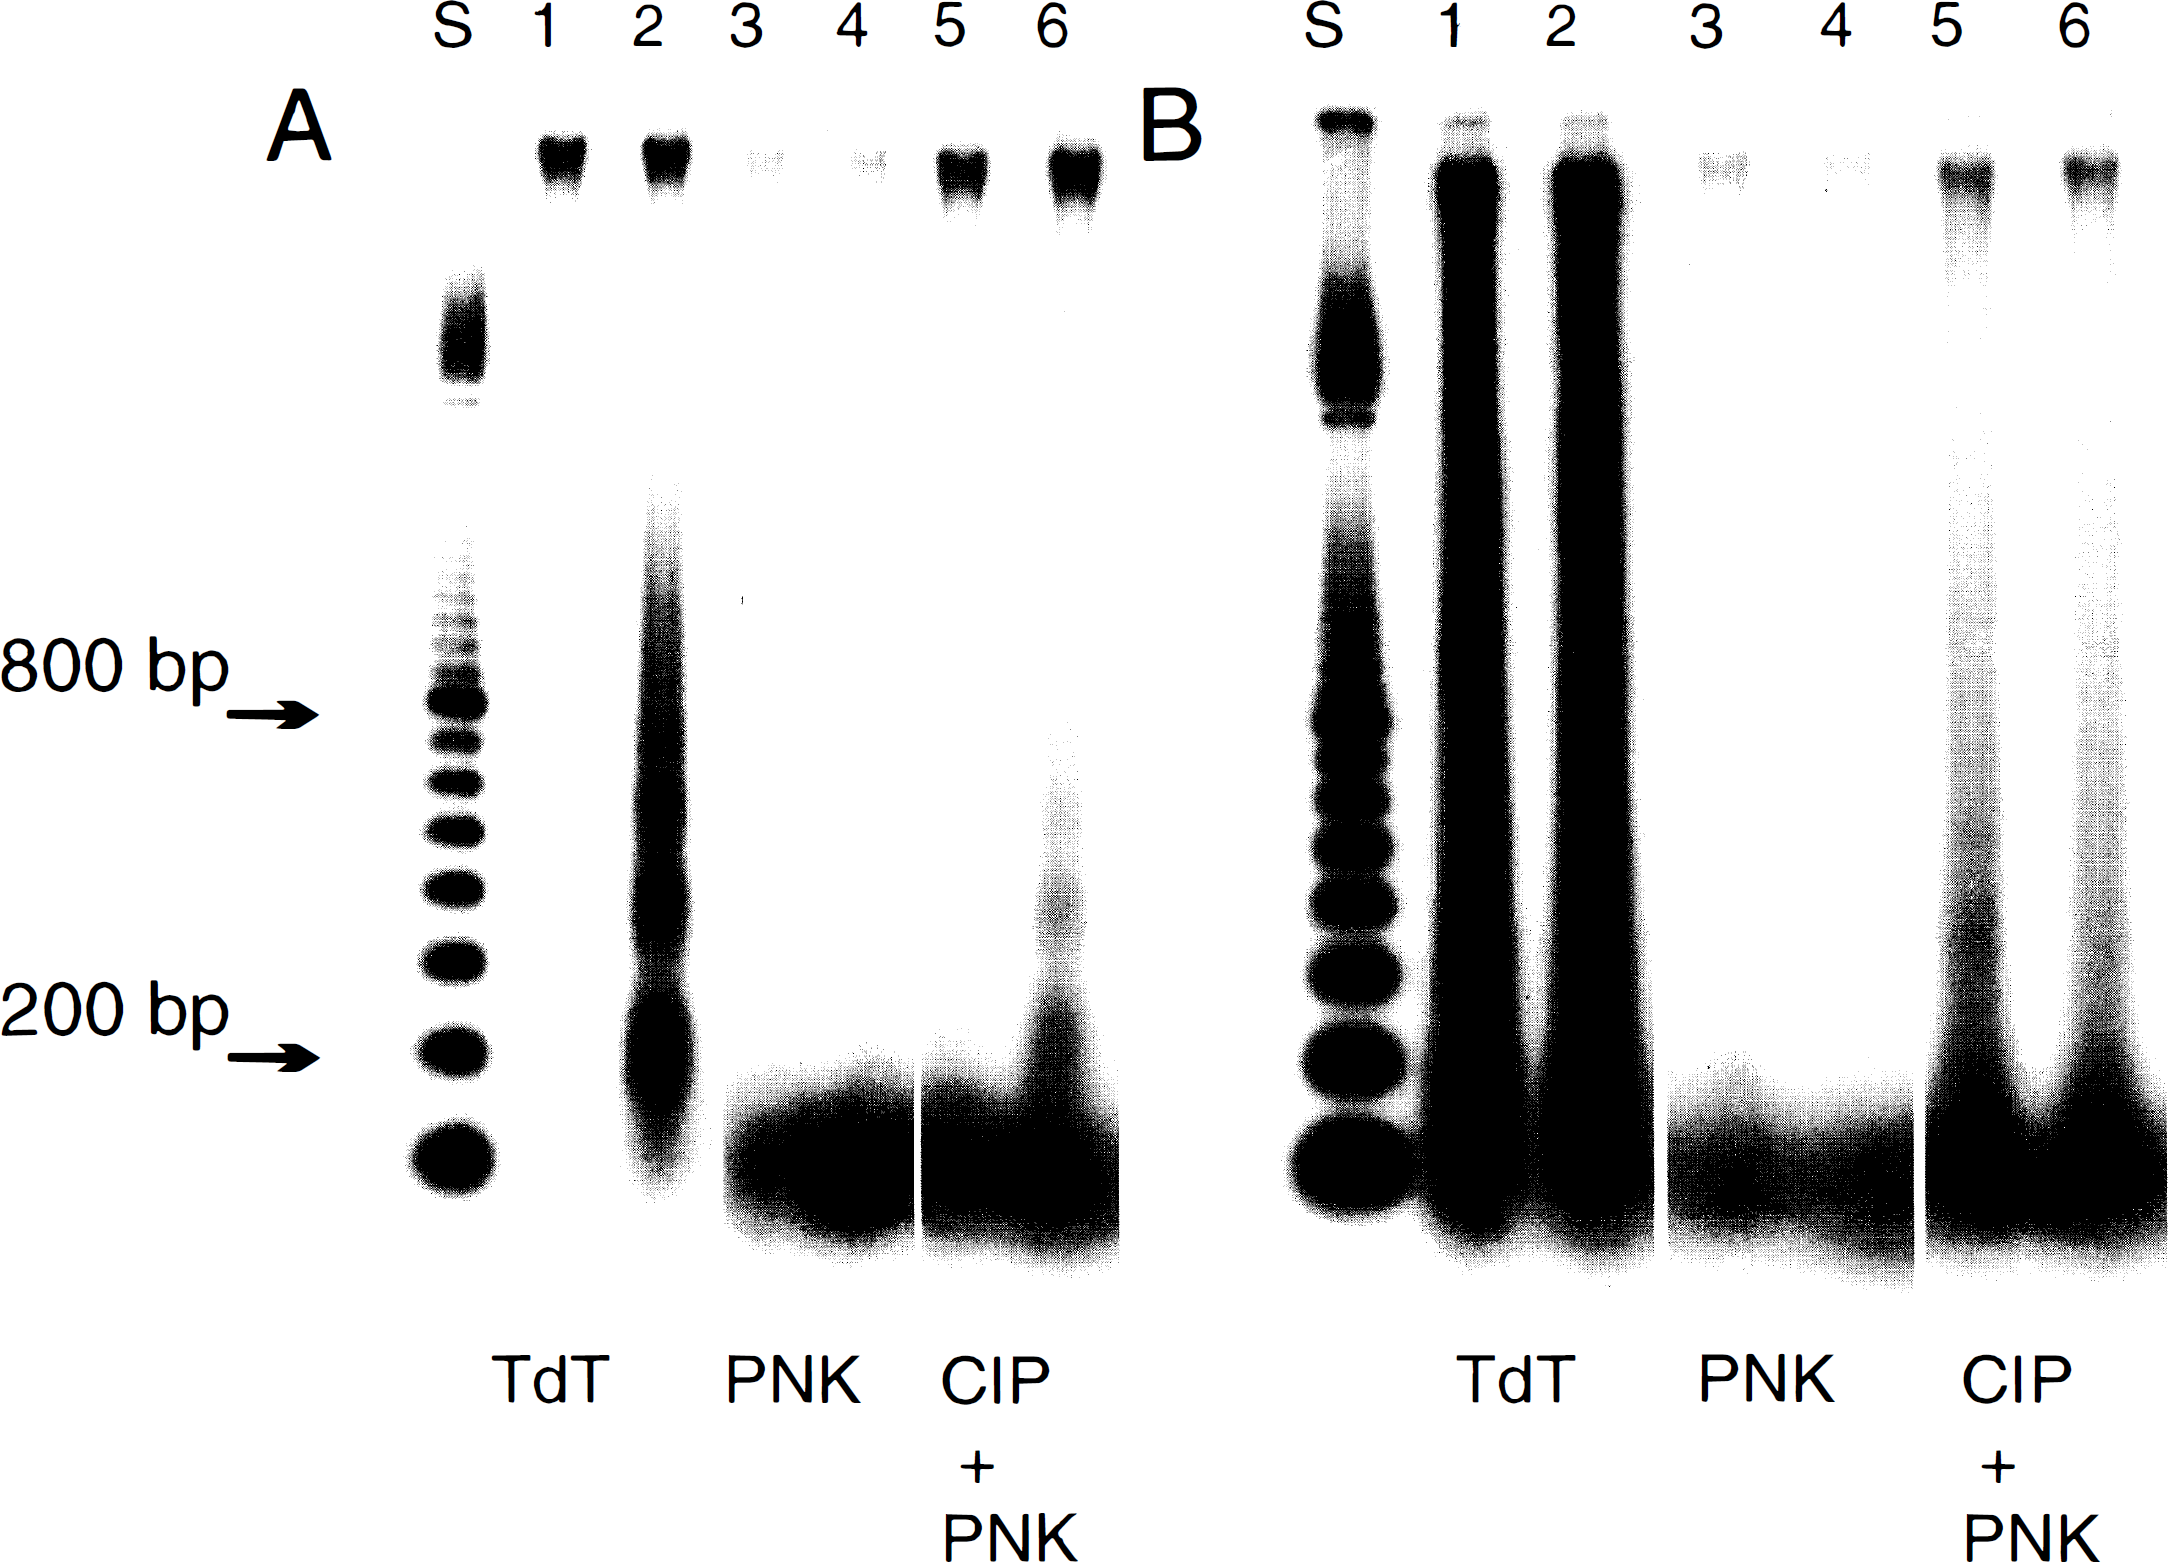
Predominance of 3′-OH end groups in the laddered DNA fragments following two-vessel occlusion or decapitation.
DISCUSSION
This is the first description of higher-order DNA fragmentation following transient global ischemia in rodents. Such 50- and 10-kbp fragments were detectable before any laddered oligonucleosomal DNA fragments. Besides characteristic morphology, the state of integrity of chromatin remains the sole acceptable hallmark of apoptosis (Wyllie et al., 1980; Buja et al., 1993; Bortner et al., 1995; Walker et al., 1995). Since the first reports in 1993 of DNA fragmentation following cerebral ischemia (Heron et al., 1993; Linnik et al., 1993; MacManus et al., 1993; Okamoto et al., 1993; Tominaga et al., 1993), there have been many others on transient global ischemia (Ferrer et al., 1994; Sei et al., 1994; Iwai et al., 1995; Nitatori et al., 1995; Charriaut-Marlangue et al., 1996a, b ), focal ischemia (MacManus et al., 1994; Li et al., 1995a– c ; Linnik et al., 1995; Du et al., 1996), and neonatal hypoxia ischemia (Ferrer et al., 1994; Hill et al., 1995) models. The oft-repeated observation of DNA damage visualized as electrophoretic laddered DNA fragments of oligonucleosomal size in ischemic rodent brain has led to the suggestion that ischemic cell death may be apoptotic. However, in the absence of a general finding of apoptotic morphology following ischemia in vivo (Kirino, 1982; Deshpande et al., 1992), the best conclusion may be that some component of the apoptotic degradative machinery is at work after such insults, although the cells exhibit other necrotic morphological hallmarks. It should be noted that in a focal ischemia model using the filament method of occlusion, cells with punctate chromatin were observed at the edges of the necrotic infarct and were considered to be apoptotic (Li et al., 1995a– c ).
In nonneuronal model systems, efforts have been made to describe what happens to chromatin soon after a death-inducing insult. Studies on DNA fragmentation of higher order than oligonucleosomal ladders have demonstrated the presence in several cell types of 300- to 700-kbp and 20- to 50-kbp fragments after PFGE [reviewed by Bortner et al. (1995) and Walker et al. (1995)]. An attractive hypothesis, usually based on the temporal appearance of these large fragments before the oligonucleosomal fragments are detected, states that the large pieces of DNA are the substrate for further cleavage into the 200-bp oligomers (Brown et al., 1993; Oberhammer et al., 1993; Desjardins and MacManus, 1995; Walker et al., 1994, 1995). However, no direct proof has been forthcoming. A confounding finding has been that these higher-order fragments of 300 and 50 kbp are not necessarily cleaved, and some dying cells never generate laddered DNA (Oberhammer et al., 1993; Beere et al., 1995; Watanabe et al., 1995). It may very well be that the higher-order fragmentation is involved with the cellular commitment to die (Lagarkova et al., 1995), leaving the laddered DNA as a nonuniversal sign that cell death has already occurred (Bortner et al., 1995; Walker et al., 1995). There have been suggestions that the generations of the large and small DNA fragments are independent events (Bortner et al., 1995; Walker et al., 1995). Such ideas are supported by work with isolated nuclei where a magnesium-dependent endonuclease can generate the large fragments, but a second calcium–magnesium-dependent activity is required to produce the laddered DNA fragments (Sun and Cohen, 1994; Walker et al., 1994; Zhivotovsky et al., 1994a).
In contrast to the many studies mentioned above on the occurrence of laddered DNA fragments following cerebral ischemia, studies on higher-order fragmentation in brain are scarce. Only one study using the a focal model of ischemia in rats has been published (Charriaut-Marlangue et al., 1995). In that study, after 6 h of reperfusion, a major 300-kpb fragment was detected with a minor 50-kbp fragment. Our current study has not detected fragments any larger than 50 kbp which appear before the oligonucleosomal ladder (Figs. 1–3). These inconsistencies may simply be due to the different methods of producing brain ischemia or to different methods of electrophoretic separation of fragments. The earliest time we can detect this 50-kbp fragment is at 6–8 h following 2VO using ethidium-bromide gel staining. At earlier times, there was no indication of the presence of any larger 300-kbp fragment even when using a more sensitive end-labeling technique to detect DNA fragments (Fig. 5). Although we cannot detect laddered DNA before the 50-kbp fragment even when using a tenfold greater relative amount of sample in the plug wash (for example, Fig. 1A,B), differences in the relative ability of the large and small fragments to stain with ethidium bromide may be the cause of failure of detection rather than the implied precursor–product relationship (Bortner et al., 1995). More ethidium bromide interacts with the 50-kbp fragment than with the laddered fragments in the 200 to 2000-bp range, leading to a potential misleading idea that the 50-kbp fragment generates the oligonucleosomal pattern after further cleavage. In addition to this 50-kbp fragment, a band centered around 10 kbp was detected in all ischemic situations examined (Figs. 1–5). Such a relatively small fragment has not been described in other dying cells, but too much should not be made of the absolute sizes of fragments due to differences in PFGE techniques and apparatus (Bortner et al., 1995; Walker et al., 1995).
It may be considered surprising that similar 50- and 10-kbp fragments were found following decapitation as were found after either 2VO or neonatal hypoxia–ischemia, even though the final outcome was smeared small random fragments after decapitation compared to the ordered fragmentation after global insults (Figs. 1 and 3). This is probably due to the presence of natural fracture points in chromatin which are topologically determined and which inevitably yield 50-kbp fragments when chromatin disintegrates. Such 50-kbp fragments have been observed in necrosis in other cell systems (Bicknell and Cohen, 1995; Kataoka et al., 1995) and may be related to putative regularly spaced DNase-I hypersensitive predilection sites observed in isolated nuclei from untreated cells (Szabo, 1995). DNA fragments of such size are considered to comprise a transcriptional domain delimited by nuclear matrix attachment sites (Filipski et al., 1990; Lagarkova et al., 1995).
Several different endonucleases, such as DNase I or II, Nuc 18, or endo-exonuclease, have been proposed as being responsible for the oligonucleosomal cleavage of DNA during apoptosis (Peitsch et al., 1993; Barry and Eastman, 1993; Montague et al., 1994; Fraser, 1994). In addition, topoisomerase II which occurs in chromatin at regular intervals 300 kbp apart could be considered as being potentially responsible for the cleavage into higher-order fragments, although there is evidence to the contrary (Beere et al., 1995). In the final analysis, no overall acceptable degradative scheme has been found, and different cells might use different cleaving activities to disassemble the genome when entering an apoptotic cell death pathway. What does appear to be accepted is that only 3′-OH end groups are generated in the laddered DNA in dying cells (Alnemri and Litwack, 1990; Nikonova et al., 1993). This available hydroxyl group permits end-labeling by TdT and has led to wide use and commercialization of the TdT-mediated dUTP-biotin nick end labeling (TUNEL) technique (Gavrieli et al., 1992) for in situ identification of DNA fragments in dying cells and tissue sections. The nature of the ends of the higher-order fragments has not been reported. Such 3′-OH end groups have been found in this ischemic study not only in the laddered DNA (Fig. 6A) but also in the 50-kbp fragment particularly following decapitation (Fig. 5A). In addition, a heretofore unreported occurrence of 5′-OH end groups has also been found in ischemic brain in the higher-order fragments with an apparent concentration in the 10-kbp fragment (Fig. 5B). No such 5′-OH end groups were found in the laddered oligonucleosomal fragments (Fig. 6B). It may be concluded that this particular DNA fragment is not a substrate for cleavage to laddered DNA fragments. It also suggests that a third type of endonuclease activity must be considered in addition to the magnesium and calcium–magnesium-dependent ones already proposed to be generating cleavage into high-order and low-order DNA fragments. A scheme indicating how DNA in brain may be degraded during ischemically induced degeneration is shown in Fig. 7. This third cleaving activity could be DNase II, which is one of the very few endonucleases which does produce 5′-OH end groups and has been implicated in apoptosis (Barry and Eastman, 1993) and lens cell differentiation (Torriglia et al., 1995), although another endonuclease which generates 5′-OH end groups has been described in thymocyte nuclear extracts (Nikonova et al., 1993). Its activation by acidification (Barry and Eastman 1993) is another interesting feature of DNase II because of the long-described occurrence of cerebral acidosis following ischemia episodes (Siesjo, 1988). Also of significance could be endonucleases induced by hypoxic or anoxic conditions, of which several have been noted (Stoler et al., 1992; Ueda et al., 1995). Whether this DNase-II-type cleavage is particular to ischemic brain, or to degenerating brain in general, remains to be seen. It again illustrates the difficulties of shoehorning all mechanisms of cell death into schemes effective in understanding apoptosis in cancer cells, and indicates that cell death needs to be studied separately in individual tissues in response to particular insults.
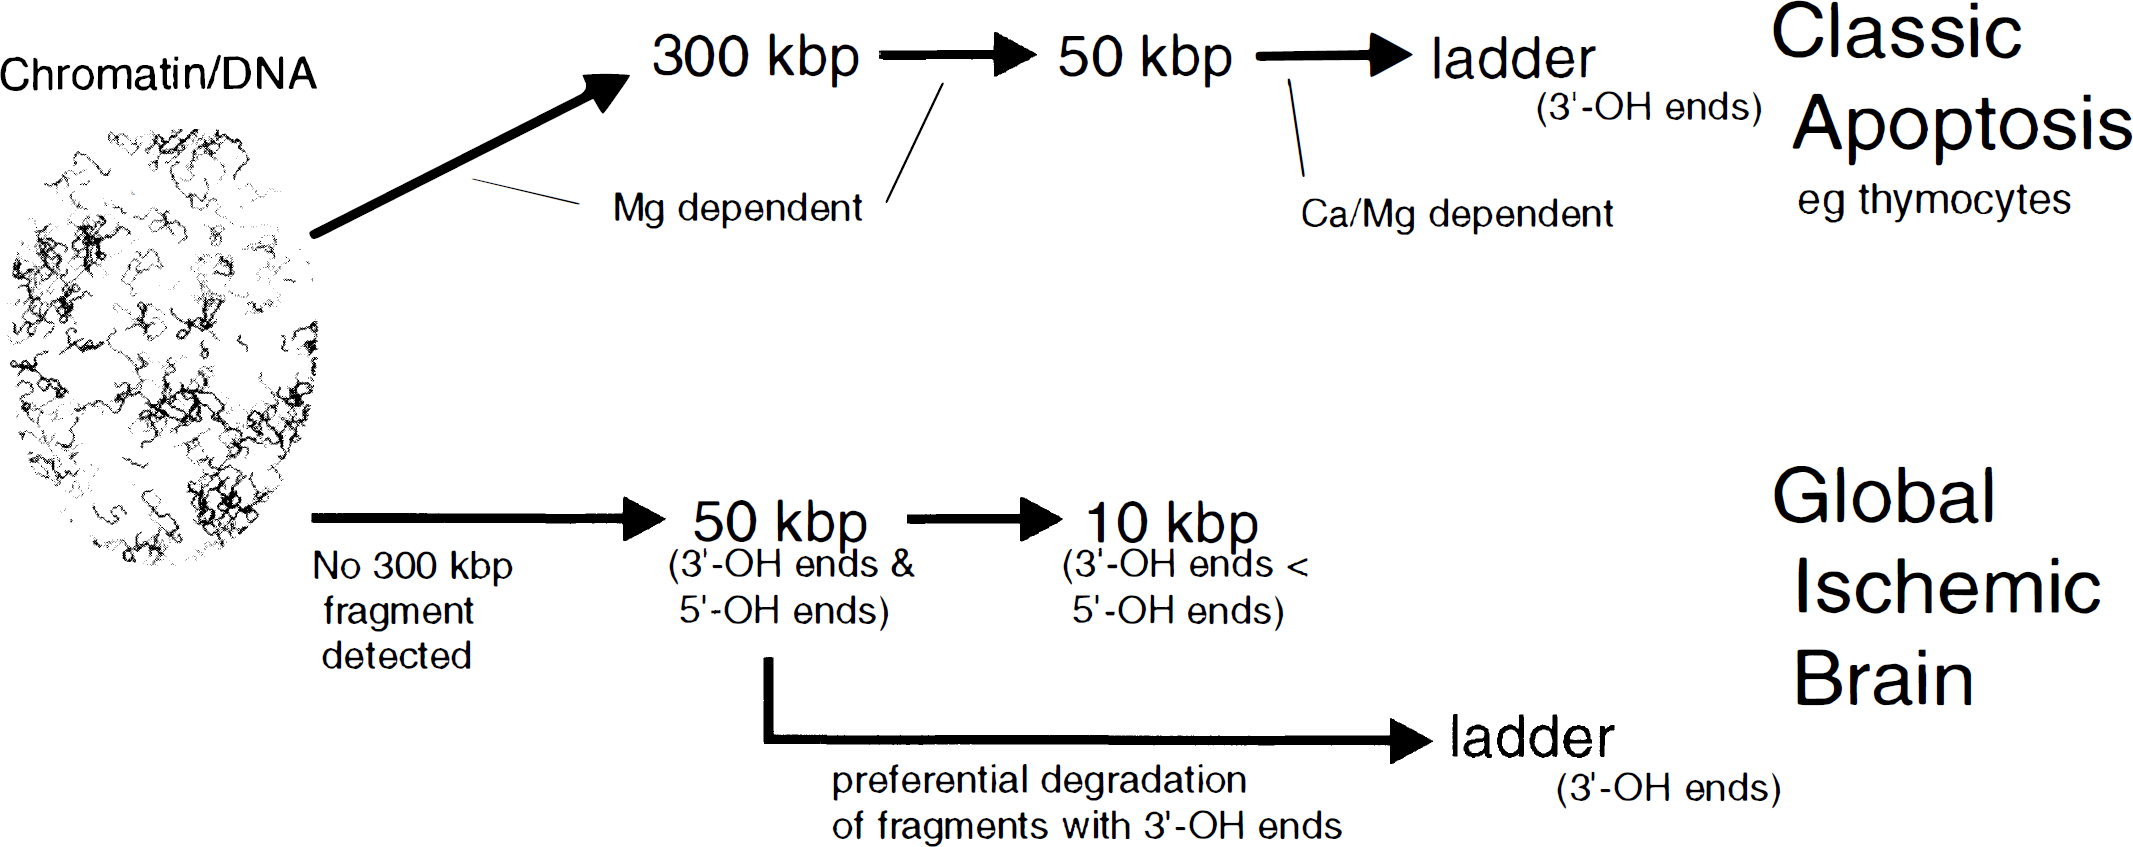
Scheme of DNA fragmentation in dying cells. DNA fragmentation in globally ischemic brain is different from classic apoptosis. In classic apoptosis exemplified by death of thymocytes induced by glucocorticoids, chromatin is considered to be cleaved into large fragments of 300 to 50 kbp and into oligonucleosomal ladders which have 3′-OH end groups. Kinetic studies indicate that these large fragments may generate the smaller fragments, but this is open to debate because of the differential staining of these fragments by ethidium bromide. Following global ischemia, large fragments in the 50- to 10-kbp range are found, and 5′-OH end groups can be detected in these DNA pieces. Since 5′-OH ends are not detected in oligonucleosomal fragments, it appears that a preferential breakdown of large fragments with 3′-OH end groups could be in effect.
Footnotes
Acknowledgments:
We thank Julie Leblanc and Roy Walker for assistance and guidance in using pulse-field gel electrophoresis. We acknowledge support from the Canada/Astra Fight Stroke Program, funded by the National Research Council of Canada and Astra Pharma. This study was also supported in part by the Heart and Stroke Foundation of Manitoba. Technical assistance was provided by S. Bascaramurty and C. Fyfe.