
Abstract
Recent investigations on transient focal cerebral ischemia suggested recovery of energy metabolism during early reperfusion, but followed by secondary energy failure. As disturbances of energy metabolism are reflected by changes of the apparent diffusion coefficient (ADC) of water, the aim of the current study was to follow the dynamics of the ADC during 1 hour of middle cerebral artery occlusion (MCAO) and 10 hours of reperfusion. The right MCA was occluded in male Wistar rats inside the magnet using a remotely controlled thread occlusion model. Diffusion-, perfusion-, and T2-weighted images were performed repetitively, and ADC, perfusion, and T2maps were calculated and normalized to the respective preischemic value. The lesion volume at each time point was defined by ADC < 80% of control. At the end of 1-hour MCAO the hemispheric lesion volume was 22.3 ± 9.0%; it decreased to 6.4 ± 5.7% in the first 2 hours of reperfusion (P < 0.01), but then increased again, and by the end of 10 hours of reperfusion reached 17.3 ± 9.3%. The mean relative ADC in the end ischemic lesion volume significantly improved within 2 hours of reperfusion (from 65.7 ± 1.2% to 90.1 ± 6.7% of control), but later declined and decreased to 75.4 ± 7.3% of control by the end of the experiment. Pixels with secondary deterioration of ADC showed a continuous increase of T2value during the first 2 hours of reperfusion in spite of ADC improvement, indicating improving cytotoxic, but generation of vasogenic edema during early reperfusion. A significant decrease of the perfusion level was not observed during 10 hours of recirculation. The authors conclude that the improvement of ADC in the early phase of reperfusion may be followed by secondary deterioration that was not caused by delayed hypoperfusion.
Keywords
Recent investigations using end-point studies on transient focal cerebral ischemia in mice and rats indicate a recovery of energy metabolism during early reperfusion, followed by secondary energy failure (Hata et al., 2000; Folbergrova et al., 1995). These data suggest that the development of the final neuronal injury after a short period of reversible focal ischemia is preceded by partial or complete transient recovery of cellular bioenergetic state. As the apparent diffusion coefficient (ADC) of water is sensitive to the energy state of the tissue (Davis et al., 1994; Roussel et al., 1995), its dynamics could be followed using diffusion-weighted imaging (DWI). A number of DWI studies have already been performed in transient cerebral ischemia, and acute reversal of ADC was shown after restoration of blood flow (Dijkhuizen et al., 1998; Kastrup et al., 1999; Li et al., 1999; Pierpaoli et al., 1996; Mintorovitch et al., 1991; van Lookeren Campagne et al., 1999; Zarow et al., 1995; Ning et al., 1999; Tuor et al., 1998), similar to the behavior of the content of high energy phosphates during this phase (Folbergrova et al., 1995; Thornton et al., 1998). However, most of these experiments were terminated or interrupted after a 2-to 5-hour reperfusion period, and data about the secondary deterioration of ADC are available from only a few studies (van Lookeren Campagne et al., 1999; Dijkhuizen et al., 1998; Tuor et al., 1998; Zarow et al., 1995; Ning et al., 1999; Li et al., 2000). To the best of the authors' knowledge, none of those studies followed the changes of MRI parameters continuously at the expected time of secondary deterioration of energy metabolism, therefore, the most critical period of secondary energy failure could not be described.
The aim of the current study was to follow the dynamics of the ADC during 1 hour of middle cerebral artery occlusion (MCAO) and during 10 hours of reperfusion. The authors examined whether the improvement of ADC after restoration of blood flow was followed by secondary deterioration in the later phase of reperfusion and compared the results with the perfusion status and the development of vasogenic edema, as reflected by a T2increase.
MATERIALS AND METHODS
Animal model
Experiments were performed in accordance with the National Institutes of Health animal protection guidelines and were approved by the governmental authorities. Five male Wistar rats (300 to 350 g) were anesthetized with 1.5% halothane in a 70%:30% mixture of N2O:O2. Rectal temperature was monitored throughout the experiment and kept to approximately 37°C using a feedback-controlled heating pad. Animals were tracheotomized, mechanically ventilated, and immobilized with pancuronium bromide (0.3 mg/kg·h). Once mechanical ventilation had begun, halothane concentration was reduced to 1.0%. Arterial and venous catheters were inserted into the femoral vessels for injection of drugs, monitoring of systemic blood pressure, and blood sampling. Blood gases were measured repeatedly and kept within physiologic limits by appropriate settings of the respirator. The animals were placed in a nonmagnetic stereotaxic headholder for accurate positioning in the magnet.
Focal ischemia was produced inside the magnet by intraluminal suture occlusion of the right middle cerebral artery using a previously described, remote controlled occluding device (Kohno et al., 1995). Briefly, a monofilament nylon thread (4–0 Prolene; Ethicon, Norderstedt, Germany), with its distal end thickened with silicone to 0.28 to 0.30 mm in diameter, was connected to an extension catheter and passed through a guide sheath fixed to the neck of the animal. The right common carotid artery was ligated and the filament was introduced into the right internal carotid artery through the proximal end of the isolated external carotid artery until the tip reached the carotid canal at the base of the skull. This arrangement permitted the manipulation of the thread position from outside the magnet to allow measurements during control and MCAO and after retraction of the thread without the need to reposition the animal. The success of the occlusion was confirmed by the drop of perfusion signal intensity in perfusion-weighted images. After 1 hour of MCAO, reperfusion was induced by retraction of the thread.
Magnetic resonance imaging
Nuclear magnetic resonance measurements were performed at 200 MHz using a Bruker Biospec system (Bruker Medical, Ettlingen, Germany) with a 4.7T magnet of 30 cm clear bore. The system was equipped with actively shielded gradient coils (maximum gradient strength: 100 mT/m; gradient rise time <250 microseconds). A 12-cm diameter Helmholz coil was used for radiofrequency transmission and a 16-mm diameter surface coil with inductive coupling was placed over the skull of the animal for signal reception. The two coils were positioned orthogonally to each other to minimize coupling. The transmitter coil used active decoupling through a pin diode switch to further reduce coupling, whereas passive decoupling by crossed diodes was used on the surface coil. Sagittal scout scans using a gradient echo magnetic resonance imaging sequence (echo time (TE) = 8.3 milliseconds, repetition time (TR) = 300 milliseconds) were performed for correct positioning of the head.
Diffusion-weighted magnetic resonance imaging was performed using a multislice Stejskal-Tanner-type spin echo sequence (Stejskal and Tanner, 1965). The sequence parameters were as follows: TE = 35.2 milliseconds, TR = 2325 milliseconds, matrix = 128 × 128. Six coronal slices with a thickness of 1.21 mm and 0.54 mm interslice gap were recorded with a field of view of 4 × 4 cm2. For the quantitative determination of the apparent diffusion coefficient, DWIs with different gradient strengths (b factor: 30, 1500 sec/mm2) were recorded.
To minimize instrumental errors in the ADC determination, extensive data postprocessing was performed (Eis and Hoehn-Berlage, 1995). Apparent diffusion coefficient was calculated pixelwise (Le Bihan et al., 1988) using the MEMRIS software package, written in Interactive Data Language (IDL; Research Systems, Boulder, CO, U.S.A.).
Single slice perfusion-weighted images through the center of the MCA territory (at the level of the caudate-putamen) were obtained with the arterial spin tagging technique (Detre et al., 1994). The perfusion-weighted imaging sequence consisted of two similar image acquisition intervals separated by a recovery time of 10 seconds, each of which comprised a magnetization preparation step of 3 seconds duration followed by snapshot FLASH imaging (TE = 3.9 milliseconds, TR = 7.4 milliseconds, field of view = 4 × 4 cm2, slice thickness = 2 mm, matrix = 128 × 64) (Kerskens et al., 1995). Eight images were averaged to improve the signal-to-noise ratio, resulting in a total scan time of 56 seconds for each perfusion-weighted image. Perfusion-weighted images were normalized to the control snapshot FLASH images without arterial spin labeling to compensate for signal loss in regions more distal to the receiver surface coil.
Six coronal slices of T2-weighted images in positions identical to those of the DWI experiment were performed using a multislice, multi-echo CPMG sequence (TE = 12.5 milliseconds, TR = 3000 milliseconds, number of echoes = 16, matrix = 128 × 128). Quantitative T2relaxation time was determined with a monoexponential fit to the signal intensities of the echo series.
Measurement protocol
An ADC multislice set, a T2-weighted multislice set, and a perfusion-weighted image at the level of the caudate-putamen were obtained before MCAO (control), at the end of 1 hour of MCAO (ischemia), and after every hour of reperfusion. During the first hour, diffusion-and perfusion-weighted images were also recorded after 30 minutes.
Image analysis
Quantitative ADC and T2maps and normalized perfusion-weighted images were transferred to a Macintosh Power PC 7200/66 (Apple, Cupertino, CA, U.S.A.). Image analysis was performed using the image processing software IMAGE (NIH, Bethesda, MD, U.S.A.). Data analysis was performed in individual voxels (0.1 mm3 for ADC and T2, and 0.4 mm3 for perfusion-weighted images).
Relative ADC, relative perfusion signal intensity, and relative T2maps were calculated pixel-wise by division of the ADC, perfusion-weighted, and quantitative T2maps during ischemia and at different time points of reperfusion by the corresponding preischemic control images. Because of this calculation, the relative values were expressed in each pixel in percent of the preischemic control value.
The ischemic area during MCAO and the lesion area during reperfusion were defined by relative ADC <80% of control, because this degree of ADC reduction correlates with the loss of ATP in the acute phase of permanent ischemia (Hoehn-Berlage et al., 1995). The hemispheric lesion volume (HLV) was calculated by dividing the lesion volume (the sum of the lesion areas for all slices multiplied by the slice-slice distance) by the volume of the ipsilateral hemisphere (the sum of the ipsilateral hemispheric areas for all slices multiplied by the slice-slice distance). No correction for edematous swelling of the ipsilateral hemisphere was attempted because midline shift, space occupying lesion, or brain swelling were not detectable in any of the investigated animals. The lesion volume was calculated at the end of the ischemic period and at different time points of reperfusion.
End-ischemic pixels with relative ADC below 80% were divided into three groups depending on the relative ADC values during the early phase of reperfusion and at the end of the experiment. The selection criteria of the pixels were as follows: (1) “recovery” group—the relative ADC reached at least 80% within the first 2 hours of reperfusion, and remained above this value at the end of the experiment; (2) “secondary deterioration” group—the relative ADC reached at least 80% within the first 2 hours of reperfusion, but decreased again below this threshold at the end of the experiment; (3) “no recovery” group—the relative ADC remained < 80% at all time points. The temporal evolution of relative ADC, relative perfusion signal intensity, and relative T2values was investigated separately in these three groups.
Statistical analysis
All data were expressed as means ± SD. Relative ADC, HLV, and relative T2values during different time points of reperfusion were compared with the end-ischemic values, using two-tailed paired t-tests. Changes in perfusion signal intensity were also analyzed with this test, but this parameter during MCAO and at different time points of reperfusion was compared with the preischemic control value.
The differences between the “recovery”, “secondary deterioration”, and “no recovery” groups were tested by repeated measures of analysis of variance. If repeated measures of analysis of variance revealed a significant difference, the Scheffépost hoc test was used to compare the values of the three groups at each time point. A difference with P < 0.05 was considered statistically significant. * P < 0.05; ** P < 0.01; *** P < 0.001.
RESULTS
All general physiologic parameters were within the normal range during all phases of the experiment (Table 1). The glucose level and the hematocrit were 5.1 ± 0.4 mmol/L and 43 ± 1% at the end of the experiment, respectively.
Physiologic parameters at different phases of the experiment
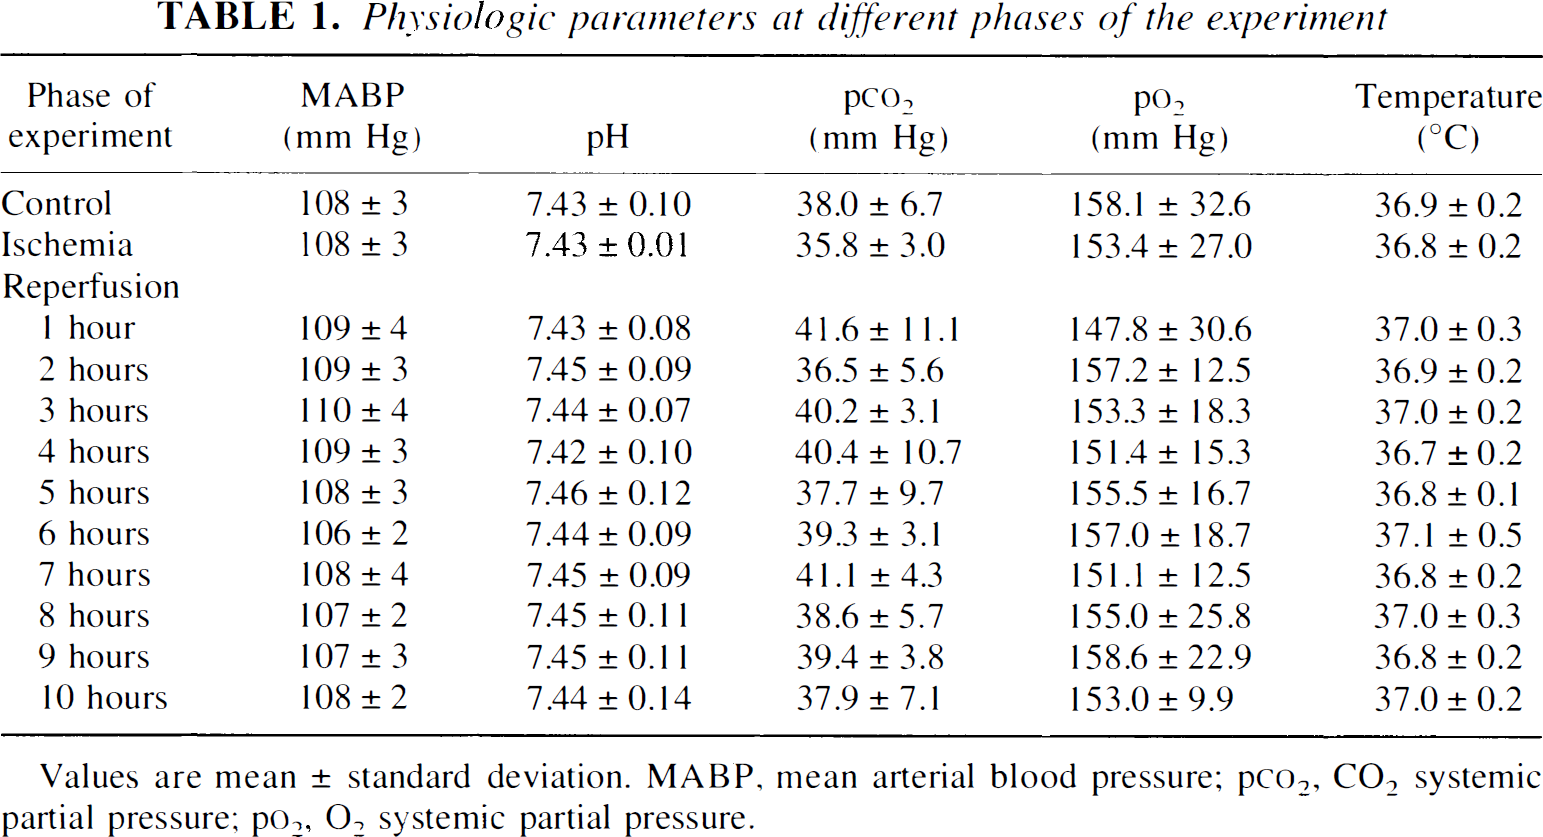
Values are mean ± standard deviation. MABP, mean arterial blood pressure; p
Figure 1 shows typical experimental data, including the ADC, T2, and perfusion-weighted maps before MCAO (control), during ischemia (MCAO), and at different time points of 10 hours of reperfusion.
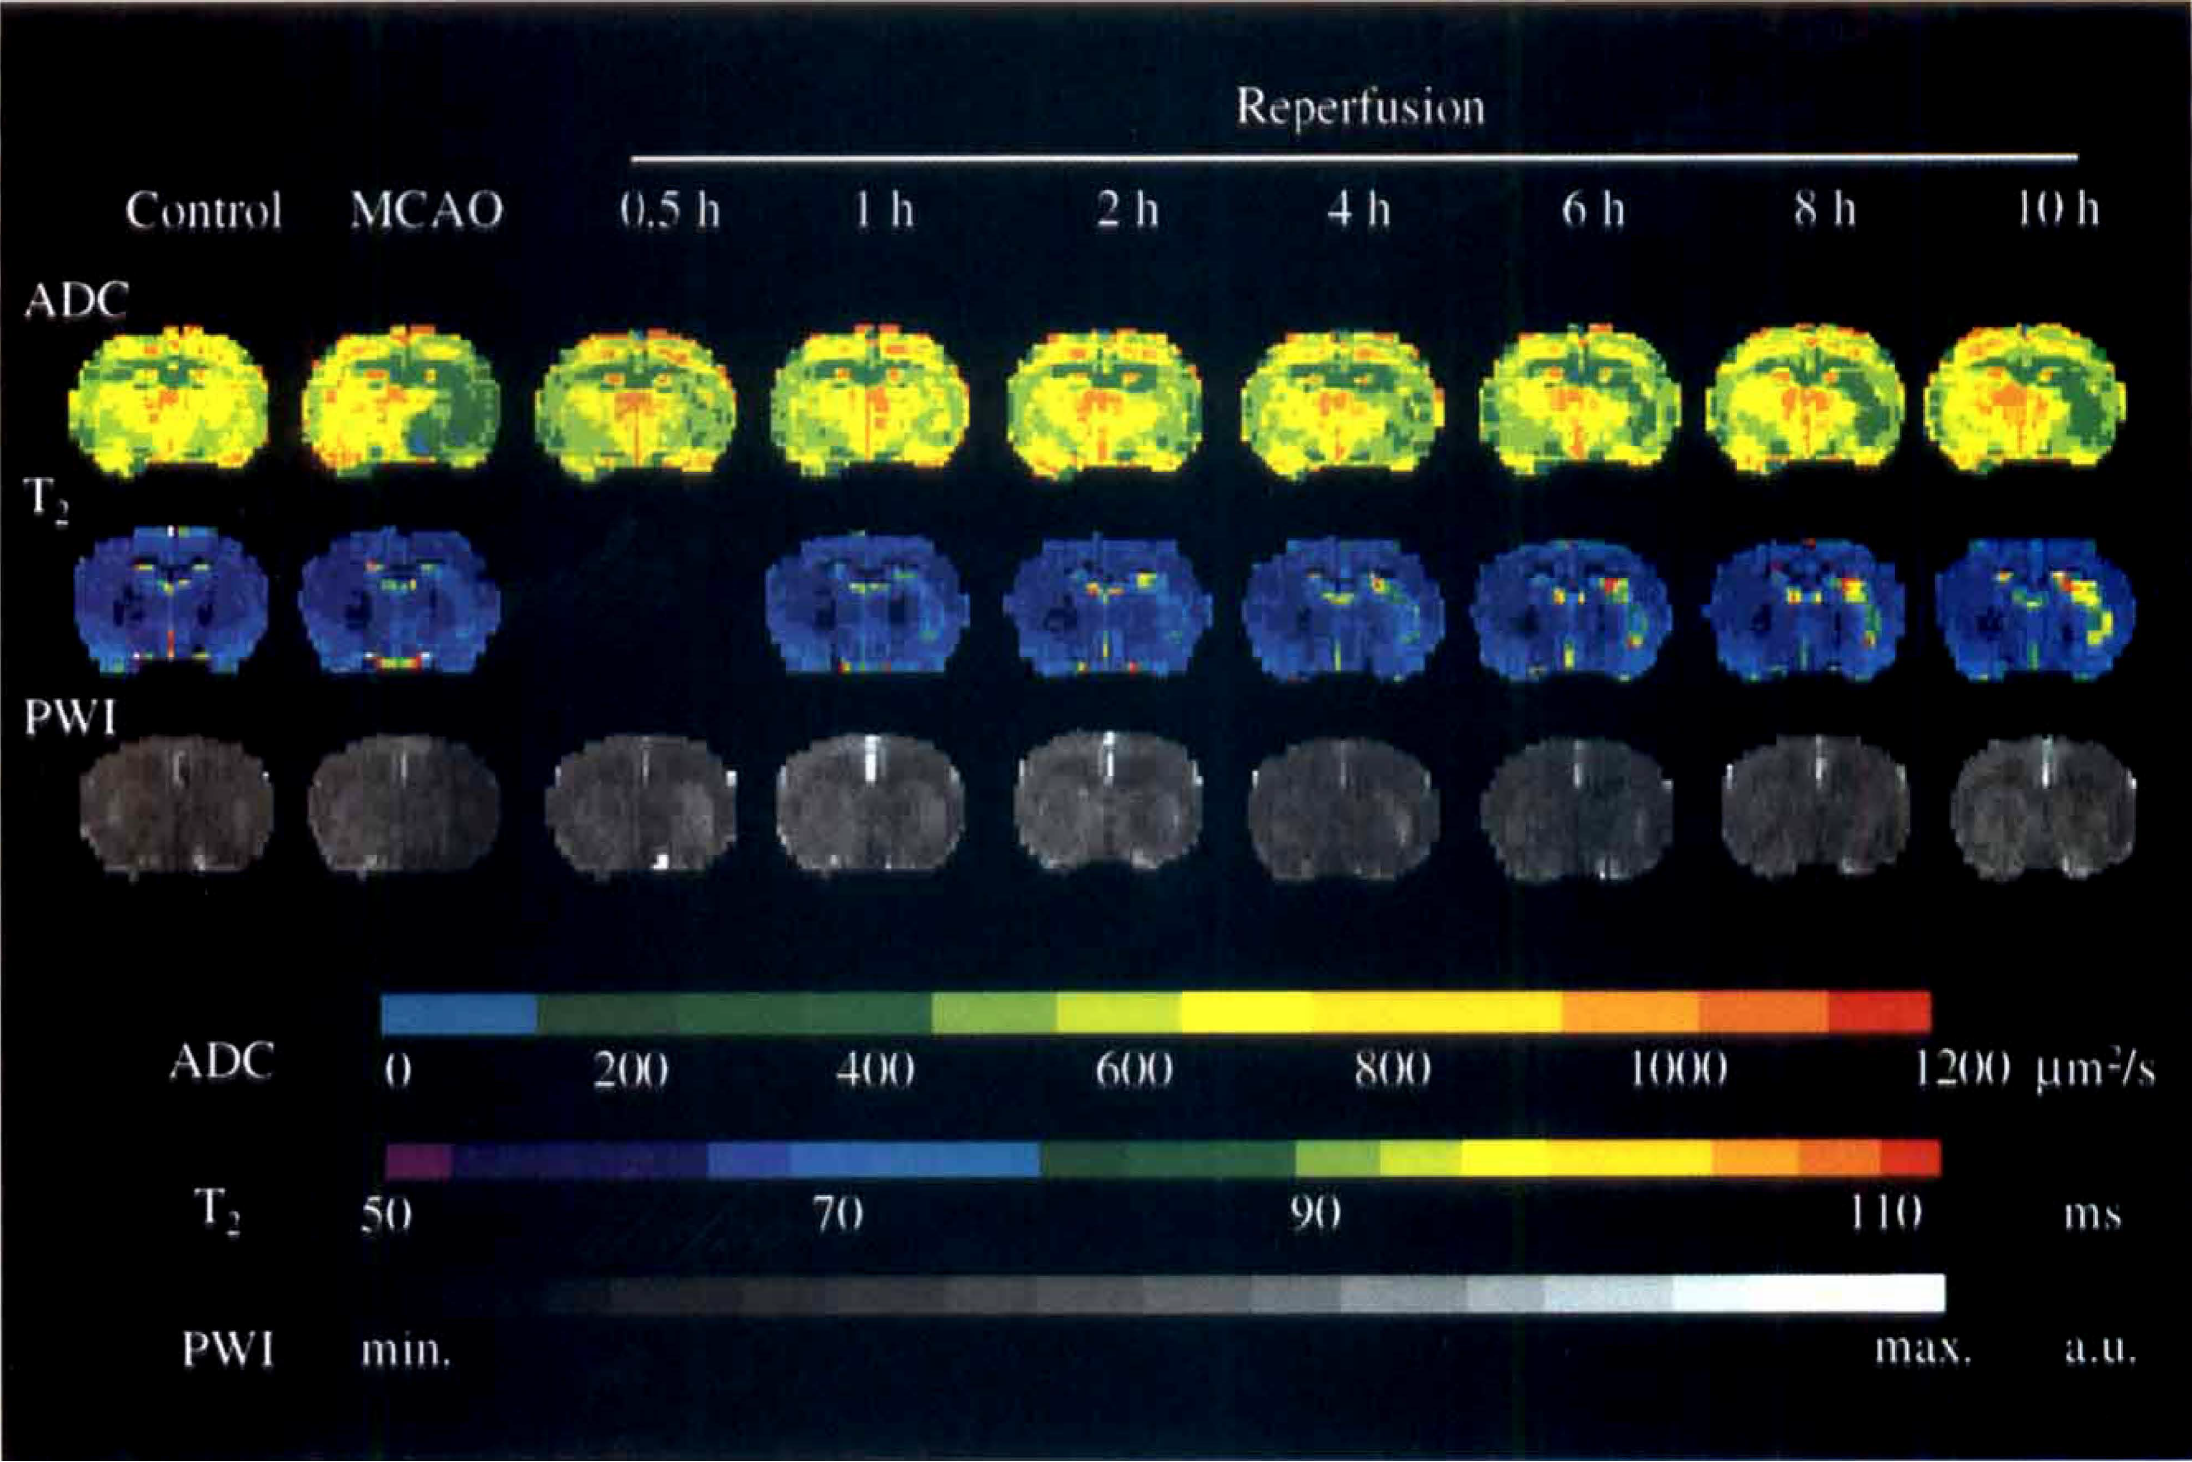
Representative time course of relative apparent diffusion coefficient (ADC), perfusion signal intensity, and relative T2maps before ischemia (control) at the end of middle cerebral artery occlusion (MCAO) and at different time points of reperfusion. Note the transient recovery of ADC at the early phase of reperfusion, followed by secondary deterioration. The increase of relative T2value was continued in the lesion area during early recirculation. Perfusion signal intensity maps did not reveal significant delayed hypoperfusion after retraction of the occluder. PWI, perfusion-weighted imaging. a.u., arbitrary units.
The end-ischemic HLV (22.3 ± 9.0%) significantly decreased in the early phase of reperfusion (7.1 ± 5.9%, 6.4 ± 5.7%, 7.9 ± 7.0% after 30 minutes, 1 hour, and 2 hours of reperfusion, respectively), but 2 hours after restoration of blood flow it increased secondarily, and by the end of 10 hours of reperfusion it had reached approximately 77% of the end-ischemic lesion volume (17.3 ± 9.3%; Fig. 2).
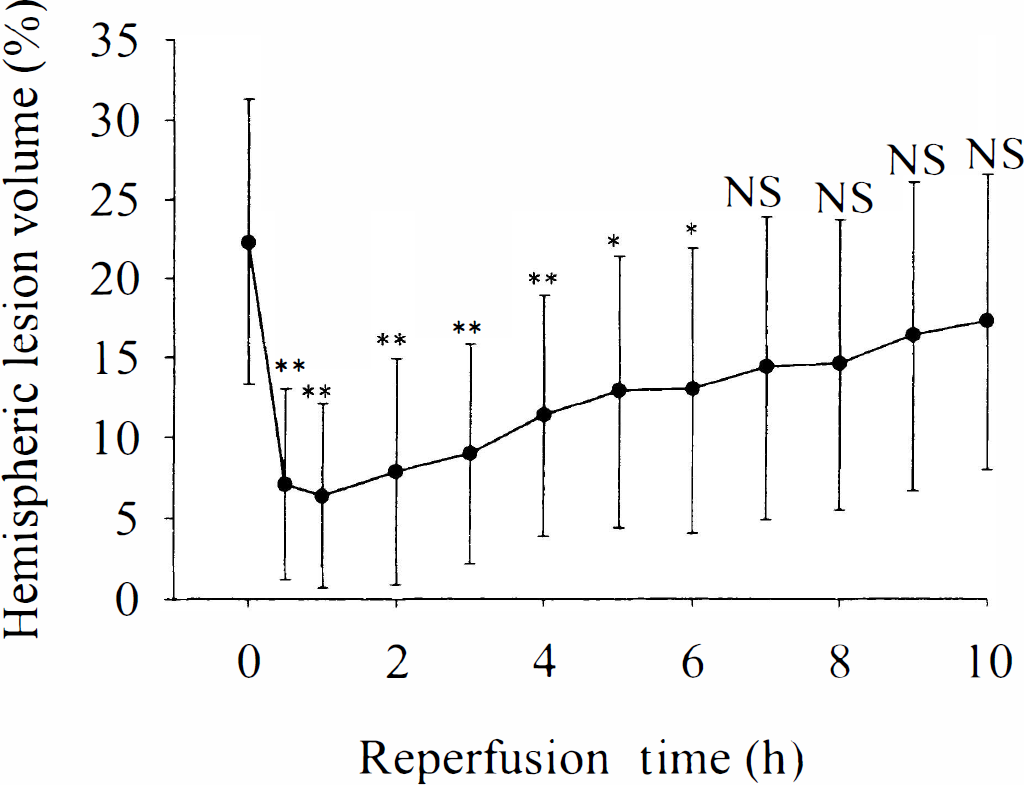
Hemispheric lesion volume (HLV) at the end of ischemia and at different time points of reperfusion. Note the decrease of HLV at the early phase of reperfusion, followed by secondary increase after 2 hours of restoration of blood flow. Note significantly lower values as compared with the ischemic period (* P < 0.05, and **P < 0.01, respectively). NS, not significant.
The mean relative ADC in the end-ischemic region (defined by relative ADC < 80% at the end of the ischemia) showed significant improvement during the first hours of reperfusion, but declined secondarily after 2 hours of restoration of blood flow (Fig. 3).
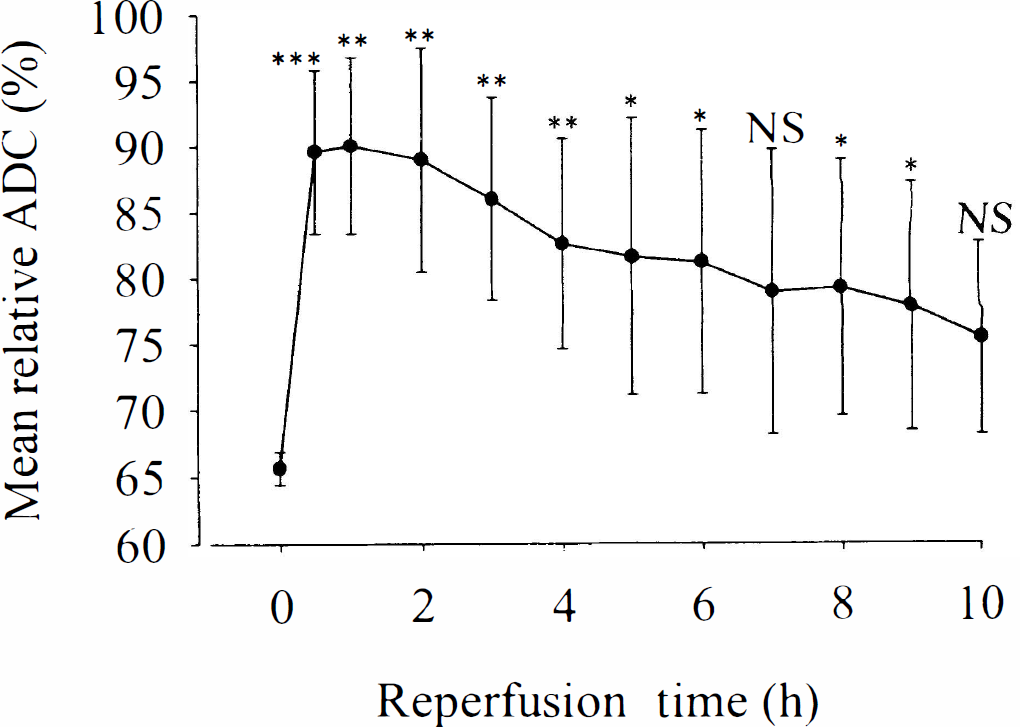
Temporal evolution of mean relative apparent diffusion coefficient (ADC) in the end-ischemic lesion volume. Note the significant improvement of ADC after recirculation, followed by secondary deterioration. Note significantly higher values as compared with the ischemic period (* P < 0.05, and ** P < 0.01, respectively). NS, not significant.
The ischemic pixels at 1-hour ischemia were divided into 3 groups, depending on the relative ADC, in the first 2 hours of reperfusion and at the end of the experiment (see Materials and Methods). The distribution of these end-ischemic pixels in the “recovery,” “secondary deterioration,” and “no recovery” groups was 32.8 ± 10.8 %, 50.9 ± 5.4%, and 16.4 ± 12.5%, respectively.
Different temporal evolution of the relative ADC can be observed in the three groups because of the definition of pixel selection (Fig. 4A). The relative end-ischemic ADC was lower (P < 0.01) in the “no recovery” group (57.4 ± 3.8% of control value) compared with the “recovery” and “secondary deterioration” groups (66.3 ± 3.4% and 64.6 ± 1.5% of control value, respectively). However, there was no significant difference between the latter two groups. These results suggested that the lower end-ischemic ADC indicates lack of ADC improvement at the early phase of reperfusion, but cannot differentiate between the “secondary deterioration” and the “recovery” groups.
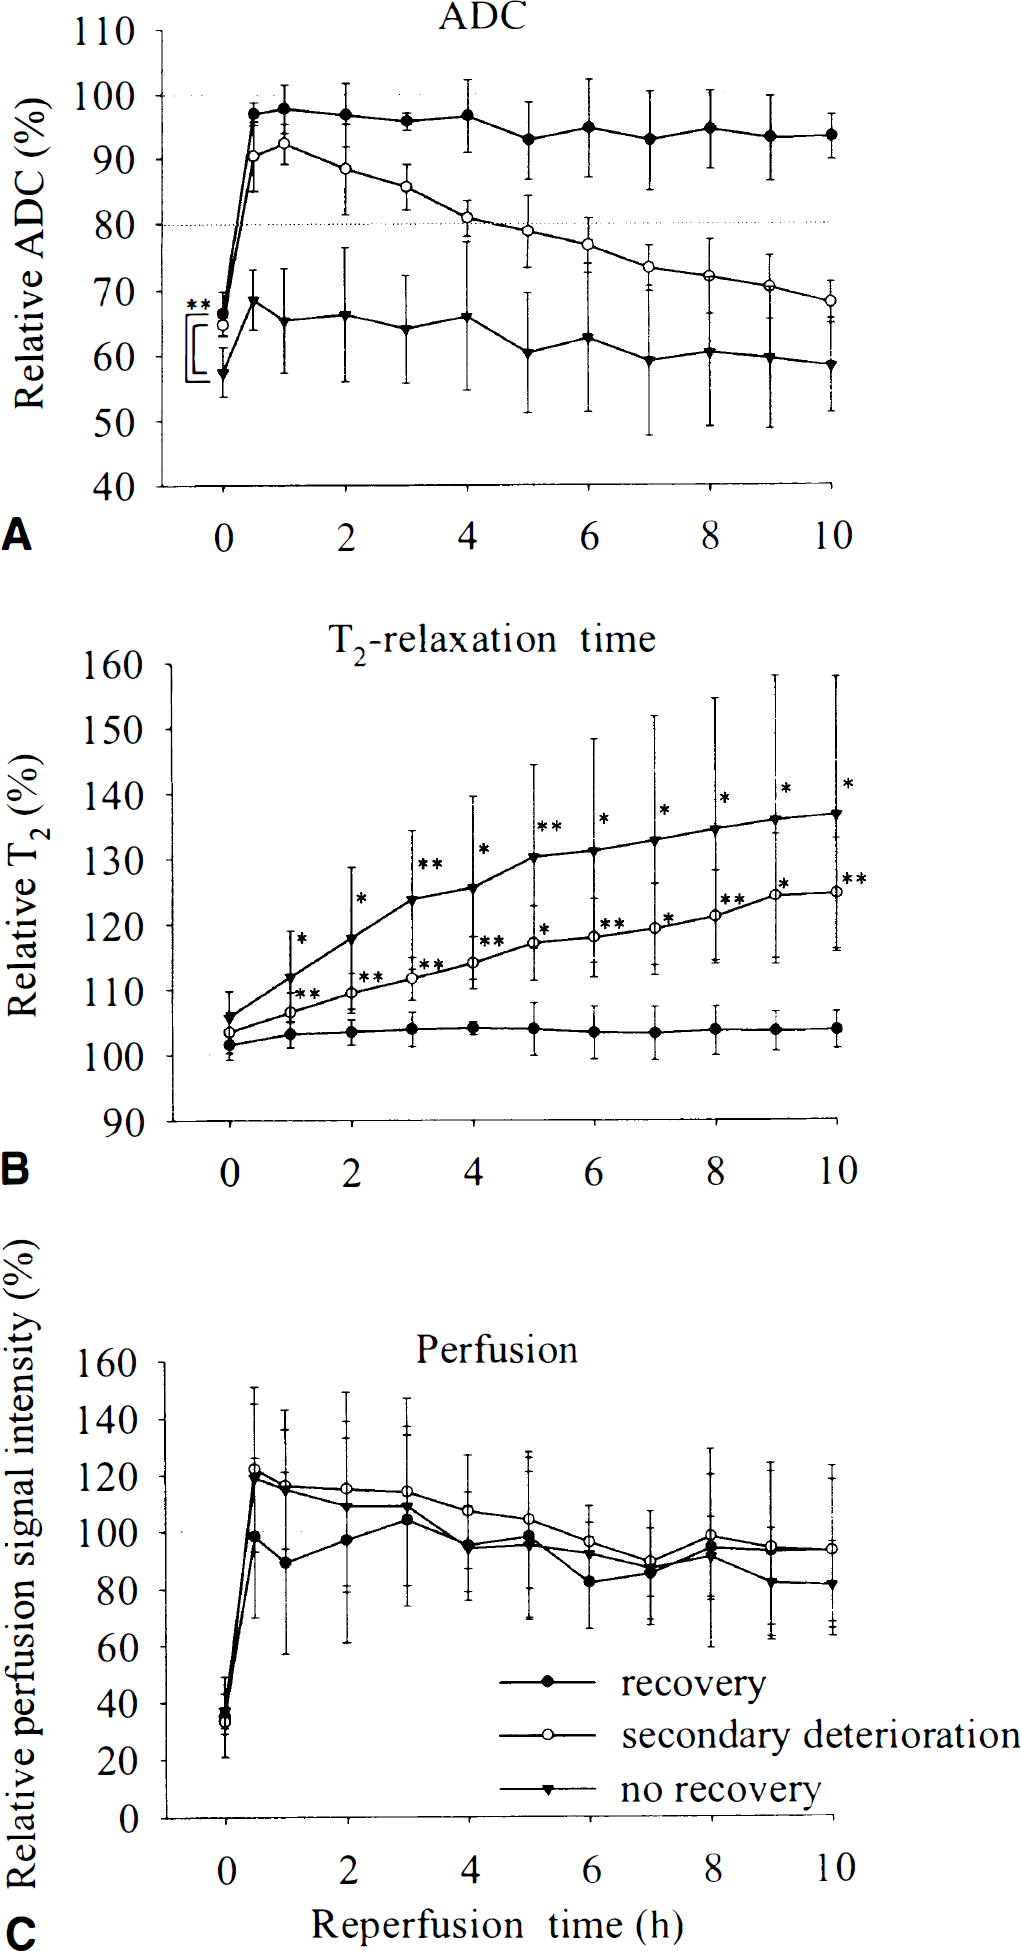
Temporal evolution of relative apparent diffusion coefficient (ADC)
A slight increase of the relative T2was observed during MCAO in all three groups (Fig. 4B). There was a tendency toward a more pronounced increase of the end-ischemic relative T2value in the “no recovery” (105.7 ± 4.0%) and “secondary deterioration” (103.4 ± 3.1%) groups compared with the recovery group (101.5 ± 2.2%), however, the Scheffé test did not reveal a significant difference between these groups. Continuous, significant increase of relative T2was found during reperfusion compared with the ischemic period not only in the “no recovery” group but also in the “secondary deterioration” group. However, no further increase was observed in the “recovery” group. The main difference between the behavior of relative ADC and T2can be seen in the “secondary deterioration” group in the first hours after restoration of blood flow. Although the relative ADC transiently improved in this group at the early phase of recirculation, the relative T2increased continuously during this period.
No significant difference in the perfusion signal intensity was detected between the three groups (Fig. 4C). Slight, but not significant, hyperperfusion was observed in the “secondary deterioration” and in the “no recovery” groups in the early phase of reperfusion compared with the preischemic control value. Although the perfusion level decreased below the control value in the later phase of reperfusion, the paired t-test did not reveal a significant hypoperfusion compared with the preischemic value.
DISCUSSION
This study shows direct evidence of secondary deterioration of ADC and secondary increase of HLV during 10 hours of reperfusion in a reversible MCAO model with continuous monitoring of physiologic and MRI parameters of the animals. As the physiologic variables of the animals were monitored and kept within normal range during the whole observation time, detrimental effects of hypotension, hypo-or hyperthermia, hypoxia, and hypercapnia during reperfusion can safely be excluded. The new, and previously not appreciated, fact is the ongoing increase of the T2relaxation time during the early reperfusion phase that precedes the secondary deterioration of ADC. Furthermore, the current data suggest that the secondary decline of ADC was not caused by delayed hypoperfusion.
Certainly, the authors were aware that the recovery process cannot be simply determined by a sharp cut-off value of the relative ADC, but earlier studies (Hoehn-Berlage et al., 1995) have shown that thresholding with 80% relative ADC value results in a good estimation for breakdown of energy metabolism in the acute phase of ischemia. This was the reason for using this value to select the pixels into one of the “recovery,” “secondary deterioration,” or “no recovery” groups and to estimate the HLV during ischemia and reperfusion.
Time window for onset of secondary deterioration
The acute reversal of lesion volume and ADC after restoration of blood flow was presented in earlier studies, but few reports are known that also show delayed injury after recovery of ADC. Using a unilateral cerebral hypoxia–ischemia model, recovery of ADC was published during the early phase of reperfusion in some regions of rat brain, but 24 to 72 hours later ADC reduction was found in the initially recovered areas (Dijkhuizen et al., 1998; Tuor et al., 1998; Zarow et al., 1995; Ning et al., 1999). Other studies showed delayed histologic damage after 8 to 30 minutes reversible MCAO (Li et al., 1999) or reported secondary reduction in the ADC after 30 to 45 minutes transient focal cerebral ischemia (van Lookeren Campagne et al., 1999; Li et al., 2000), even if these regions showed acute reversal of ADC during the early reperfusion phase. The current findings confirmed the significant improvement of ADC in the first 2 hours of recirculation in more than 80% of the ischemic lesion, and showed that after 1-hour transient ischemia the secondary deterioration of ADC starts as soon as 2 to 3 hours after restoration of blood flow. The beginning of the secondary decline of ADC was also estimated by van Lookeren Campagne et al. (1999), but they observed it 6 hours after reperfusion. The difference between these previous results and the current results might be because of the different durations of the ischemia, but more likely because of the different models used. While van Lookeran Campagne et al. (1999) ligated the distal branch of the MCA and occluded both common carotid arteries during ischemia, thus producing a cortical lesion, the current study used the intraluminal suture occlusion model occluding the origin of MCA, thus causing ischemia mainly in the caudate-putamen. The different behavior of the cortex and the caudate-putamen during ischemia and reperfusion is well known, and several studies suggest that the caudate-putamen is more vulnerable compared with the cortex (Garcia et al., 1995, 1997; Li et al., 1999). Although the different regions were not evaluated separately in the current study, the secondary deterioration of ADC always began in the caudate-putamen and did not appear in the cortex during the 10 hours of reperfusion. This then means that the pixels in the cortex belonged to the recovery group, whereas most pixels in the striatum showed lack of recovery or secondary deterioration of ADC.
Prediction of lack of ADC normalization after reperfusion by end-ischemic ADC
The current data indicate that the lower end-ischemic ADC predicts lower chance of recovery after restoration of blood flow, but can not differentiate between the “secondary deterioration” and the “recovery” groups. This observation is in good agreement with the results of Hasegawa et al. (1994), who found recovery of ADC at the early phase of reperfusion only in those regions, which had no severe ADC reduction during ischemia. The relatively large proportion of the pixels with “secondary deterioration” (>50% of the end-ischemic lesion volume) in the current study supports the observation of Dijkhuizen et al. (1998) and Li et al. (1999). They concluded that the acute normalization of ADC after restoration of blood flow cannot predict tissue recovery because secondary damage developed at the later phase of reperfusion. In contrast, Minematsu et al. (1992) claim that after 1-hour MCAO, the lesion size measured by DWI at the early phase of reperfusion accurately predicted the infarct size determined by TTC staining 24 hours later. Kastrup et al. (1999) did not observe secondary deterioration of the lesion volume measured by DWI, although they stopped the experiment after 5 hours of reperfusion. The inconsistency of the results between the different reports could result from the different animal strains (Sprague-Dawley or Wistar rats), methods (conventional and remote MCAO; different diameter of the threads), and durations of the MCAO or reperfusion time. Certainly, after longer periods of severe ischemia the development of the primary irreversible damage already during MCAO is likely when reversal of ADC after reperfusion cannot be expected any longer. This hypothesis is supported by the results of Li et al. (1999), who report earlier recovery of ADC in case of short duration of MCAO and no recovery after longer periods of ischemia. These data suggest that if the duration of the ischemia does not exceed the survival time of brain, partial or complete recovery of ADC occurs after restoration of blood flow. However, this process is followed by secondary deterioration in part of the primarily recovered region, indicating secondary energy failure.
Prediction of secondary deterioration of ADC by early T2increase after reperfusion
As the authors have shown, the low ADC value at the end of the ischemia could predict the lack of recovery after reperfusion, but there was no significant difference in ADC between the “secondary deterioration” and “recovery” groups either at the end of the ischemia or during early reperfusion. However, the quantitative T2maps seemed to be helpful to differentiate these regions soon after recirculation, as the T2value significantly increased after restoration of blood flow in the “secondary deterioration” group, but not in the “recovery” group.
Although the T2-weighted MRI investigations are generally regarded as being less useful in the early stage of ischemia and reperfusion, some authors reported early changes on T2-weighted images in immature rat brains using ischemia–hypoxia models (Tuor et al., 1998; Ning et al., 1999), but also in adult rat brains after MCAO (Mintorovitch et al., 1991; Knight et al., 1994). Indeed, the ischemic lesion was not well delineated in the present study after 1-hour ischemia, but the quantitative T2maps showed slightly increased T2values already at this early time point, which increased significantly after reperfusion (Figs. 1 and 4B). Using an ischemia–hypoxia model, Ning et al. (1999) and Tuor et al. (1998) reported transient recovery of T2values in immature brains after reperfusion, parallel to the transient recovery of ADC. In contrast, the authors observed a continuous and significant increase of T2values in the “secondary deterioration” group soon after recirculation, in spite of the transient improvement of ADC. The elevated T2value indicates an increase of total water content of the tissue, but the simultaneous increase of ADC suggests improving cytotoxic edema. This means that the increased water content cannot account for cell swelling, but must be explained by the increased tissue osmolality or the abrupt return of a transmural hydrostatic pressure gradient during the early phase of reperfusion, even with intact blood brain–barrier (Kogure et al., 1981; Betz et al., 1989), and by generation of vasogenic edema a few hours later. It is commonly accepted that although the restoration of blood flow could improve the energy level of the tissue, it can also cause production of free radicals. The interactions between endothelial cells and inflammatory cells, such as polymorphonuclear leukocytes and macrophages, are believed to be potent extracellular sources of reactive oxygen species during reperfusion (Hallenbeck, 1996; Faraci and Heistad, 1998), which can lead to vascular injury. In agreement with the current results, Kristian et al. (1998) also reported an increase in total water content of the brain tissue already in the first 2 hours of reperfusion, when improvement of the energy state is expected. Although other authors have also shown an early increase of the water content of the brain tissue after reversible ischemia (Mellergard et al., 1989), an alternative explanation for the early T2increase could be a shift in bound-to-free water equilibrium, as the free water fraction has the longest T2value.
Mechanisms of secondary deterioration of ADC and secondary energy failure
The cause of the presently decribed secondary deterioration of ADC and the previously reported secondary energy failure (Hata et al., 2000; Folbergrova et al., 1995) is presently unclear. One of the most likely processes that could explain these phenomena is the mitochondrial dysfunction. After 2 hours MCAO, partial recovery of the cellular bioenergetic state and of mitochondrial respiratory function was reported in the first 2 hours of reperfusion, followed by secondary deterioration (Folbergrova et al., 1995; Kuroda et al., 1996; Canevari et al., 1997). These changes show a close temporal relation with the observed ADC change in the current study. The inhibition of cerebral protein synthesis for extended periods after reperfusion (Cooper et al., 1977; Abe et al., 1988; Hata et al., 2000) also may play an important role in delayed neuronal cell death in transient focal ischemia because it bereaves the cells of molecules required for survival. Although a potential role for apoptosis cannot be excluded (Charriaut-Marlangue et al., 1995; Li et al., 1995), the observed secondary deterioration of ADC in the current study did not support this hypothesis as a major mechanism becuase the ADC decline indicated cell swelling and not loss of cell volume, which is a fundamental and universal characteristic of programmed cell death (Bortner and Cidlowski, 1998). Besides, apoptosis generally reflects only disseminated shrunken cells, thus a macroscopically observable ADC change cannot be expected. Postischemic secondary hypoperfusion could be another factor for delayed neuronal cell death (Levy et al., 1979). However, the current data suggest that the secondary deterioration of ADC was not because of delayed hypoperfusion because secondary decline of ADC already begins when the perfusion level is greater than the preischemic value. Although the perfusion signal intensity later decreased to less than the preischemic value, this change was not significant. The current data are in accordance with the results of other authors who also failed to show delayed hypoperfusion over 24 hours of reperfusion as a cause of the secondary deterioration of ADC (Li et al., 1998, 2000; van Lookeren Campagne et al., 1999). However, it should be taken into consideration that oxygen requirement and consumption, because of mitochondrial disturbance or dysfunction, might be increased during the reperfusion phase. If blood flow is not coupled to such an increased oxygen metabolism, relative hypoxia might occur in spite of normal perfusion level. This has in fact been observed after global cerebrocirculatory arrest in critical condition (Nemoto et al., 1981) because of secondary decompensation of oxidative metabolism (Behar et al., 1989).
Most drugs with reported beneficial effect on the outcome of transient focal cerebral ischemia were administered within 3 hours after the start of recirculation (Folbergrova et al., 1995; Matsumoto et al., 1999), showing that there is a therapeutical window not only during ischemia, but also after reperfusion. The current data have shown that the secondary decline of ADC, which eventually will lead to secondary energy failure, begins also after 2 to 3 hours after restoration of blood flow. Supposing that the secondary decline of ADC indicates already development of irreversible damage, the 3 hours therapeutical window after recirculation is understandable. If the discussed secondary energy failure also exists in thrombolysis-induced recirculation, and if it could be prevented, the efficacy of the thrombolytic therapy would be improved substantially. However, the exact mechanisms responsible for the secondary deterioration of ADC and secondary energy failure remain unclear, and further studies are needed to investigate which of the several hypotheses are responsible for these phenomena, and whether the discussed secondary deterioration is triggered by ischemic mechanisms already during MCAO or are induced only after reperfusion.
Footnotes
Acknowledgements
The authors gratefully acknowledge the technical assistance of Mrs. U. Uhlenküken during the nuclear magnetic resonance measurements.