
Abstract
We previously demonstrated that in the DEFUSE 3 trial, the union of the baseline core and the 24-h Tmax > 6 s perfusion lesion predicts the infarct volume at 24 h. Presently, we assessed if collateral robustness measured by the hypoperfusion intensity ratio (HIR) and cerebral blood volume (CBV) index accounts for the variance in these predictions. DEFUSE 3 patients underwent MRI/CT perfusion imaging at baseline and 24 h post-randomization. We compared baseline and follow-up HIR and CBV index across subgroups stratified by differences between predicted and observed 24-h infarct volumes. Of 123 eligible patients, 34 with 24-h infarcts larger than predicted had less favorable collaterals at baseline (HIR 0.43 vs. 0.32, p = 0.006; CBV Index 0.78 vs. 0.85, p = 0.001) and 24 h (HIR 0.56 vs. 0.07, p = 0.004; CBV Index 0.47 vs. 0.73, p = 0.006) compared to 71 patients with more accurate infarct volume prediction. Eighteen patients with 24-h infarcts smaller than predicted had similar baseline collateral scores but more favorable 24-h CBV indices (0.81 vs. 0.73, p = 0.040). Overall, patients with 24-h infarcts larger than predicted had evidence of less favorable baseline collaterals that fail within 24 h, while patients with 24-h infarcts smaller than predicted typically had favorable collaterals that persisted for 24 h.
Keywords
Introduction
Accurate prediction of the final infarct volume after an ischemic stroke guides prognostic and treatment decisions. We previously demonstrated that imaging measures obtained from CT or MR scans obtained at baseline correlated with the size of the infarct 24 h after randomization in DEFUSE 3 (Endovascular Therapy Following Imaging Evaluation for Ischemic Stroke). 1 In particular, the infarct volume 24 h after randomization was predicted by the size of the estimated ischemic core in patients who achieved >90% reperfusion. Furthermore, the volume of critically hypoperfused tissue at baseline, as measured by a time to maximum of the residue function of more than 6 seconds (Tmax > 6 s), predicted infarct volume at 24 h in patients who achieved <10% reperfusion. For all patients, the union of the baseline core and Tmax > 6 s lesion obtained 24 h after randomization predicted the infarct volume. 1 The union, defined mathematically as the sum of the two components minus the intersection, was determined by coregistration of these two parameters.
Our results demonstrated that the median absolute difference between the predicted and observed infarct volume at 24 h after randomization was ∼21 ml, which is not as accurate as earlier window studies including DEFUSE 22 and SWIFT PRIME (Solitaire with the Intention for Thrombectomy as Primary Endovascular Treatment) 3 ; these trials observed differences of 15 ml and 13 ml, respectively. These observations suggest that the infarct volume 24 h after randomization in patients treated in the extended time window may be influenced by additional factors, such as the status of the collateral circulation or delayed progression of the infarct beyond 24 h. For example, it is possible that cases with smaller infarcts than predicted at 24 h continued to evolve after the follow-up imaging was performed. DEFUSE 3 patients typically had good collateral flow through the Circle of Willis as well as the leptomeningeal vessels that may have prevented the infarct from growing to the predicted size during the initial 24 h. 4 Conversely, patients with infarcts that were larger than predicted at 24 h after randomization may have suffered early collateral failure.
CT angiography-based methods for assessing collateral status such as CTA collateral scores, Tan 5 and Maas scores, 6 have been previously shown to predict infarct volume and growth. 4 , 7 , 8 These methods are primarily qualitative and require a neuroradiologist to manually evaluate images.
The primary purpose of this study was to investigate potential explanations for cases with inaccurate predictions, with particular interest in two integrative perfusion metrics that both reflect more sophisticated facets of collateral status than captured by the Tmax > 6 s volume alone: the hypoperfusion intensity ratio (HIR) and the cerebral blood volume index (CBV Index). HIR is defined as the volume ratio of the Tmax > 10-s lesion/Tmax > 6 s lesion, and a lower HIR value is therefore reflective of more robust blood flow and favorable collaterals. The CBV index is defined as the relative cerebral blood volume in the Tmax > 6 s region, and a higher CBV index reflects improved blood flow and favorable collaterals. 9 , 10 The combination of HIR and CBV has been reported to provide a more accurate reflection of CTA collaterals than either parameter alone. 11
We categorized patients into three groups: those whose observed infarct volume 24 h after randomization was more than 25 ml larger than predicted, those whose observed infarct was within 25 ml of the prediction, and those whose observed infarct was more than 25 ml smaller than predicted. We then compared HIR and CBV index obtained at baseline and 24 h after randomization across these groups, as well as the change in HIR and CBV index between these time points. Our secondary objective was to explore other possible explanations for differences in accuracy by investigating baseline imaging features such as ischemic core and Tmax > 6 s lesion size, as well as demographics, comorbidities and process measures. Finally, we compared functional and imaging outcomes including infarct growth, favorable modified Rankin score (mRS), and mortality to determine if the accuracy of infarct size prediction was associated with any differences in outcomes.
Methods
DEFUSE 3 randomized patients with a middle cerebral artery or internal carotid artery occlusion to medical plus endovascular therapy versus medical therapy alone 6–16 h after patients were last known to be well. The study demonstrated significant efficacy of endovascular therapy. 12 The design and methods of DEFUSE 3 have been published 13 and de-identified data and materials are publicly available (ClinicalTrials.gov, Identifier: NCT02586415). Patient selection for the study’s 182 patients from 38 centers in the U.S. was based on a <70 ml baseline core, ≥ 15 ml penumbra, and ≥ 1.8 ratio of ischemic tissue to baseline infarct volume. The study was approved by local institutional review boards (IRBs) as well as the StrokeNet central IRB. All patients provided written informed consent and procedures abided by institutional and ethical standards of the StrokeNet central IRB.
Patients underwent MR or CT neuroimaging studies with perfusion at baseline and 24 h after randomization. All imaging analyses were performed by the DEFUSE 3 core laboratory. RAPID version 4.7 (iSchemaView) was used to process images and calculate the volume of the baseline core lesion, defined as tissue with an apparent diffusion coefficient <620 ×10−6 mm2/s on MR14 or cerebral blood flow <30% on CT, 12 and Tmax > 6 s lesion, the optimal delay to estimate penumbra volume. 15 For patients with prior stroke, the region of old infarct was excluded during segmentation. HIR was calculated as the ratio of the volume of the Tmax > 10-s lesion to the volume of the Tmax > 6 s lesion, and the CBV index was calculated as the ratio of mean CBV within Tmax > 6 s lesion in the ipsilateral hemisphere over the mean CBV of the unaffected brain area. Change in HIR and CBV index was defined as the difference between the 24-h post-randomization measure and the baseline measure.
The volume of the infarct at 24 h after randomization was determined by manual outlines drawn by a neuroradiologist on DWI or CT obtained at 24 h post-randomization. The neuroimaging studies at baseline and 24 h post-randomization for each case were manually reviewed and cases with technically inadequate imaging, artifacts, or unavailable imaging were excluded.
The accuracy of the predicted 24-h post-randomization infarct volume was calculated as the difference between the predicted infarct and the observed infarct at 24 h, with predictions determined by the percent reperfusion achieved for each patient based on our previous work. 1 For >90% reperfusers, the baseline core volume was used for the prediction, for <10% reperfusers, the baseline Tmax > 6 s lesion volume was used, and for 10–90% reperfusers, the union of baseline core and the volume of the Tmax > 6 s lesion at 24 h after randomization were used. We then stratified patients into three groups based on the difference between predicted and observed 24-h infarct volume. These groups were patients for whom the observed 24-h infarct volume was more than 25 ml smaller than predicted, patients for whom the observed infarct was within 25 ml of predicted, and patients for whom the observed infarct was more than 25 ml greater than predicted. This threshold of 25 ml was selected based on previous studies that reported the accuracy of follow-up infarct predictions.1–3
Additional characteristics, including demographics, comorbidities, process measures and outcomes were evaluated. Outcomes of interest included modified Rankin Score (mRS) at 90 days, mortality, incidence of intracerebral hemorrhage (ICH), incidence of early neurologic deterioration, and infarct growth between baseline and 24 h post randomization.
Statistical analysis was performed in R (https://cran.r-project.org/). We used the Kruskal–Wallis test for non-parametric data to identify overall differences in continuous variables across the three estimation groups, as well as the Mann–Whitney U test for comparisons between the correctly estimated group and each of the other two estimation groups. We applied Chi-squared and Fisher’s exact tests to identify group differences in proportions for categorical variables. Two-sided p-values <0.05 were considered statistically significant.
Results
In DEFUSE 3, 182 patients were randomized to medical therapy or endovascular and medical therapy. Fifty-nine patients with technically inadequate imaging 24 h after randomization or parenchymal hematomas were excluded from our study. The remaining 123 patients were stratified into the following groups: patients with 24-h infarcts smaller than predicted by more than 25 ml (n = 18), patients with 24-h infarcts within 25 ml of the prediction (n = 71), and patients with 24-h infarcts larger than predicted by more than 25 ml (n = 34). Baseline HIR and CBV index were available for all patients in our study, while 24-h HIR and CBV index were available for 17 patients with 24-h infarcts smaller than predicted, 38 patients with 24-h infarcts within 25 ml of predicted, and 18 patients with 24-h infarcts larger than predicted. Table 1 compares the characteristics and process measures across these groups.
Characteristics and process measures.
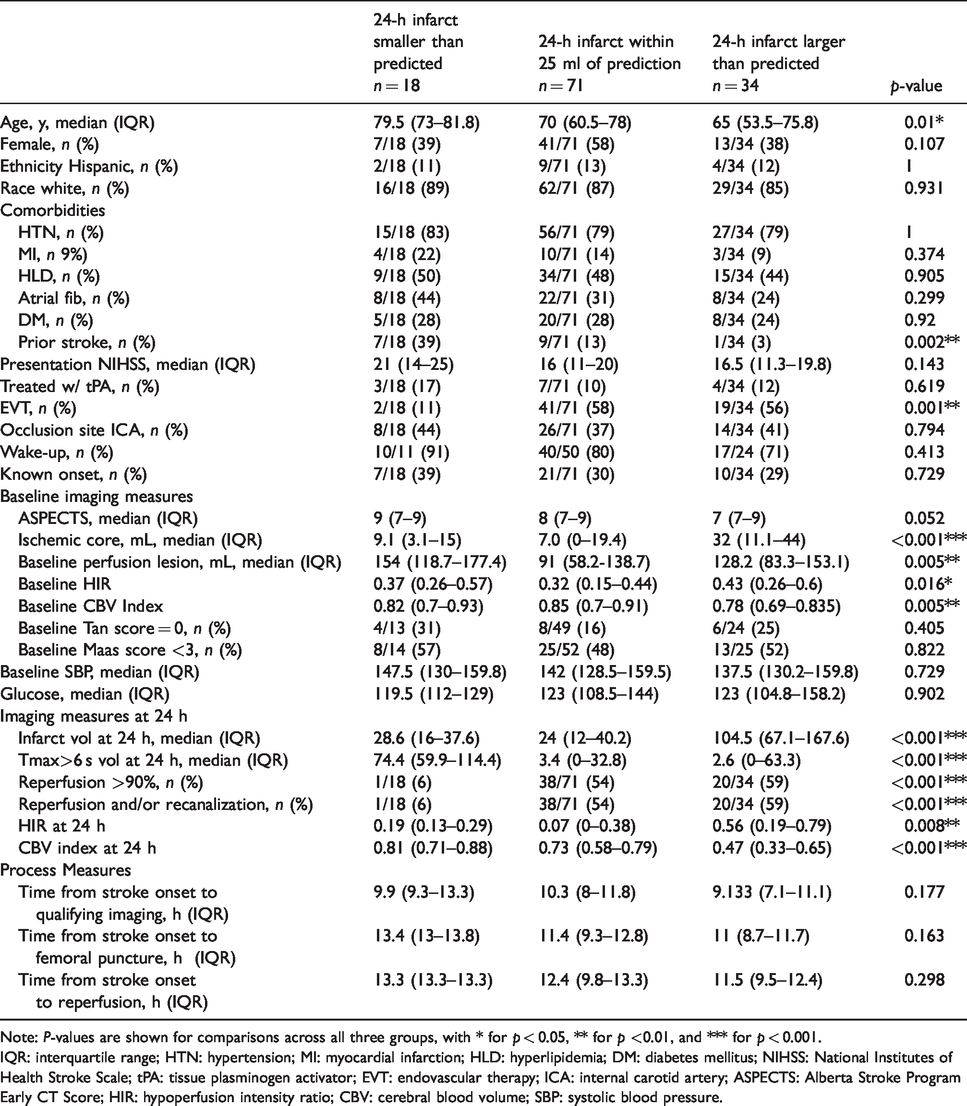
Note: P-values are shown for comparisons across all three groups, with * for p < 0.05, ** for p <0.01, and *** for p < 0.001.
IQR: interquartile range; HTN: hypertension; MI: myocardial infarction; HLD: hyperlipidemia; DM: diabetes mellitus; NIHSS: National Institutes of Health Stroke Scale; tPA: tissue plasminogen activator; EVT: endovascular therapy; ICA: internal carotid artery; ASPECTS: Alberta Stroke Program Early CT Score; HIR: hypoperfusion intensity ratio; CBV: cerebral blood volume; SBP: systolic blood pressure.
Baseline characteristics
Patients in whom the 24-h post-randomization infarct was smaller than predicted were older (79.5 vs. 70 years, p = 0.031), more likely to have had a prior stroke (39 vs. 13%, p = 0.016), less likely to have received endovascular therapy (11 vs. 58%, p = 0.001), and less likely to completely reperfuse (6 vs. 54%, p < 0.001) compared to patients with 24-h infarcts within 25 ml of the prediction. They were also more likely to have larger penumbral volumes (154.4 vs. 91 ml, p = 0.001) but not baseline ischemic cores (9.1 vs. 7 ml, p = 0.495), as well as larger 24-h Tmax > 6 s lesions (74.4 vs. 3.4 ml, p < 0.001) but comparable 24-h infarct volumes (28.6 vs. 24 ml, p = 0.585). Patients with 24-h post-randomization infarcts larger than predicted had larger baseline cores (32 vs. 7 ml, p < 0.001), penumbral volumes (128.2 vs. 91 ml, p = 0.019), and 24-h infarct volumes (104.5 vs. 24 ml, p < 0.001) but similar 24-h Tmax > 6 s lesions (2.6 vs. 3.4 ml, p = 0.682) compared to patients with 24-h infarcts within 25 ml of predictions.
For patients who completely reperfused, 2% had 24-h infarcts smaller than predicted, 64% had infarcts within 25 ml of predicted, and 34% had infarcts larger than predicted. For patients who partially reperfused, 21% of patients had 24-h infarcts smaller than predicted, 59% had infarcts within 25 ml of predicted, and 20% had infarcts larger than predicted. Forty three percent of patients who did not reperfuse were in the group with infarcts smaller than predicted, 28% were in the group with more accurate predictions, and 29% were in the group with infarcts larger than predicted.
Higher HIR in patients with 24-h infarcts larger than predicted
As demonstrated in Figure 1, in patients for whom the 24-h infarct was larger than predicted, the median baseline HIR of 0.43 (IQR: 0.26 to 0.60) was higher (less favorable) than that of patients with 24-h infarct predictions within 25 ml, who had a median baseline HIR of 0.32 (IQR: 0.15 to 0.44, p = 0.006). For patients with 24-h infarcts smaller than predicted, the median did not differ from patients with 24-h infarcts within 25 ml of the prediction. At 24 h, median HIR for patients with 24-h infarcts larger than predicted was 0.56 (IQR: 0.19 to 0.79) which was significantly worse (p = 0.004) than 24-h HIR of patients with 24-h infarcts within 25 ml of the predictions (0.07, IQR: 0 to 0.38). We found no difference in 24-h HIR between patients with 24-h infarcts within 25 ml of predicted and patients with 24-h infarcts smaller than predicted. The change in HIR between baseline and 24 h after randomization did not significantly differ between groups (p = 0.224).
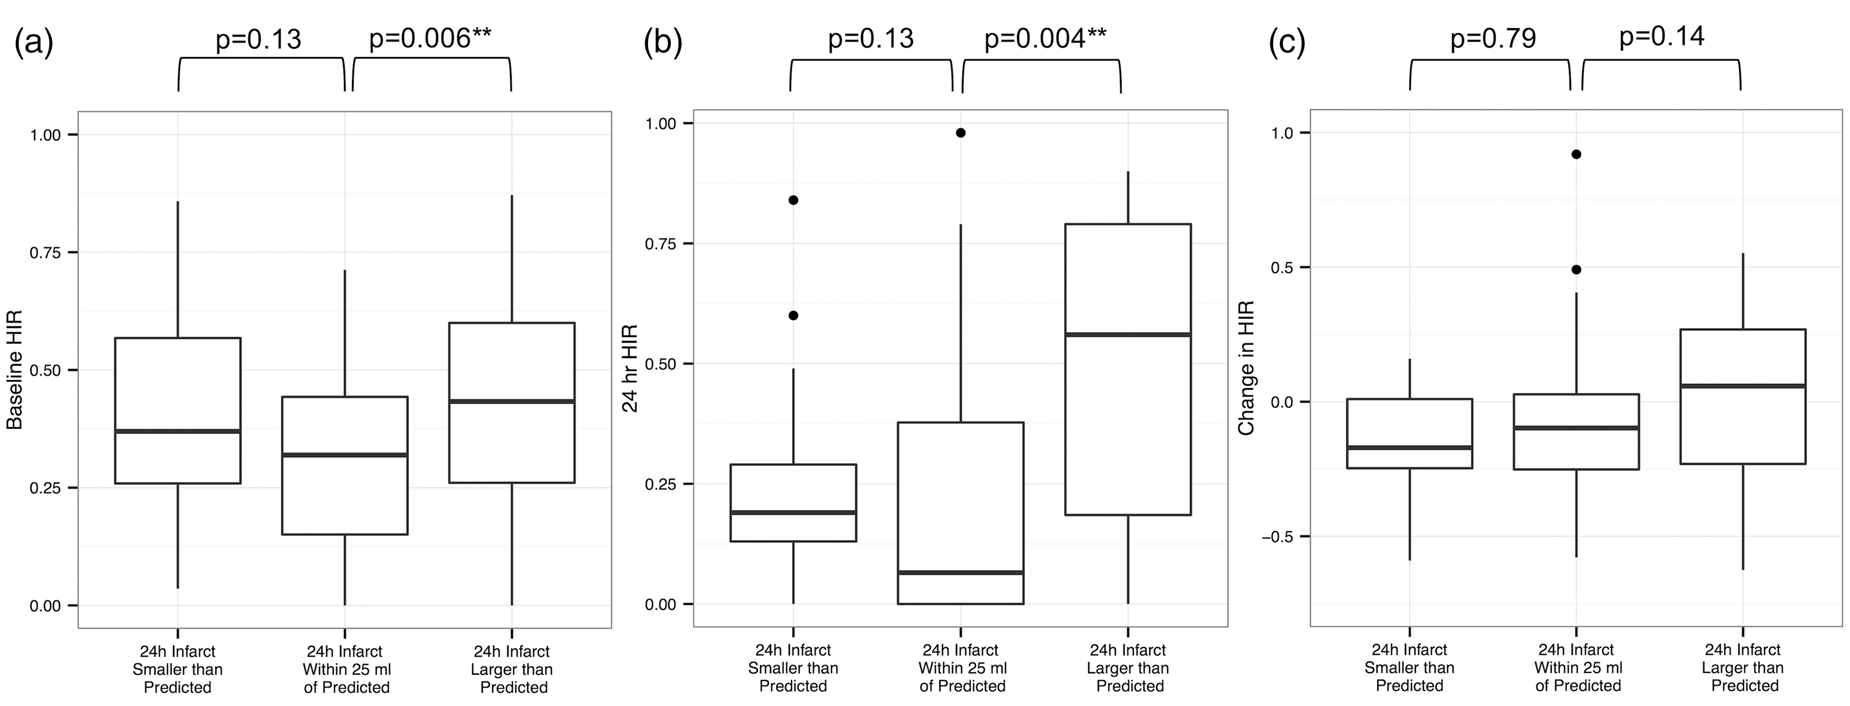
Hypoperfusion intensity ratios (HIR) in patients across estimation groups, (a), at baseline (b), at 24 h after randomization and (c), comparing the difference between baseline and 24 h post-randomization.
CBV index differs across prediction status
Baseline and 24-h CBV Index, as well as the change in the CBV index between these two time points, are shown in Figure 2. For patients with 24-h infarcts larger than predicted, the median CBV index at baseline was 0.78 (IQR: 0.69 to 0.84), less favorable than the median CBV index of patients with 24-h infarcts within 25 ml of the predictions (0.85, IQR: 0.75 to 0.91) (p = 0.001). CBV index at 24 h was less favorable, 0.47 (IQR: 0.33 to 0.65), for patients with 24-h infarcts larger than predicted compared to 0.73 (IQR: 0.58 to 0.79) in patients with 24-h infarcts within 25 ml of the predictions (p = 0.006), while patients with 24-h infarcts smaller than predicted had a median 24-h CBV Index that was more favorable, 0.81 (IQR: 0.71 to 0.88), compared to patients with 24-h infarcts within 25 ml of the predictions (p = 0.040). Overall, the change in CBV between baseline and 24 h differed between groups. Patients with 24-h infarcts smaller than predicted had a median drop of 0.04 (IQR: 0.05 to 0.08), which was smaller than the change in patients with 24-h infarcts within 25 ml of the predictions (0.12, IQR: 0.03 to 0.22, p = 0.035). For patients with 24-h infarcts larger than predicted, CBV dropped by 0.27 (IQR: 0.08 to 0.34), trending towards a larger decrease from baseline than patients with 24-h infarcts within 25 ml of the predictions experienced (p = 0.051).
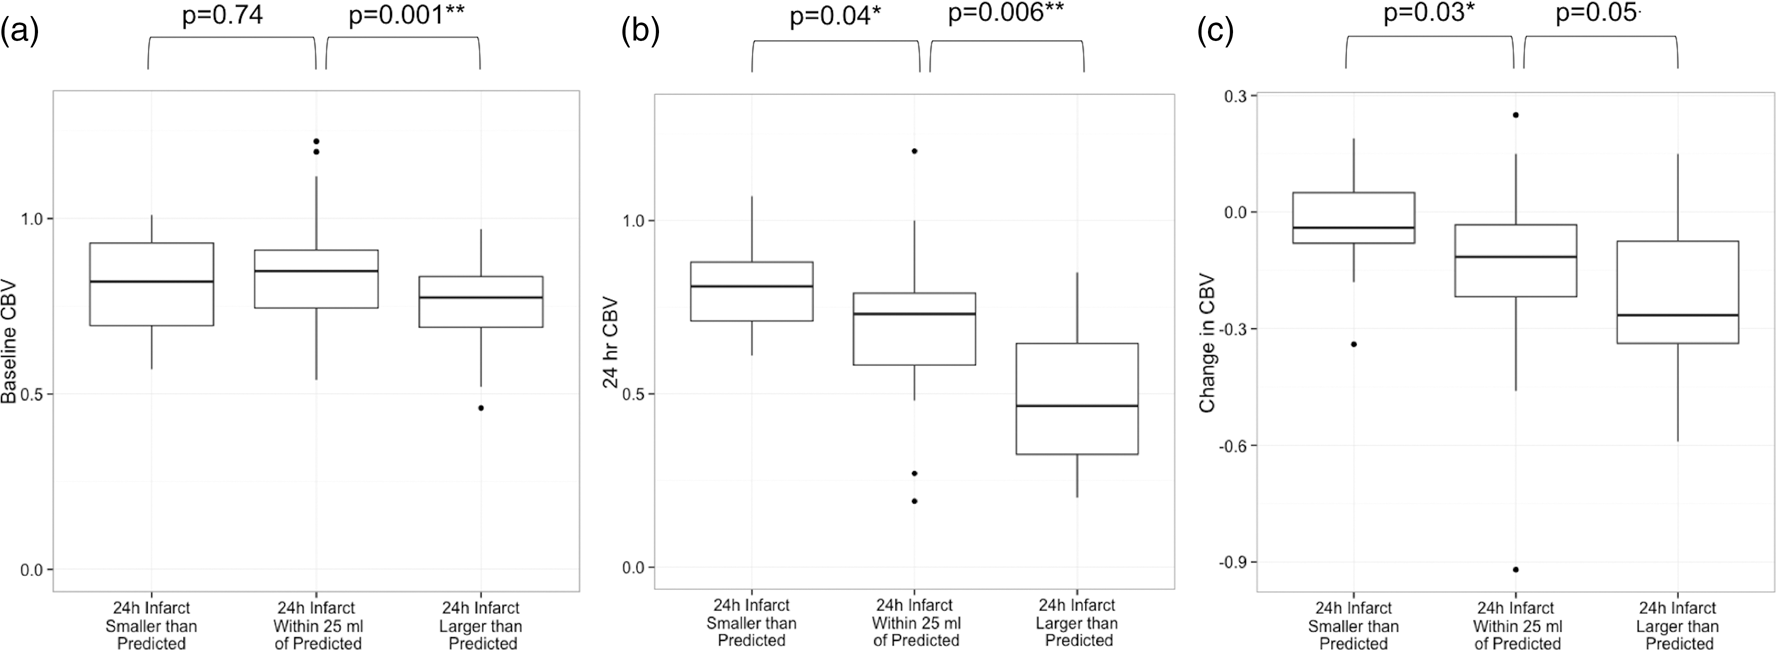
Cerebral blood volume (CBV) index in patients across estimation groups (a), at baseline (b), at 24 h after randomization and (c), comparing the difference between baseline and 24 h post-randomization.
A representative patient who partially reperfused had a 24-h post-randomization infarct of 10 ml, smaller than the 74 ml predicted by the union of the baseline core and the 24-h Tmax > 6 s lesion (Figure 3). This patient had an HIR of 0.72 and CBV index of 0.66 at baseline and an HIR of 0.44 and CBV index of 0.71 on perfusion imaging obtained 24 h later, suggesting that the smaller than predicted infarct growth may have been explained by the improvement in collaterals over time. Another patient with a 24-h infarct larger than predicted had a baseline HIR of 0.23 and CBV index of 0.88, which worsened by 24 h to an HIR of 0.68 and CBV of 0.83 (Figure 4). This patient, who did not reperfuse, had a predicted 24-h infarct of 46 ml based on the baseline Tmax > 6 s lesion and an observed infarct of 145 ml, suggesting that the difference between the predicted and observed 24-h infarct size may be related to progressive collateral failure over the 24-h time period.
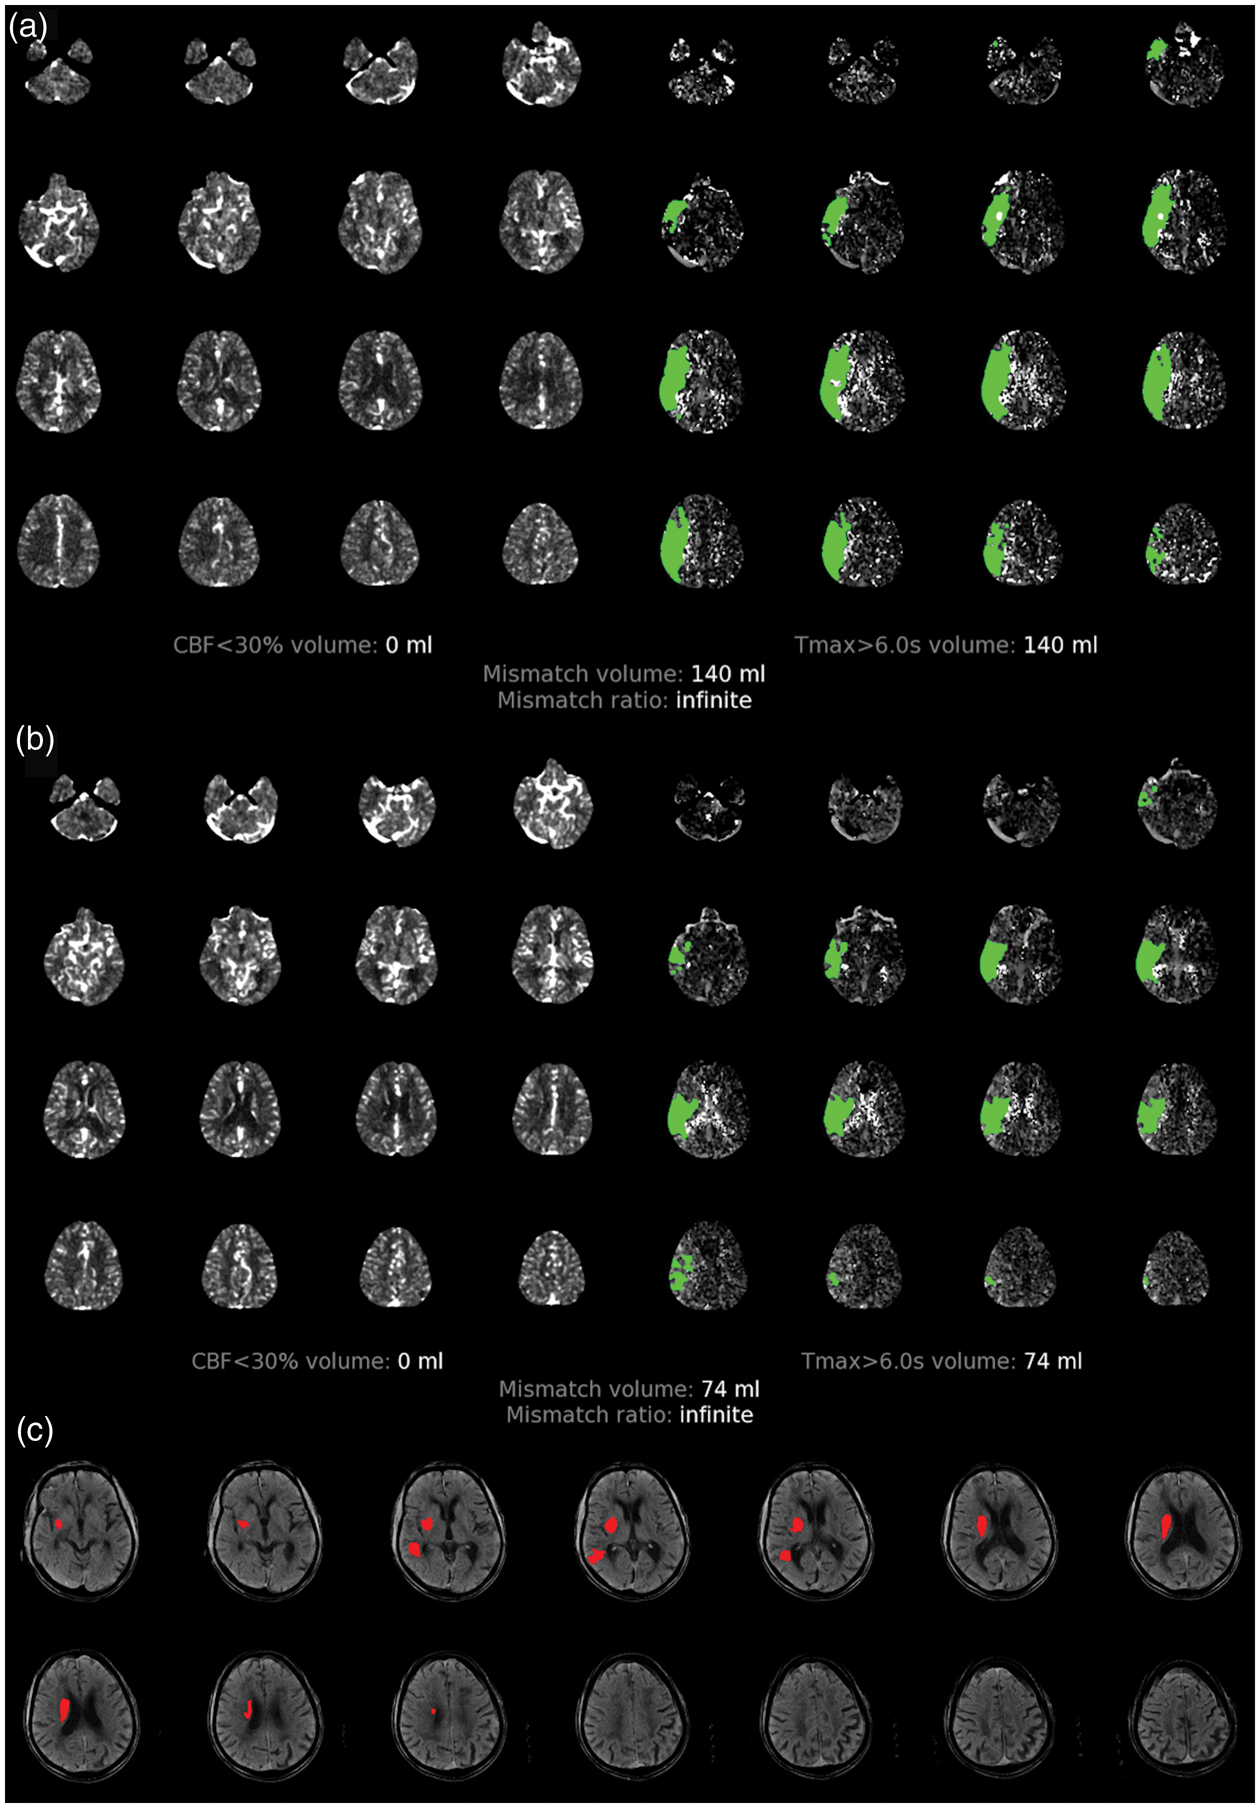
Imaging from a patient who partially reperfused, for whom the union-predicted 24-h infarct volume (74 ml) was larger than the observed volume (10 ml), likely due to improving collaterals between baseline and 24-h imaging. (a) Baseline RAPID map showing core (left) and penumbra (right). (b) RAPID map at 24 h after randomization. (c) Infarct at 24 h after randomization.
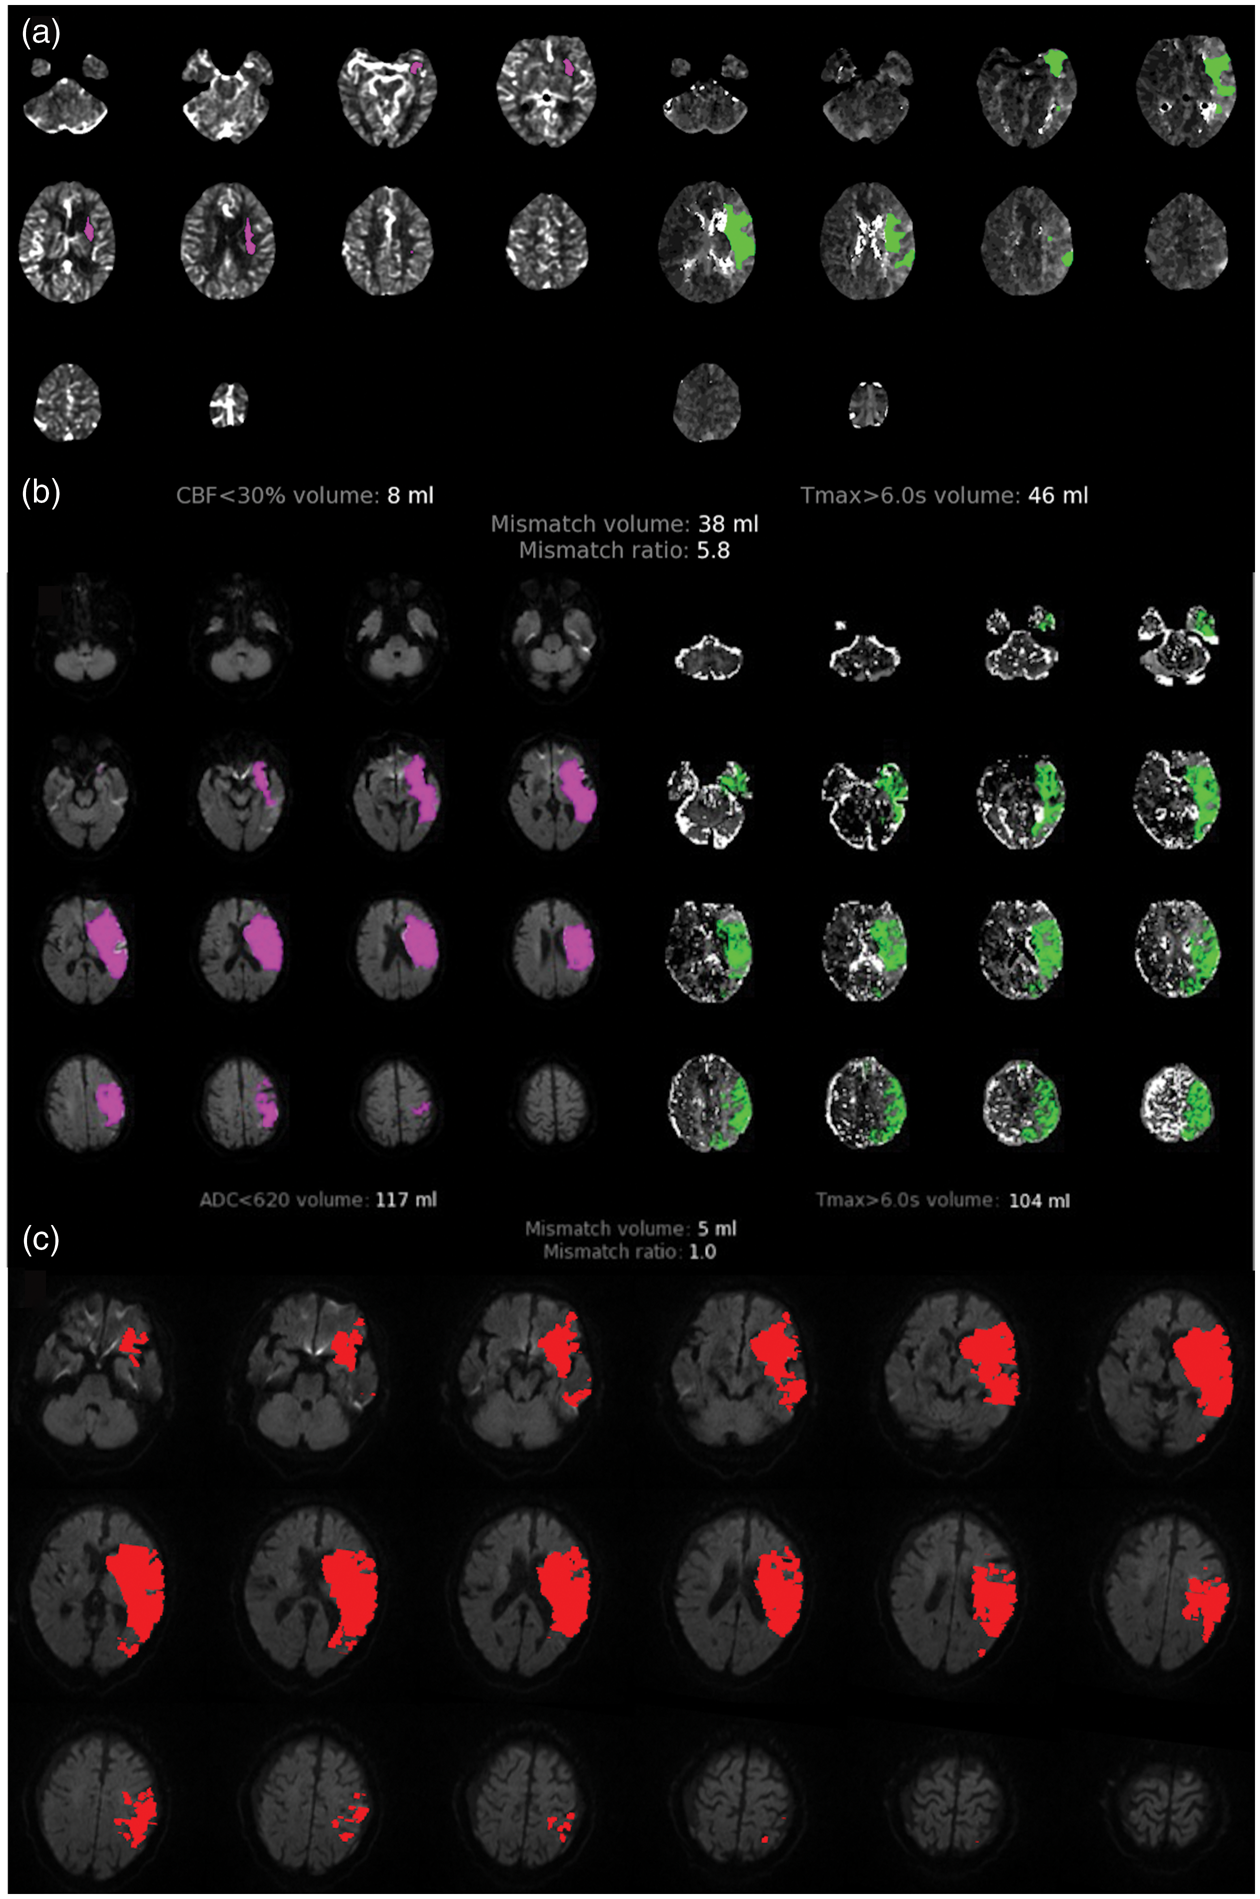
Imaging from a patient who did not reperfuse, for whom the baseline Tmax > 6 s predicted 24-h infarct volume (46 ml) was smaller than the observed volume (145 ml) presumably due to worsening collaterals between baseline and 24-h imaging. (a) Baseline RAPID map showing core (left) and penumbra (right). (b) RAPID map at 24 h after randomization. (c) Infarct at 24 h after randomization.
Mortality and infarct growth differences across prediction status
In comparing outcomes across prediction groups (Table 2), we observed differences in infarct growth and mortality, but not in the proportion of patients with a 90-day mRS of 0–2, incidence of symptomatic intracerebral hemorrhage, or early neurologic deterioration. In particular, patients with 24-h infarcts larger than predicted had a median infarct growth of 65.6 ml (IQR: 35.6 to 125.3) compared to patients with 24-h infarcts within 25 ml of the prediction, who had a median growth of 13.3 ml (IQR: 7.75 to 23.69, p < 0.001). However, infarct growth did not differ between patients with 24-h infarcts smaller than predicted (median: 16.6 ml, IQR: 11 to 22.3) and those with 24-h infarcts within 25 ml of the prediction (p = 0.858). A mortality of 44% was noted in patients with smaller than predicted 24-h infarcts, significantly higher than the 10% mortality seen in patients with observed 24-h infarcts within 25 ml of the predicted (p = 0.002). Mortality in patients with larger than predicted 24-h infarcts, 18%, did not differ from patients with 24-h infarcts within 25 ml of predicted (p = 0.340).
Imaging and functional outcomes.
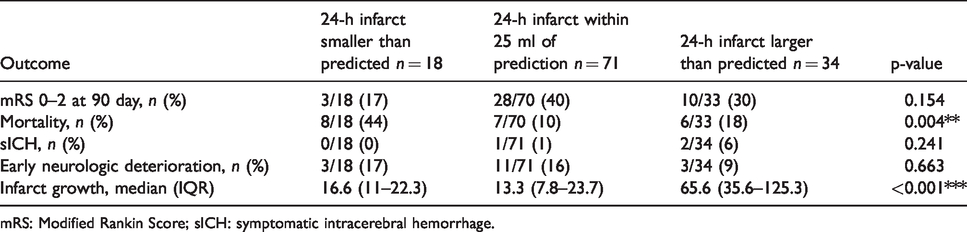
mRS: Modified Rankin Score; sICH: symptomatic intracerebral hemorrhage.
Discussion
Our results suggest that patients who develop 24-h infarcts larger than predicted have less robust collaterals that show evidence of failure at 24 h, with higher HIR and lower CBV indices at baseline and 24 h compared to patients with infarcts that more closely follow established prediction models. For patients with 24-h infarcts smaller than predicted, the persistently favorable CBV index on the 24-h post-randomization study indicates the favorable collaterals were maintained for at least one day after enrollment. However, these patients also had a very low rate of reperfusion and very poor clinical outcomes, which suggests that the collaterals eventually failed and the infarcts likely expanded into the persistent perfusion lesions. Prior studies have documented substantial growth between 24 h and five days in patients who did not reperfuse.16–18 Future studies could test this hypothesis by systematically including late follow-up data to evaluate infarcts at a time point several days after randomization.
We found that patients with infarcts larger than predicted had higher infarct growth rates, which have been shown to be associated with poor collaterals in prior studies, 9 , 10 , 19 while lower growth rates have been shown to be associated with good baseline collaterals. 8 , 19
Other variables that differed across estimation groups include age, core size, penumbra size, and reperfusion status. Older age in the patients with slower infarct progression was unanticipated and should be evaluated in future trials. The observed differences in mortality are likely driven by treatment or reperfusion status, as 89% of patients with infarcts smaller than predicted received medical therapy alone compared to the other two groups in which a majority of patients received endovascular therapy. However, no differences in disability on the mRS were identified.
Our study was limited by small sample sizes within groups, the lack of late imaging time points beyond 24 h, as well as small variations in time to imaging, treatment and reperfusion rates between groups. In addition, the Tmax at a single timepoint is not a perfect predictor of tissue fate in individual patients as it can fluctuate over time based on parameters such as blood pressure and collateral flow. We also acknowledge that the inherent margin of error from automated perfusion software may contribute to differences between observed and predicted infarct volumes. Not all hospitals have automated perfusion software which limits the generalizability of HIR and CBV Index.
Nevertheless, this work adds to the body of evidence highlighting the importance of taking into account collateral status when predicting infarct volumes soon after stroke onset. It also suggests that collaterals can improve or fail over time and that these changes are associated with infarct growth. These findings may help guide clinical decision making regarding the transfer of patients from local hospitals or primary stroke centers to comprehensive stroke centers for advanced interventions such as mechanical thrombectomy. Further exploration of optimal HIR and CBV index thresholds for clinical assessment and management is warranted in future studies.
Footnotes
Funding
The author(s) disclosed receipt of the following financial support for the research, authorship, and/or publication of this article: DEFUSE 3 (Endovascular Therapy Following Imaging Evaluation for Ischemic Stroke) was funded by the National Institute of Neurological Disorders and Stroke (grants U10NS086487 and U01NS092076). RAPID software was provided by iSchemaView. VLR received a grant from the Stanford Medical Scholars Program.
Declaration of conflicting interests
The author(s) declared the following potential conflicts of interest with respect to the research, authorship, and/or publication of this article: Dr. Christensen has an equity interest in iSchemaView. Dr. Zaharchuk has an equity interest in Subtle Medical. Dr. Albers has an equity interest in iSchemaView and is a consultant for Medtronic and iSchemaView. Dr. Heit is a consultant for Medtronic and MicroVention and a member of the iSchemaView Medical and Scientific Advisory Board. Dr. Marks has an equity interest in ThrombX Medical. The other authors report no conflicts.
Authors’ contributions
Conception and design: VLR, MGL, GWA. Data collection: VLR, MM, SC, AY, SK, GZ, JJH, MM, MGL, GWA. Analysis and interpretation: VLR, MM, SC, AY, MGL, GWA. Writing the article: VLR, GWA. Critical revision of the article: VLR, MM, SC, AY, SK, GZ, JJH, MM, MGL, GWA. Final approval of the article: VLR, MM, SC, AY, SK, GZ, JJH, MM, MGL, GWA. Statistical analysis: VLR, MM. Obtained funding: MGL, GWA. Overall responsibility: VLR, GWA.