
Abstract
Limited spatial resolution of positron emission tomography (PET) can cause significant underestimation in the observed regional radioactivity concentration (so-called partial volume effect or PVE) resulting in systematic errors in estimating quantitative physiologic parameters. The authors have formulated four mathematical models that describe the dynamic behavior of a freely diffusible tracer (H215O) in a region of interest (ROI) incorporating estimates of regional tissue flow that are independent of PVE. The current study was intended to evaluate the feasibility of these models and to establish a methodology to accurately quantify regional cerebral blood flow (CBF) corrected for PVE in cortical gray matter regions. Five monkeys were studied with PET after IV H215O two times (n = 3) or three times (n = 2) in a row. Two ROIs were drawn on structural magnetic resonance imaging (MRI) scans and projected onto the PET images in which regional CBF values and the water perfusable tissue fraction for the cortical gray matter tissue (hence the volume of gray matter) were estimated. After the PET study, the animals were killed and stereologic analysis was performed to assess the gray matter mass in the corresponding ROIs. Reproducibility of the estimated parameters and sensitivity to various error sources were also evaluated. All models tested in the current study yielded PVE-corrected regional CBF values (approximately 0.8 mL · min−1 · g−1 for models with a term for gray matter tissue and 0.5 mL · min−1 · g−1 for models with a term for a mixture of gray matter and white matter tissues). These values were greater than those obtained from ROIs tracing the gray matter cortex using conventional H215O autoradiography (approximately 0.40 mL · min−1 · g−1). Among the four models, configurations that included two parallel tissue compartments demonstrated better results with regards to the agreement of tissue time-activity curve and the Akaike's Information Criteria. Error sensitivity analysis suggested the model that fits three parameters of the gray matter CBF, the gray matter fraction, and the white matter fraction with fixed white matter CBF as the most reliable and suitable for estimating the gray matter CBF. Reproducibility with this model was 11% for estimating the gray matter CBF. The volume of gray matter tissue can also be estimated using this model and was significantly correlated with the results from the stereologic analysis. However, values were significantly smaller compared with those measured by stereologic analysis by 40%, which can not be explained by the methodologic errors. In conclusion, the partial volume correction was essential in quantitation of regional CBF. The method presented in this article provided the PVE-corrected regional CBF in the cortical gray matter tissue. This study also suggests that further studies are required before using MRI derived anatomic information for PVE correction in PET.
Quantitative positron emission tomography (PET) and single photon emission computed tomography (SPECT) can noninvasively estimate biophysiologic parameters by mathematical modeling of the kinetic behavior of suitable radiotracers. However, the limited spatial resolution of PET and SPECT can cause partial volume effects (PVE), which leads to an underestimation of regional radioactivity distribution in regions with high radioactivity concentration relative to the surroundings and, conversely, to an overestimation in regions with low radioactivity concentration (Hoffman et al., 1979). Because PVE and the regions of interest (ROIs) are defined, the observed tissue time activity counts are likely to represent a mixture of tissues, that is, gray and white matter for brain ROIs. This is contrary to the assumption usually made in kinetic modeling that only one tissue type is within a given ROI. Several scientists have investigated the limitations of this assumption and evaluated the effects on several estimated physiologic parameters (Blomqvist et al., 1995; Herscovitch et al., 1983; Huang et al., 1987; Iida et al., 1989; Kanno et al., 1984; Lammertsma et al., 1981). In general, the systematic underestimation of radioactivity in cortical gray matter regions causes an underestimation of the parameter estimates. In addition, the errors in the estimated parameters are often increased because of the nonlinear characteristics of the parameter estimation process (Huang et al., 1987).
Several techniques aimed at resolving the PVE problem have been proposed and applied to clinical studies, primarily based on the use of anatomic structural information measured with magnetic resonance imaging (MRI) or computerized tomography (CT). Early attempts applied a PVE correction factor to the global measurements of cerebral metabolism (Chawluk et al., 1987; Herscovitch et al., 1986; Schlageter et al., 1987), in which ventricular and sulcal volumes derived from CT were used to individually correct whole-brain PET measurements for variations in the amount of brain atrophy in patients with Alzheimer's disease. This technique has been extended to regional measurements of glucose metabolism in small ROIs, which included only gray matter or both gray and white matter components (Labbe et al., 1996; Meltzer et al., 1990; Müller-Gartner et al., 1992; Videen et al., 1988). The technique simply scales the observed counts or metabolism in the ROI by a correction factor derived from the anatomic image, and thus does not take into account that more than one tissue can contribute to the ROI counts. Recently, Ardekani et al., (1996) and other workers (Gindi et al., 1993; Ouyang et al., 1994) have developed algorithms that use anatomic priors in the reconstruction of the PET data resulting in reconstructed slices with resolution approaching that of the anatomic modality. However, the effects of different spatial resolutions in the axial direction of the PET and MRI images have not been fully accounted for, limiting the application of this technique for PVE correction.
It has been demonstrated in the heart that the PVE effects can be included in the kinetic model for H215O blood flow measurements (Iida et al., 1988b). With this approach, the regional distribution volume of H215O is estimated for each ROI using nonlinear least square fitting. Assuming a constant partition coefficient of water, the fractional mass of the tissue within a given volume, namely the recovery coefficient, can be calculated for each ROI, thus providing the regional myocardial flow free from PVE. Several studies have confirmed the validity of this procedure including: (1) Quantitative measures of myocardial blood flow in dogs corrected in this manner agreed with values determined using radiolabeled microspheres for a wide physiologic flow range. PET measurements in these dogs were affected by the PVE because of the small transmural wall thickness (Araujo et al., 1991; Bergmann et al., 1989). (2) Estimated myocardial blood flow values were independent of the size of selected ROIs, even when the ROIs were extended well outside the myocardium. Furthermore, the fractional tissue mass decreased reasonably with increasing ROI size (Iida et al., 1988b). (3) Good agreement was found between the fractional tissue mass determined by this technique and an independent measurement derived from the extravascular tissue density obtained using transmission scans and the blood pool images (Iida et al., 1991b).
The aim of the current study was to evaluate the applicability of this kinetic model-based approach to PVE correction to quantitative measures of cerebral blood flow (CBF) in cortical gray matter region using PET. The relative merits of four different model approaches are evaluated with data measured in the brains of five macaque monkeys. Stereologic analysis had been performed on postmortem tissue segments corresponding to the ROIs sampled by PET for the comparison of tissue volume with estimated values of the fractional tissue mass derived from the optimal model. Finally, simulation studies were performed to evaluate the feasibility of applying this approach to clinical studies.
Theory
Four models were formulated to quantitate regional CBF using H215O and dynamic PET, all of which took into account the PVE. Notations used in this article are summarized in Fig. 1.
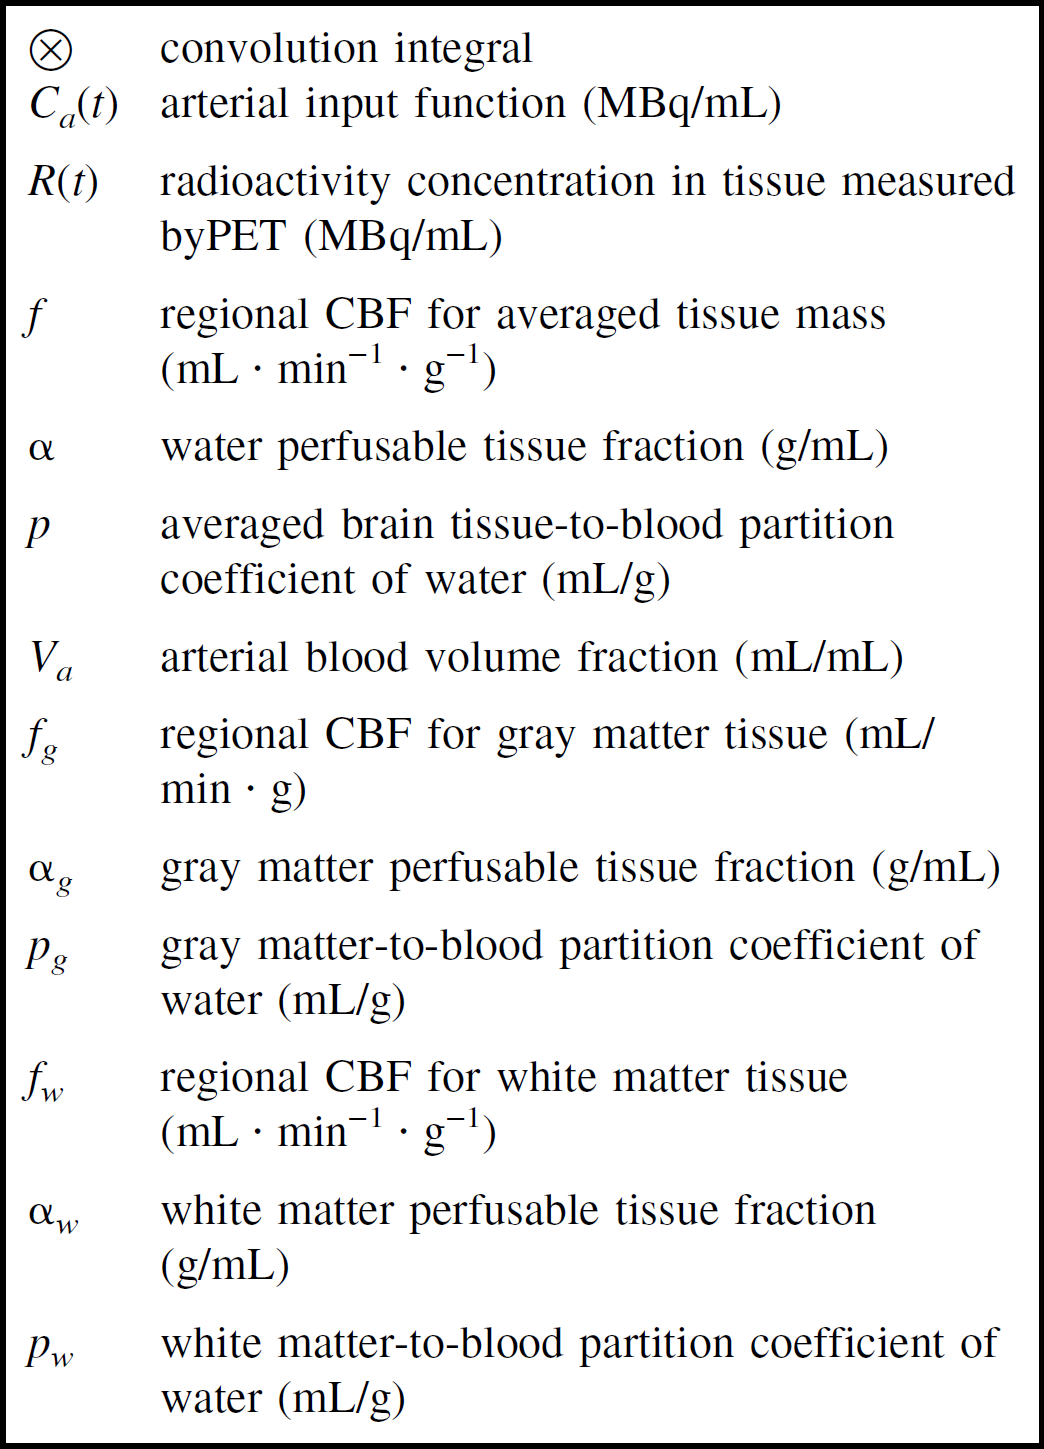
Notations used in the mathematical formulations in this article.
Model A (single-tissue compartment model)
In the first model, a term α (in units of gram tissue per mL), the fractional mass of the water-perfusable tissue within an given ROI, has been implemented equivalent to previously published PET studies of myocardial blood flow (Bergmann et al., 1989; Iida et al., 1988b,1991b,1995). The regional tissue radioactivity curve can then be expressed as:
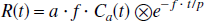
The f estimated by this model represents the regional CBF corrected for PVE in units of mL blood per minute per gram of cerebral tissue. Note that α represents the total fractional mass of cerebral tissue, and that there is no distinction between the gray and white matter within a given ROI volume. Because the brain-to-blood partition coefficient of water (p) is fixed at 0.9 (mL/g) (Herscovitch and Raichle, 1985), this model includes two unknown parameters, α and f. Nonlinear least squares fitting of Eq. 1 to the observed regional time-activity curves for a given ROI thus yielded α and f simultaneously.
Model B (single-tissue compartment with the arterial blood volume component)
Model B is essentially the same as Model A described above, except for the inclusion of an additional term for the arterial blood volume fraction, Va (mL/mL), as has been suggested by Ohta et al. (1996) and Fujita et al. (1997). Consequently, the regional tissue radioactivity concentration is formulated as:

In this model the three unknown parameters, α, f, and Va, can also be estimated by means of nonlinear least squares fitting. The definitions of α and f are as for Model A.
Models C and D (gray and white two-tissue compartments)
These two models consist of two tissue compartments with different regional CBFs (fg and fw) and partition coefficients (pg and pw) with arbitrary fractionations of these two components, namely αg and αw. It should be noted that αg + αw ≤ 1, as the ROI may contain nonperfused tissue or cerebrospinal fluid. The regional tissue radioactivity concentration is then formulated as:
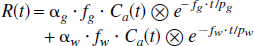
Because the partition coefficients of water (pg and pw) have been fixed as pg = 1.0 (mL/g) and pw = 0.80 (mL/g), as determined by Herscovitch et al. (Herscovitch and Raichle, 1985), this formulation includes four unknown parameters, αg, αw, fg, and fw. Of these parameters, α g and αw represent the fractional mass of gray and white cerebral tissues, respectively, in units of (g/mL), and fg and fw represent the regional CBF of each component. In Model C, fw was fixed at 0.20 (mL · min−1 ·g−1), which corresponds to the previous average white matter flow value found by Xenon-133 clearance techniques (Høedt-Rasmussen, 1967). The other three parameters, f, αg, and αw, were fitted to the observed time-activity curve of the regional H215O concentration. In Model D, all four parameters of fg, αg, and αw were fitted without assuming a fixed value for fw.
MATERIALS AND METHODS
Subjects
Positron emission tomography studies were performed on seven male monkeys (Macaca fascicularis). Because of difficulties in blood sampling, data from two monkeys (5 and 7) had to be excluded. The remaining five monkeys were six-years-old at the time of scanning. The mean body weight was 7.6 kg ± 1.2 (SD), range 6.1 to 9.1 kg. The monkeys had participated in a neurotoxicity study of cisplatin chemotherapy. All five monkeys had received 4 to 6 mg/kg cisplatin every third week culminating into a cumulative dose of 60 mg/kg finishing 3 to 6 months before the PET studies were done. All animals were clinically and biochemically assessed and judged fully recovered after having been given the cisplatin treatment. The study protocol was approved by the Danish Animal Experiments Inspectorate (J. No. 1995-101-115).
PET protocol
PET scans were obtained with an eighteen ring GE-Advance scanner (GE Electronics, Milwaukee, WI, U.S.A.) operating in 2D acquisition mode producing 35 image slices with an interslice distance of 4.25 mm. The total axial field of view was 15.2 cm with an intrinsic spatial in-plane and axial resolution of approximately 5 mm full width at half maximum. The technical specifications have been described elsewhere (DeGrado et al., 1994).
Anesthesia of the animals was induced by a mixture of xylazin (Rompun(R)) 20 mg/mL and ketamine (Ketalar(K)) 50 mg/mL, intramuscularly 1 mL/6kg (R/K = 1 mg:6 mg). Anesthesia was maintained by repetitive intramuscular injections of a mixture of R/K (2 mg:5 mg) 0.3 to 0.5 mL approximately every 20 to 30 minutes. A bladder catheter was inserted to ensure proper drainage of urine. A minor open surgical procedure was performed to insert a catheter for the measurement of the input function through the right axillary artery with the catheter tip located in the ascending aorta. The length of the catheter was 40 cm with an internal diameter of 1 mm.
The monkeys were placed in the supine position on the scanner bed. After the scanning procedure the animals were killed with an IV injection of an overdose of 20% pentobarbitone in ethanol for further histologic and morphologic studies.
A 15-minute transmission scan was performed for attenuation correction. A dynamic PET scan was initiated at approximately 5 seconds after the injection of a 1.5 mL bolus of 1 GBq (28.5 mCi) H2O15 at interscan intervals of 15 to 20 minutes. The isotope was administered over 1 to 2 seconds through an intravenous catheter introduced into the left crural vein followed immediately by 1.5 mL of physiologic saline for flushing. A 26 frame scan sequence over a period of 6 minutes was obtained consisting of 12 × 5 seconds, 8 × 15 seconds, and 6 × 30 seconds, which was repeated twice in three monkeys and three times in two monkeys.
Arterial blood sampling commenced 30 seconds before isotope injection, and blood was continuously withdrawn at a flow rate of 4 mL/min into a 50 mL heparinized syringe (2 mL × 5 IU/mL). The blood radioactivity concentration was monitored at a sampling frequency of 1 Hz using a BGO coincidence detector (Advance Fluid Radioactivity Quantifier System; GE Electronics). After scan termination the arterial catheter was flushed with heparin (5 IU/mL), and withdrawn blood was reinfused into the monkey through the vein.
Positron emission tomography images were reconstructed using a transaxial 4-mm full width at half maximum Hanning filter (Hewlett Packard, Palo Alto, CA, U.S.A.). All data were transferred to an off-line UNIX workstation where further analyses were performed using the software package Dr. View (Asahi-kasei, Tokyo, Japan) and in-house programs.
MRI scanning
Structural MRI scanning was performed on every monkey to guide the definition of ROIs after alignment of these images to PET (see below). A 1.5 T Vision scanner (Siemens, Erlangen, Germany) was used to acquire two 3D data sets—a T1-weighted 3D MP-RAGE sequence (repetition time/echo time/inversion time = 11.4/4.4/300 msec; flip angle = 8°) and a T2-weighted 3D FISP sequence (repetition time/echo time = 50/15 msec; flip angle = 5°) with resolutions of 1.2 × 1.2 × 1.2 mm3 and 0.6 × 0.6 × 1.2 mm3, respectively. The T2-weighted images were used for the ROI definitions.
Stereologic analysis
On the day of the PET experiment, the animals were killed and the brain stem was excised. Cerebral hemispheres were divided through the corpus callosum. Only one hemisphere was used for this project and was chosen at random. Each hemisphere was embedded in 5% agar and sliced perpendicular to the long axis with the help of guide spacers with a random start position for the first slice. Slices were cut in the direction from the frontal to the occipital pole with a slice thickness of 4.8 mm in two monkeys and 6.8 mm in the remaining three monkeys yielding a total of 11 to 15 slices. Three monkeys contributed with a right hemisphere and two monkeys with a left hemisphere. The average fresh tissue weight of the whole brain including the cerebellum was 74.3 ± 8 g (mean ± SD), ranging from 68 to 81 g, and the average weight of the analyzed hemispheres was 32 ± 4 g, ranging from 29 to 35 g.
Two tissue segments were selected for analysis. These were located at the frontal and occipital poles and were limited in depth 18 mm from the cortical edges of the poles by a plane transversal to the hemispheric long axis (Fig. 2). The volumes of gray and white matter in the tissue segments were calculated stereologically by the method developed by Gundersen and others (Gundersen et al., 1988; Gundersen and Jensen, 1985; Regeur and Pakkenberg, 1989). The stereologic method involves the random placement of a transparent counting grid with points and test lines over each cut surface of the brain slices (Fig. 3).
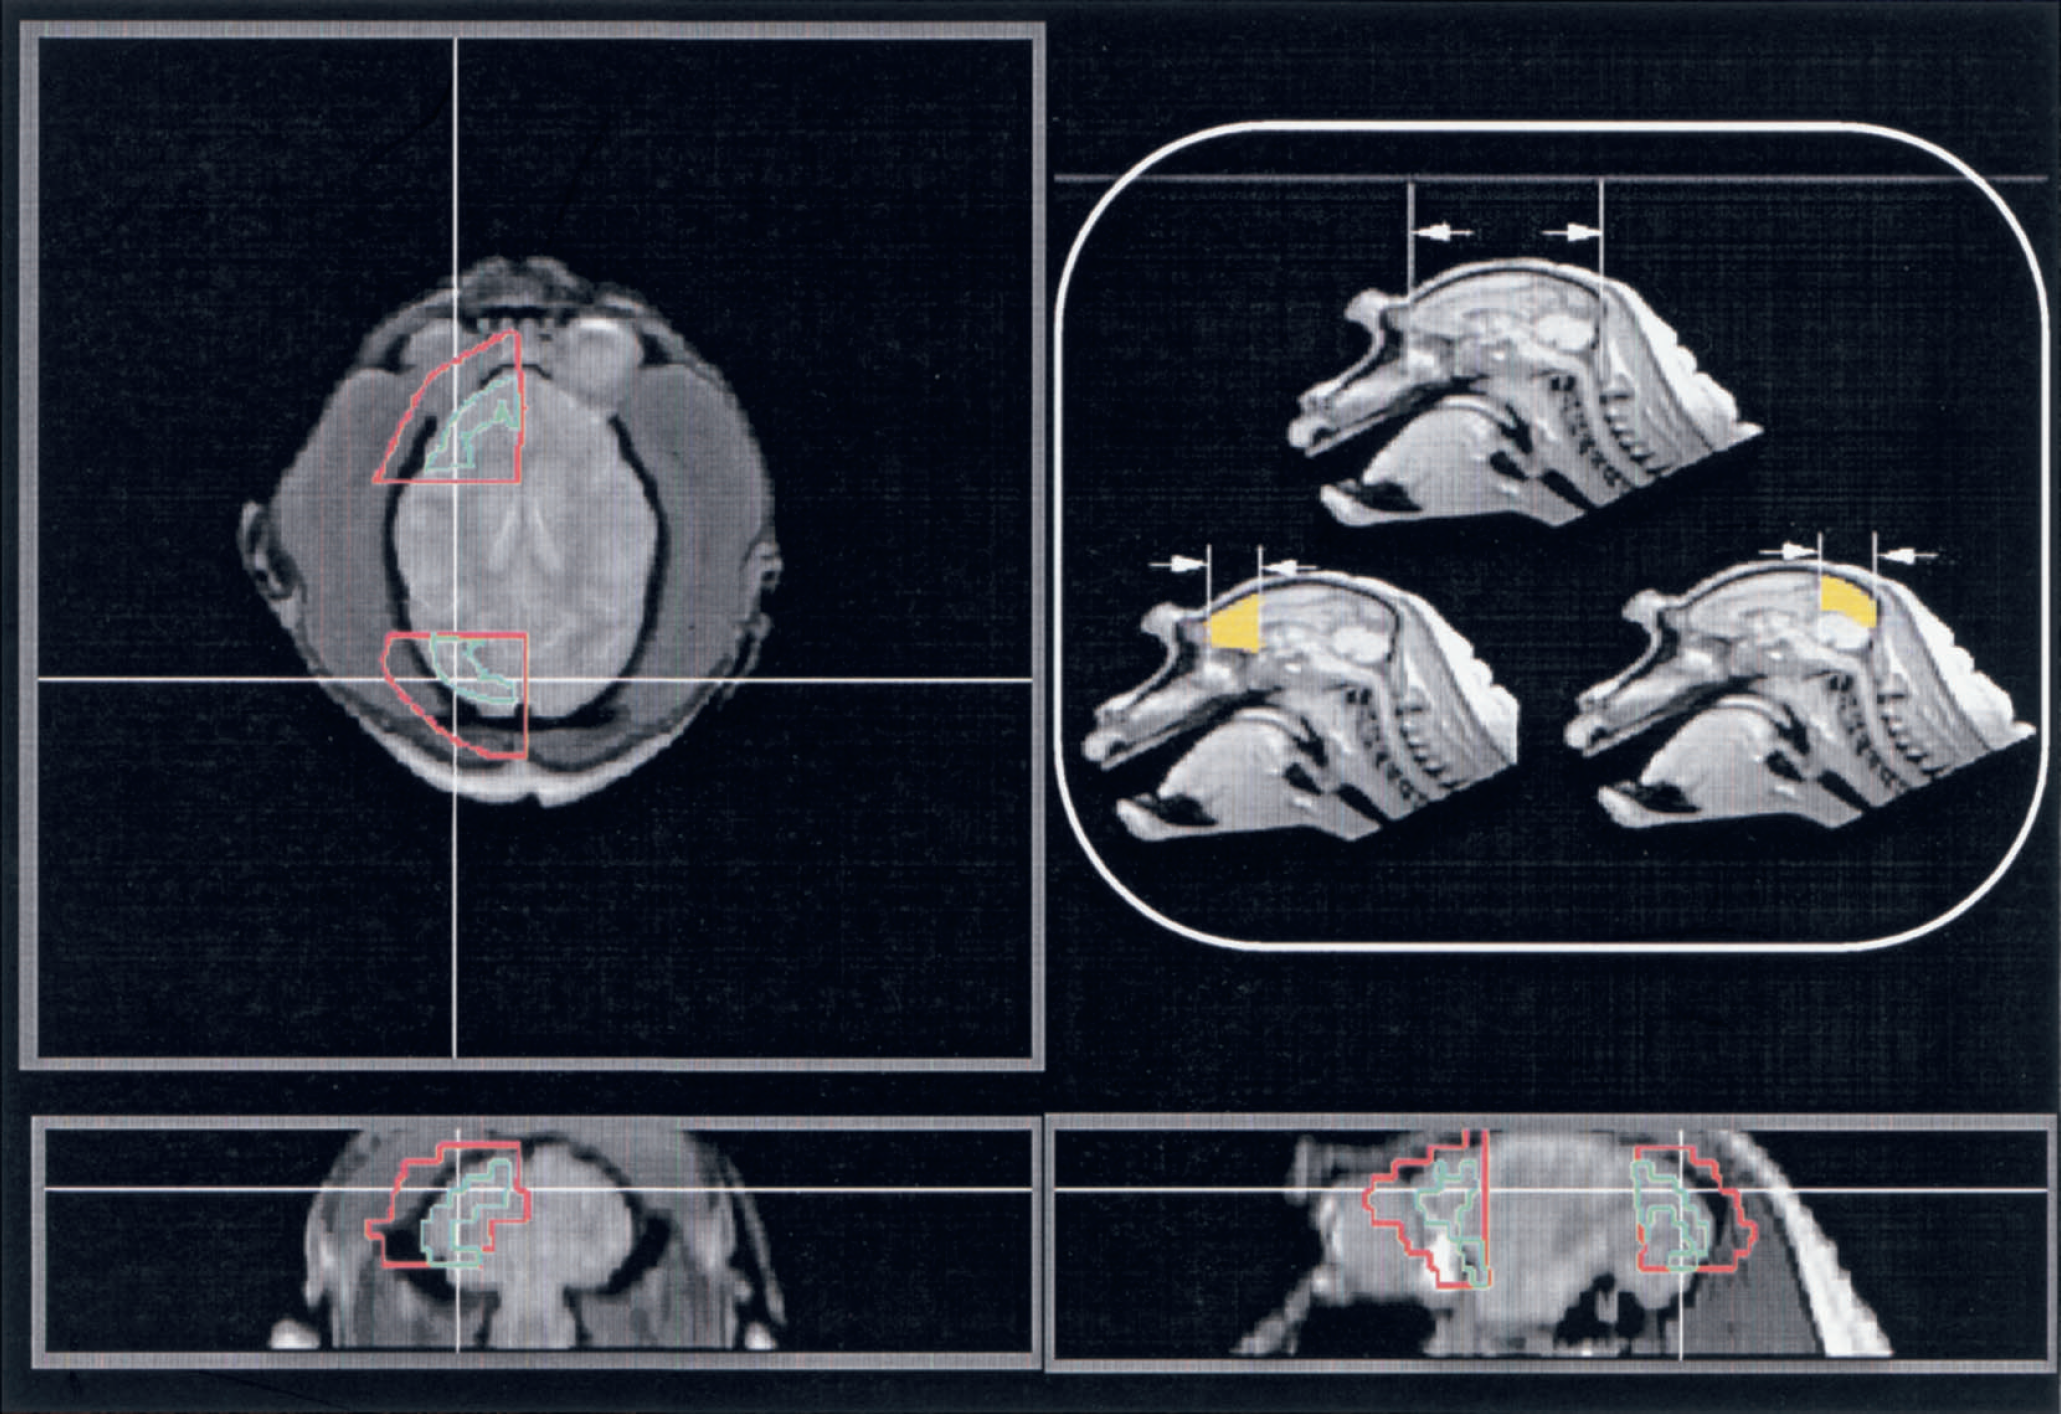
Regions of interest (ROIs) applied to the kinetic analysis in the current study selected in the frontal and occipital poles and limited in depth 18 mm from the cortical edge of the poles (yellow areas). Red boundary ROIs were selected for the kinetic analysis three-dimensionally on magnetic resonance images aligned to the corresponding positron emission tomography images. Additional green boundary ROIs were also selected within the red boundary ROIs for the analysis of the H215O autoradiography, which were carefully drawn to trace only the cortical gray matter region.
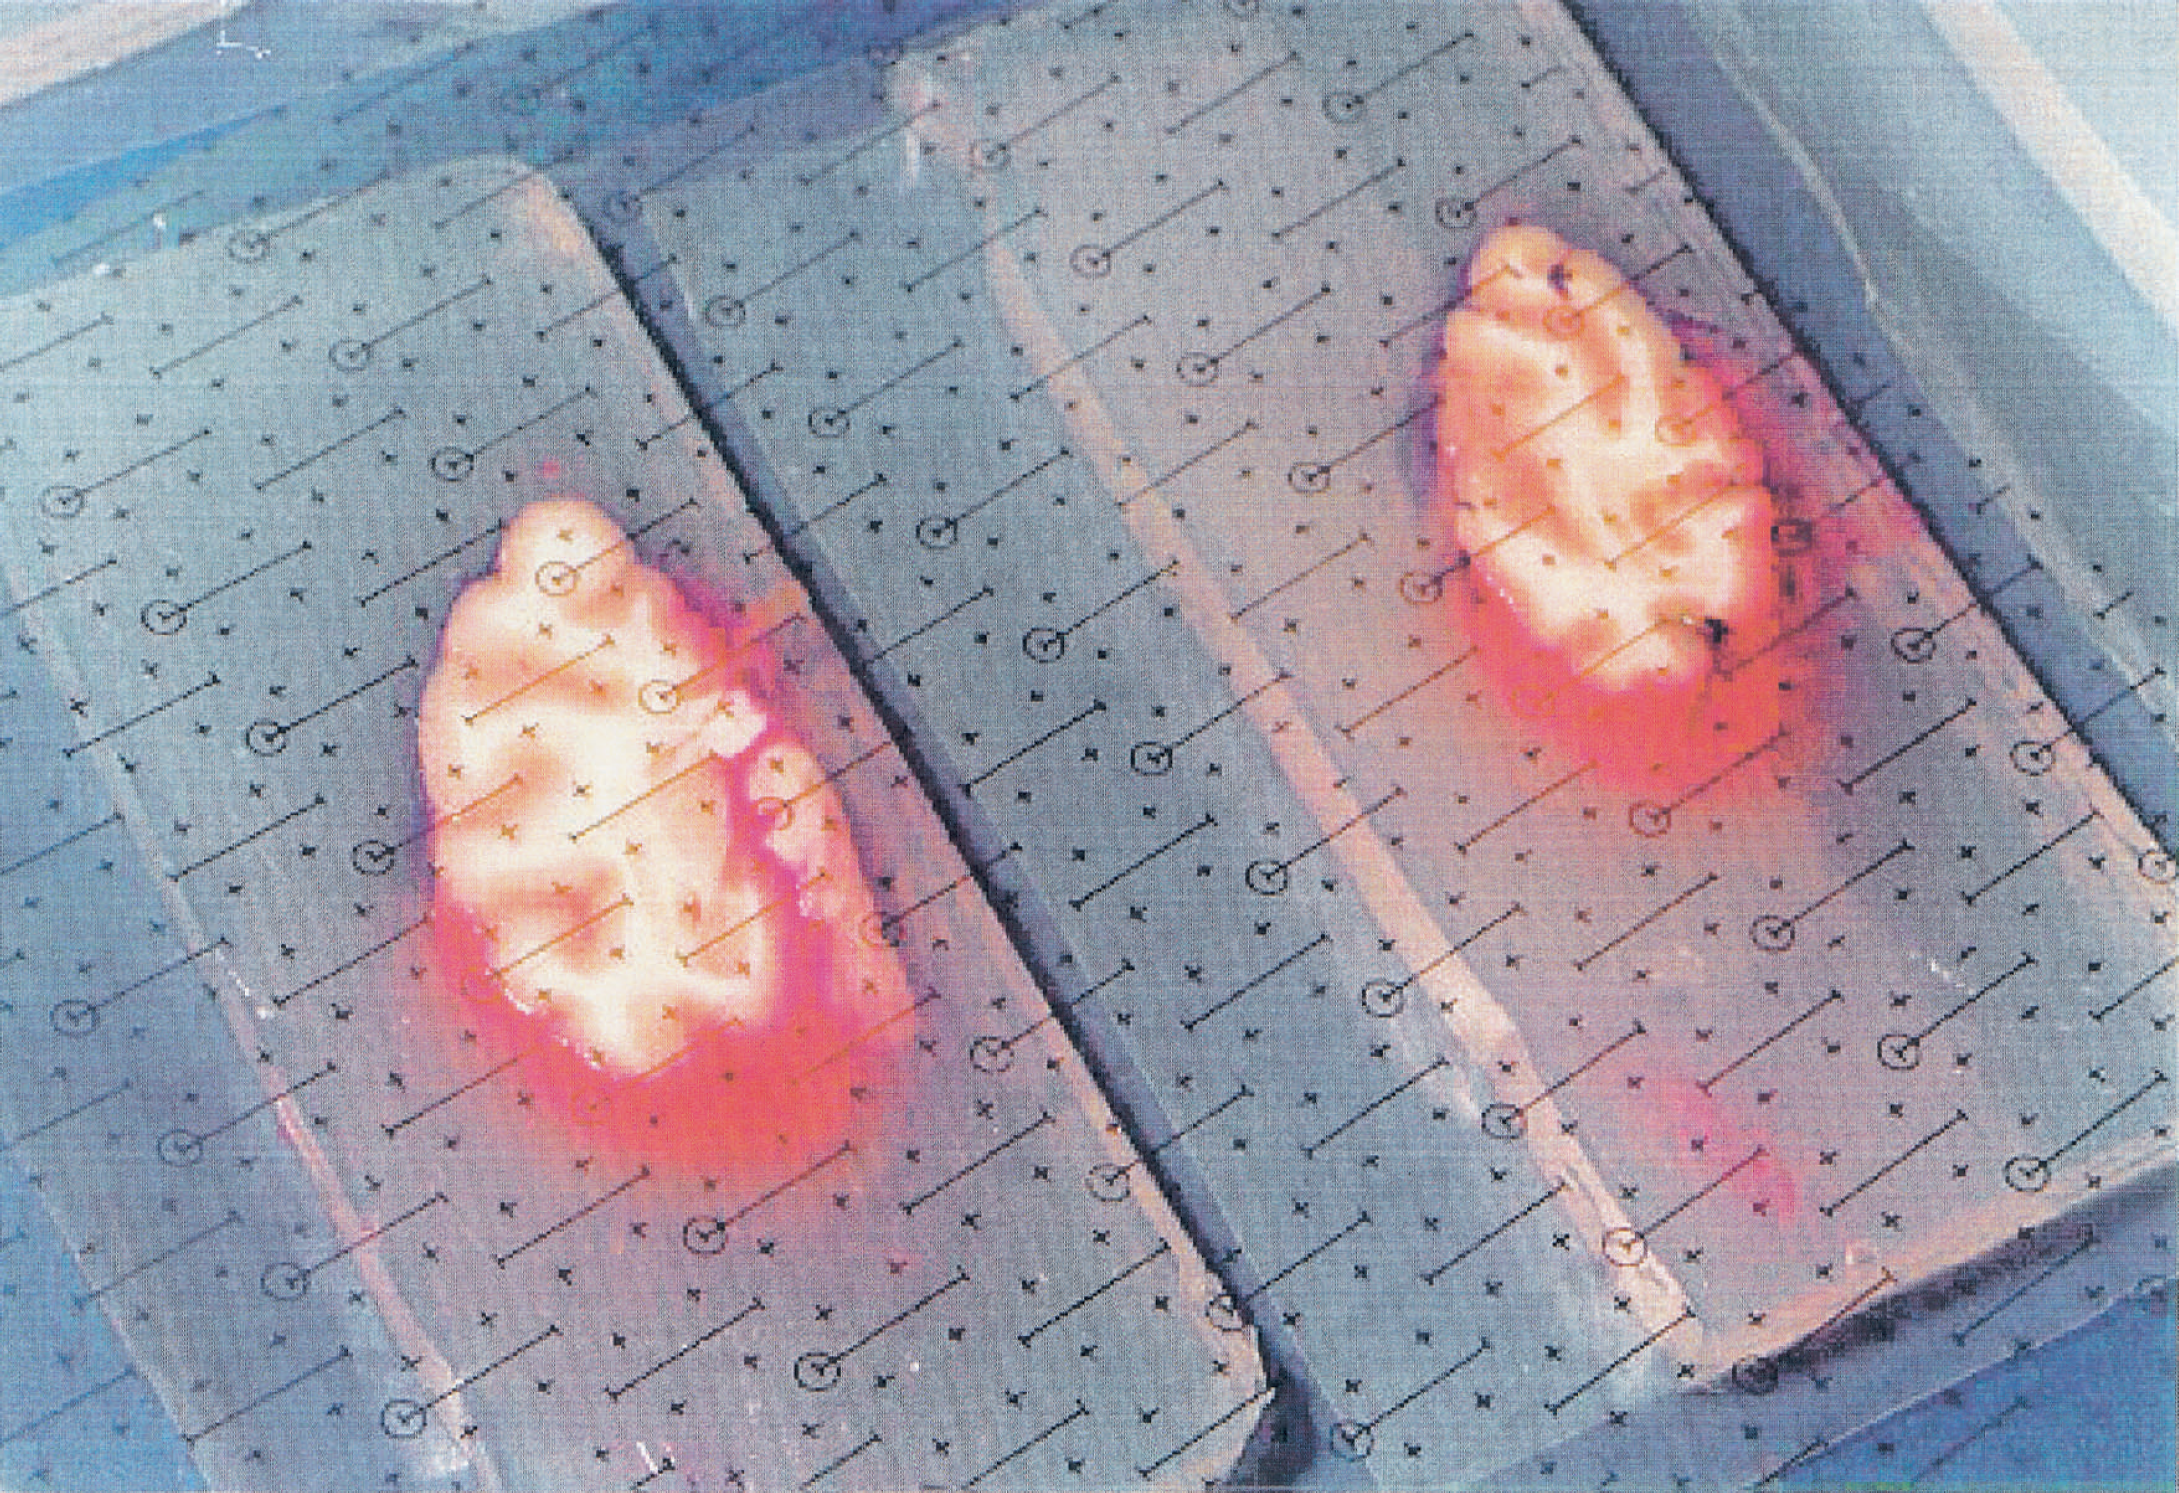
Two cerebral monkey tissue slices with the transparent counting grids used in the stereologic method.
PET data analysis
The arterial input function was corrected for radioactive decay to the start of the PET scan and calibrated to the PET tomograph. Corrections were also made for the delay, as previously described (Iida et al., 1988a,1986,1998). Dispersion occurring in the catheter tube was corrected by deconvolution assuming a single exponential dispersion function using a fixed dispersion time constant of 4 seconds. Delay was adjusted by fitting a simulated whole brain time-activity curve to a single tissue compartment model including the time shift (Iida et al., 1988a).
Dynamic PET images from the first 90 seconds were totaled, and quantitative CBF images were calculated according to the H215O autoradiographic method (Kanno et al., 1984; Raichle et al., 1983). In this analysis, the partition coefficient of water was assumed to be 0.80 (mL/mL), as suggested previously (Iida et al., 1991a).
Two ROIs (see below) were manually drawn on the anatomic MRI image after alignment to the autoradiographic CBF image using a method developed by Ardekani et al. (1996) and the ROI volumes were recorded. Particular attention was paid to match the ROI positions to the stereologic tissue segments. The ROIs covered the frontal and occipital poles and were limited in depth 18 mm from the cortical edge of the poles by a plane transversal to the hemispheric long axis (Fig. 2). From the cortex, the ROIs were extended approximately 10 mm further into the extracranial space to ensure that the spillover of the cerebral radioactivity counts were adequately sampled, particularly those from the cortical region. These ROIs were then projected onto the dynamic PET images to generate regional time-activity curves from all time frames. Two additional ROIs were manually drawn in the frontal and occipital regions of the autoradiographic CBF image. By reference to the coregistered MRI images the ROIs were selected with the intention of covering only the gray matter region at the same time minimizing the contribution from the white matter and extracerebral regions.
The generated time-activity curves were fitted with the four model equations described above. To investigate the optimal configuration among the four models, which included a different number of parameters, the Akaike Information Criteria (AIC) (Akaike, 1974) was calculated for all models as follows:
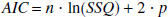
where n is the number of measurements, SSQ is the sum of squares between the model predictions and the measured tissue radioactivity concentration normalized for the variance in R, and p is the number of parameters.
Using the results obtained with the optimal Model (C, see below), the volumes of gray and white matter were calculated as the product of the fractional mass, αg or αw, and the volume of the relevant ROI divided by the tissue density (1.04 g/mL). These were then compared with the gray matter and white matter volumes obtained by the stereologic analysis for each of the two tissue segments. The reproducibility of the regional CBF values calculated by Model C was also evaluated.
Statistical analysis
All values were expressed as means and standard deviations. Multiple data sets were compared using Student's t-test, and P < 0.05 was considered to be significantly different.
Simulation
To investigate the sensitivity of the models described above to various error sources a series of simulation studies were performed.
Effects of delay adjustment errors
Because of a longer transit time in the axillary artery and in the catheter tube as compared with the carotid artery, the observed arterial time-activity curve was delayed typically by 3 to 5 seconds compared with the appearance of radioactivity in the brain. While the delay was estimated and corrected for, simulations were performed for the four models to evaluate the effects of errors in the delay adjustment.
Tissue radioactivity curves were generated using model Eqs. 1 or 3 and a measured input function from a typical study. Parameters were assumed as follows: f = 0.5 (mL·min−1·g−1); α = 0.8 (g/mL); fg = 0.80 (mL·min−1·g−1); fw = 0.20 (mL·min−1·g−1); αg = 0.3 (g/mL); αw = 0.3 (g/mL); p = 0.90 (mL/g); pg =1.0 (mL/g); and pw = 0.80 (mL·min−1·g−1). The arterial input function was shifted systematically from −4 to +4 seconds in 1-second steps and was used for parameter estimation using the four models. The errors were defined as a percentage difference of the estimated from the assumed values for each parameter.
Effects of dispersion correction errors
For the same reasons as for the delay adjustment, a correction was performed for the dispersion of the observed input function. This simulation was aimed at evaluating effects of dispersion correction errors. Using the same parameters as described above, tissue radioactivity curves were generated, and various input functions were simulated by convolving or deconvolving the assumed input function by a single exponential dispersion function using various dispersion time constants (Iida et al., 1986). The parameters were then estimated by applying the simulated input functions to Models A, B, C, and D. The errors were defined as a percentage difference of the estimated from the assumed parameters.
Effects of the arterial blood volume
The importance of the arterial blood volume component in cerebral H215O kinetics has been emphasized by Ohta et al. (1996) and Fujita et al. (1997). This simulation was therefore intended to evaluate the magnitude of errors by neglecting the arterial blood volume component. The simulation was performed for Models A, C, and D, all of which do not include the arterial blood volume component. The regional tissue radioactivity curves were simulated according to Eqs. 1 and 3 with VaCa(t) as an additional term, in which Va was varied from 0 to 0.02 mL/mL. Parameters were estimated according to the corresponding models without the Va term, and errors were calculated as a percentage difference of the estimated from the assumed values for various Va.
Effects of spillover from the pericranial muscles
In the current study, large ROIs were selected to ensure that the spillover of the cortical gray matter radioactivity was adequately sampled. Therefore, it is likely that radioactivity contribution from the pericranial skeletal muscles contributed to the ROI counts, particularly because these structures are quite thick in the subjects used for the current study (Macaca fascicularis monkeys). To estimate the error derived from the inclusion of this compartment tissue, radioactivity curves were generated according to Eqs. 1 and 3, and an additional time-activity curve representing muscle tissue radioactivity was added to each of these. The muscle time-activity curve was generated assuming a single-compartment model, a regional skeletal muscle flow of 0.05 mL·min−1·g−1, and a tissue-to-blood partition coefficient of 1.0 mL/g (Ruotsalainen et al., 1997). The fractional volume of the muscle varied from 0 to 0.40 mL/mL, and the generated tissue curves were fitted to the corresponding model equations. Errors were then defined as a percentage difference of the estimated from assumed parameters. This simulation was performed for model configurations A, C, and D.
Effects of assuming a fixed white matter flow
In the model configuration C, the white matter flow (fw) was fixed at 0.20 mL·min−1·g−1. This simulation evaluated the magnitude of error in the estimated parameters when the true fw differs from the assumed value. Tissue radioactivity curves were generated according to Eq. 3 for various fw values ranging from 0.1 to 0.3 mL·min−1·g−1, and parameters were calculated by assuming fw = 0.20 mL·min−1·g−1 according to the Model C procedure. Errors were then defined as a percentage difference of the estimated from the assumed parameters.
RESULTS
Figure 4 shows typical fits of the model curves to the measured tissue radioactivity concentrations in the occipital pole region. It is apparent that Models C and D provide a better fit than Models A and B, particularly around the peak of the tissue curve. It can also be seen that there are no clear differences between Models A and B, and that there is no apparent improvement by including the arterial blood volume term (Va) in the fit for this region. It can also be seen that there is no clear difference between Models C and D.
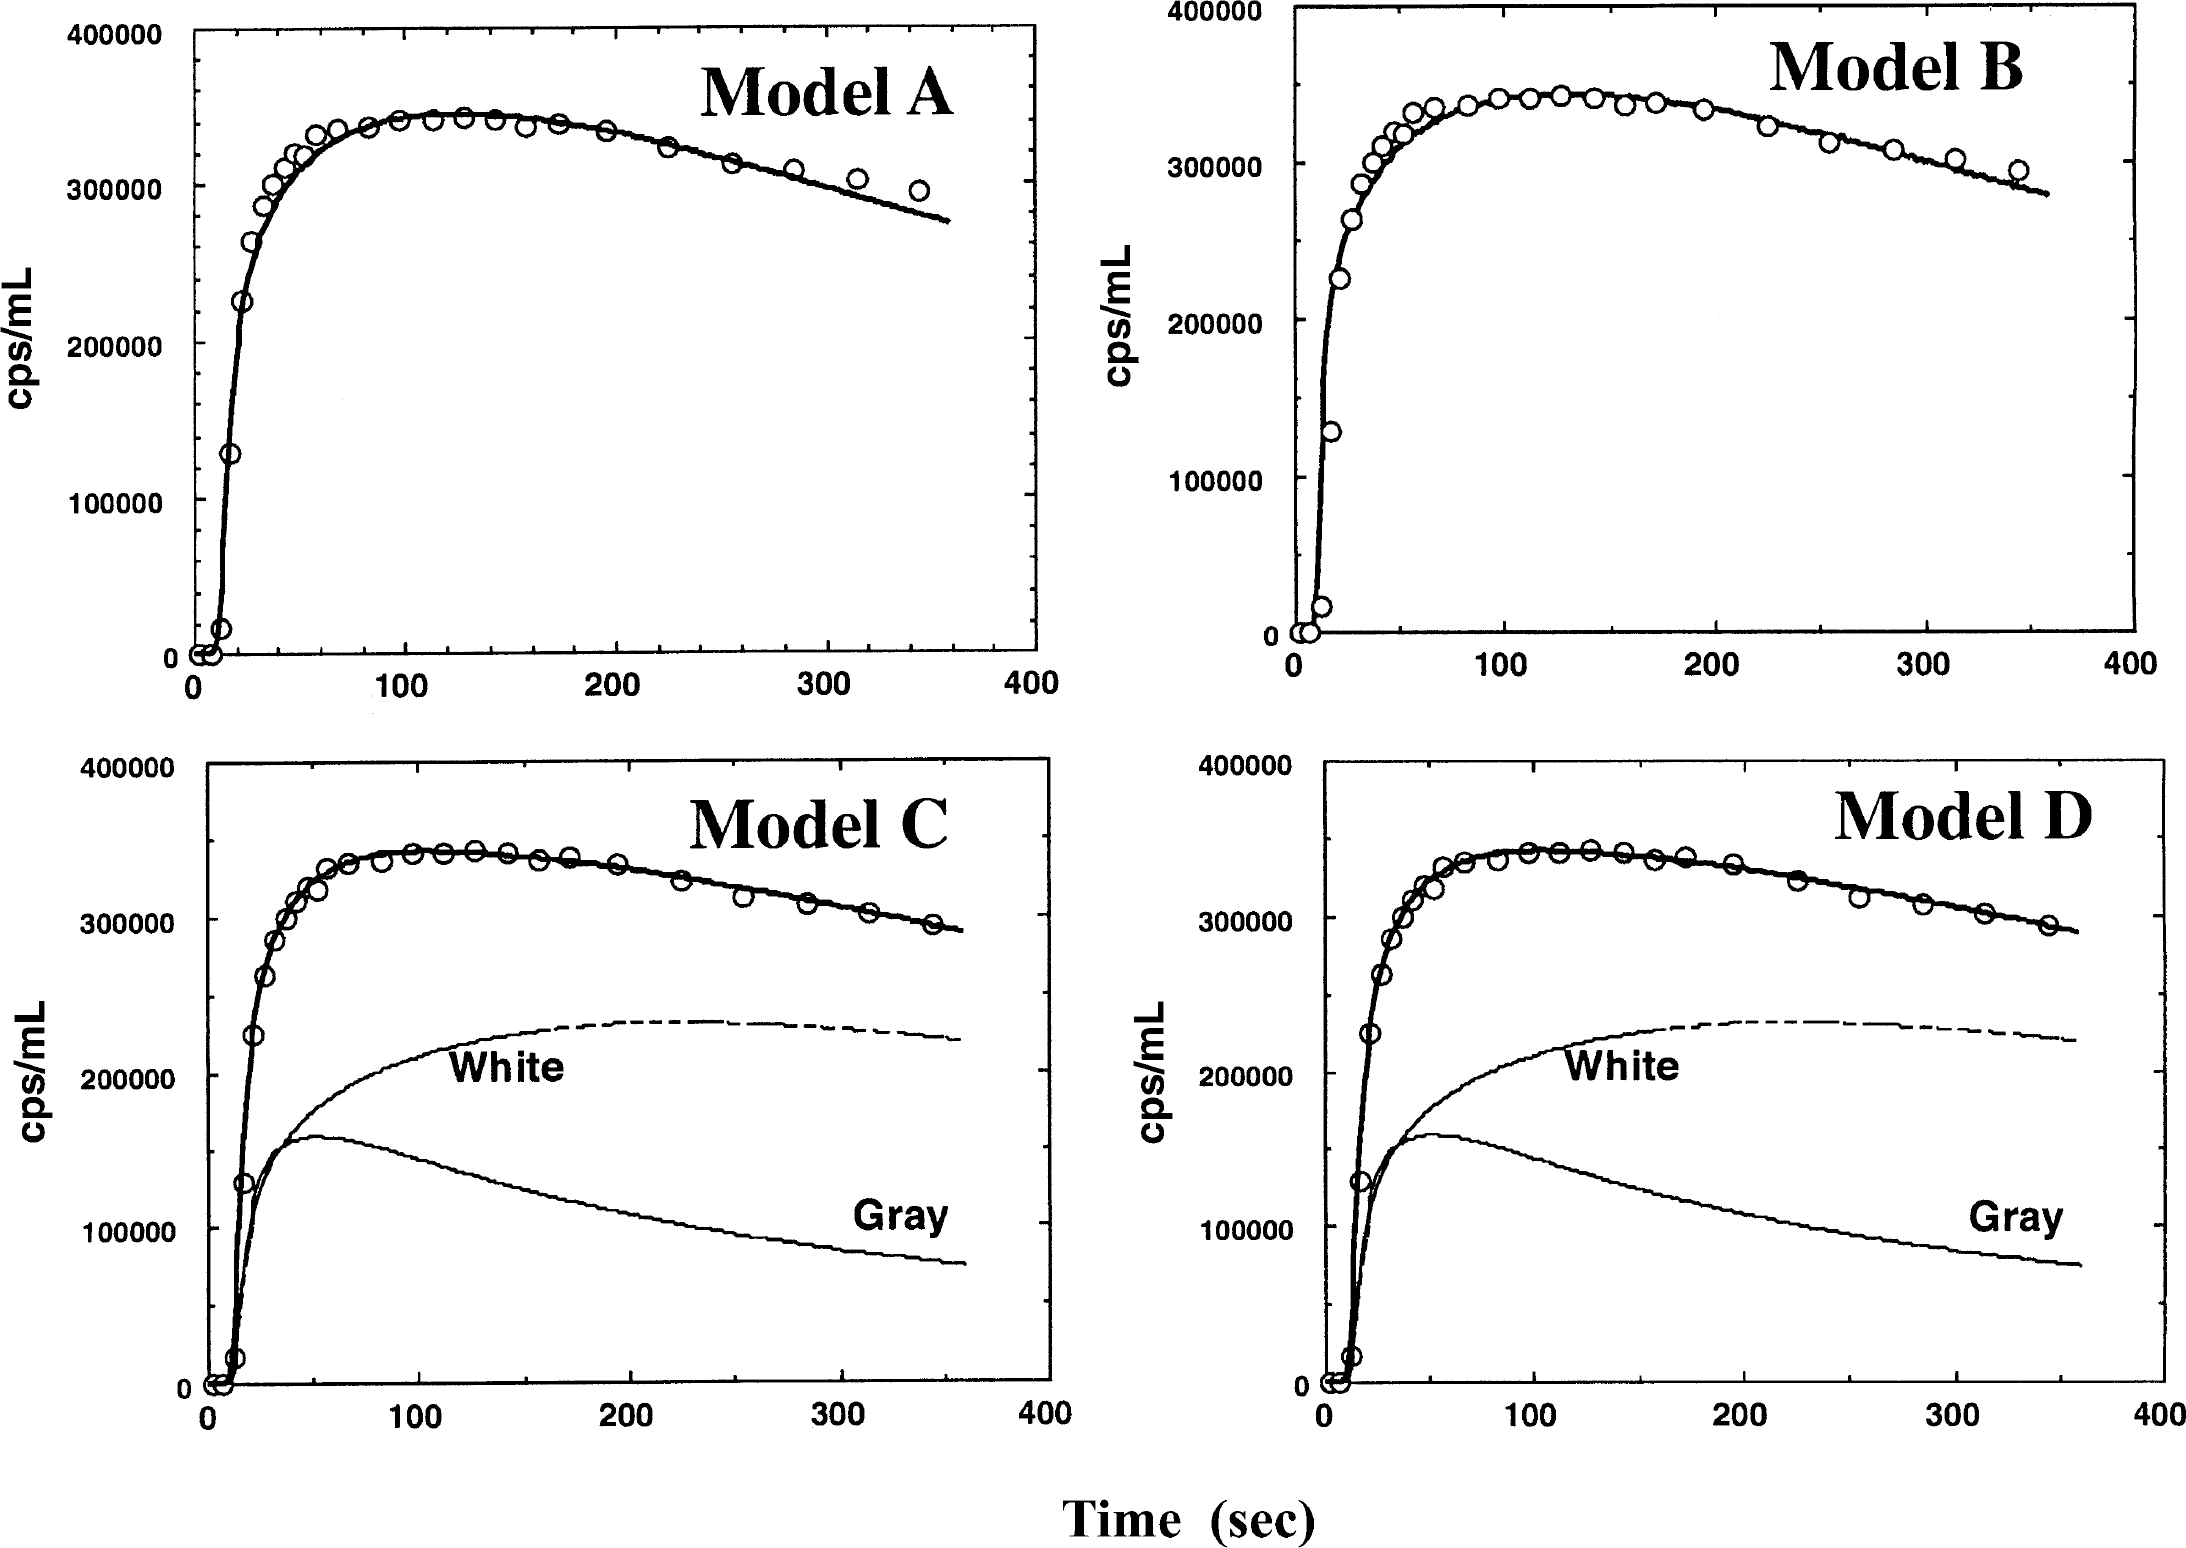
Fit of the four different models tested to the observed regional tissue radioactivity curve obtained from a typical region of interest located in the occipital region.
Results from the kinetic analysis are summarized in Table 1. The f and α values obtained by Models A and B were significantly different (P < 0.001 and P < 0.02, respectively), and Va in Model B was significantly greater than zero (P < 0.05). However, f and α were different by only 0.003 mL·min−1·g−1 and 0.004 g/mL, respectively (< 1%). Va was also small and close to zero. The estimated fg values from Models C and D were significantly greater than f values obtained by Models A and B (P < 0.001) by a factor of approximately 2, but not significantly different from each other. No significant difference was observed in the αg values between Models C and D. However, the fw values by Model D (0.11 ± 0.07 mL·min−1·g−1), despite a large variation, were significantly smaller than the value assumed in Model C (that is, 0.2 mL·min−1·g−1; P < 0.01). It should be noted that assuming fw = 0.11 mL·min−1·g−1, fg decreased approximately 10% and αg and αw increased by approximately 20% and 10%, respectively. The estimated values of fg, αg, and αw showed larger standard deviations for Model D as compared with Model C. It should also be noted that the sum of αg and αw obtained from Models C and D (0.58 ± 0.08 g/mL and 0.80 ± 0.22 g/mL, respectively) was significantly greater than the α values obtained with A and C (0.45 ± 0.03 g/mL; P < 0.05). The white matter volume determined by Models C and D was 8.3 ± 1.1 mL and 10.6 ± 4.0, respectively, and these values were significantly greater than those obtained by stereologic analysis (2.0 ± 0.5 mL; P < 0.001).
Summary results of the kinetic analysis or the H215 O kinetic data with various models
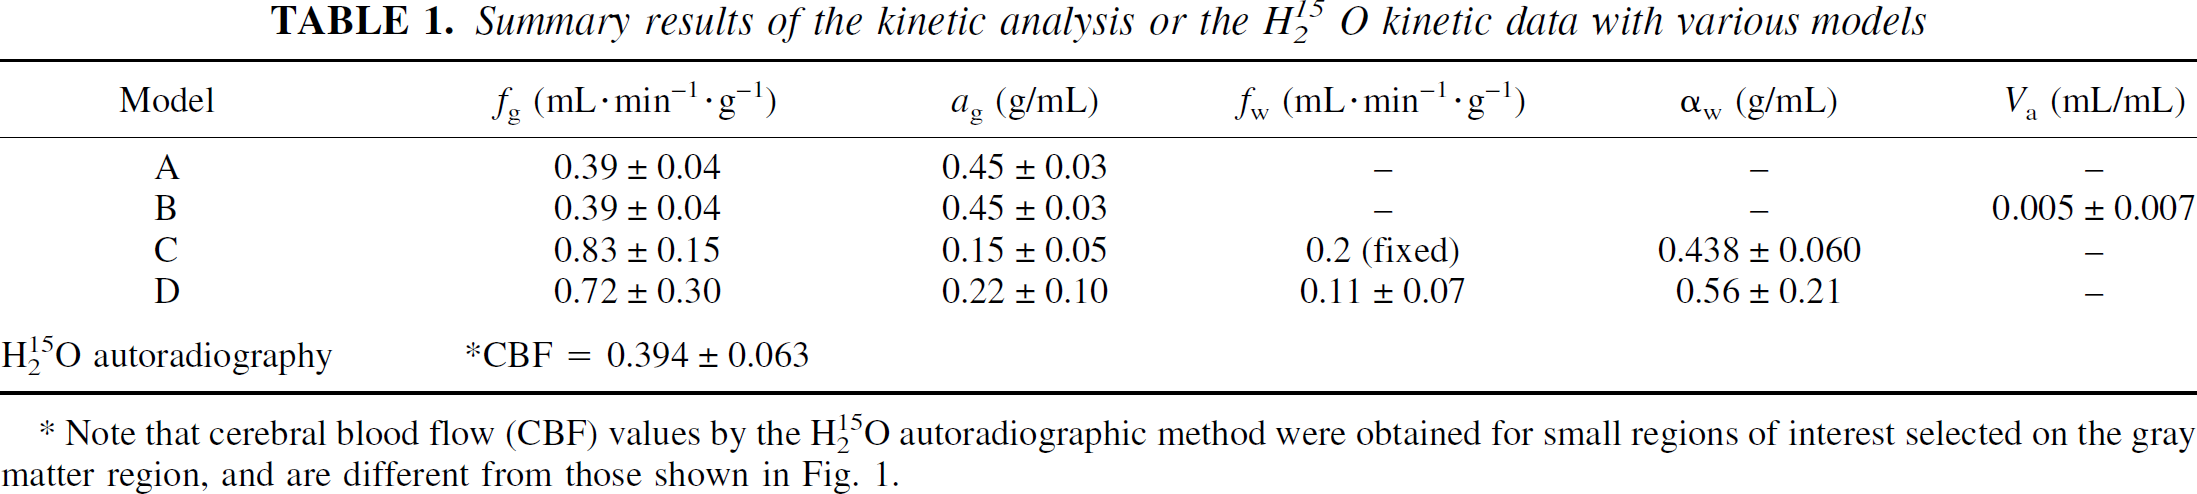
Note that cerebral blood flow (CBF) values by the H215O autoradiographic method were obtained for small regions of interest selected on the gray matter region, and are different from those shown in Fig. 1.
Although at first the CBF values from Models A and B appear similar to those obtained by the autoradiographic method (Table 1), it is important to note that the values for Models A and B were obtained for a large ROI, whereas the autoradiographic results are derived from a carefully drawn cortical region to reduce contributions from extracortical regions. The autoradiographic technique without PVE correction measures the influx rate-constant of water into the volume defined by the ROI. For the large ROI the influx rate-constant can be estimated from the product of f and α for Models A and B as 0.18 ± 0.02 mL/min, which would be the flow estimated for this large ROI by the autoradiographic technique. The flow values from Models A and B are low because average gray and white matter flow is estimated in the large ROI, whereas the autoradiographic flow from the cortical region is low because of the PVE.
Results of the AIC calculations obtained for the four different models are summarized in Table 2. The AICs were not significantly different between Models A and B, nor between Models C and D. However, the AIC values from Models C and D were significantly smaller than those from Models A and B (P < 0.001), thus suggesting the importance of considering the two compartments of the ROI.
Comparison of the Akaike's Information Criteria
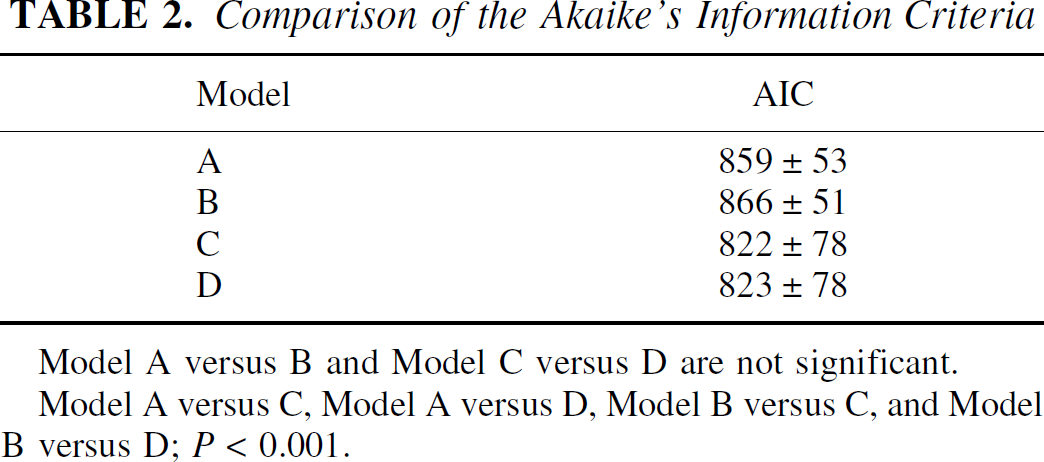
Model A versus B and Model C versus D are not significant.
Model A versus C, Model A versus D, Model B versus C, and Model B versus D; P < 0.001.
Figure 5 shows the total gray matter volume estimated by H215O PET using Model C for the two ROIs compared with the corresponding stereologic volume. The PET (2.45 ± 0.83 mL) volumes were significantly smaller (by 42%) when compared with the stereologic measurements (4.24 ± 1.18 mL). However, there was significant correlation between the volumes derived by the two methods (Y = 0.74 + 0.40×; P < 0.05).
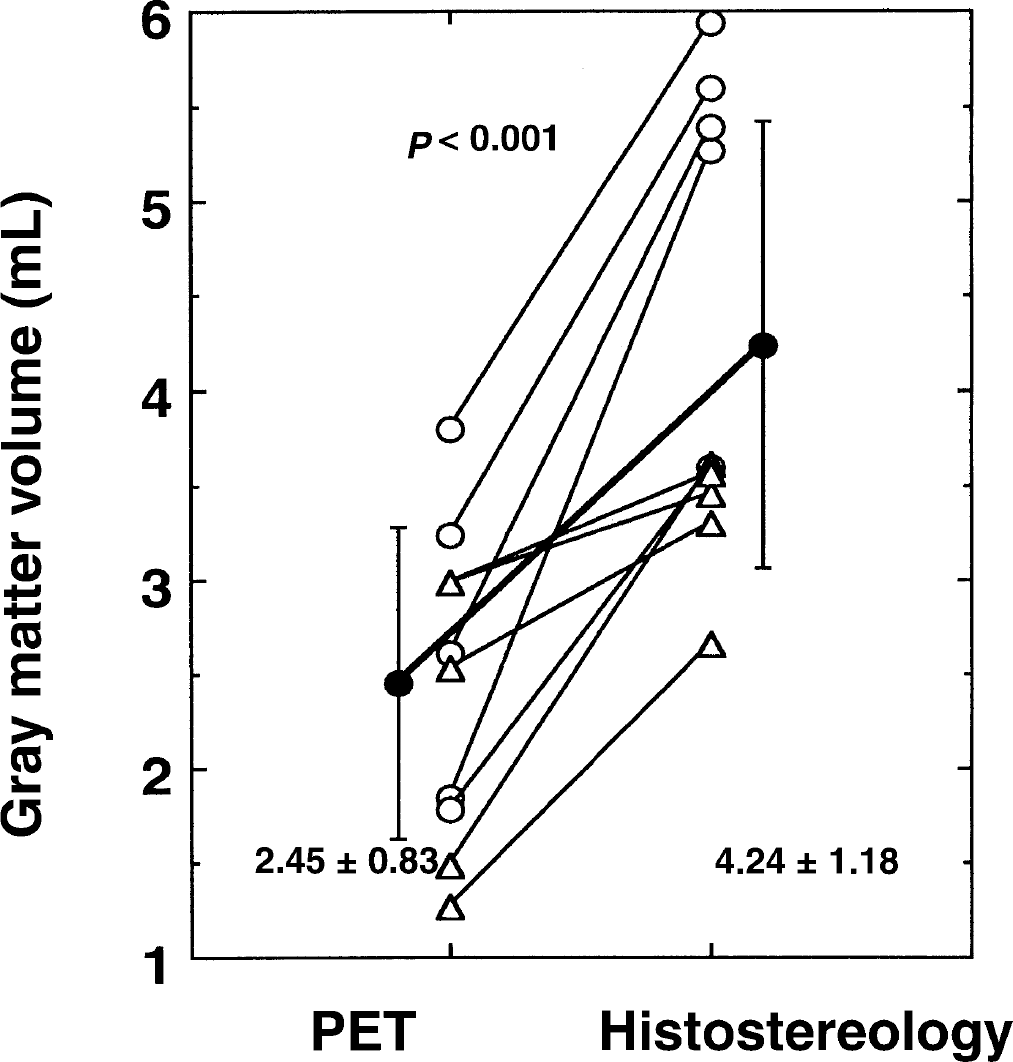
Comparison of the gray matter volumes obtained with positron emission tomography and H215O with stereologic volumes. There was a significant difference (approximately 40%) between the two measurements (P < 0.001).
Figure 6 shows the reproducibility of fg and αg values calculated using Model C, in which values between the first and second scans (and the second and third scans if present) were compared with each other. On average, the values agreed between the scan pairs with a variation of 2.86 ± 10.95% for fg and 4.28 ± 16.80% for αg.
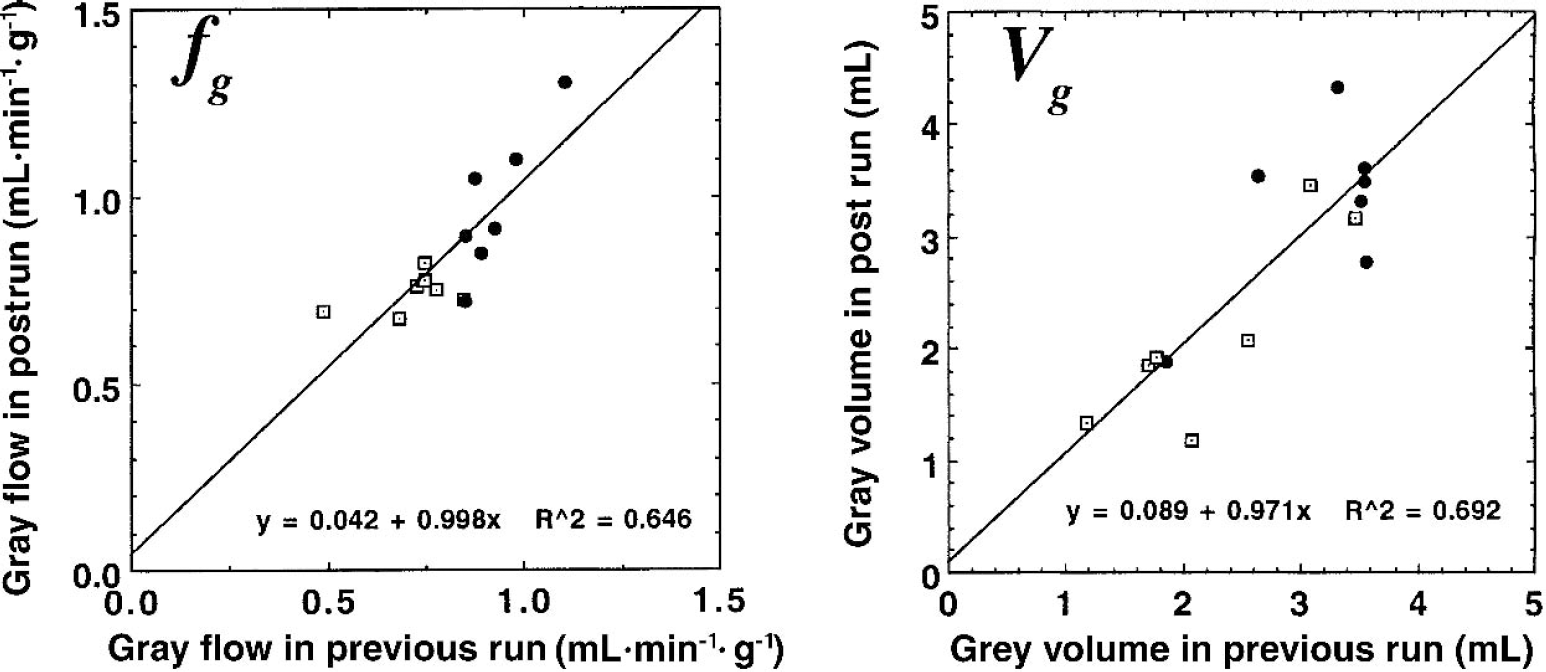
Reproducibility of gray matter cerebral blood flow (fg) and gray matter tissue volume (Vg) values obtained using Model C to fit the dynamic positron emission tomography data for the frontal lobe ROIs (●) and occipital lobe regions of interest (□).
The simulated tissue radioactivity curves derived from Eq. 3 with parameter values described as above are shown in Fig. 7. To characterize the parameter sensitivity of the curves they were plotted by varying fg, fw, αg, and αw by ± 10%. Changes in fw have only a small contribution to the scaling of the tissue curves.
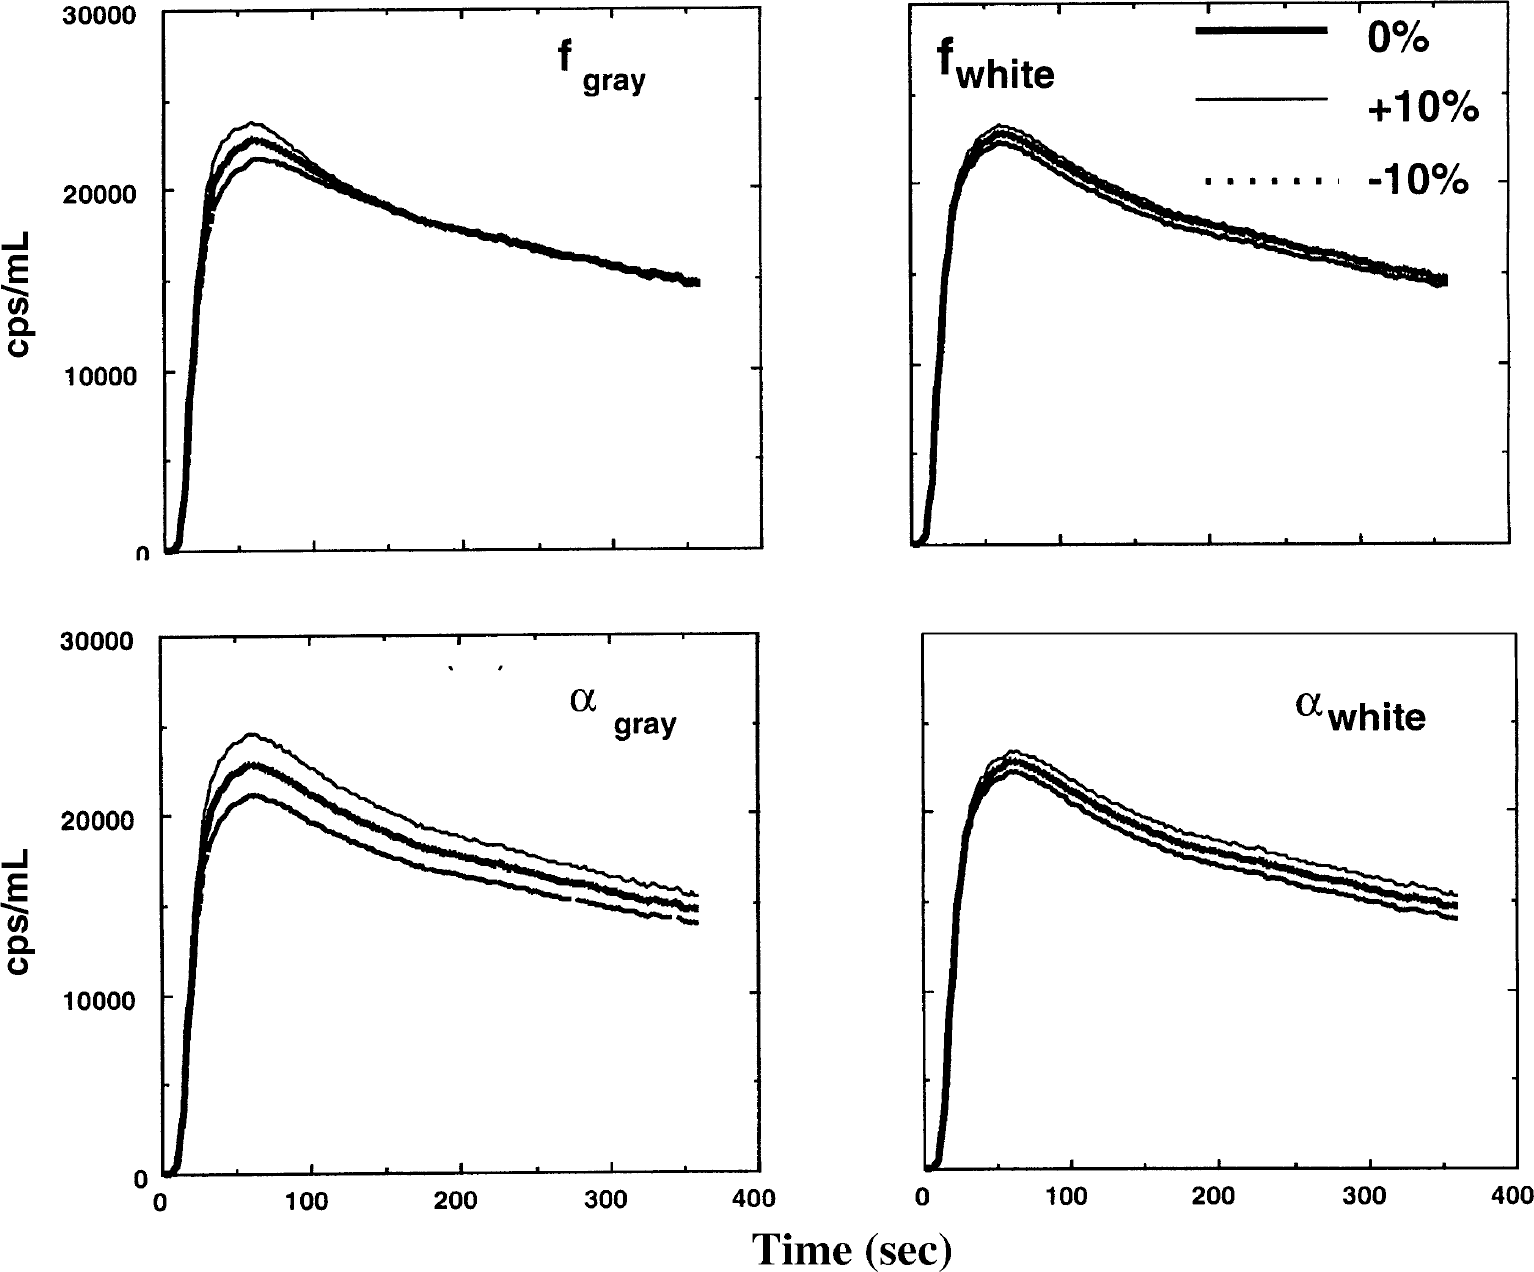
Simulated tissue time-activity curves in regional cerebral tissue after intravenous H215O administration. Each of the parameters fg, fw, αg, and αw, changed by ±10% in each plot. The time-activity curves are only slightly sensitive to a change in fw.
Figures 8 to 12 show results from the simulation studies demonstrating the effects of delay adjustment errors (Fig. 8), the effects of dispersion correction errors (Fig. 9), the effects of the arterial blood volume component (Fig. 10), the effects of the pericranial skeletal muscle volume fraction (Fig. 11), and the effects of errors in the assumed white matter flow values in Model C (Fig. 12).
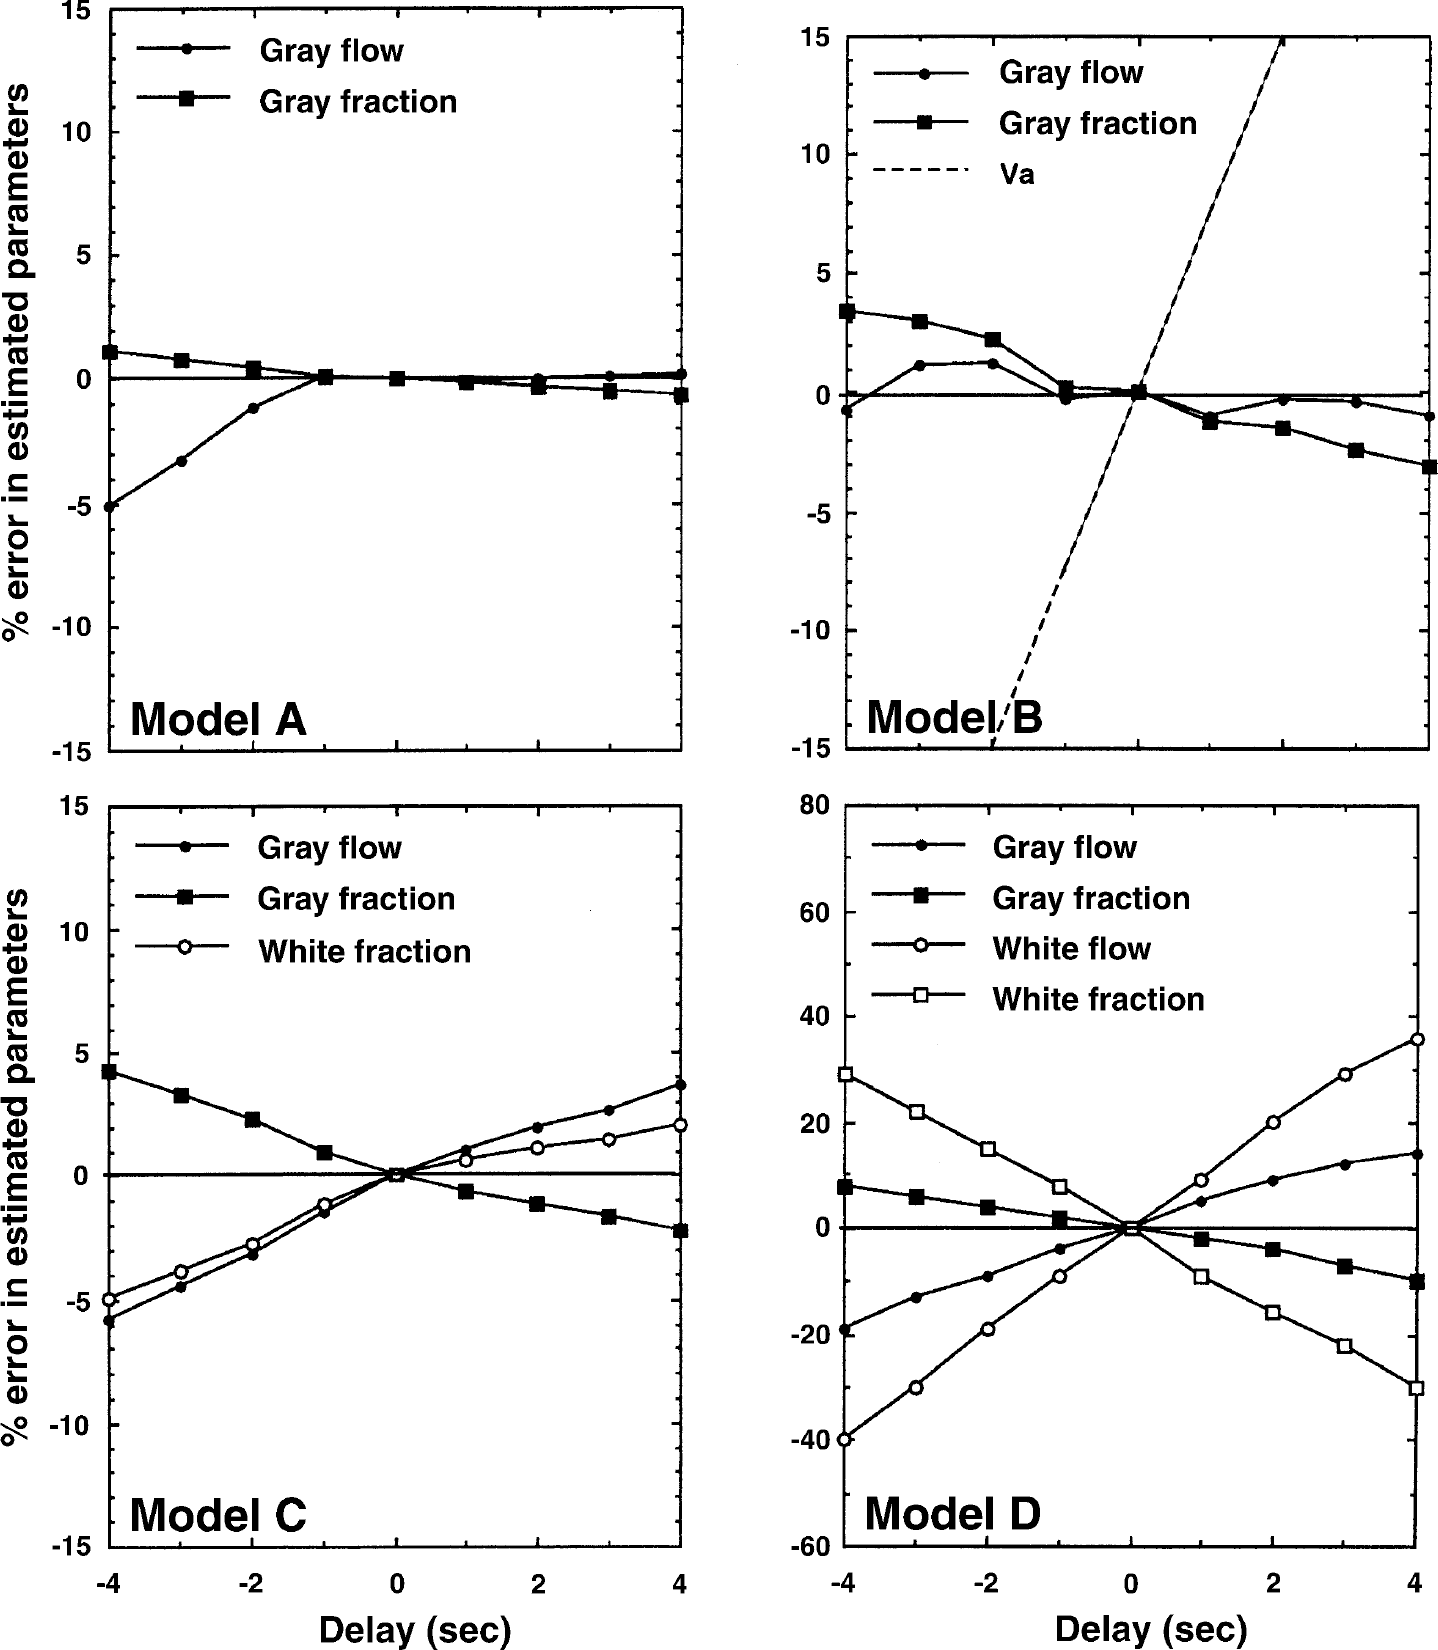
Results from a simulation study demonstrating the effects of input function delay errors on the estimated parameters for Models A, B, C, and D.
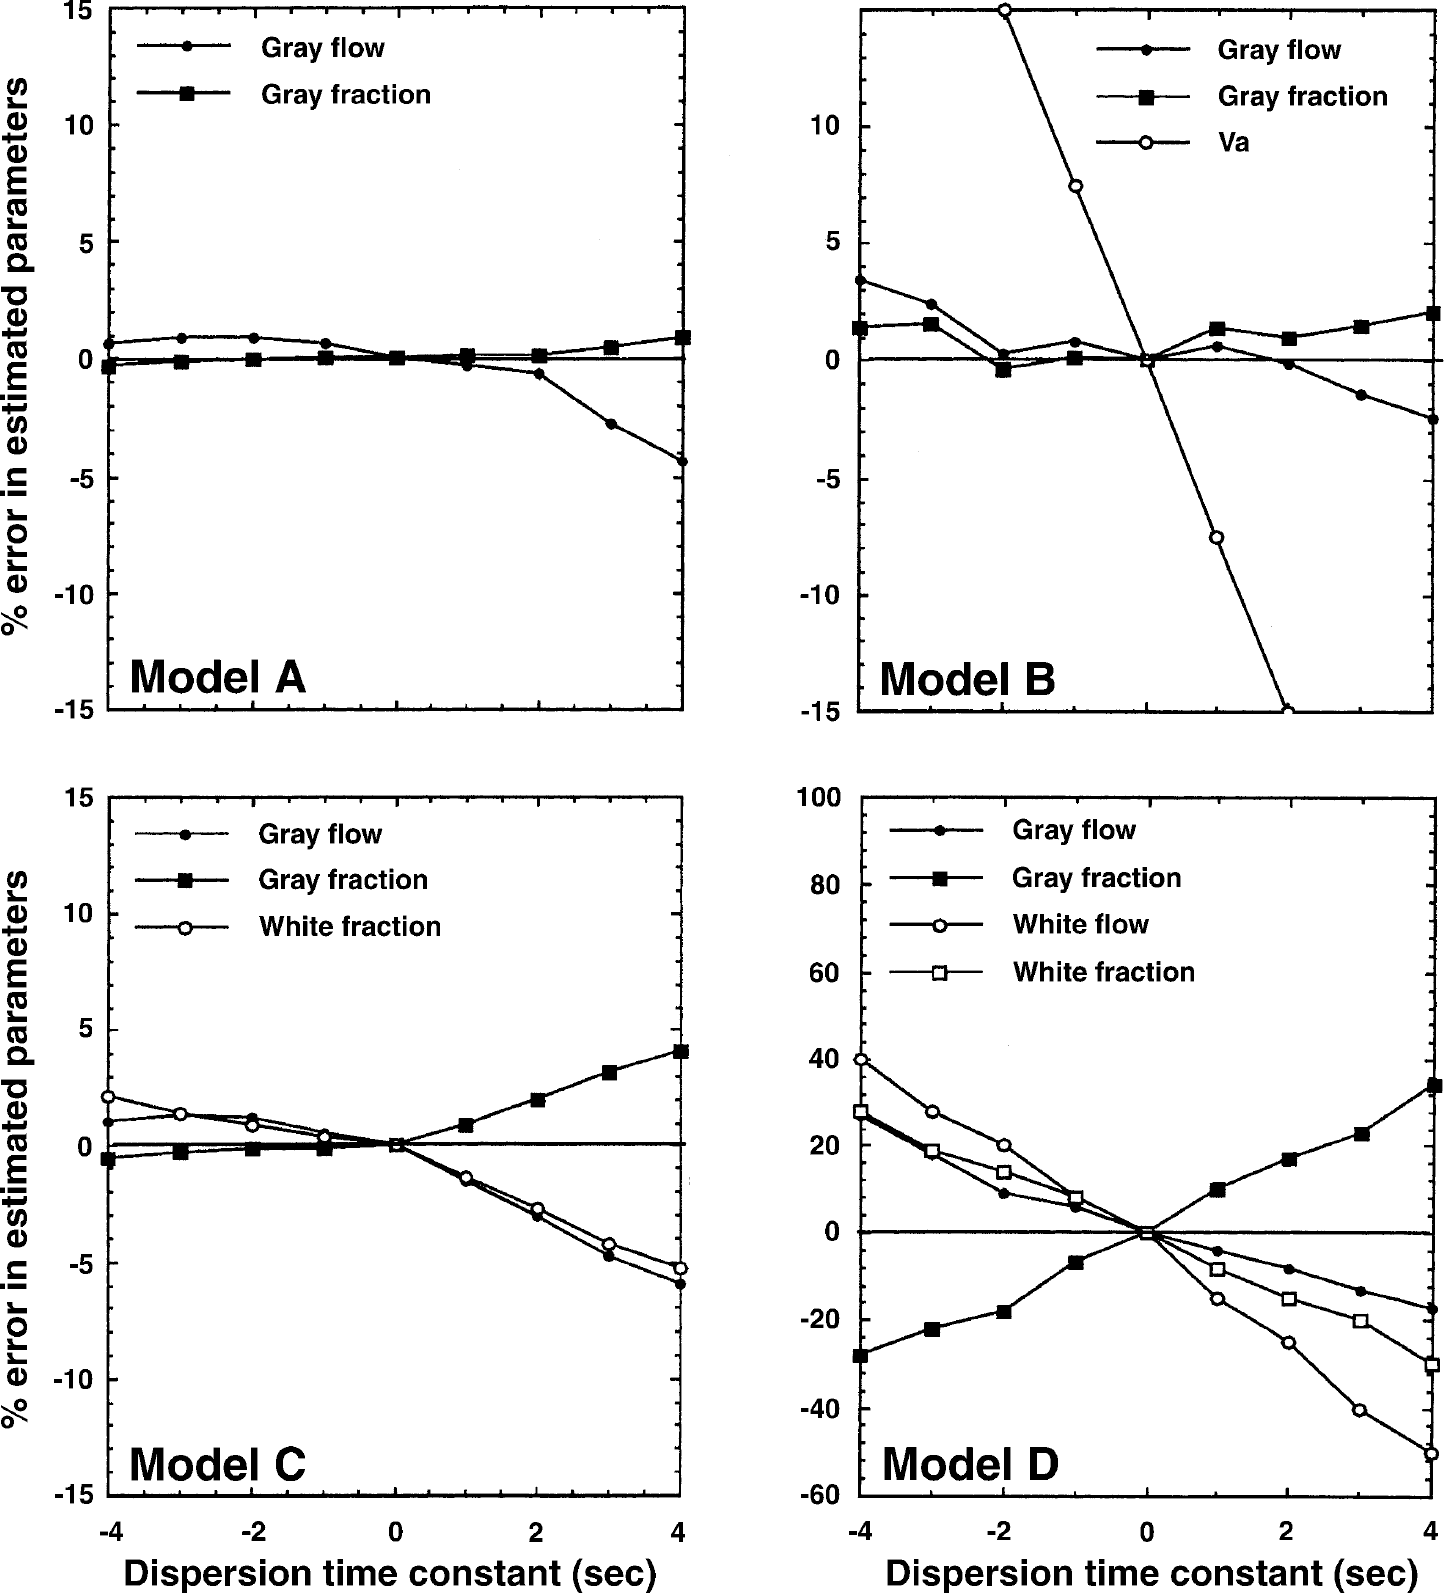
Results from a simulation study demonstrating the effects of errors in dispersion correction. Errors in the estimated parameters are plotted as a function of the dispersion time-constant. A negative dispersion time-constant corresponds to an overcorrection, and a positive time-constant corresponds to an undercorrection of the dispersion. This simulation was performed for Models A, B, C, and D.
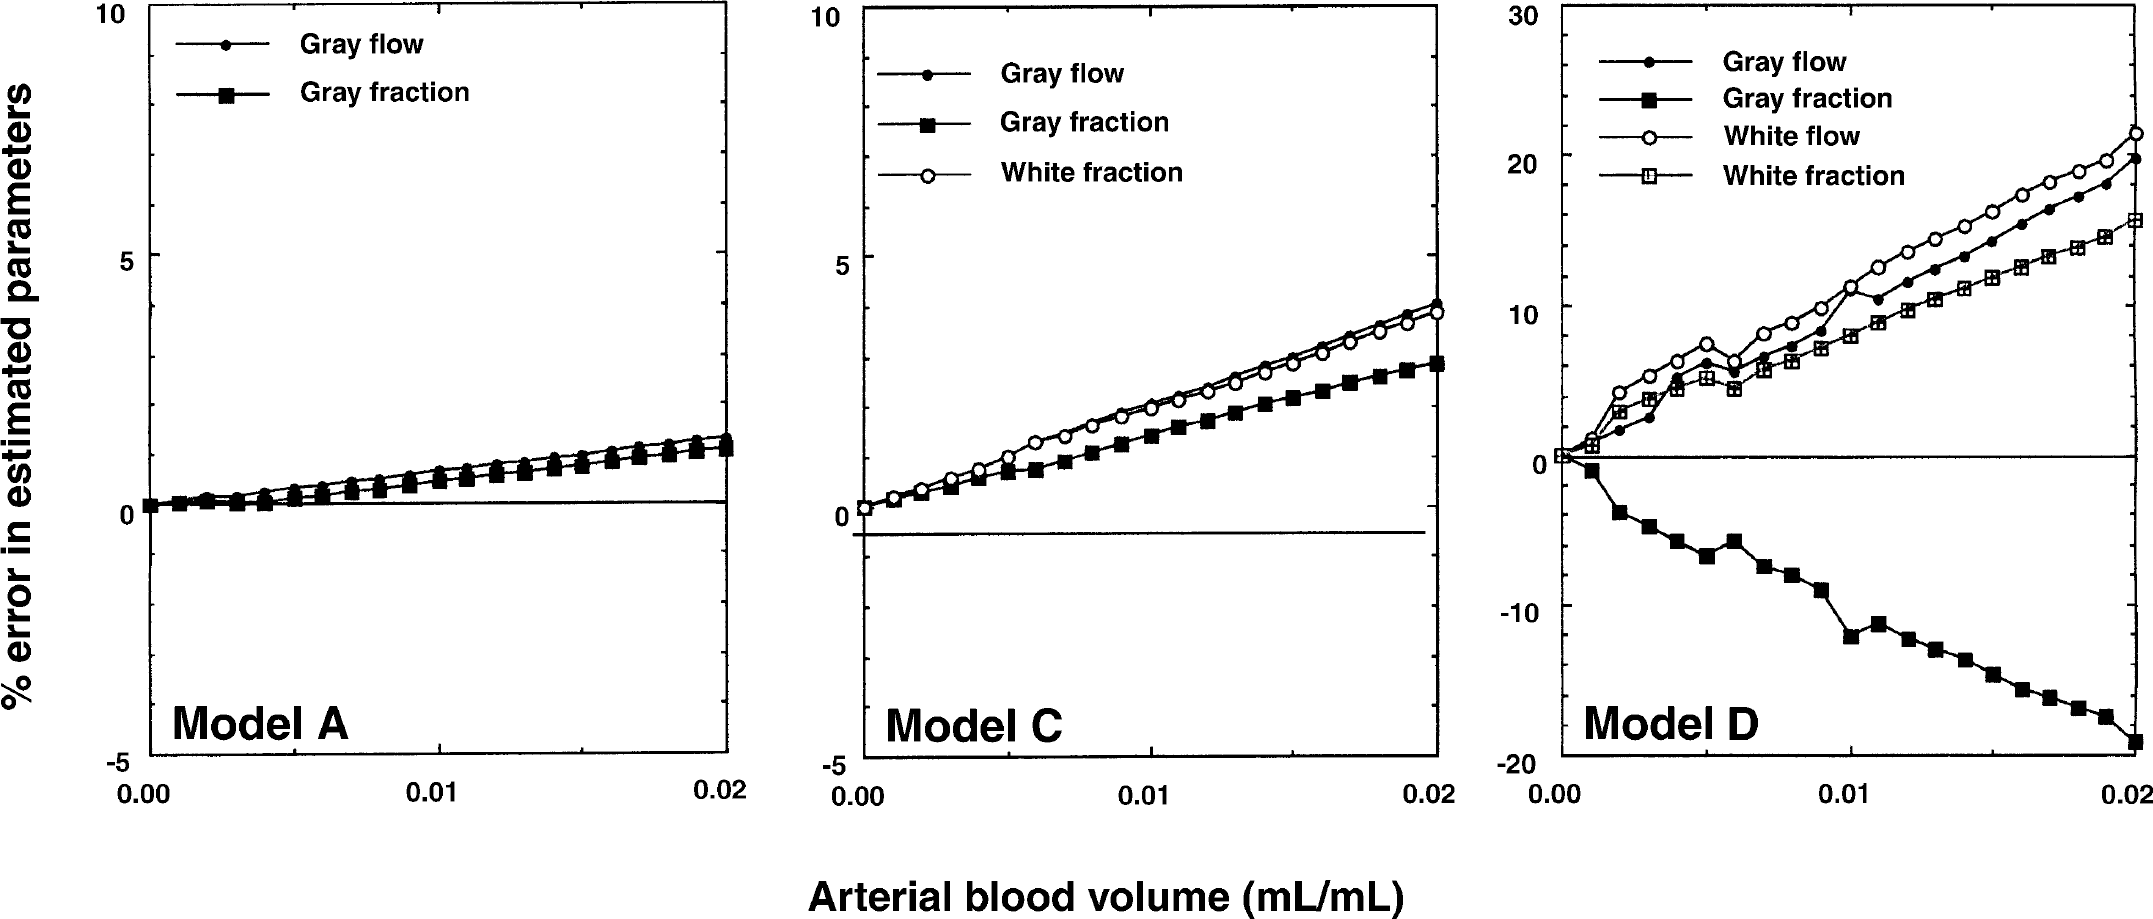
Results from a simulation study performed using Models A, C, and D demonstrating the effects on the estimated parameters of the arterial blood volume contribution. The irregular shape of the curves using Model D is caused by model instability.
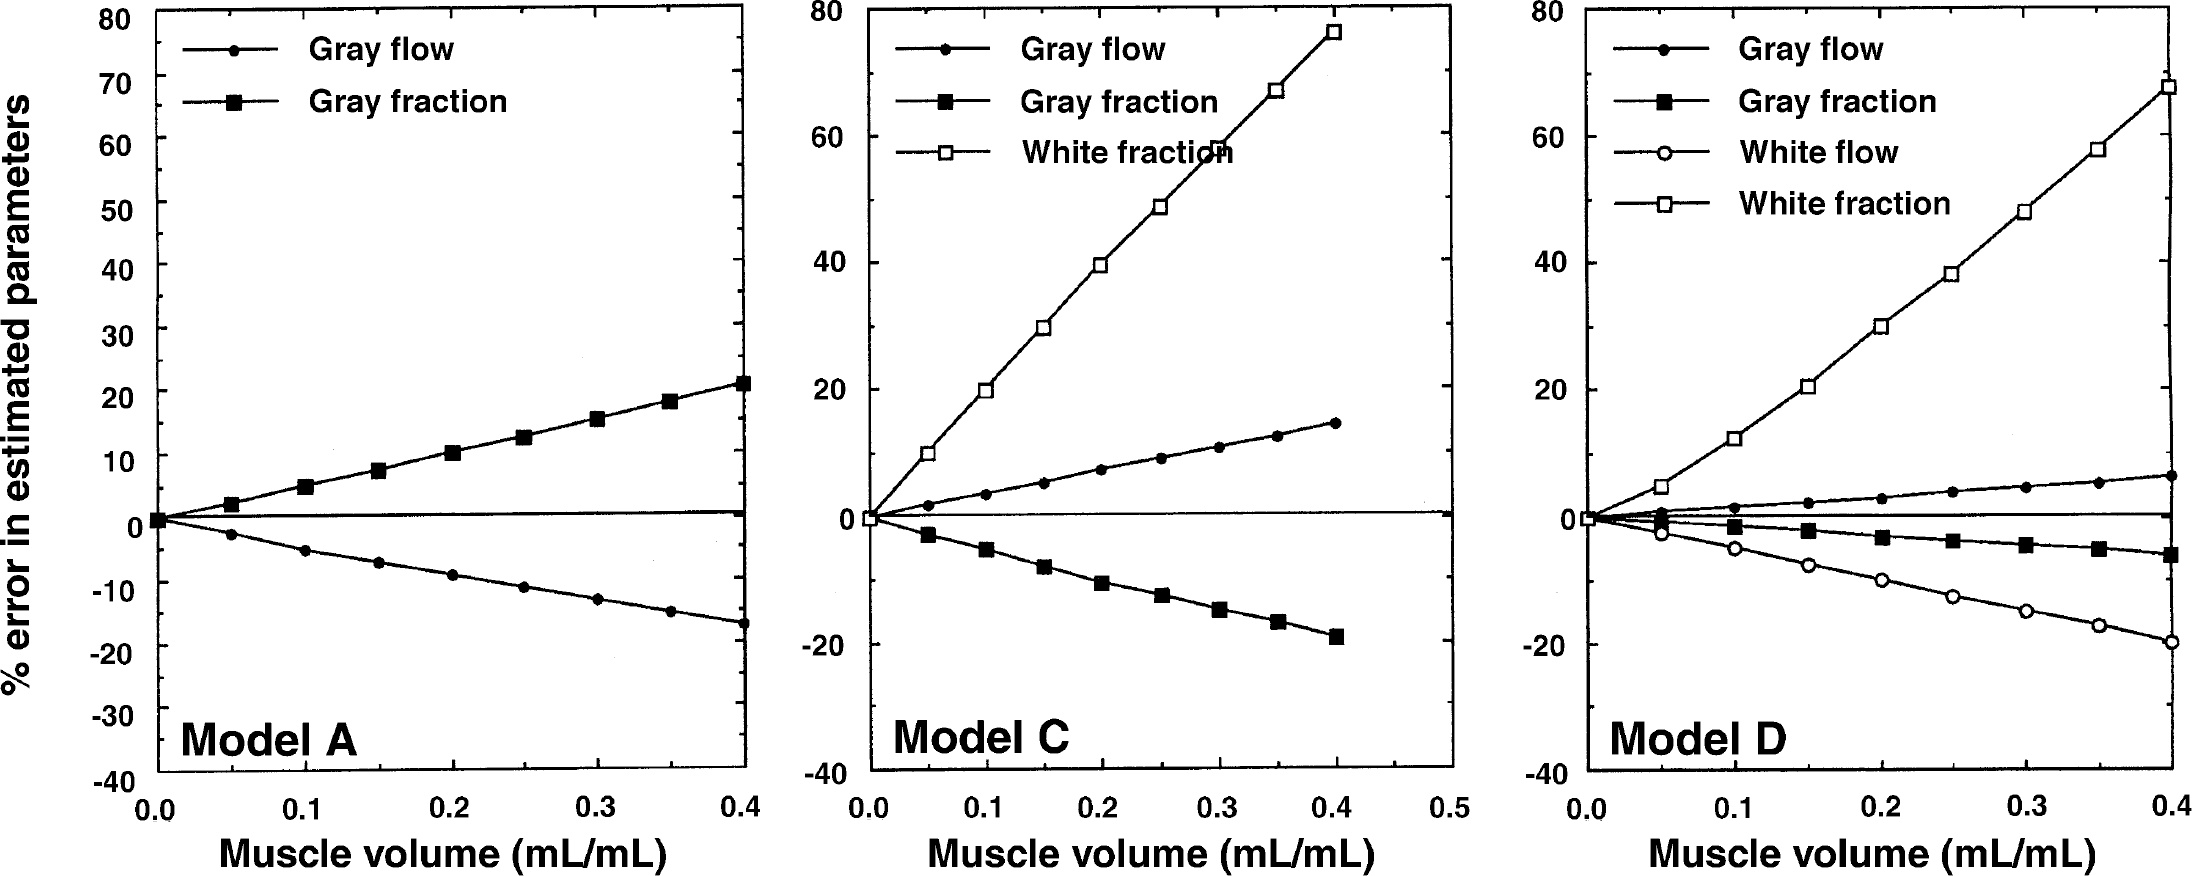
Results from a simulation study using Models A, C, and D demonstrating the influence of the pericranial muscle volume fraction on the estimated parameters.
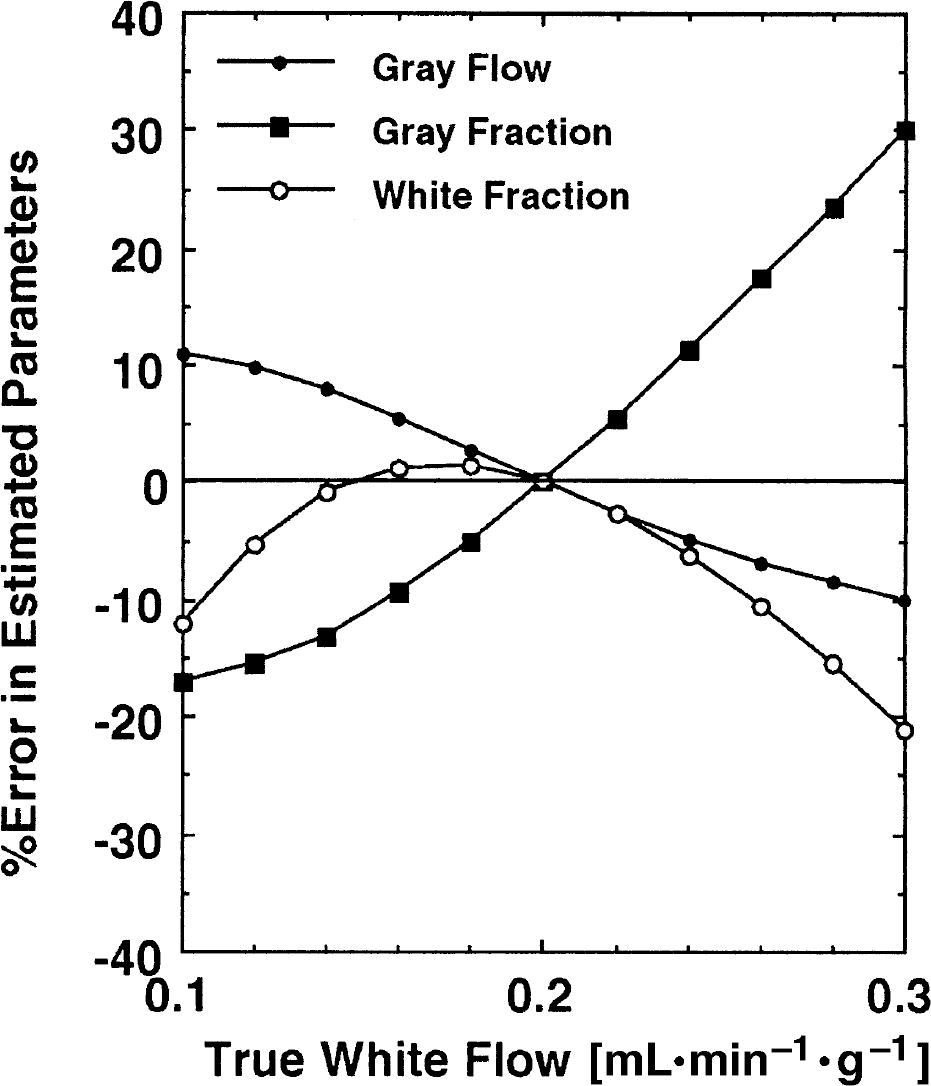
Results from a simulation study demonstrating the errors of the estimated parameters in which the true white matter cerebral blood flow deviate from the fixed value (0.2 mL·min−1·g−1) assumed in Model C.
It can be seen that error sensitivity to delay and dispersion tends to increase with the number of model parameters. The largest sensitivity is observed using Model D. For Model C, a delay adjustment error or a dispersion time-constant error of ± 2 seconds induced an error of ± 2–3% in fg and αg.
Errors caused by exclusion of an arterial blood volume component in Models A and C were small, and yielded errors less than 3% for Va less than 0.02 mL/mL.
The influence of skeletal muscle tissue with a blood flow of 0.05 mL·min−1·g−1 appeared to be rather large, particularly on the estimation of αw in Models C and D. The αw was systematically overestimated by 30% for a muscle volume fraction of 0.2 mL/mL in Models C and D. In Model C the gray matter fraction (αg) was underestimated, but was less than 10% if the muscle volume fraction was less than 0.2 mL/mL. The gray flow (fg) had a relatively small sensitivity to spillover of the muscle tissue, and errors for Models C and D were less than 5% if the muscle volume fraction was less than 0.2 mL/mL.
As shown in Fig. 12, large errors can be introduced in the estimated value of αg using Model C if the white matter CBF is different from the assumed value of fw = 0.2 mL·min−1·g−1. However, the magnitude of the errors wwa less than 10% if the true fw differed less than 15% from the assumed value. The errors in gray matter CBF (fg) were less than 10% even when the true fw differed by 20%.
DISCUSSION
Effects of PVE correction on CBF
A number of studies of CBF in normal humans using a variety of techniques have been reported over the last fifty years. From the invasive studies using inert gases of N2O, 85Kr, and 133Xe, it has been widely accepted that the CBF averaged for the whole brain is approximately 0.5 mL·min−1·g−1 (Lassen, 1995). In addition, measurements of the clearance slope after an intracarotid injection of 133Xe in saline suggested that there were two major components in CBF, a fast component with a flow ranging from 0.80 to 0.87 mL·min−1·g−1, and a slow component ranging from 0.21 to 0.24 mL·min−1·g−1 (Høedt-Rasmussen, 1965; Høedt-Rasmussen et al., 1966; Ingvar et al., 1965; Sveinsdottir, 1965; Sveinsdottir et al., 1971; Wilkinson et al., 1969), which have been referred to as the gray matter and the white matter CBFs, respectively.
However, studies using PET yield regional CBF values of approximately 0.40 to 0.55 mL·min−1·g−1 in the cortical gray matter regions of normal subjects (Hatazawa et al., 1995; Iida et al., 1998; Kanno et al., 1987; Leenders et al., 1990; Pantano et al., 1984; Yamaguchi et al., 1986). Using 123I-iodoamphetamine and SPECT, Hatazawa et al. (1997) also reported a regional CBF of approximately 0.35 mL·min−1·g−1 in the cortical gray matter region, and approximately 0.25 mL·min−1·g−1 in the white matter region in normal subjects who showed no abnormality on CT. It is apparent that these regional CBF values in gray matter regions are considerably smaller than those determined by the invasive techniques mentioned above. The current study also recorded regional CBF values of 0.39 ± 0.06 mL·min−1·g−1 in putative gray matter regions of anesthetized monkeys using the conventional H215O autoradiographic method. These values are comparable with the results from human PET studies.
It has been clearly shown in the current study that this underestimation of CBF in the cortical gray matter region is primarily attributed to the PVE and the tissue heterogeneity within a selected ROI. The PVE-corrected CBF in the area of frontal and occipital regions estimated with Models A and B was approximately 0.39 mL·min−1·g−1 on average. Note that these models represent the total flow value averaged over the tissue within the selected ROI without differentiation of gray matter and white matter tissues. Although these models have been shown to provide systematic errors in the estimated parameters because of the tissue heterogeneity (Iida et al., 1989), the CBF values obtained are comparable with those derived from a gray matter region using H215O autoradiography, suggesting significant underestimation in the latter method. When both PVE effects and tissue mixture were included in the model (Models C and D), gray matter flows of 0.8 mL/min per gram of gray matter tissue were obtained, which is in line with gray matter flows obtained by invasive methods. This highlights the need for PVE correction, and without such a correction an underestimation in flow typically by a factor of 2 can result.
Optimal model configuration
Better fits were obtained using Models C and D as compared with Models A and B particularly around the peak of the tissue-activity curve as shown in Fig. 4. The AIC was also shown to be significantly smaller using Models C and D than Models A or B. These observations suggest that a model configuration including two parallel tissue compartments is more suited to reproduce the observed regional time-activity curve for the ROIs shown in Fig. 3. The need for a two-tissue compartment model is also apparent for a small ROI carefully selected on the gray matter region. The significant underestimation of values obtained from a ROI located in a carefully selected gray matter region using the H215O autoradiographic method suggests a critical contamination of white matter into the region in addition to the contribution from extracerebral tissues. One may also be concerned about the possible existence of functional subunits of different flow values within each component. This is still unknown, and careful attention would be needed in selecting ROIs so as not to include different structures within an ROI. However, it should be noted that the model would become impractical if too many unknown parameters needed to be fitted.
Compared with Model C, Model D provided greater statistical uncertainty in the estimated parameters. However, the average gray matter CBF (fg) and the other parameters, α g and αw, obtained by Model C were not significantly different from those found by Model D. Thus, if the intention is to measure the regional CBF only for the gray matter tissue, Model C is the model of choice. As shown in Fig. 12, fixing the white matter CBF does not cause serious errors, and the expected error in the gray matter CBF is less than 10% provided that the true CBF in white matter is between 0.1 and 0.3 mL·min−1·g−1. If the white matter CBF is expected to deviate from this range under pathologic conditions, the error can be minimized by using a more suitable CBF value for the white matter tissue.
The effects of errors in the assumed pg and pw values (particularly for Model C) have not been directly described in this article, but could be estimated simply from Eq. 3 and Fig. 12 as follows. From Eq. 3 it is clear that the two (out of three) parameters of αg·fg and fg/pg are fitted independently. Thus, an error in pg linearly relates to the fg determination—for example, a +10% error in pg corresponds to a +10% error in fg. In addition, because errors in fg cause errors in αg·fg linearly, error propagation from pg to αg is linear—for example, a +10% error in pg corresponds to a −10% error in αg. However, the effects of errors in pw are, as seen from Eq. 3, the inverse of the error propagation to fw. The effects of errors in pw can therefore be estimated as an inverse of results of the simulation shown in Fig. 12.
The current study also demonstrates the reproducibility of Model C in the estimated fg and αg being ± 11% and 17%, respectively. This reproducibility is reasonable and acceptable for use in clinical research. However, Model D is needed to measure the PVE-corrected white matter CBF (fw) simultaneously with the gray matter CBF. However, because of the statistical uncertainty of the estimated parameters, not only of fw but also of the other parameters, this model may not provide clinically useful information. Thus, the current study does not support the use of Model D. To resolve this problem further improvements of the PET technology is required to provide better statistics in the reconstructed images.
Stereologic comparison
In the current study, the frontal and occipital regions were selected for stereologic comparison. The reasons for selecting these regions were first the relative ease of region identification, which are considered to be the most reproducible between PET and stereologic analyses, and second, the inclusion in these regions of the two major components of gray matter and white matter, each of which are reasonably uniform. Drawing an ROI to cover the whole hemisphere was another possibility, but then the tissue components may become more heterogeneous and the assumption of a 2-parallel compartment model would probably become uncertain.
As noted, the volume of gray matter within the selected ROI defined by PET measurements using Model C correlated significantly with those determined by the stereologic analysis (P < 0.02). The variation of the gray matter volume is primarily caused by the variations of brain size within each monkey. However, the PET determined gray matter volume was found to be significantly different from the stereologic determined volume by 42%. The volume of white matter was also shown to be overestimated by PET methodology using Model C compared with the stereologic analysis. The reason for this is unclear. Error propagation analysis based on simulations did not suggest that this could be attributed to methodologic errors. Considering the magnitude of correction (Figs. 8 and 9), possible errors in the delay and dispersion corrections are unlikely to cause errors in the estimation of the gray fraction above 5%. Spillover from the pericranial muscle radioactivity was shown to cause a systematic underestimation of the gray matter tissue fraction by only 10% at maximum for a muscle volume fraction of less than 0.15 mL/mL. Furthermore, the propagated error because of a difference between the assumed and the true white matter CBF within a range of 0.16 and 0.24 mL·min−1·g−1 should be within ±10%. Assuming a white matter flow of 0.11 mL·min−1·g−1, which was the average value estimated from Model D, the gray matter volume would be increased by 25%, not fully clarifying the difference. In addition, the white matter flow of 0.11 mL·min−1·−1 is probably underestimated, and could be caused by a combination of spillover from the pericranial muscle radioactivity and the large variation found in Model D.
An inaccurate alignment of ROIs sampled from PET images and stereology is unlikely to explain the difference of volume estimates. An error greater than 30% (that is, > 6 mm) in the definition of the length of the tissue segment is needed to explain the discrepancies mentioned above. Spillover of white matter and gray matter signals across the ROI border is asymmetrical, and more white matter signal is probably introduced into the ROI from the central brain. The magnitude of this effect is however unlikely to fully explain the difference. The physiologic partition coefficients for gray matter and white matter tissues (chosen in the current study as 1.0 and 0.8 mL/g, respectively) are potential error sources for systematic bias in the gray and white matter volumes, respectively. However, more than a 40% error is required, which is far too large to accept.
One possible explanation for the significant underestimation of the gray matter fraction could be related to the limitations of the compartment assumption itself, if one hypothesizes that the radioactive water diffuses across the gray and white matter tissue border. A certain amount of accumulated radioactivity in the cortical gray matter may diffuse into the white matter tissue, where clearance is very slow, or conversely from the white matter to the gray matter tissue, where clearance is very rapid. Further investigation is needed to evaluate the significance of this speculation and the contributions of this effect.
It is worth noting the results from early studies by (Høedt-Rasmussen et al. 1965, 1966, 1967), in which the clearance radioactivity curves were measured using an external detector after the intracarotid bolus injection of 133Xe and estimated fractions of the rapid and slow clearance components. It was reported that the contributions of the rapid and slow components were approximately equal, that is, αg ≈ αw according to the formulation in this article. However, it should be noted that photon attenuation occurring in the cerebral tissue had not been taken into account. Thus, it can be expected that the contribution of the white matter tissue was underestimated, and it would be more likely that the magnitude of the slow clearance component—that is, the white matter contribution,—should be greater than that of the cortical gray matter. This is consistent with the findings of the current article.
The discrepancy of the estimated volumes between the PET modeling approach and the stereologic analyses suggests a possible limitation of MRI tissue segmentation based techniques for PVE PET correction, particularly when CBF is quantified using H215O autoradiography. The radioactivity distribution may not necessarily correspond to the anatomic structures as defined by MRI or CT. Further careful investigations are required to evaluate this.
The sum of gray and white matter volumes determined with Models C and D showed significantly greater values than the stereologic volumes. This can be explained by a model overestimation of the white matter volume derived from the muscle radioactivity contribution as demonstrated in Fig. 11. Unfortunately, it obstructs one path to further the understanding of the nature of discrepancy in tissue volume between the stereologic and the kinetic model approach. This difference could be a scaling effect of the whole tissue volume or a difference in definition of tissue borders derived from anatomic and physiologic criteria, respectively. Note, however, that the gray matter volume estimation was not largely affected by the spillover of muscle radioactivity and would still represent the tissue volume with the higher clearance.
Significance of Va
In previous publications (Fujita et al., 1997; Ohta et al., 1996) the importance of the arterial blood volume component has been promoted to explain the H215O kinetics in cerebral tissue. The current study also demonstrated that the Va term is significant, and the inclusion of a Va term into the model (that is, Model B) resulted in f and α parameters that were significantly different from those without the Va term (Table 1). However, it has also been demonstrated that the obtained Va values were very small, as were the differences of f and α between Models A and B (< 1%). In addition, the tissue radioactivity curves generated with the Va term were not different from curves without the Va term (Fig. 4). In contrast, the addition of a white matter tissue compartment in Models C and D improved the fit to the observed time-activity curve and significantly increased the quantitative CBF values, particularly in the gray matter regions. Furthermore, the AIC was significantly smaller in Models C and D as compared with Model B. Thus, the current study does not support the inclusion of a Va term, but strongly endorses the importance of tissue heterogeneity.
In conclusion, the following has been demonstrated in the current study: (1) The conventional analysis using H215O autoradiography significantly underestimates the regional CBF in the cortical gray matter region typically by 50%. This most likely originates from the PVE and the tissue heterogeneity. (2) The kinetic model proposed in the current study provided a regional CBF of approximately 0.80 mL·min−1·g−1 in the cortical gray matter region, which is consistent with the literature values in humans. (3) This kinetic model-based method for PVE correction can yield cortical gray matter volumes within a selected ROI. (4) Despite a significant correlation between the estimated total gray matter volume and stereologic volume, the former was significantly smaller compared with the latter by 40%. (5) The exact reason for the underestimation of gray matter volume is unknown, but further investigations are suggested before using MRI derived anatomic information for PVE correction in PET.
Footnotes
Acknowledgments
The authors acknowledge the invaluable support given by Professor Niels A. Lassen. The authors also thank the technical staff of the Neurology Research Laboratory at the Bartholin Institute, Copenhagen City Hospital, for their assistance with the stereologic analysis, and the staff of the PET Center at The National University Hospital, Rigshospitalet, Denmark. The authors would also like to acknowledge Asahi-kasei, Tokyo, Japan, for providing the Dr. View program for the image analysis and the John and Birthe Meyer Foundation for donating the Cyclotron and PET scanner.