
Abstract
Nineteen patients with acute ischemic stroke (<24 hours) underwent diffusion-weighted and perfusion-weighted (PWI) magnetic resonance imaging at the acute stage and 1 week later. Eleven patients also underwent technetium-99m ethyl cysteinate dimer single-photon emission computed tomography (SPECT) at the acute stage. Relative (ischemic vs. contralateral control) cerebral blood flow (relCBF), relative cerebral blood volume, and relative mean transit time were measured in the ischemic core, in the area of infarct growth, and in the eventually viable ischemic tissue on PWI maps. The relCBF was also measured from SPECT. There was a curvilinear relationship between the relCBF measured from PWI and SPECT (r = 0.854; P < 0.001). The tissue proceeding to infarction during the follow-up had significantly lower initial CBF and cerebral blood volume values on PWI maps (P < 0.001) than the eventually viable ischemic tissue had. The best value for discriminating the area of infarct growth from the eventually viable ischemic tissue was 48% for PWI relCBF and 87% for PWI relative cerebral blood volume. Combined diffusion and perfusion-weighted imaging enables one to detect hemodynamically different subregions inside the initial perfusion abnormality. Tissue survival may be different in these subregions and may be predicted.
Positron emission tomography (PET) has largely improved our knowledge of the pathophysiology of ischemic stroke in the living human brain (Furlan et al., 1996; Hakim et al., 1989; Heiss et al., 1992; Lassen, 1985; Marchal et al., 1996, 1999). Because of its high cost and limited availability, PET is of limited value in clinical practice. Because diffusion-weighted (DWI) and perfusion-weighted (PWI) magnetic resonance (MR) imaging scans have higher spatial resolution and are available in most institutions equipped with high-field MR units, they have been expanding our knowledge of ischemic stroke in vivo. A better understanding of the hemodynamic changes in the ischemic brain tissue may be helpful in predicting the outcome of stroke, thereby improving patient management and evaluation of the efficiency of novel therapies.
PWI can provide information about the capillary “perfusion” in the brain. DWI is sensitive to the molecular diffusion of water and detects decreased diffusion in ischemic brain tissue (Baird and Warach, 1998). Although the lesions seen in DWI have been reversible in some animal models (Minematsu et al., 1992b) and in patients with transient ischemic attacks (Kidwell et al., 1999), there are only a few observations of recovery of ischemic brain tissue with decreased diffusion in humans (Marks et al., 1996; Sorensen et al., 1996). In a recent study by Marks et al. (1999), apparent diffusion coefficient maps showed lesion shrinkage in patients treated with thrombolysis. However, fluid-attenuated inversion recovery images showed that this was not a true beneficial effect but merely pseudonormalization of the apparent diffusion coefficient (Marks et al., 1999). Thus, because the lesion on DWI is rarely reversible, DWI is at present the most accurate clinically available method to visualize infarcted brain tissue at the acute stage. By using combined DWI and PWI, it may be possible to distinguish the infarcted tissue from the hypoperfused but still viable ischemic tissue (Baird et al., 1997; Sorensen et al., 1996). The mismatch between PWI and DWI lesions has been shown to predict infarct growth (Baird et al., 1996; Karonen et al., 1999; Sorensen et al., 1999). The mismatch between single-photon emission computed tomography (SPECT) and DWI lesions has also been shown to predict infarct growth (Karonen et al., 2000).
Various types of perfusion maps can be generated from PWI data (Sorensen et al., 1999). Their significance in clinical stroke has not yet been fully clarified. Moreover, defining lesion volumes visually on PWI maps may impair the predictive capability (Sorensen et al., 1999), because minor hemodynamic changes in the ischemic territory on PWI maps are visually indistinguishable. It is crucial to establish empirical hemodynamic threshold parameters that could distinguish between brain tissue that is potentially salvageable with early reperfusion and irreversibly damaged tissue that will inevitably suffer infarction.
SPECT is a well-characterized method used to measure cerebral blood flow (CBF), and it has a well-established record in terms of predicting outcome relative to a fixed ischemic threshold (Shimosegawa et al., 1994; Ueda et al., 1999; Watanabe et al., 1999). Recently, a significant correlation in CBF in normal subjects was found between PWI and SPECT (Ernst et al., 1999), but the correlation between the two methods has not been previously studied in ischemic stroke.
The purposes of this study were (1) to clarify the relationship between the CBF values measured from SPECT and PWI in human ischemic stroke; (2) to determine the characteristics of cortical cerebral perfusion for ischemic tissue; and finally, (3) to determine the cutoff percentage of the hemodynamic parameters between ischemic tissue that ultimately remains viable and ischemic tissue that eventually suffers infarction.
MATERIALS AND METHODS
Patients
Nineteen patients (11 women, 8 men; mean age ± SD, 71 ± 8 years) with first-ever acute infarction in the territory of the anterior cerebral circulation were enrolled into this study. Because various subgroups of cerebral infarction have different clinicopathologic characteristics (Bamford et al., 1991; De Reuck et al., 1981), patients with lacunar infarcts or infarcts in the territory of posterior circulation were not included in this study. The inclusion criteria were as follows: (1) the patient had symptoms and signs of acute hemispheric ischemic stroke; (2) cerebral hemorrhage and other nonischemic causes for symptoms were excluded by computed tomography; (3) MR imaging could be performed within 24 hours of the onset of symptoms; (4) the follow-up MR imaging could be performed at 1 week after the symptoms onset; and (5) the patient did not receive thrombolytic or experimental neuroprotective agents. Use of anticoagulation or antiplatelet drugs was not an exclusion criterion.
On admission to the hospital, the mean volume of infarct (the lesion volume on DWI) was 36.1 ±33.5 cm3 (mean ± SD), and the National Institutes of Health Stroke Scale was 14 ± 6. The time delay from the onset of symptoms to the initial MR imaging was 10.0 ± 4.6 hours (Table 1). The onset of symptoms was defined as the time the patient was last known to be without symptoms.
Basic characteristics of the study population
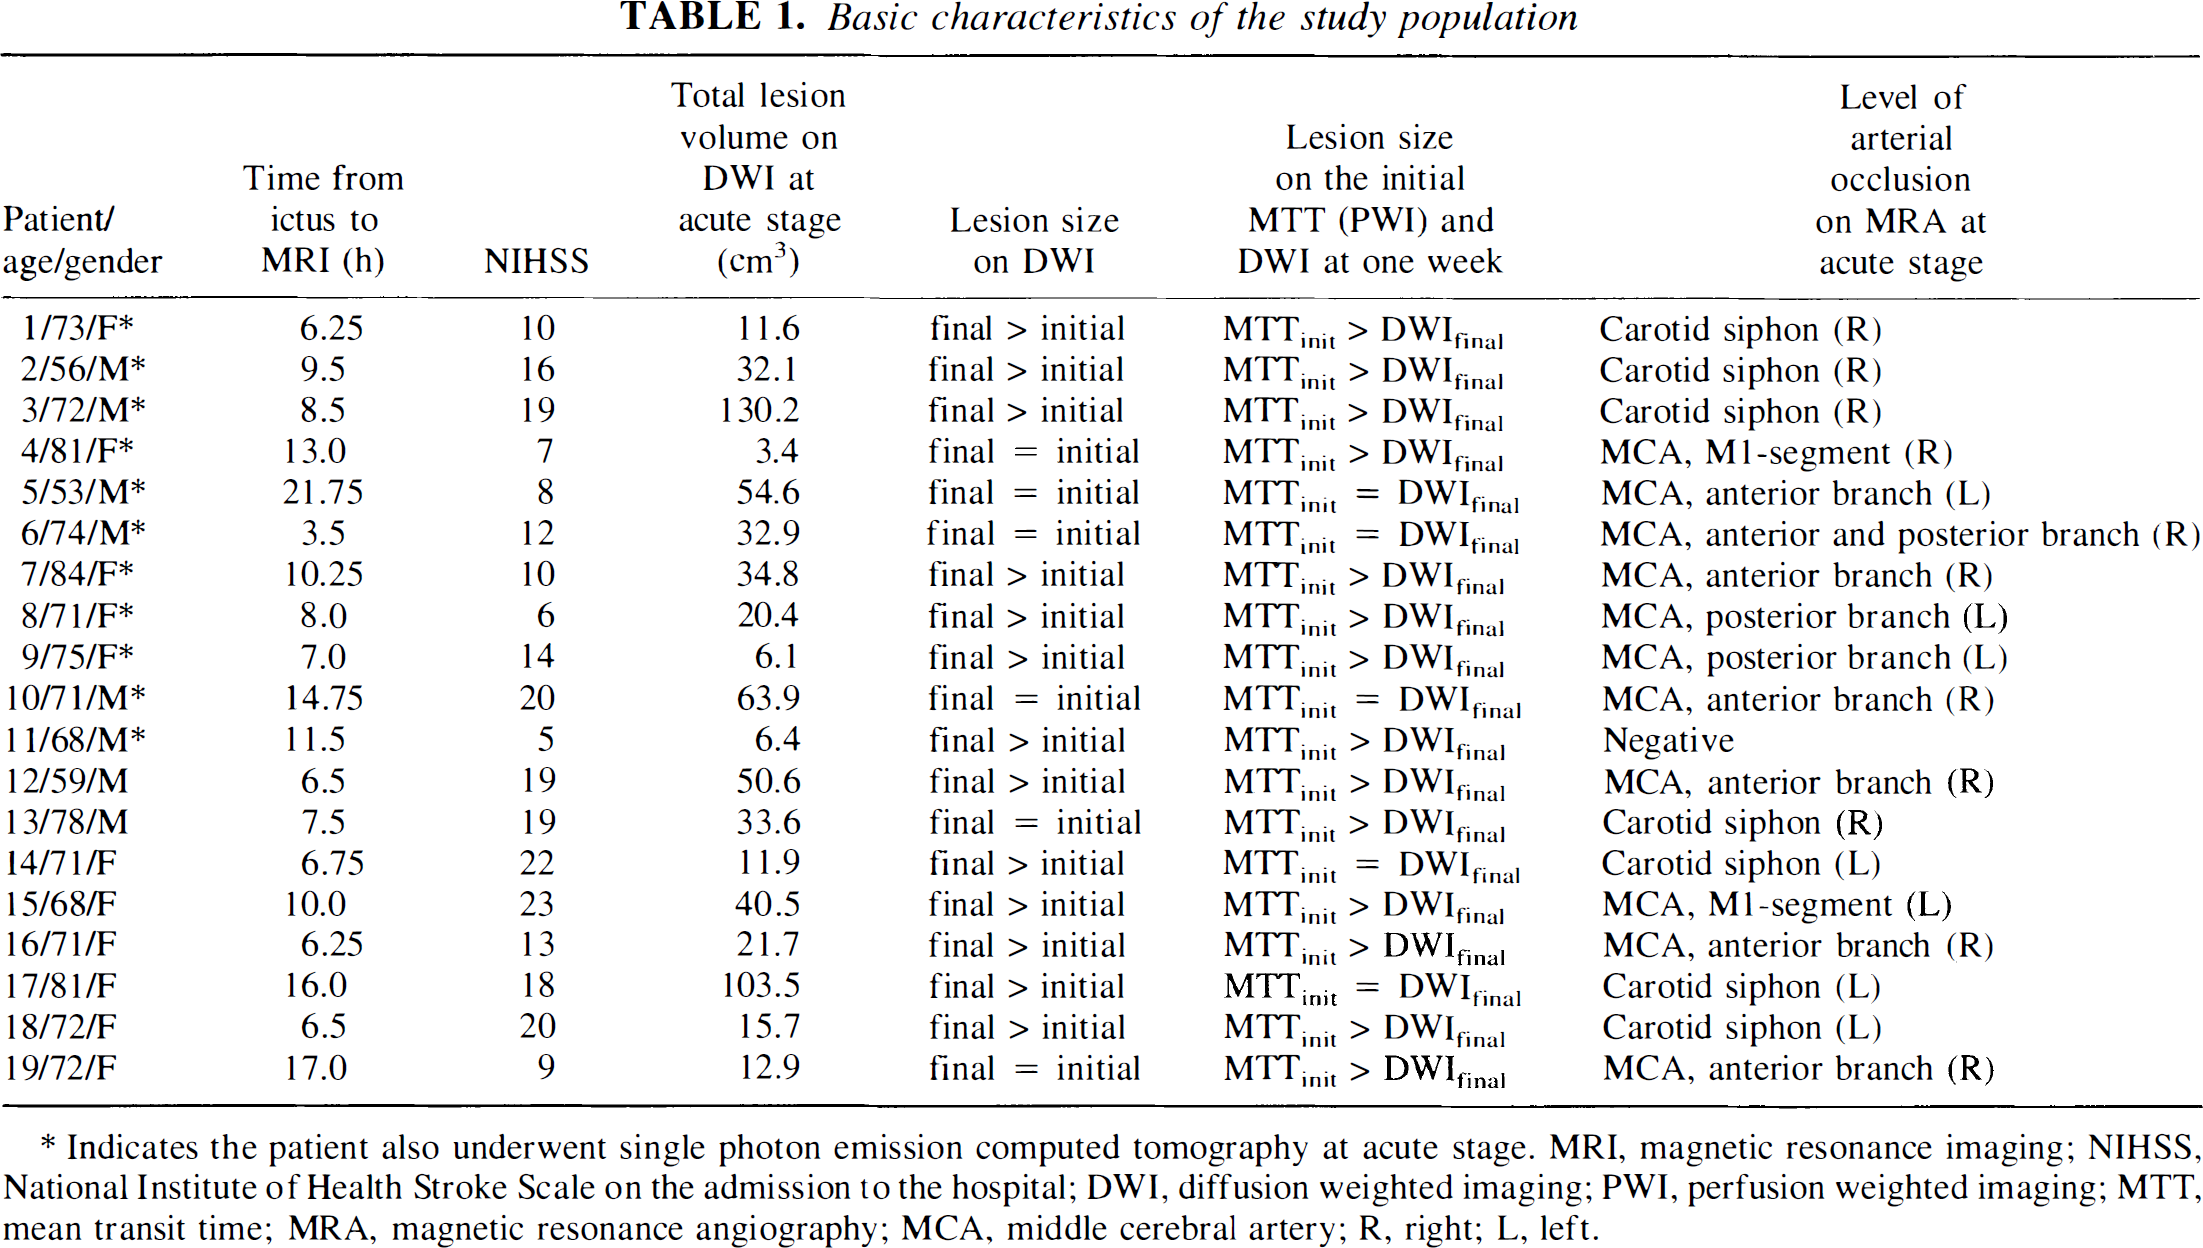
Indicates the patient also underwent single photon emission computed tomography at acute stage. MRI, magnetic resonance imaging; NIHSS, National Institute of Health Stroke Scale on the admission to the hospital; DWI, diffusion weighted imaging; PWI, perfusion weighted imaging; MTT, mean transit time; MRA, magnetic resonance angiography; MCA, middle cerebral artery; R, right; L, left.
Eleven patients (5 women, 6 men; mean age, 71 ± 9 years) also underwent SPECT immediately after MR imaging at the acute stage. The tracer for SPECT was injected within 1 hour of PWI, which makes the findings in SPECT and PWI comparable. Informed consent was obtained from the patient or the patient's relative. The study design was approved by the Ethics Committee of Kuopio University Hospital.
MR imaging
Each patient was imaged at the acute stage and 1 week after the onset of symptoms. All MR imaging studies were performed with a 1.5-T whole-body scanner capable of echo planar imaging (Magnetom Vision, Siemens Medical Systems, Erlangen, Germany) by using a head coil. The patient's head was fixed with standard restraints used in routine clinical MR imaging. Each MR imaging examination consisted of DWI, PWI, 20-phase-contrast MR angiography of the circle of Willis, T2-weighted and proton density-weighted axial fast spin echo imaging, and precontrast and postcontrast T1-weighted axial spin echo imaging. The total imaging time was approximately 20 minutes.
DWI was performed with a single-shot echo planar spin echo sequence (repetition time, 4,000 milliseconds; echo time, 103 milliseconds). Other imaging parameters were as follows: slice thickness, 5 mm; interslice gap, 1.5 mm; field of view, 260 mm; matrix size, 96 × 128 interpolated to 256 × 256; and total acquisition time, 20 seconds. Nineteen axial slices parallel to the orbitomeatal line were imaged. Four images per slice were obtained, i.e., one T2-weighted image without diffusion weighting (b-value, 0 s/mm2) and three diffusion-weighted images with orthogonally applied diffusion gradients (b-value, 1,000 s/mm2). To avoid the effects of diffusion anisotropy, trace images (trace of the diffusion tensor) were calculated as an average of the signal intensity in each diffusion-weighted image on a voxel-by-voxel basis.
PWI was also performed with a single-shot echo planar spin echo sequence (repetition time, 1,500 milliseconds; echo time, 78 milliseconds, field of view, 260 mm; matrix size 116 × 256). Seven 5-mm-thick axial slices with 1.5-mm interslice gaps were imaged at the slice positions containing the largest diffusion defect. Forty images per slice were acquired with 1.5-second intervals. A 0.2 mmol/kg dose of gadopentetate dimeglumine (Magnevist, Schering AG, Berlin, Germany) was injected into an antecubital vein (rate 5 mL/s) followed by a 15-mL bolus of saline. The injection was given with an MR compatible power injector (Spectris, Medrad, Pittsburgh, PA, U.S.A.) after four baseline measurements.
Perfusion raw images were postprocessed to generate maps of cerebral blood volume (CBV), CBF, and mean transit time (MTT) (Østergaard et al., 1996a, b ). CBV was determined on a voxel-by-voxel basis by numerical integration of the first-pass concentration–time curve. The shape of the arterial input function was determined from the voxels located at a branch of the middle cerebral artery, showing large signal losses during the bolus passage. The tissue impulse response function was determined by deconvolving the tissue concentration–time curve with the arterial input function. CBF was subsequently determined as the height of the deconvolved tissue impulse response. MTT was then calculated according to the central volume theorem as the CBV/CBF ratio.
SPECT imaging
Technetium-99m ethyl cysteinate dimer (99mTc-ECD) was used as the tracer. A dose of 550 to 720 MBq, which varied according to the body weight of the patient, was injected into an antecubital vein within 1 hour of the PWI. Within 60 minutes after the injection, high resolution SPECT acquisition was performed with a gamma camera equipped with fan-beam collimators (MultiSPECT 3; Siemens Medical Systems, Inc., Hoffman Estates, IL, U.S.A.). A full 360° rotation was acquired (40 views/detector, each for 35 seconds). The matrix size was 128 × 128 and the imaging resolution was 8 to 9 mm. Contiguous 6-mm-thick axial slices aligned parallel with the orbitomeatal line were reconstructed by filtered backprojection and a uniform attenuation correction was performed.
Regional analysis
The total infarct volume at acute stage was measured from all initial DWI slices containing the lesion. Volumes of diffusion were measured by drawing regions of interest (ROIs) around the lesions on the trace images and by multiplying the lesion area by the slice thickness. The interslice gap was estimated to contain a lesion of the same size as the slice above it, and the lesion inside the gap was included in the volume calculation.
The 20-phase-contrast MR angiography studies were independently interpreted by two reviewers (J.O.K. and R.L.V.). Disagreement occurred only in one case (patient 9) in whom consensus was reached.
Gray and white matter display different vulnerability to ischemia (Moody et al., 1990). Therefore, cortical and deep white matter subregions within the ischemic brain parenchyma may show different outcomes in response to an observed blood flow deficit. In addition, SPECT does not allow accurate measurement of the blood flow in deep white matter. So, to achieve more accurate comparisons, only the cortical areas (on SPECT) were analyzed in this study. Because of the limitation of spatial resolution, “cortical areas” contained not only gray matter but also some subcortical white matter.
SPECT-MR coregistration was performed on a Hermes workstation (Nuclear Diagnostics AB, Hägersten, Sweden) with multimodality image software (MultiModality, Nuclear Diagnostics AB, Hägersten, Sweden), which enables accurate alignment of MR and SPECT images (Julin et al., 1997). The thickness of the original contiguous axial SPECT images was first reconstructed to 6.5 mm (slice thickness 5 mm + interslice gap 1.5 mm on PWI), then the SPECT images were reoriented to confirm that the boundaries of brain tissue and lateral ventricles aligned with the corresponding structures in PWI slices. All analyzes were limited to the tissue volume of seven slices that could be imaged with PWI (with the exception of the total infarct volume presented in Table 1). The number of slices analyzed for each patient varied from three to seven.
The ischemic core, the area of infarct growth, the eventually viable ischemic tissue, and the normal tissue were determined by visually reviewing the MR examinations from the acute stage and at 1 week (Fig. 1). The ischemic core was defined as the lesion on the diffusion trace images at the acute stage. The area of infarct growth was determined as the difference between lesions in the diffusion trace images obtained at the acute stage and at 1 week. The eventually viable ischemic tissue was determined as the mismatch area between the infarct area on the diffusion trace images at 1 week and the area of prolonged MTT at the acute stage PWI. This zone was determined only if the size of the lesion on MTT map at the acute stage PWI was larger than the size of the lesion on trace images at 1 week. The normal tissue was determined as the tissue that had a normal appearance on both PWI and DWI.
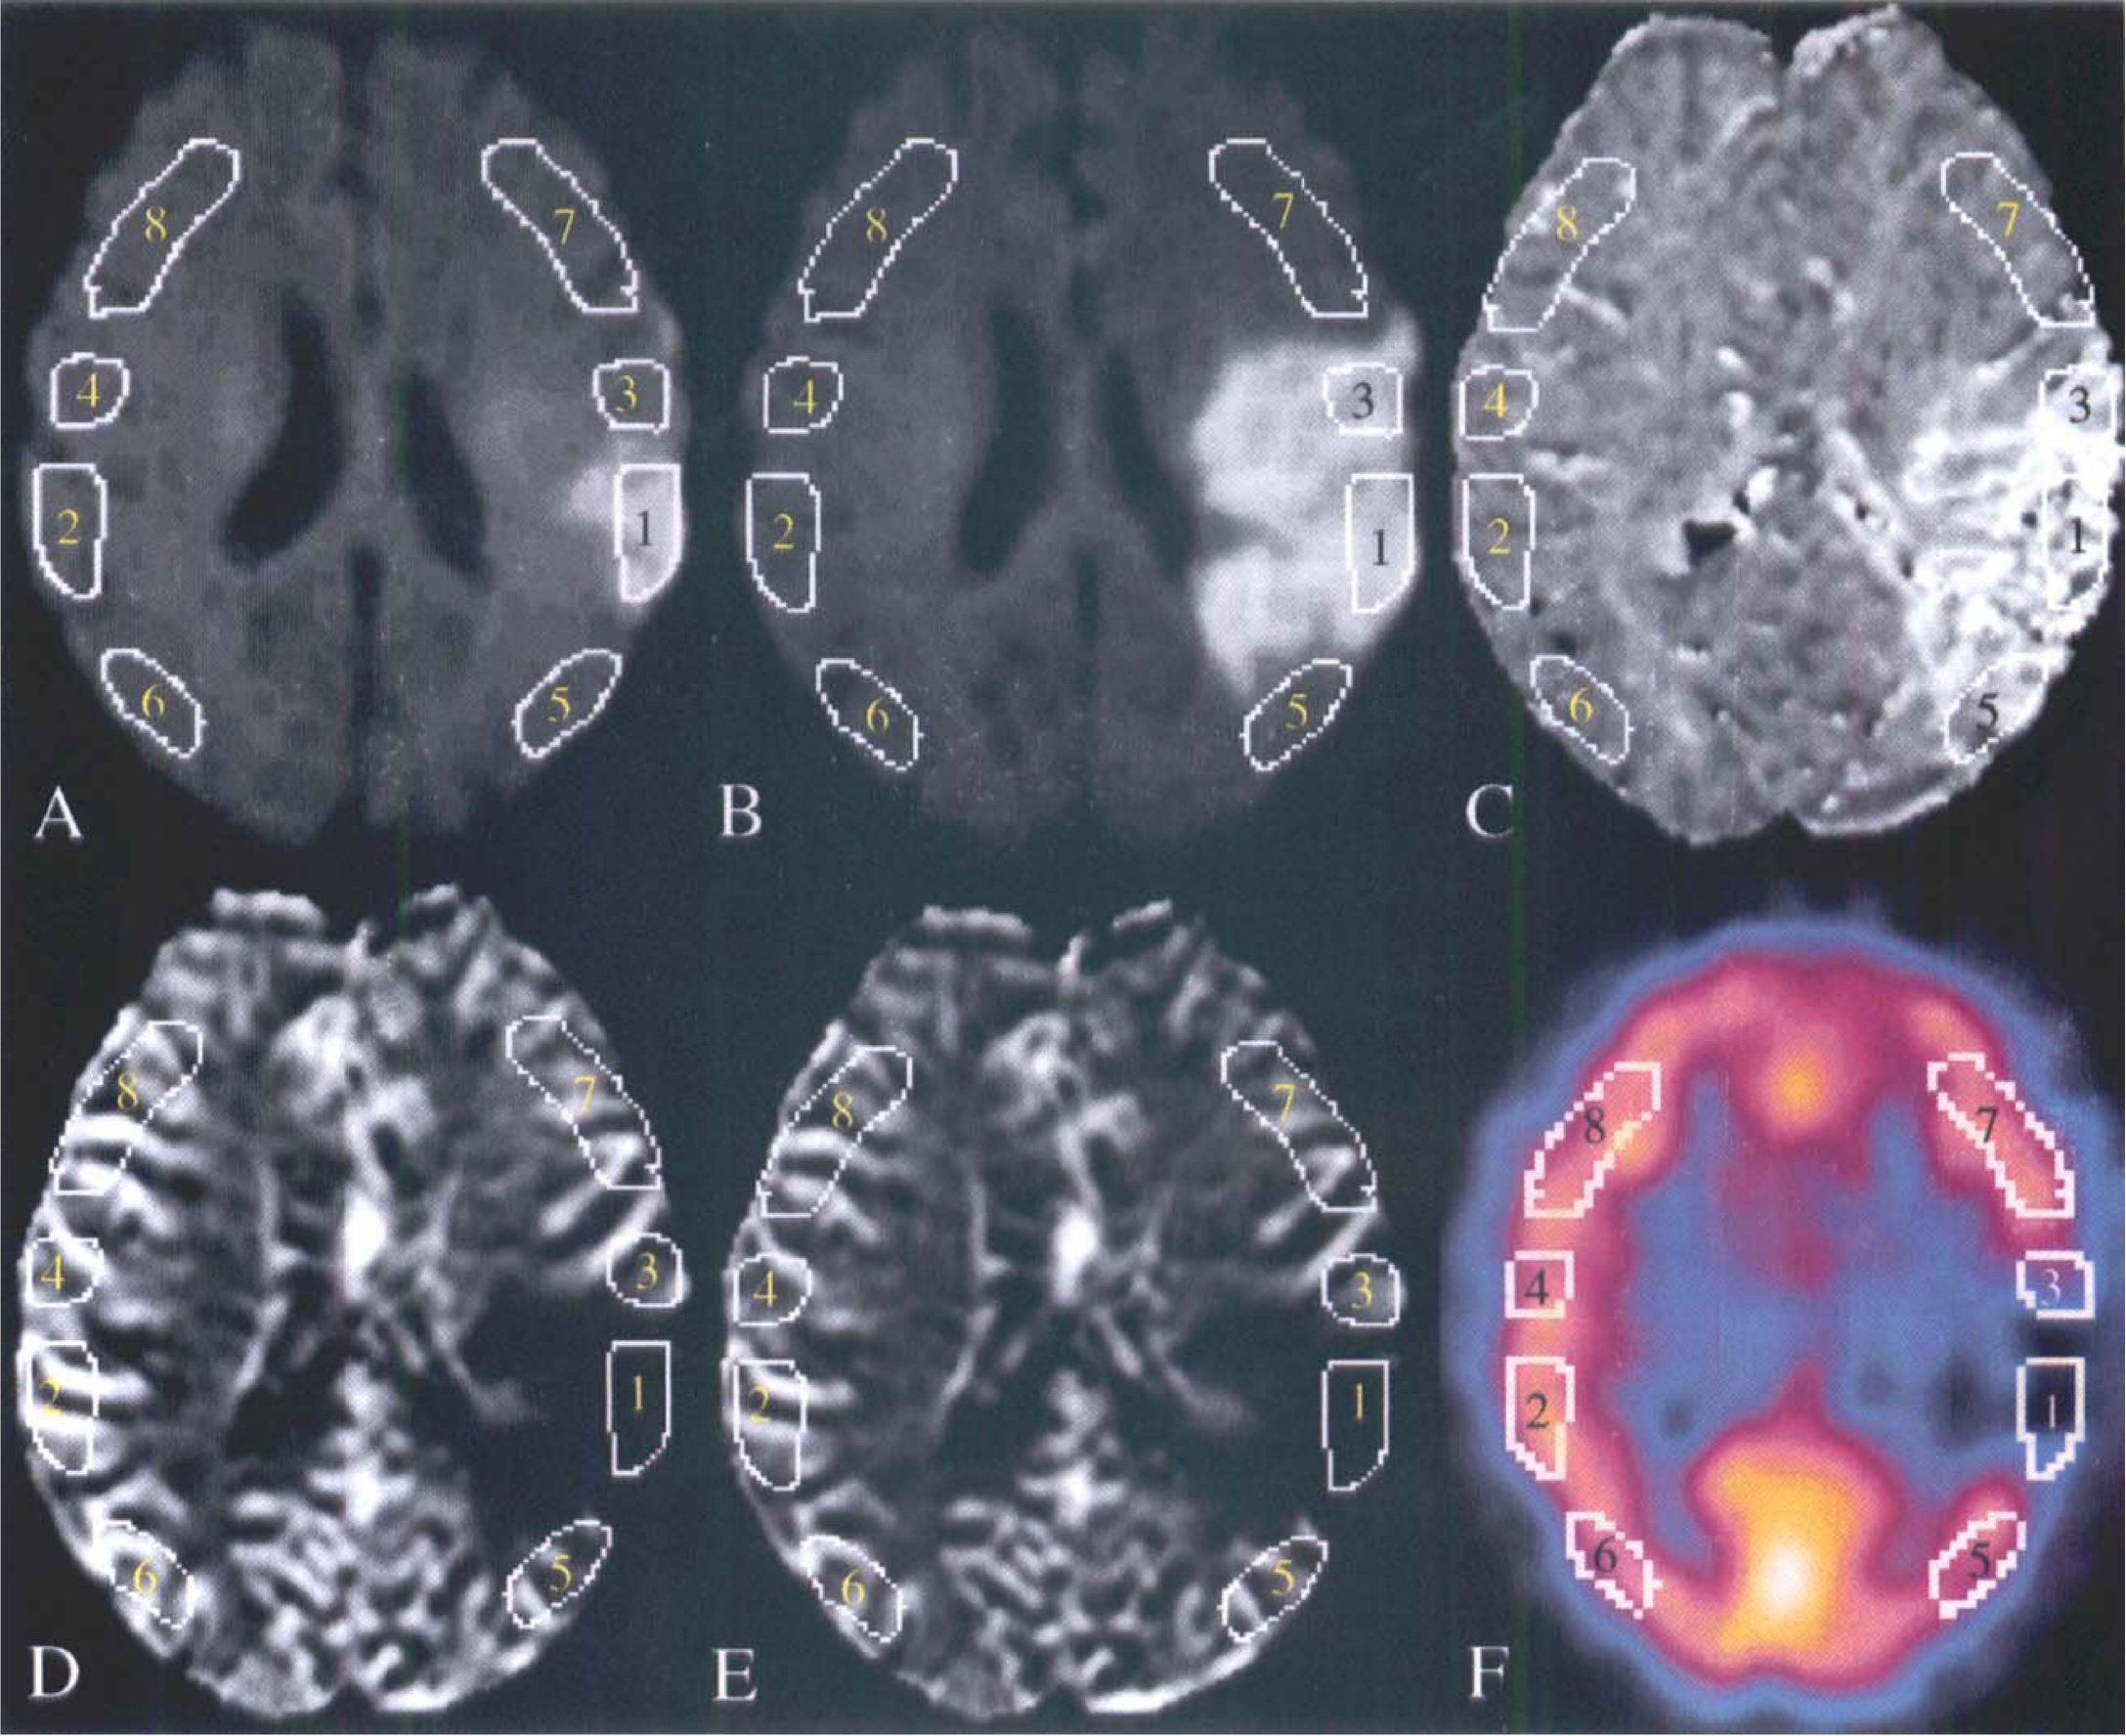
A 71-year-old woman (patient 8) with right hemiparesis and dysphasia 8 hours before the first MRI. DWI trace images on the first day
Irregular ROIs were drawn manually by one interpreter (Y.L.) on the cortical brain areas of the four zones (ischemic core, area of infarct growth, eventually viable ischemic tissue, and normal tissue) at first on DWI trace images. The ROIs were then placed on the corresponding contralateral regions. These ROIs were transferred to the corresponding anatomic regions on PWI maps and on the reoriented SPECT slices (maximum, seven slices). If one ROI could not cover the whole specific ischemic zone, two or more ROIs were drawn. When drawing the ROIs of normal tissue, all normal appearing cortical tissue in the territory of anterior circulation was included. However, tissue near the air cavities of the skull was avoided, because of the sensitivity of echo-planar imaging sequences to susceptibility artifacts. Figure 1 demonstrates how the ROIs were drawn. On each kind of MR perfusion maps, a total of 91 ROIs were drawn within the ischemic core, 57 ROIs within the area of infarct growth, 87 ROIs within the eventually viable ischemic tissue, and 79 ROIs within the normal tissue in 19 patients. On SPECT images, 46 ROIs were drawn within the ischemic core, 20 ROIs within the area of infarct growth, 52 ROIs within the eventually viable ischemic tissue, and 38 ROIs within the normal tissue in 11 patients. In three patients (patients 9, 11, and 14), lesions on the initial trace images were localized in the white matter and no ROI was drawn on the cortex of the ischemic core. In one patient (patient 3), no ROI was drawn on the normal tissue, as the entire hemisphere showed prolonged MTT values.
The percentage ratios between the hemodynamic parameters on the ischemic side and those on the contralateral region were calculated, and the relative CBF (relCBF) from PWI and SPECT and relative CBV (relCBV) and relative MTT (relMTT) from PWI were thus determined. The mean values of relCBF, relCBV and relMTT of each zone in each patient were also calculated by averaging all individual measurements in corresponding zones on different slices. These mean values were used in the further multiple zone comparisons.
To test the reproducibility of the PWI and SPECT measurements, interobserver variability and intraobserver reproducibility were analyzed. To test the interobserver variability, two observers (Y.L. and A.H.) independently measured relative hemodynamic parameters of the three ischemic zones on PWI and SPECT slices in 10 randomly selected patients. To test the intraobserver reproducibility, one observer (Y.L.) performed the measurements twice on PWI and SPECT in five randomly selected patients with an interval of at least 1 month between the measurements.
Statistical analysis
With the exception of relMTT of the ischemic core, the relative hemodynamic parameters proved to be normally distributed by the Kolmogorov-Smirnov test. Intraclass correlation coefficient (ri) was used to analyze the reproducibility of the measurements. Pearson's correlation coefficient (r) was used to calculate the correlation between the relCBF in all ROIs consisting of the ischemic zones and normal brain area measured from SPECT and PWI. The difference between the relCBF in ROIs measured from PWI and SPECT in each corresponding ischemic zone was analyzed with a paired Student's t-test. Discriminant analysis was performed to estimate cutoff values for relCBF and relCBV in ROIs to discriminate between the area of infarct growth and the eventually viable ischemic tissue. The sensitivity, specificity, and efficiency to predict tissue outcome (infarction or noninfarction) were calculated by using these cutoff values. P < 0.05 was considered statistically significant.
The differences between the mean values of relCBF, relCBV, and relMTT of the three ischemic zones and normal brain were studied by the Kruskal-Wallis test. If the differences were significant, paired comparisons were performed with the Mann-Whitney U test.
RESULTS
All patients had findings consistent with infarct (decreased molecular diffusion) at the acute stage. In 13 patients, the volume of the infarcted tissue increased on DWI images. In six patients, the volume of the infarct did not increase during the first week when evaluation of the DWI images occurred. In 14 cases, the initial MTT perfusion defect was larger than the final size of the infarct on the DWI images 1 week after the onset of the symptoms. In 5 patients, the initial perfusion defect on the MTT maps was equal to the final size of the infarct on the DWI images at 1 week (Table 1). In all 19 patients, there was an ischemic core; in 13 patients, there was a zone consistent with infarct growth; and in 14 cases, there was a zone corresponding to eventually viable ischemic tissue. The MR angiography findings are summarized in Table 1.
Reproducibility of the measurements
The reproducibility analysis was performed between the individual measurements on various slices. The intraclass correlation coefficients of the relCBF (PWI), relCBV, relMTT, and relCBF (SPECT) in interobserver variability analysis were 0.848, 0.864, 0.796 (P < 0.01; n = 100) and 0.892 (P < 0.01; n = 45), respectively, and in intraobserver reproducibility analysis 0.931, 0.938, 0.835 (P < 0.01; n = 40) and 0.934 (P < 0.01; n = 26), respectively.
Comparison of SPECT and PWI
In the 11 patients who underwent both MR imaging and SPECT during the acute stage, the relCBF measured from SPECT showed a curvilinear relationship with those measured from PWI. A statistically significant correlation existed between the relCBF measured from SPECT and PWI when a logarithmic transformation was performed for the relCBF measured from PWI (linear correlation, r = 0.777, n = 156; and linear-logarithmic correlation, r = 0.854, P < 0.001, n = 156) (Fig. 2). The relCBF values measured from SPECT were significantly higher than those measured from PWI in each of the three ischemic zones (ischemic core, area of infarct growth, and eventually viable ischemic tissue) (P < 0.001; n = 46, 20, and 52, respectively).
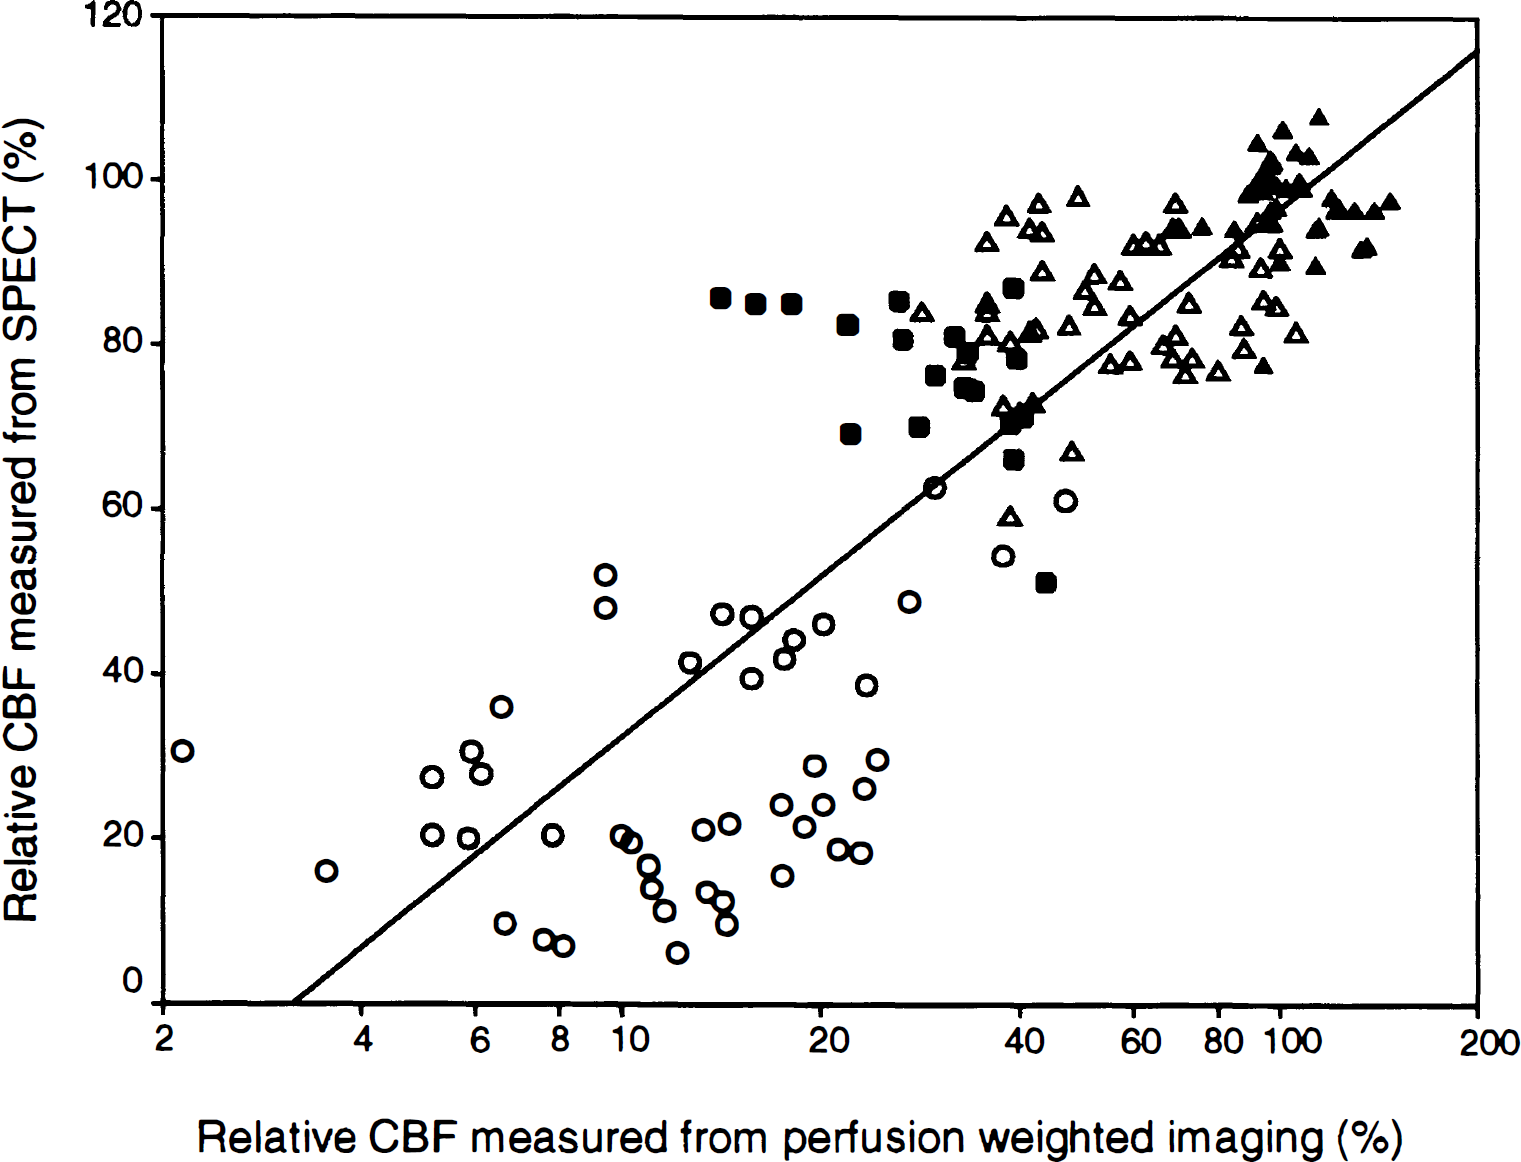
The relative CBF measured from SPECT shows significant correlation with the logarithmic transformed relative CBF measured from PWI (r = 0.854; P < 0.001). Values of the infarcted core (○, n = 46), the area of infarct growth (●, n = 20), the eventually viable ischemic tissue (Δ, n = 52), and the normal tissue (▲, n = 38) are included.
Discriminant analysis
According to the discriminant analysis, the best cutoff value to discriminate between the area of infarct growth and the eventually viable ischemic tissue was 48% for PWI relCBF and 87% for PWI relCBV (Fig. 3). The sensitivity, specificity, and efficiency of discrimination to predict the tissue outcome are summarized in Table 2.
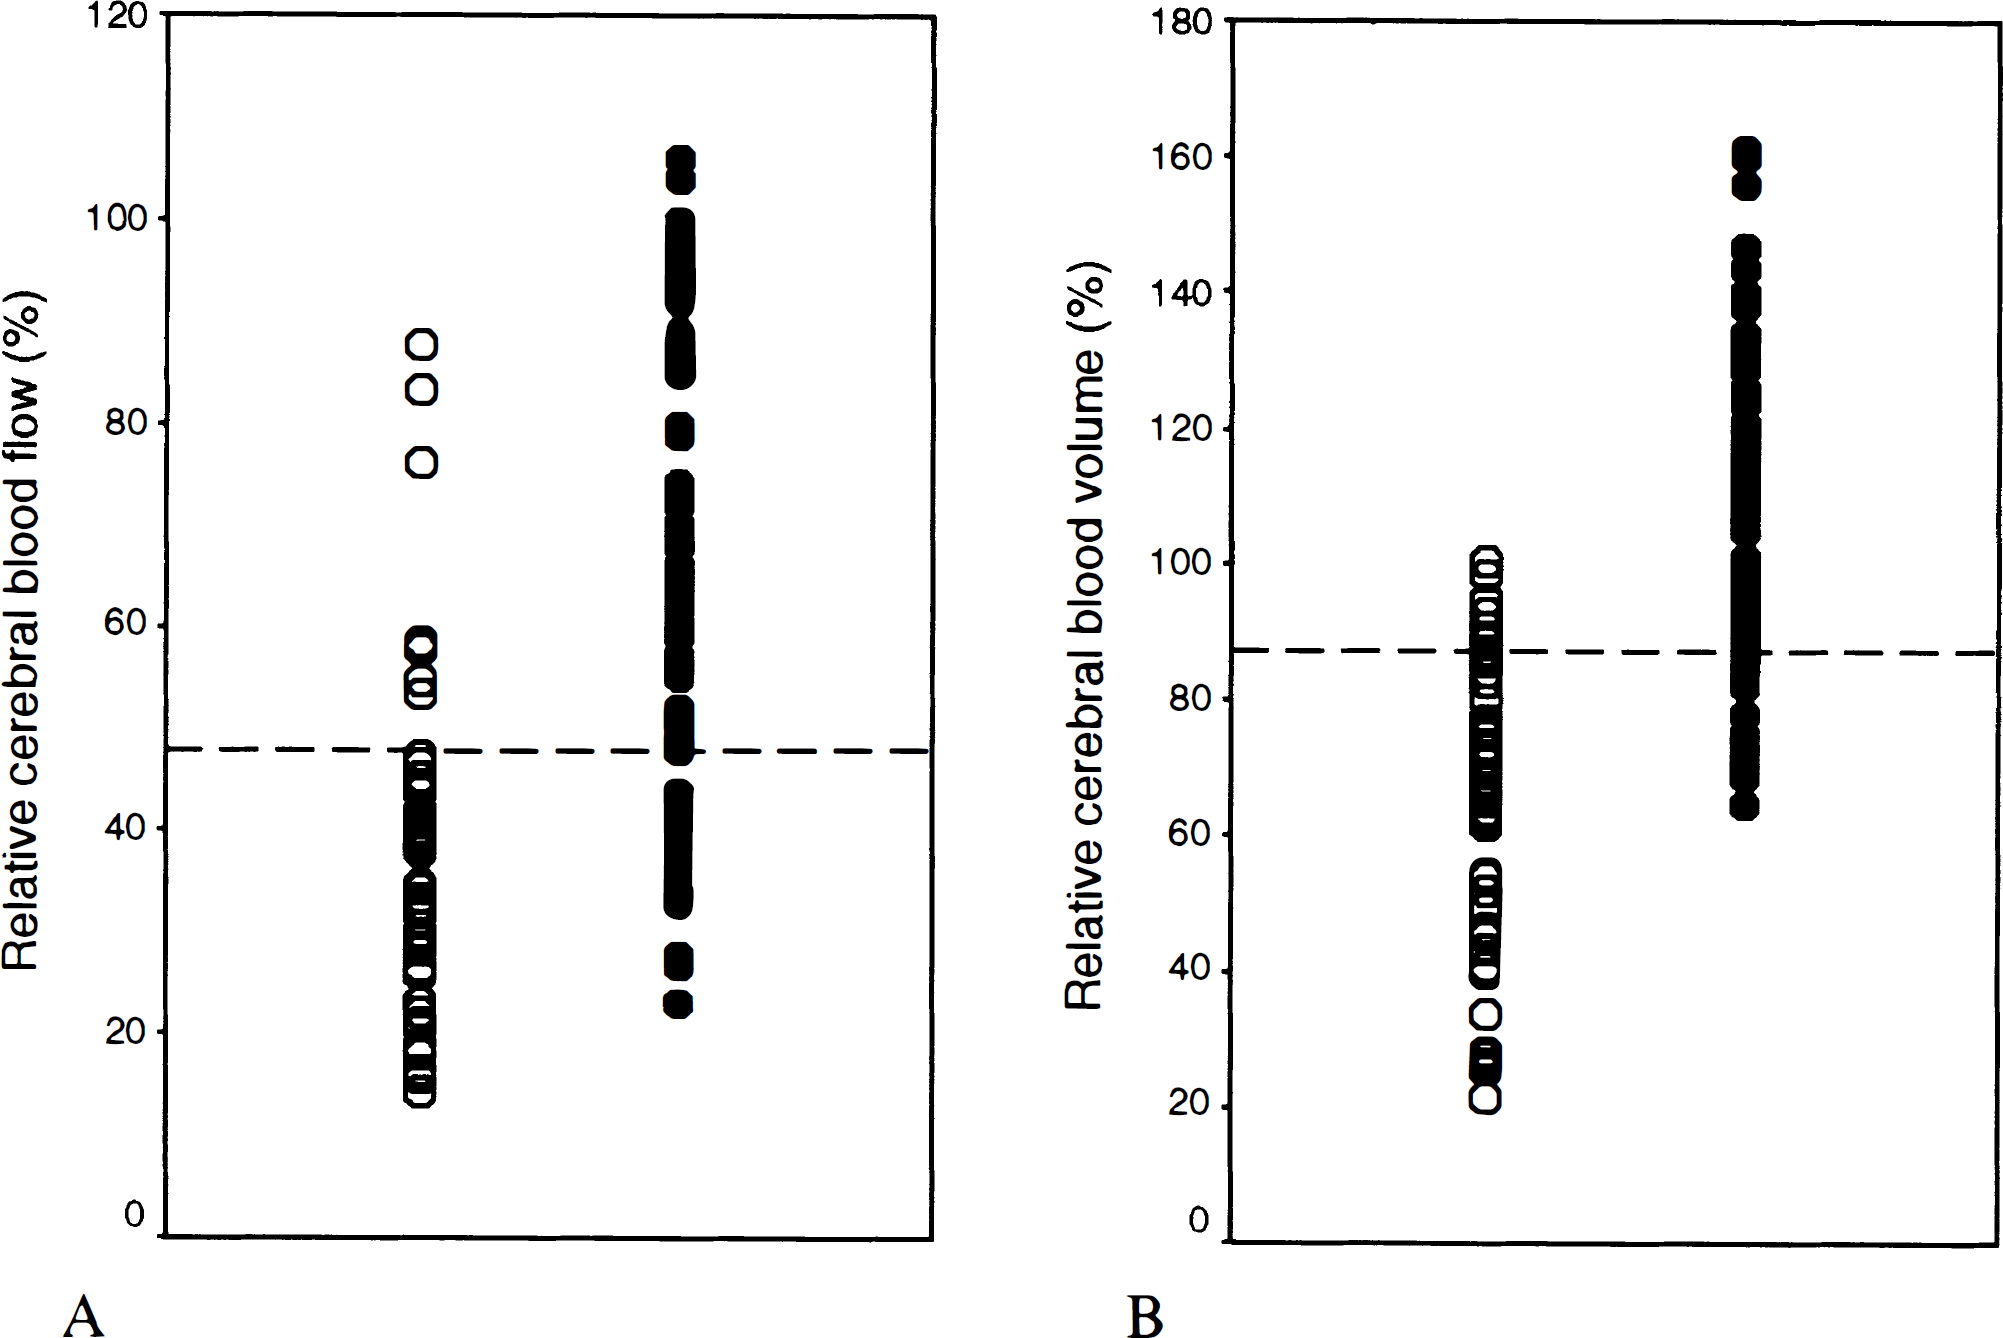
According to the discriminant analysis, the best cutoff value to discriminate between the area of infarct growth (○) and the eventually viable ischemic tissue (●) was 48% for relative cerebral blood flow
Percentage values of discriminant analysis for determining abilities of relCBF and relCBV to predict the outcome of ischemic tissue
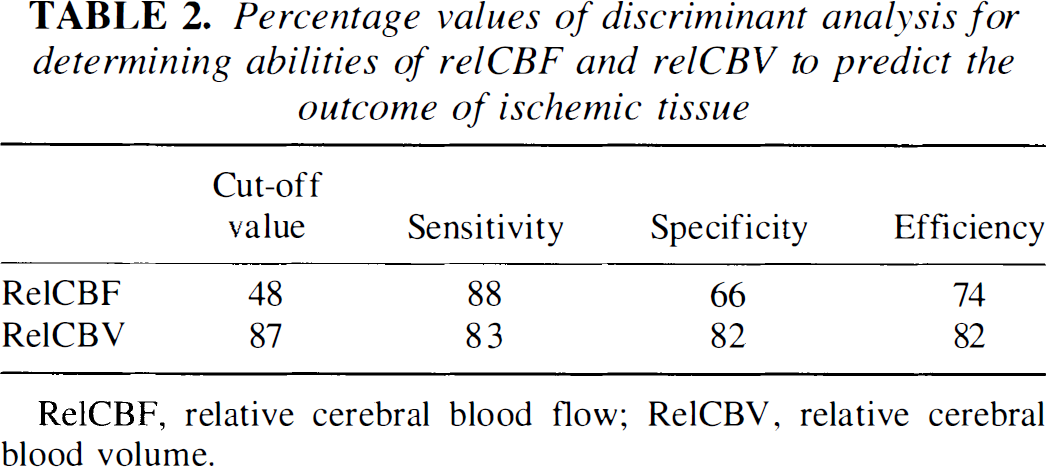
RelCBF, relative cerebral blood flow; RelCBV, relative cerebral blood volume.
Relative hemodynamic parameters
The mean values of the relative hemodynamic parameters from affected slices of each patient in the four zones are listed in Table 3. In PWI, relCBF values in the ischemic core, the area of infarct growth, and the eventually viable ischemic tissue were 13% ± 6%, 35% ± 12%, and 66% ± 16%, respectively. In SPECT, relCBF values in the corresponding zones were 27% ± 14%, 69% ± 15%, and 87% ± 7%, respectively. The relCBV values in the corresponding zones were 25% ± 10%, 69% ± 19%, and 113% ± 13%, respectively. The relMTT values in the corresponding zones were 199% ± 75%, 209% ± 46%, and 184% ± 42%, respectively. The tissue proceeding to infarction during the follow-up had significantly lower initial relCBF and relCBV values on the PWI maps (P < 0.001) than the eventually viable ischemic tissue had. Also the relCBF measured from SPECT was lower in the zone proceeding to infarction than in the eventually viable ischemic tissue in seven patients (P = 0.011). For both relCBF and relCBV measured from PWI, the values of the four different zones differed statistically significantly (P ≤ 0.003). The relCBF values were significantly lower, but the relCBV values higher, in the eventually viable ischemic tissue than in the normal brain. For relMTT, the values differed statistically significantly only when normal tissue was compared with ischemic zones (Table 4).
The relative hemodynamic parameters of the four zones at the acute stage
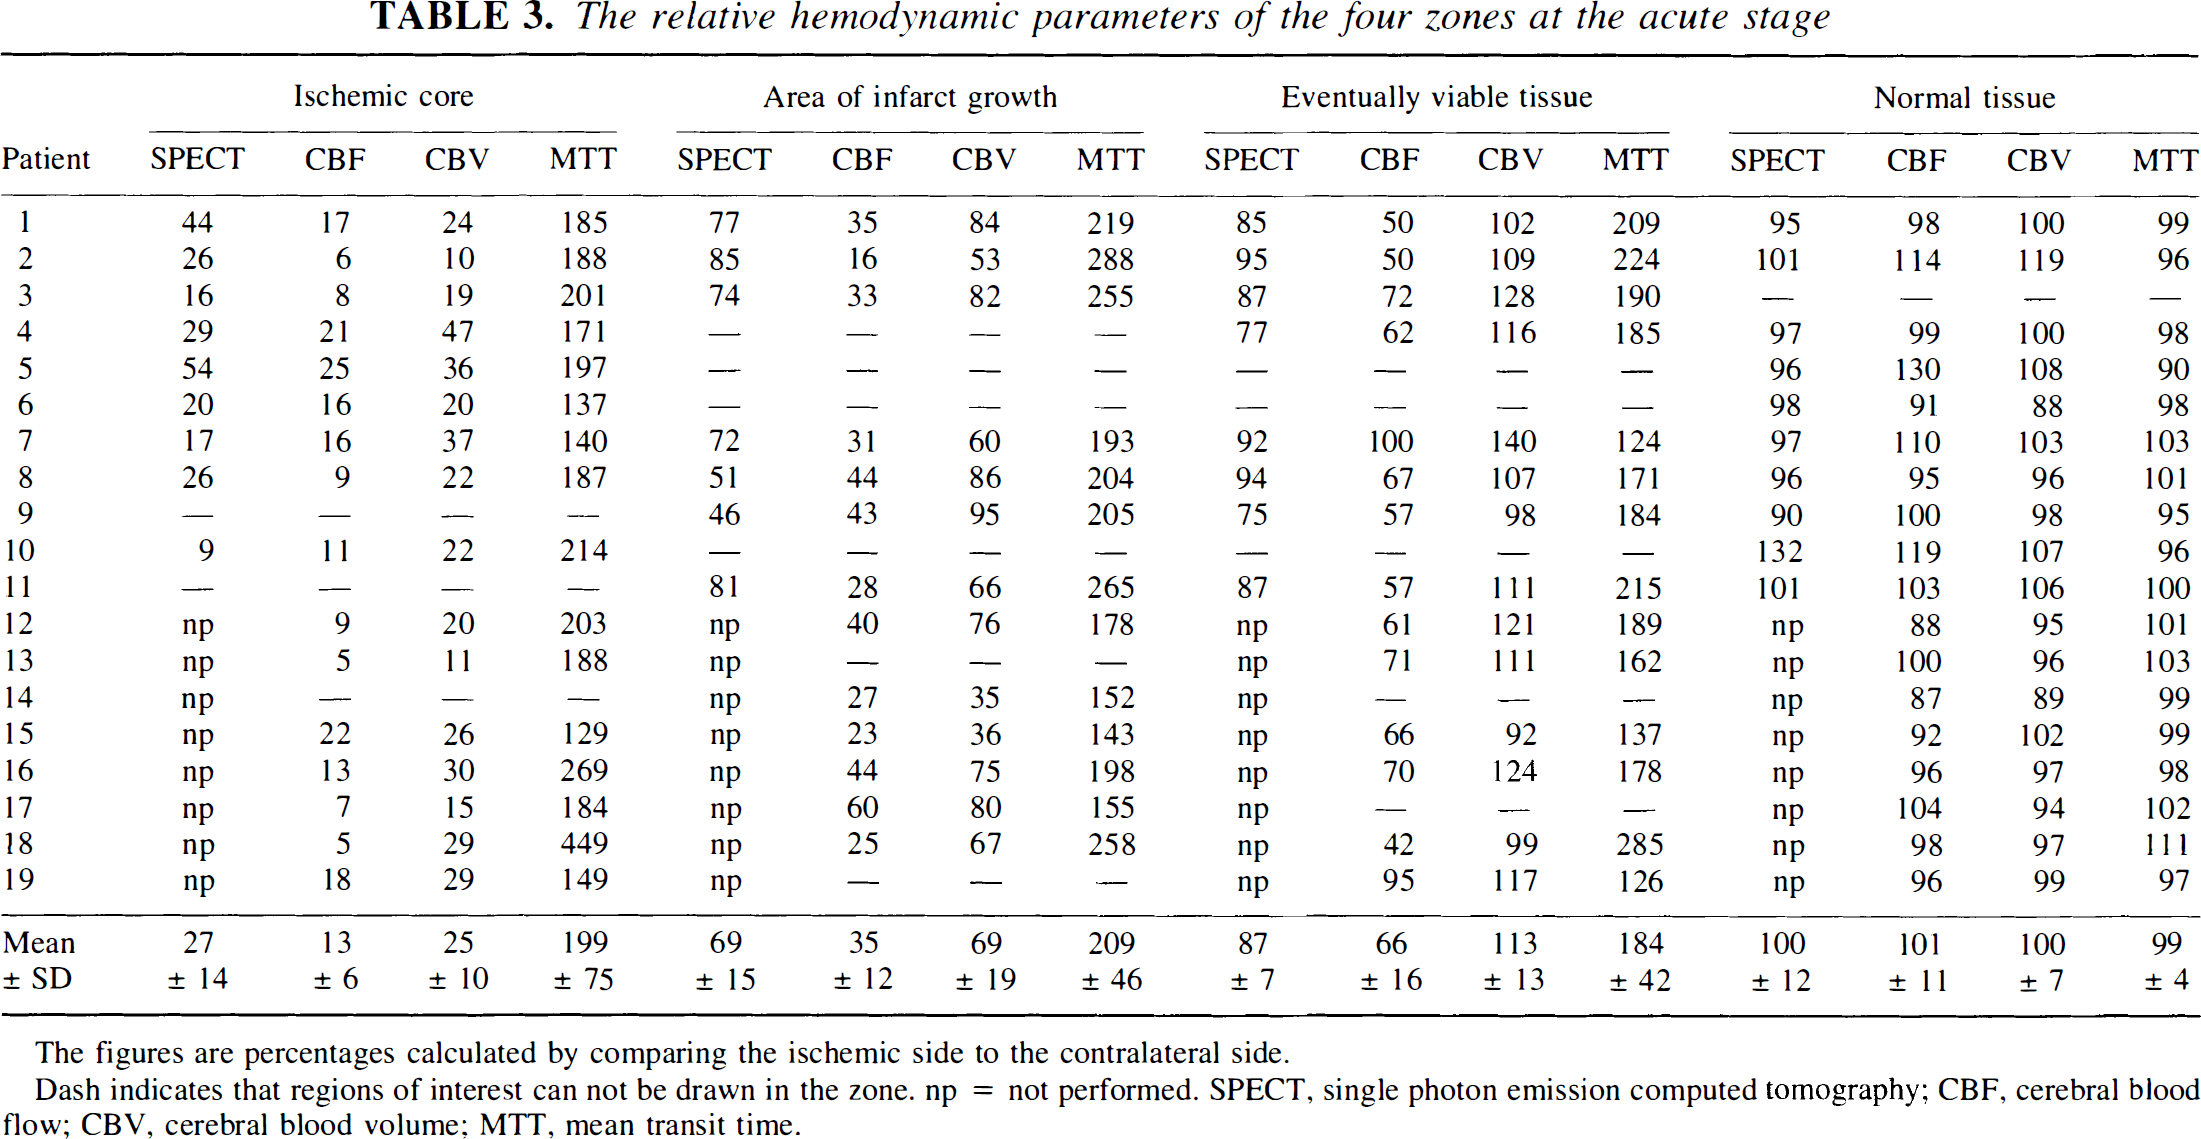
The figures are percentages calculated by comparing the ischemic side to the contralateral side.
Dash indicates that regions of interest can not be drawn in the zone. np = not performed. SPECT, single photon emission computed tomography; CBF, cerebral blood flow; CBV, cerebral blood volume; MTT, mean transit time.
Statistical significance (P values) between the relative hemodynamic parameters of the four zones
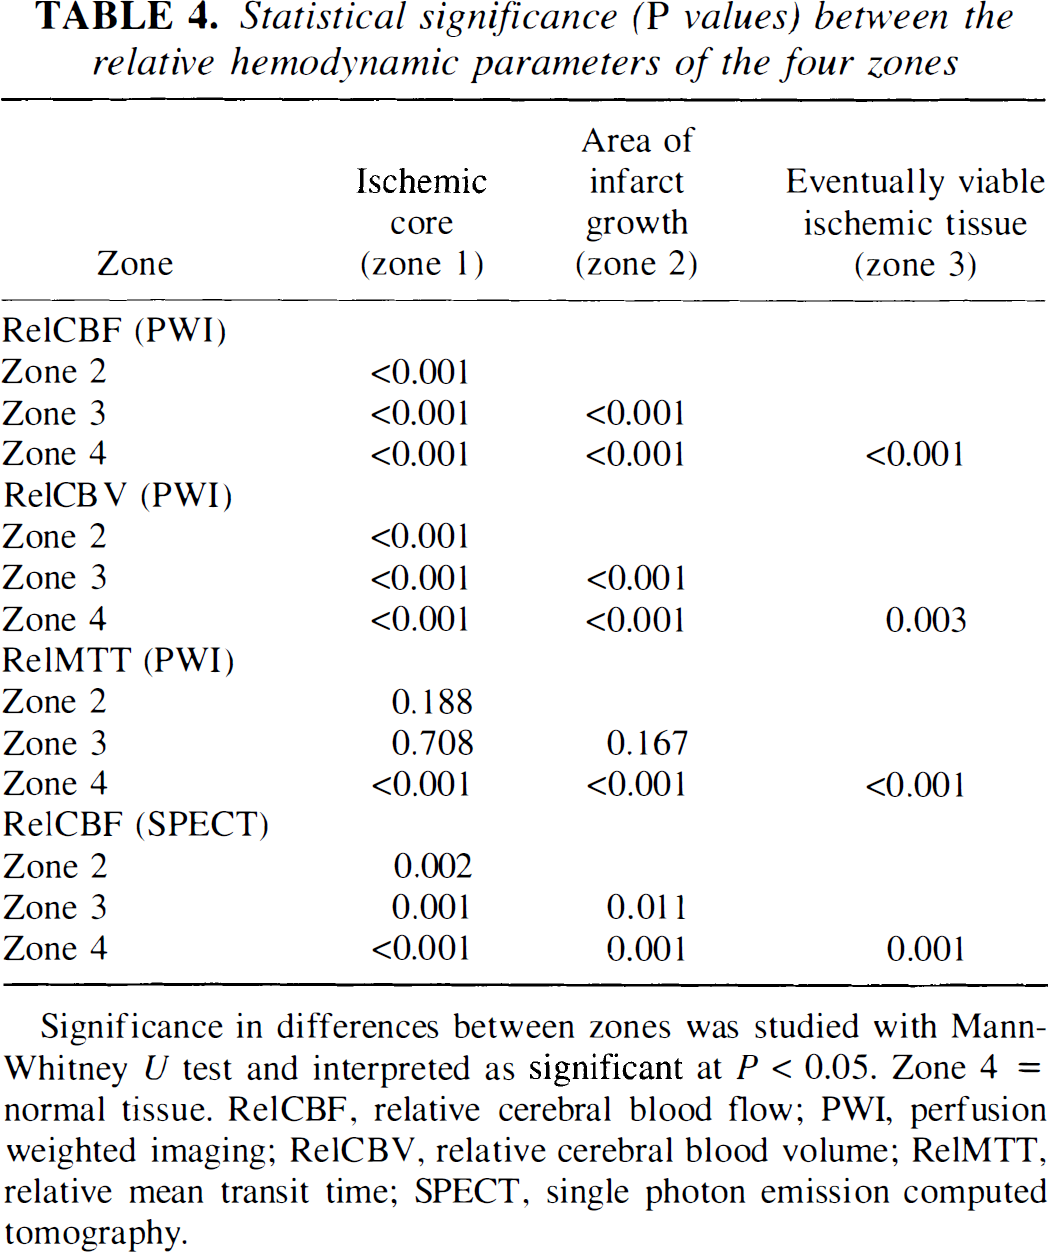
Significance in differences between zones was studied with Mann-Whitney U test and interpreted as significant at P < 0.05. Zone 4 = normal tissue. RelCBF, relative cerebral blood flow; PWI, perfusion weighted imaging; RelCBV, relative cerebral blood volume; RelMTT, relative mean transit time; SPECT, single photon emission computed tomography.
DISCUSSION
At present, the efficient therapeutic time window for ischemic stroke is limited to 6 hours within the onset of symptoms (Albers, 1999). This rigid time window has been challenged by studies on human ischemic stroke (Baron et al., 1995). There is evidence that many patients have potentially salvageable tissue even up to 24 hours after stroke onset (Albers, 1999; Baron et al., 1995; Fisher, 1997). The potential effectiveness of therapy does not depend only on the time delay from the onset of symptoms, but obviously also on the presence of salvageable tissue at the time of administration of the treatment (Albers, 1999; Baron et al., 1995; Fisher, 1997). Although only one patient in the present study had the first MR imaging within 6 hours, our results reflect the clinical reality; i.e., only a minority of patients with ischemic strokes are hospitalized within 6 hours of the onset of symptoms. In contrast, the patient imaged within 6 hours of the onset of symptoms (patient 6) did not seem to have had salvageable ischemic tissue left.
Ischemia causes a decrease in the molecular diffusion of water. The main mechanism for this change is thought to be cytotoxic edema (Baird and Warach, 1998). DWI is able to detect ischemic cellular injury earlier than any other imaging method in vivo. Early ischemic changes have been detected with DWI even when standard T2-weighted images are normal, both in animal models and in humans (Moseley et al., 1990; Sorensen et al., 1996). In a rodent stroke model with focal middle cerebral artery occlusion, the DWI lesion volume became equivalent in size to the histologically measured final infarct size within 24 hours (Knight et al., 1994; Minematsu et al., 1992a). Schwamm et al. (1998) reported that in humans, the DWI lesion volume reached its maximum, on average, 70 hours after onset of stroke. The lesion on the initial DWI can be considered to represent the ischemic core. Subsequently, the lesion detected with DWI at 1 week can be considered to represent the final infarcted tissue. The difference between the lesions assessed by DWI on the initial examination and on the examination at 1 week can be determined as the area of infarct growth. However, because T2 effect also contributes to the signal intensity on DWI, accurate determination of the extent of the infarcted tissue at 1 week may be impaired by vasogenic edema.
Using PET, Schumann et al. (1998) suggested that CBF/CBV ratio (1/MTT) is directly proportional to the cerebral perfusion pressure. MTT may be prolonged even when there is only a modest decrease in the perfusion pressure, such as in oligemic states. Consequently, because MTT is a very sensitive marker of decreased perfusion pressure in acute stroke, it may be used for detecting tissue that is at risk of infarction but that may also remain viable if adequate perfusion is restored.
Comparison of SPECT and PWI
There was a curvilinear relationship between the relCBF measured from 99mTc-ECD-SPECT and PWI. The reason behind this phenomenon may be that the 99mTc-ECD uptake ratio shows a curvilinear relationship with CBF measured with PET (Tsuchida et al., 1994). In contrast, the CBF measured from PWI is in a linear relationship with absolute CBF measured with PET (Østergaard et al., 1998).
99mTc-ECD has moderate cerebral extraction in cortical regions with high flow rates, and high cerebral extraction in regions with low flow rates (Walovitch et al., 1994). When 99mTc-ECD-SPECT was performed on patients with acute ischemic stroke, the underestimation of CBF was more severe on the contralateral control side (with high flow rate) than on the ischemic side (with low flow rate). Therefore, the lesion-to-normal ratio (relCBF) on 99mTc-ECD-SPECT underestimated the severity of hypoperfusion in patients with ischemic stroke. Furthermore, unlike the feature of the another perfusion-dependent tracer, technetium-99m-hexamethylpropyleneamine oxime (99mTc-HMPAO), the uptake of 99mTc-ECD is affected also by brain metabolism. In hypoperfused states, the uptake of 99mTc-ECD is better preserved than would be predicted by the CBF (Shimosegawa et al., 1997). This may also contribute to the discrepancies between relCBF measured on SPECT and PWI in the present study. In clinical practice, the potential of 99mTc-ECD-SPECT to provide information also of brain metabolism might also be of special interest.
SPECT relies on the diffusion of a lipophilic radiotracer across the blood-brain barrier and provides a good estimate of perfusion at the capillary level. PWI is relatively sensitive to the presence of large vessels, even when spin echo echo-planar imaging sequences are used, and provides perfusion information from cortex and nearby vessels in the sulci (Ernst et al., 1999). CBF in the vessels in the sulci, close to the ischemic territory, is affected by the arterial occlusion on the ischemic side. The ratio between the PWI CBF measured from the ischemic side and that from the contralateral side therefore overestimates the severity of the ischemia. Ernst et al. (1999) reported that elimination of large vessels in PWI can improve the correlation between 99mTc-HMPAO-SPECT and PWI in normal subjects. In our material, the relatively high signal from large vessels may partly explain the different relCBF values between SPECT and PWI in ischemic stroke. In addition, the acoustic noise during MR imaging can lead to activation in the primary auditory cortex in the normal temporal lobes, which results in increased CBF in PWI (Bandettini et al., 1998).
Relative hemodynamic parameters
A study by Shimosegawa et al. (1994) showed that the relCBF values, which were measured from the 99mTc-HMPAO-SPECT within 6 hours of stroke onset, were 48% ± 14% and 75% ± 10%, respectively, for the infarct and peri infarct regions. The relCBF of 99mTc-ECD-SPECT for the corresponding tissues in the present study were 45% ± 26% (mean relCBF of the ischemic core and the area of infarct growth) and 87% ± 7% (the eventually viable ischemic tissue), respectively. Our relCBF value for the periinfarct tissue was therefore somewhat higher than reported by Shimosegawa et al. (1994). This discrepancy could be explained by the fact that the lesions with prolonged MTT on MTT maps were visually larger than lesions with reduced CBF on SPECT. Consequently, a part of the eventually viable tissue in the present study would have been categorized as normal tissue in their study. The effect of metabolism on the uptake of 99mTc-ECD may also play a role in this discrepancy.
The threshold for cellular injury at a given CBF is directly related to the duration of ischemia (Hoehn-Berlage et al., 1995; Mancuso et al., 1995). Both experimental stroke models and human studies have shown that the ischemic tissue with very low CBF (<10 to 12 mL/100 g/min) will relatively rapidly lead to irreversible ischemic damage (Hakim et al., 1989; Heiss et al., 1992; Jones et al., 1981; Marchal et al., 1999). In the surrounding region of moderately ischemic tissue (approximately in the range of 10 to 20 mL/100 g/min), the tissue will gradually suffer infarction if low flow persists for a sufficiently long time (Furlan et al., 1996; Hossmann, 1994; Marchal et al., 1996). If the CBF remains in 20 to 30 mL/100 g/min, the tissue will not suffer infarction (Furlan et al., 1996). Flow of 20 to 23 mL/100 g/min seems to be the cutoff CBF value between ischemic tissue that ultimately remains viable and ischemic tissue that eventually suffers infarction (Furlan et al., 1996; Hakim et al., 1989; Jones et al., 1981; Marchal et al., 1996). The CBF of mixed gray and white matter is about 50 mL/100 g/min in normal human brain (Lassen, 1985). Therefore, cutoff relCBF value of 48% can be converted into 24 mL/100 g/min, and the relCBF in ischemic core (13%), the area of infarct growth (35%), and eventually viable ischemic tissue (66%) can be converted into 7, 18, and 33 mL/100 g/min, respectively. These values are in good agreement with the previous studies. In further agreement with our findings, Takagi et al. (1993) demonstrated in a cat stroke model that the threshold CBF for moderate glutamate release was 48% of the preischemic CBF. Glutamate is thought to be the major cause of excitatory neurotoxicity, and this is one of the earliest events occurring in stroke (Takano et al., 1997; Tatlisumak et al., 1998). Hatazawa et al. (1999) suggested that for relCBF, the cutoff value was 52% and for relCBV the cutoff value was 85% between infarction and noninfarction in human ischemic stroke.
Schlaug et al. (1999) found that in the ischemic core and in the area of infarct growth, the CBF decreased to 12% and 37% of the contralateral control region, respectively. Compared with the present study, Schlaug et al. (1999) used different methods to generate CBV, CBF, and MTT maps. They did not identify the arterial input function and determined the end of the first pass bolus separately for each region (core, contralateral control region, and penumbra), whereas we used a relatively large ROI to identify a global end point for all voxels. Thus, the relative CBV values in our study and the study by Schlaug et al. (1999) are not directly comparable. It is interesting that despite the different methods to calculate CBF maps, the CBF values for the area of ischemic core [13% in our study vs. 12% in the study by Schlaug et al. (1999)] and for the zone of infarct growth (35% and 37%, respectively) are rather similar in these two studies.
In 23 cases studied within 12 hours of onset, Sorensen et al. (1999) reported that the lesion volumes on CBV maps correlated better with the eventual infarct volumes than the lesion volumes on CBF and MTT maps did. Also in our approach to predict tissue outcome, CBV and CBF had slightly different potentials to predict whether the tissue is going to proceed to infarction. According to the discriminant analysis, the specificity to predict the tissue outcome was 66% with the relCBF cutoff value of 48% and it was 82% when the relCBV cutoff value of 87% was used.
Similar to CBF, CBV shows a gradient from the periphery to the core. The relCBV values in the ischemic core, in the area of infarct growth, and in the eventually viable ischemic tissue measured from CBV maps were 25%, 69% and 113%, respectively. These gradients are probably caused by the establishment of collateral circulation and autoregulatory vasodilatation, which both seem to play an important role in preventing the ischemic tissue from proceeding to infarct in the periphery of the ischemic zone (Yonas and Pindzola, 1994). In animal stroke models, a variety of nonvasoactive drugs are able to dramatically reduce the volume of ischemic lesion without substantially changing CBF (Beauchamp and Bryan, 1998). Some nonvasoactive drugs can reach the target region through the collateral circulation. It is noteworthy that the CBV increased to 113% in the eventually viable ischemic tissue. In feline stroke model with middle cerebral artery occlusion, Maeda et al. (1993) reported increased CBV in the affected but noninfarcted cortices. Tsuchida et al. (1997) and Wu et al. (1998) reported similar results in patients with ischemic stroke.
Limitations of the study
Our study has certain limitations. First, only one patient was studied within 6 hours of onset. Whether our results are valid, considering the acute stage in which therapy is presently advocated, must be further studied. It should also be noted that we used an ROI instead of a voxel-based image analysis. Also, we defined the ROIs (the ischemic core, the area of infarct growth, and the eventually viable ischemic tissue) partly retrospectively by using information not only from the initial diffusion trace images and the initial MTT maps, but also from the diffusion trace images at 1 week, when the outcome of the tissue was known. Further studies are needed to confirm whether the tissue outcome can be predicted in the acute phase without the knowledge of the imaging finding at 1 week. In patients with ischemic stroke, CBF and CBV values provided by MR perfusion imaging have not been validated by PET. Comparison studies, with timely adequate comparison of MR imaging CBF values with PET CBF values, in stroke patients would be most helpful.
Conclusion
Combined DWI and PWI allows one to detect hemodynamically different subregions within the initial perfusion abnormality. PWI seems to have potential to replace SPECT in investigating acute ischemic stroke. PWI provides quantitative information with higher spatial resolution, and it has shown potential to predict the outcome of ischemic brain tissue.
Footnotes
Acknowledgments
The authors thank Mrs. Tuula Bruun for secretarial assistance and Minna Husso-Saastamoinen, MSc, and Tomi Kauppinen, PhD, for technical assistance.