
Abstract
Perfusion-and diffusion-weighted magnetic resonance imaging scans are thought to allow the characterization of tissue at risk of infarction. The authors tested the hypothesis that the apparent diffusion coefficient (ADC) decrease should be associated with the severity of the perfusion deficit in ischemic tissue of acute stroke patients. Perfusion-and diffusion-weighted scans were performed in 11 patients with sudden onset of neurologic deficits within the last 6 hours and T2-weighted magnetic resonance imaging scans were obtained after 6 days. Parameter images of the maximum of the contrast agent concentration, time to peak, relative cerebral blood volume, relative cerebral blood flow, and relative mean transit time were computed from the perfusion-weighted data. A threshold function was used to identify tissue volumes with stepwise ADC decreases. An onionlike distribution of successively decreasing ADC values was found, with the lowest ADC in the center of the ischemic region. Correspondingly, tissue perfusion decreased progressively from the periphery toward the ischemic core. This effect was most pronounced in the time-to-peak maps, with a linear association between ADC decrease and time-to-peak increase. Apparent diffusion coefficient values decreased from the periphery toward the ischemic core, and this distribution of ADC values was strongly associated with the severity of the perfusion deficit.
Diffusion-and perfusion-weighted magnetic resonance imaging scans (DWI and PWI) play an increasing role in the characterization of the ischemic deficit in the acute stage of stroke and might serve as a tool to guide therapeutic interventions and to monitor drug efficacy (Benveniste et al., 1992; Marks et al., 1999; Schellinger et al., 2000; Warach et al., 1993). The mismatch between the lesion area in DWI and PWI maps is thought to mirror tissue at risk of infarction (Warach et al., 1993). However, the relationship between diffusion and perfusion changes in acute human stroke tissue is not well characterized and seems more complex and less predictable than in experimental stroke models.
The results of animal studies have shown that the DWI signal intensity increase and the apparent diffusion coefficient (ADC) decline correlate with a critical decrease of cerebral blood flow (CBF), energy depletion, and anoxic depolarization (Busza et al., 1992; de Crespigny et al., 1999; Verheul et al., 1994). Hoehn-Berlage et al. (1995) found low ADC values (<77%) in ischemic tissue with severe CBF decrease and adenosine triphosphate (ATP) depletion as indicators of the ischemic core 2 hours after middle cerebral artery occlusion in rats. Moderately decreased ADC values of approximately 90%, however, were found in tissue compatible with the ischemic penumbra (moderate CBF decrease and tissue acidosis without ATP depletion), indicating that minute ADC decreases do not necessarily predict irreversible tissue damage. Others have shown that DWI signal intensity increases may well occur above the CBF threshold for ischemic cell depolarization and that the relationship between DWI signal intensity decrease and the CBF threshold is time-dependent (Kohno et al., 1995; Mancuso et al., 1995). This diffusion slowing with CBF decreases above the threshold for cell depolarization may be explained by cell swelling resulting from hyperosmolarity with intracellular lactic acidosis (Matsuoka and Hossmann, 1982) or transient periinfarct depolarizations (Hasegawa et al., 1995; Röther et al., 1996a).
Scarce data exist about the distribution of ADC values in acute human stroke tissue. Schlaug et al. (1999) reported ADC values of 91% within an operationally defined penumbra region in stroke patients, whereas ADC within the core of the ischemic lesion declined to 56% of a control region in the unaffected contralateral hemisphere. Inhomogeneous tissue areas with decreased as well as normal or even increased ADC values were found in the acute stage of ischemic stroke (Nagesh et al., 1998; Schwamm et al., 1998; Ueda et al., 1999; Welch et al., 1995; Yang et al., 1999).
In the current study, the authors assessed the association of perfusion parameters with ADC values in patients with acute stroke and hypothesized that decreased ADC values should be associated with a severe perfusion deficit, whereas ADC should tend toward normal values at the rim of the ischemic tissue, with the perfusion deficit becoming successively less severe. The investigation of this relationship is relevant for the definition of the ischemic core and the penumbra by diffusion and perfusion parameters as well as for the discussion of whether a certain ADC threshold might discriminate tissue viability (Hoehn-Berlage et al., 1995; Schlaug et al., 1999).
MATERIALS AND METHODS
Patients
Enrolled in the current study were 11 patients (7 women, 4 men; mean age 63.2 years, range 32–83) who underwent the complete MRI protocol within 1.5 to 6 hours (mean 4.6) after acute onset of ischemic stroke. Follow-up T2-weighted MRI was performed after 6 ± 2.1 days (Table 1) in 10 patients. All patients initially presented for treatment with severe hemiparesis. Informed consent was obtained in all patients. The local ethics committee approved the study. Patients with global aphasia and neurologic diseases other than ischemic stroke were excluded from the study.
Patient characteristics
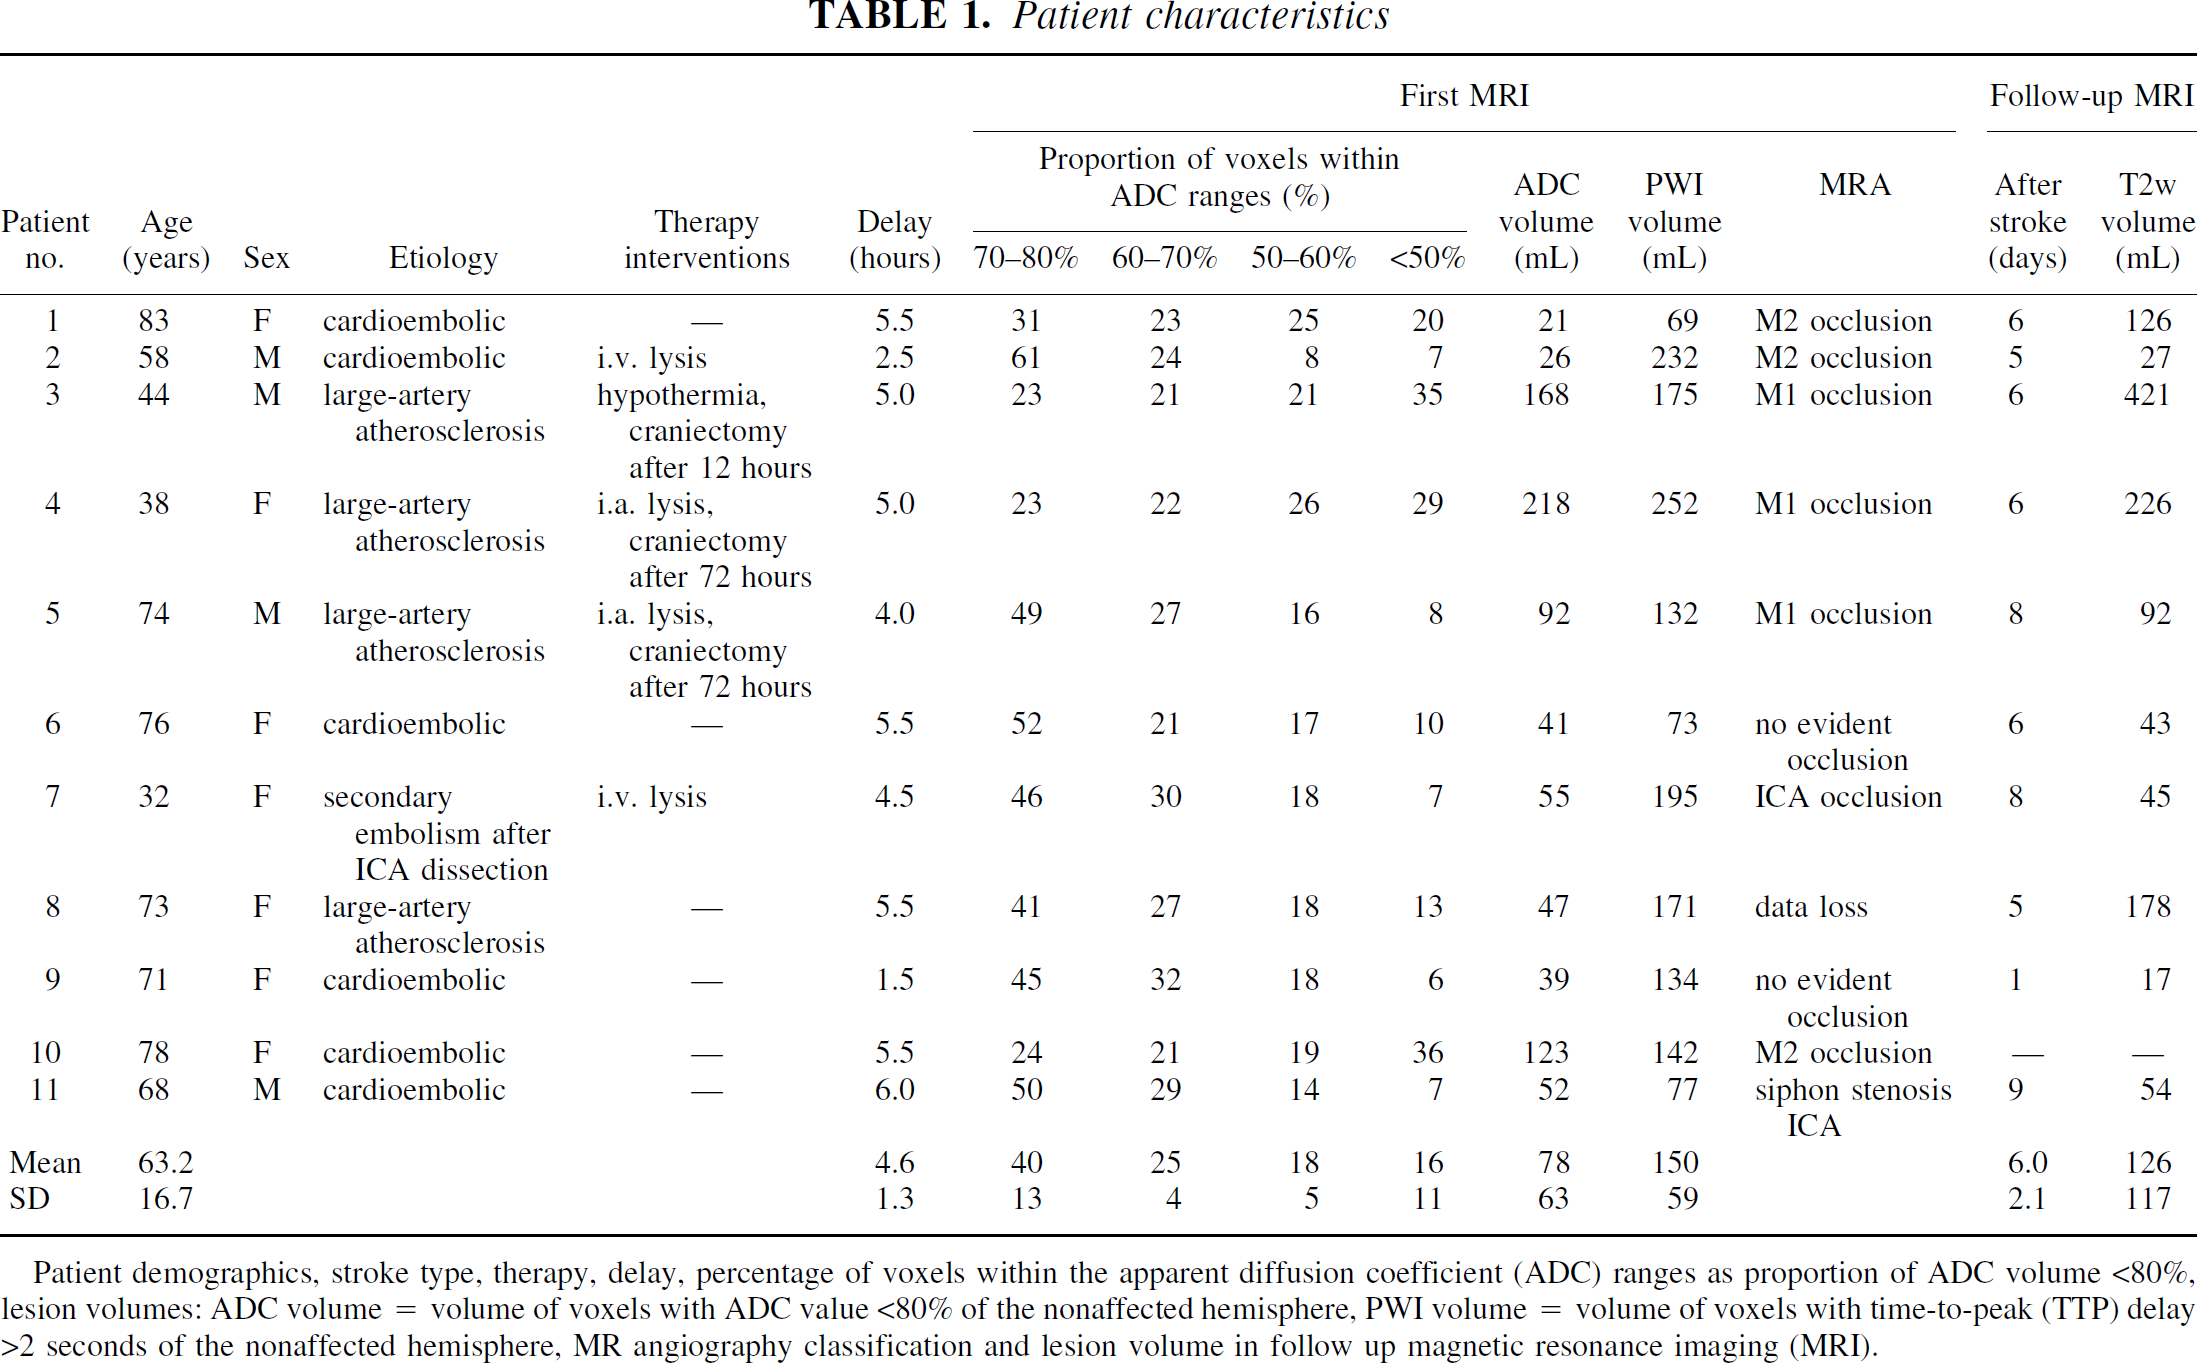
Patient demographics, stroke type, therapy, delay, percentage of voxels within the apparent diffusion coefficient (ADC) ranges as proportion of ADC volume <80%, lesion volumes: ADC volume = volume of voxels with ADC value <80% of the nonaffected hemisphere, PWI volume = volume of voxels with time-to-peak (TTP) delay >2 seconds of the nonaffected hemisphere, MR angiography classification and lesion volume in follow up magnetic resonance imaging (MRI).
Imaging methods
Studies were performed using a 1.5-Tesla clinical whole-body scanner (Magnetom Vision Plus; Siemens, Erlangen, Germany) using a standard head coil. The initial measurements included an axial DWI sequence, a fluid attenuation inversion recovery (FLAIR) sequence, a PWI sequence, and MR angiography. Follow-up MRI consisted of a DWI sequence. The table time was less than 20 minutes. The DWI, PWI, and FLAIR studies were run in corresponding slice positions (commissura anterior/posterior) to accomplish tissue parameter correlation.
The single-shot, spin-echo, echoplanar-imaging DWI sequence was acquired with a repetition time of 4 seconds and an echo time of 100 milliseconds, 19 slices with a slice thickness of 5 mm, interslice gap of 1.64 mm, distance factor of 0.10, field of view 230 mm, matrix 96 × 128 pixels. Six DWI acquisitions were averaged and two different b values (0 s/mm2 in x-direction and 1,000 s/mm2 in x-, y-, z-direction) were acquired. The PWI scanning was performed with a gradient-echo echo-planar imaging sequence, repetition time 1.5 seconds, echo time 29 milliseconds, 11 slices, slice thickness 5 mm, interslice gap 1.64 mm, field of view 230 mm, matrix 128 × 128 pixels. The slice position was obtained from the DWI scan and was placed into the center of the DWI lesion area. Contrast agent (0.1 mL/kg gadolinium-DTPA; Magnevist, Schering, Berlin, Germany) was administered using a power injector at 5 mL/s via access (0.9 mm Ø) in a cubital vein. The bolus injection started with a predetermined delay of 6 seconds after the first of 42 scans. A movie function for exclusion of movement artifacts was used and excluded evident differences between the image distortion in DWI and PWI (Fig. 1). Magnetic resonance angiography was obtained using a three-dimensional fast imaging with steady precession (FISP) sequence with venous saturation, magnetization transfer saturation pulse, and tilted optimized nonsaturation excitation (TONE)-up pulse, repetition time 32 milliseconds, echo time 6 milliseconds, flip angle 20°, 2 slabs with 32-mm slab thickness, 24 partitions, slice thickness 1.33 mm, field of view 180 × 240 mm, matrix 108 × 256. The FLAIR sequence was not a subject of this article and is not described further.
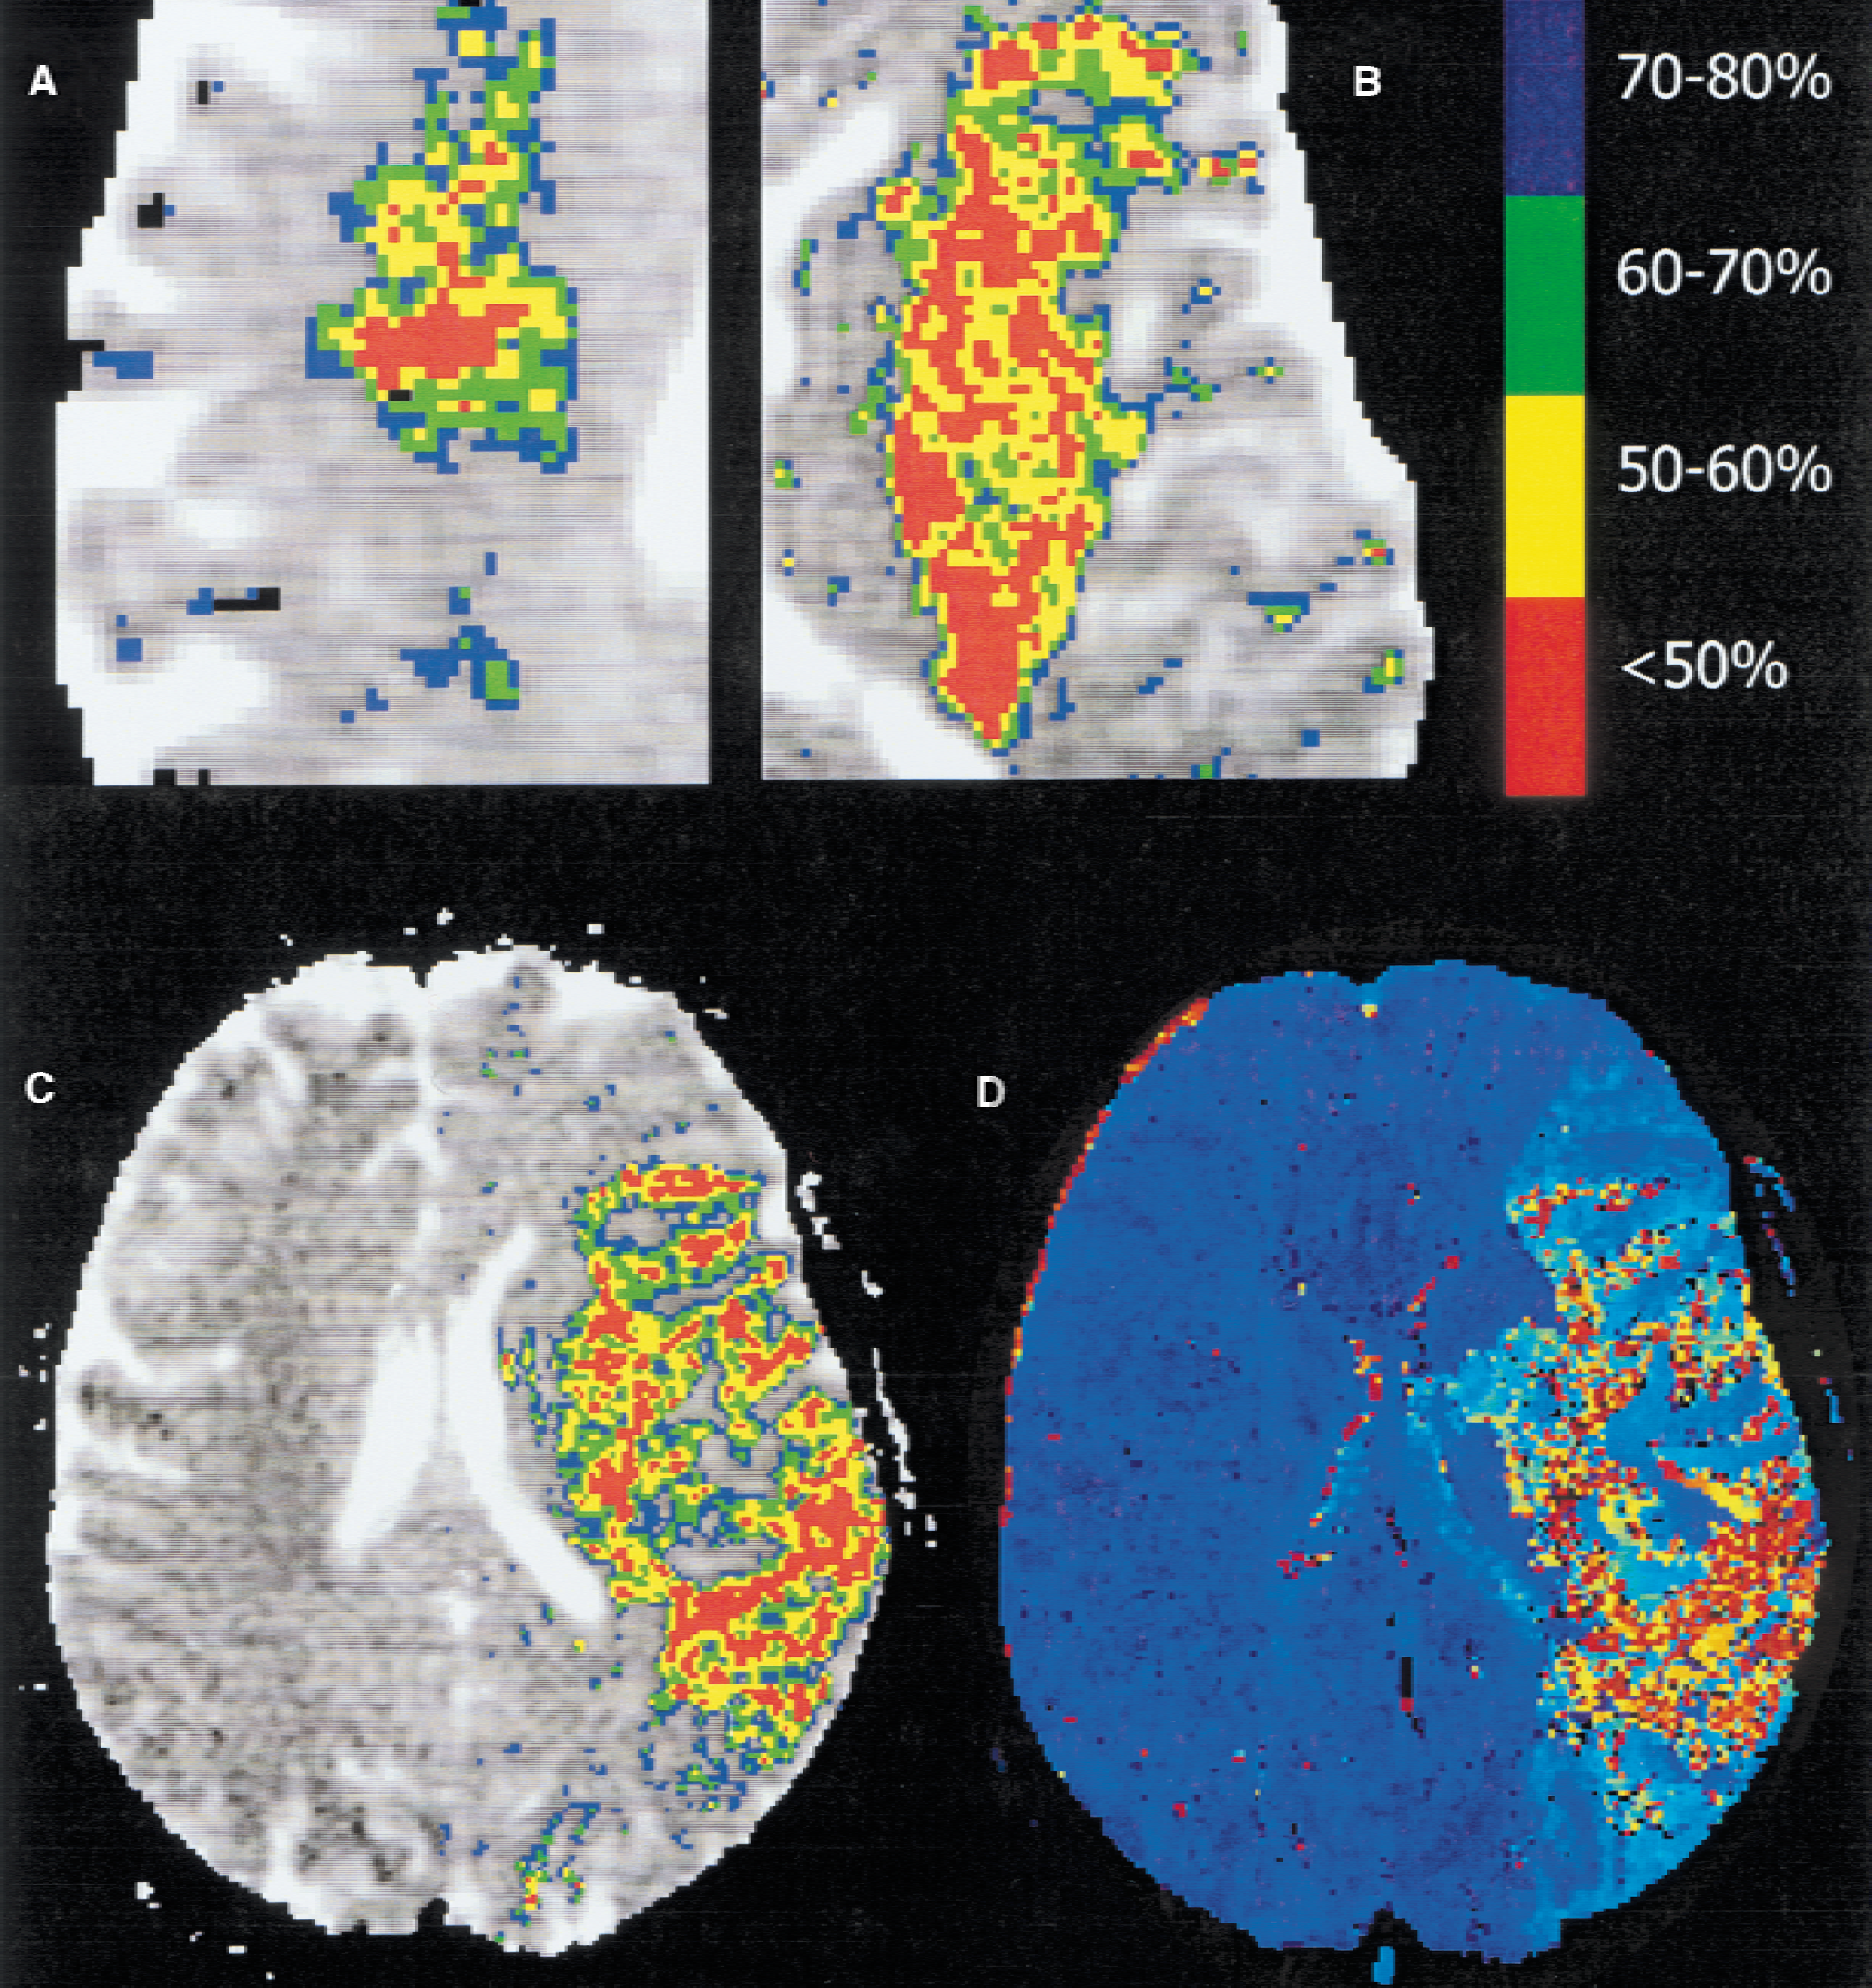
Magnification of the initial apparent diffusion coefficient (ADC) maps of patients 6
Postprocessing
Images were zero-filled to a 256 × 256 matrix just after acquisition on the scanner. Postprocessing of the image data was performed offline using custom software (MRVision, Menlo Park, CA, U.S.A.) on a Sun Ultra SPARC Workstation. Apparent diffusion coefficient maps from each slice were generated from the diffusion-weighted images for each slice. The ADC value was calculated pixel by pixel using the Stejskal–Tanner equation: ADC= −ln(SI1,000/SI0)/b, where SI is signal intensity.
For PWI, the changes in T2* were expressed as a change in relaxation rate (ΔR2*, where R2*=1/T2*) and were calculated as ΔR2*(t)= -ln[Si (t)/S0]/TE, where Si(t) is the signal intensity at the time point t after injection of the contrast agent, and S0 is the signal intensity without contrast agent. Principles of the indicator dilution theory for nondiffusible tracers were applied to the analyzed concentration-time curves. A gamma variate fit was used on a pixel-by-pixel basis to compute parameter images for maximum signal drop (peak), time to peak of signal drop (TTP), relative cerebral blood volume (rCBV), relative cerebral blood flow (rCBF), and relative mean transit time (rMTT). The rCBV represents the integral under the fitted ΔR2* curve. The rMTT was calculated as the normalized first moment of the fitted curve, up to the peak of the curve. The central volume principle was applied to calculate rCBF by rCBV/rMTT. The perfusion parameters were expressed as arbitrary units. In addition, the correlation coefficient r between the acquired pixel values and the fitted gamma variate curve was calculated, indicating the goodness of the fitted curve.
All slices with an ischemic lesion in DWI and the corresponding slices in PWI were further evaluated. The average ADC values of the nonaffected and affected hemisphere were determined, applying an upper threshold value of 1.00 × 10⁻³ mm2/s to eliminate partial volume effects resulting from high ADC values from cerebrospinal fluid in cortical sulci. Apparent diffusion coefficient values of more than 1.00 × 10⁻³ mm2/s were checked for early ADC increases within the ischemic tissue using a threshold function.
Mean ADC values from each single patient in 11 slices were calculated for each patient from the nonaffected hemisphere and defined as 100%. Pixels with ADC decreases between the ranges of less than 50%, 50% to 60%, 60% to 70%, and 70% to 80% were tagged and threshold areas were transferred to the PWI parameter maps of the same location for correlating measurements. The 80% to 90% ADC threshold was not used because of noise (see below). Average values from each perfusion parameter of the nonaffected hemisphere from 11 slices were determined. For interindividual comparisons, individual percentage values in comparison to the nonaffected hemisphere were the subject of statistical analysis.
As described by Schlaug et al. (1999), b = 0 images of the follow-up DWI scan were used as T2-weighted images for the determination of terminal lesion volumes to prevent a bias of interindividual different dynamics in ADC pseudonormalization on ADC maps. The lesion within 11 slices corresponding to PWI of the initial scan was manually delineated. For inter-and intraindividual comparisons, absolute lesion volumes (in mL) were calculated (Table 1).
In consideration of the discrete and insufficient number (n = 4) of ADC range volumes, the authors did not perform a statistical correlation analysis. An unpaired t-test (two-tailed) for independent samples was used to evaluate significant differences (P < 0.05) between the various perfusion parameters and ADC range volumes. Volumes in follow-up MRI were linearly correlated (P < 0.05) with initial ADC range volumes less than 50%, less than 60%, less than 70%, and less than 80%. Correction for multiple testing was applied.
RESULTS
All patients had DWI lesions in the territory of the middle cerebral artery. Magnetic resonance angiography confirmed vessel occlusions in the M1 (n = 3) or M2 (n = 3) branches of the middle cerebral artery and occlusion of the internal carotid artery (n = 2). In four patients no evident vessel occlusion was detected by MR angiography. Table 1 details the demographic characteristics and cause of stroke. All patients showed a PWI > DWI mismatch as defined by a volume with malperfusion in PWI (TTP delay vs. the mean contralateral value > 2 seconds) > DWI (ADC < 80% vs. the mean contralateral value). The mean ADC volume less than 80% amounted to 49% ± 29 of the perfusion deficit at the acute imaging time point.
The stroke mechanism was classified according to the TOAST criteria (Adams et al., 1993) as cardioembolic (n = 6) and resulting from large artery atherosclerosis (n = 4). One patient had a carotid artery dissection after a chiropractic maneuver. Hemodynamically relevant stenoses of extracranial arteries of the unaffected hemisphere were excluded by Doppler and Duplex sonography.
The ADC value of the nonaffected hemisphere (averaged over 11 slices and all patients) was 0.78 ± 30 × 10−3 mm2/s. The total ADC volume with values less than 80% was 78 ± 62 mL. There was an onionlike distribution of successively decreasing ADC values, with the lowest ADC in the center of the ischemic area (Fig. 1). In three patients (Table 1), the volume with ADC decreases of less than 50% covered more than 25% of the whole volume with ADC decreases of less than 80%. In two of them, large right hemispheric swelling developed and they underwent hemicraniectomy (patients 3 and 4). Patient 10 died on day 4 as a result of a large left hemispheric infarction.
Significant associations were found between the peak, TTP, and rCBV parameters and the ADC values. This effect was most pronounced for the TTP parameter, with values in comparison to the nonaffected hemisphere of 127% ± 17 in the 70% to 80% ADC volume to values of 161% ± 39 in the less than 50% ADC volume (Fig. 2).
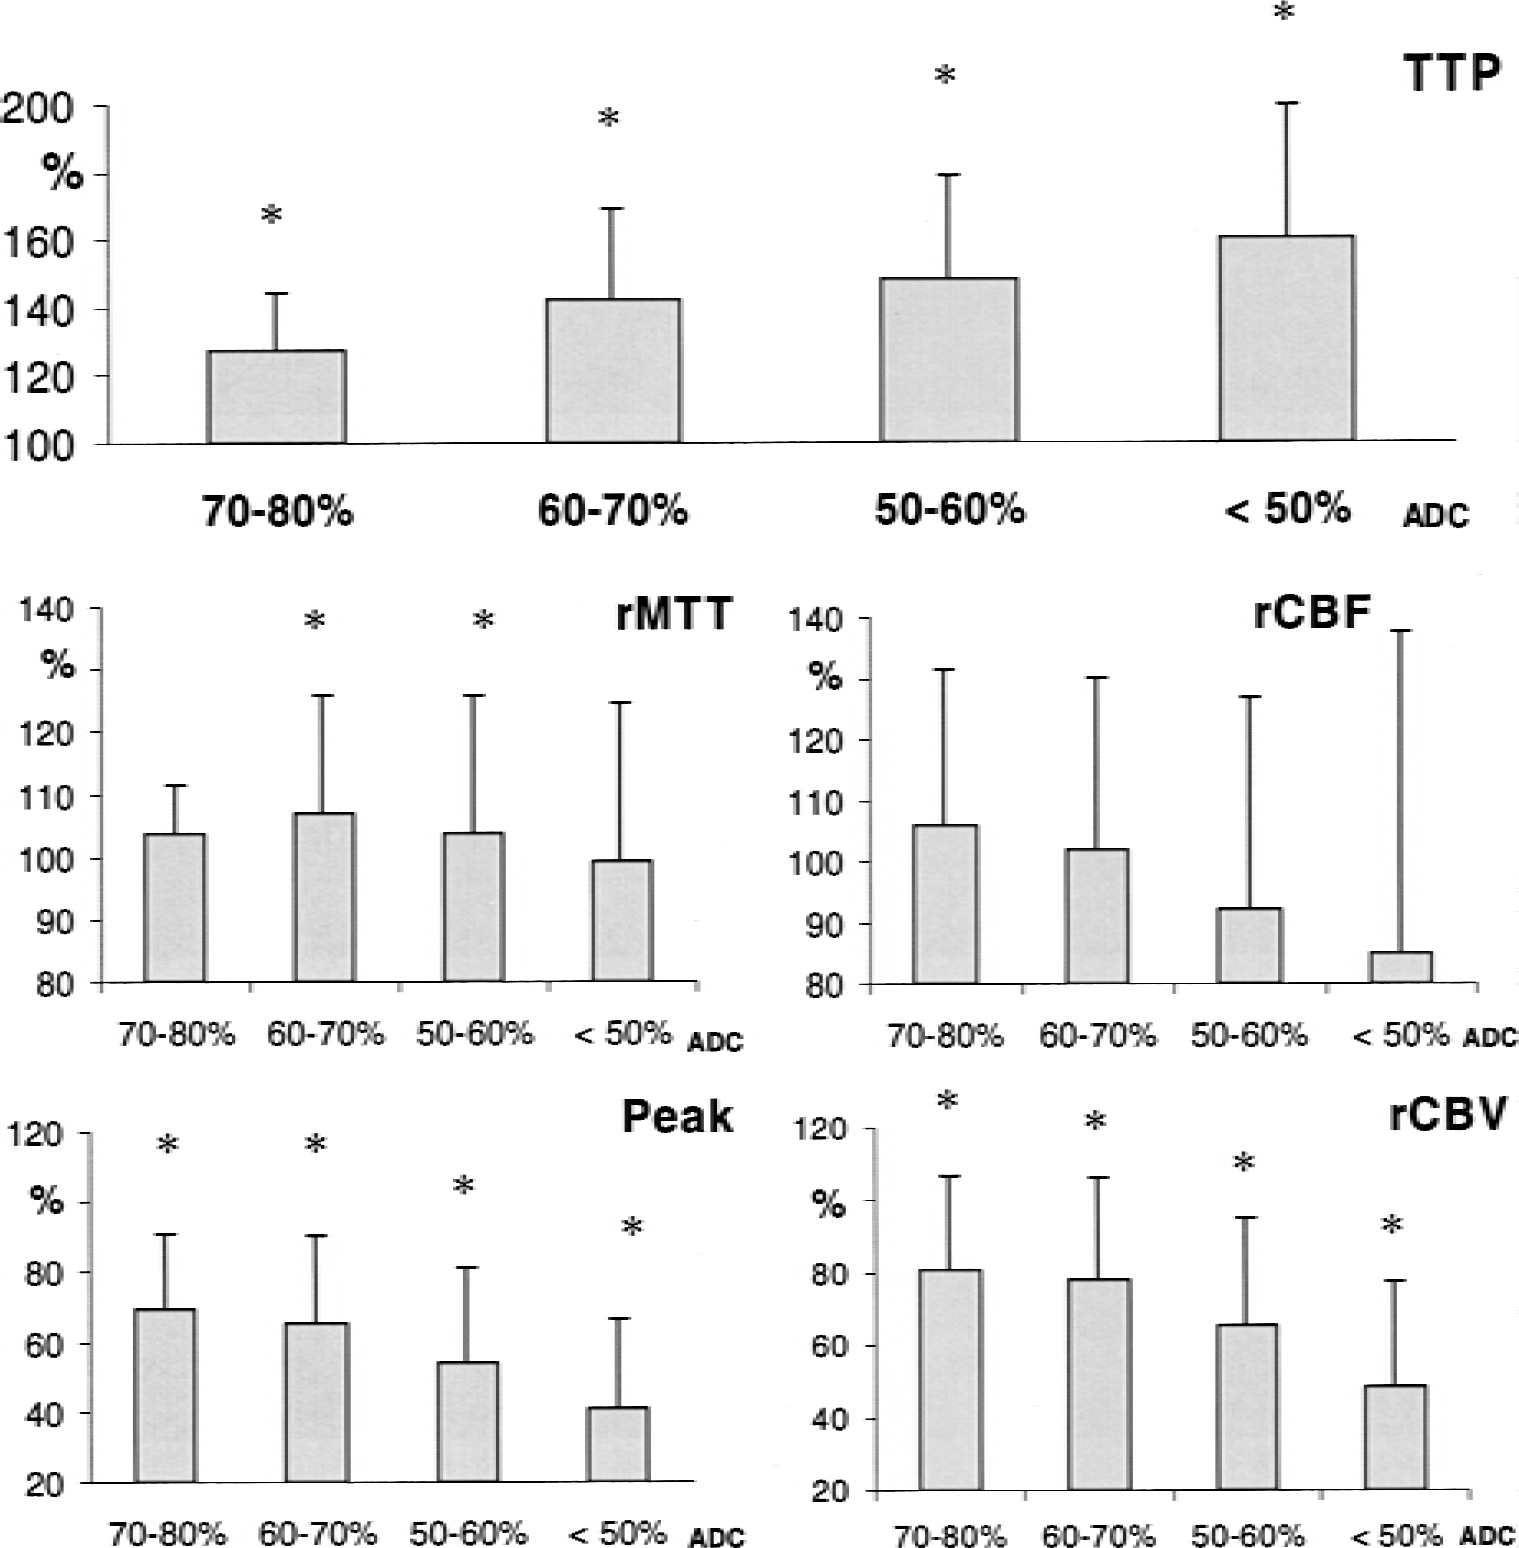
Deviations of perfusion parameters (mean ± SD) versus contralateral as a function of apparent diffusion coefficient (ADC) value ranges. Time to peak of signal drop (TTP). Maximum signal drop (peak) and relative cerebral blood volume (rCBV). Asterisks indicate significant differences (P < 0.05) from the mean contralateral value. Each single TTP step differs significantly from all other TTP values, except the difference between 50% and 60% and 60% and 70%. Both peak and rCBV values are significantly different from the next-but-one ADC threshold volume (70–80% to 50–60% and <50%, 60–70% to <50%). In addition, an ADC threshold volume of 50% was significantly different from the 50% to 60% values.
The normalized rCBV within the lesion was significantly decreased to 81% ± 26 in the 70% to 80% ADC threshold volume and decreased continuously toward 48% ± 29 in the volume with ADC of less than 50%. The rCBV reduction reached significance (P < 0.05) for each next-but-one ADC threshold volume (70–80% to 50% to 60% and <50%, 60–70% to <50%). In addition, the ADC threshold volume of 50% was significantly different from the 50% to 60% values.
The peak parameter values of the affected hemisphere revealed a significantly lower peak compared with the contralateral hemisphere. Comparable with the rCBV parameter, the next-but-one ADC threshold reached a significant difference concerning the peak values. The normalized peak parameter values varied from 69% ± 22 to 41% ± 26 in the volume with an ADC from 70% to 80% and less than 50%, respectively (Fig. 2).
A significant difference was found between the rMTT parameter within the 50% to 60% and 60% to 70% ADC range volumes only (P < 0.05). No significant association was found between rCBF decrease and ADC range volumes.
The final MRI lesion volume (T2-weighted) significantly exceeded the initial total ADC volume in 4 of 10 patients by at least 50% (patients 1, 3, 6, 8;Table 1), whereas in 5 patients (patients 2, 4, 5, 9, 11) there were only increases by less than 10%. In one patient (patient 7) there was a volume decrease. The extent of the DWI < PWI mismatch was not predictive for the final lesion volume. However, T2-weighted lesion volumes correlated with different initial ADC range volumes as follows: less than 50%, r = 0.85; less than 60%, 0.80; less than 70%, 0.78; and less than 80%, 0.76.
DISCUSSION
Apparent diffusion coefficient distribution
In the current study, the authors tested the hypothesis that the degree of the ADC decrease should be determined by the severity of the perfusion deficit. Focal ischemic regions consist of an ischemic core surrounded by areas of reduced perfusion (Astrup et al., 1981; Hossmann, 1994). In the current study there was a similar pattern of onionlike decreasing ADC values from the periphery toward the center of the infarct core in humans within 6 hours after acute onset of stroke symptoms (Fig. 1). The authors were able to show that there is a significant association between MR perfusion parameters and ADC threshold values in acute human stroke. These results confirm in humans the dependency of ADC decreases from the severity of the perfusion deficit as known from previous animal work (Hoehn-Berlage et al., 1995; Mancuso et al., 1995; Miyabe et al., 1996; Pierce et al., 1997).
A body of literature supports the hypothesis that ADC changes during focal and global ischemia, spreading depression, and periinfarct depolarizations reflect the water shift from the extra-to the intracellular compartment with concomitant cell depolarization (de Crespigny et al., 1998; Duong et al., 1998; Hasegawa et al., 1995; Röther et al., 1996a). Although decreased membrane permeability in the intracellular space and restricted intracellular water diffusion contribute to ADC changes during cerebral ischemia (Duong et al., 1998; Huang et al., 1997; Wick et al., 1995), the restriction of the water diffusion in the extracellular space seems to be a major factor for ADC decreases during cell depolarization. Apparent diffusion coefficient values decline as early as 2 minutes after middle cerebral artery occlusion (Davis et al., 1994; Röther et al., 1996a), and the ADC decrease spreads from the ischemic core toward adjacent areas over time (Reith et al., 1995). The onionlike pattern of decreased ADC values in the current study represents a snapshot in this development.
The authors did not correct for gray and white matter differences in rCBF, rCBV (Leenders et al., 1990), and ADC values (Benveniste et al., 1992) because the discrimination would have been complex and very subjective for middle cerebral artery infarction (in contrast to, for instance, anterior choroidal artery infarction (Doege et al., 2000)). However, if there were gray and white matter inhomogeneities within the ischemic area, a statistically significant association was still found between ADC and PWI parameters.
The use and clinical impact of moderately reduced ADC values are limited by noise and partial volume effects (Hoehn-Berlage et al., 1995). In the current study, the mean ADC in the normal contralateral hemisphere was 0.78 ± 0.03 × 10⁻³ mm2/s. The authors could not apply an ADC threshold between 80% to 90% because of the variability of the ADC values within the normal hemisphere. As Hoehn-Berlage et al. (1995) stated before, minor ADC reductions of approximately 10% cannot reliably be observed using a conventional spin-echo sequence.
Perfusion
Magnetic resonance perfusion imaging using bolus contrast application is a semiquantitative approach (Rosen et al., 1990; Villringer et al., 1988). Nevertheless, parameter maps of the TTP delay were shown to correlate with stroke volume and outcome scores in clinical studies (Beaulieu et al., 1999; Neumann-Haefelin et al., 1999). Accordingly, the current authors found a linear association between ADC and TTP delay within the infarct tissue. Other authors found rMTT to be a useful parameter for defining the perfusion deficit (Barber et al., 1998; Schellinger et al., 2000; Schlaug et al., 1999). Expressing rMTT as the first moment of the concentration-time curve is only an approximation and must await an appropriate physiologic model for tissue blood flow (Wittlich et al., 1995). In the authors' experience, the applied fitting algorithm tended to fit noise within a no-flow concentration-time curve in severely ischemic volumes, resulting in a short rMTT that mistakenly indicated a moderate perfusion deficit (Fig. 3). The impact of this effect is much less pronounced for the peak and rCBV parameter, where this “misfitting to noise” results in values indicating malperfusion. Although rMTT clearly differentiated between volumes of normal and decreased ADC values, in agreement with others the current authors did not find rMTT to be a parameter for the differentiation of distinct volumes within the infarct core (Barber et al., 1998; Schlaug et al., 1999).
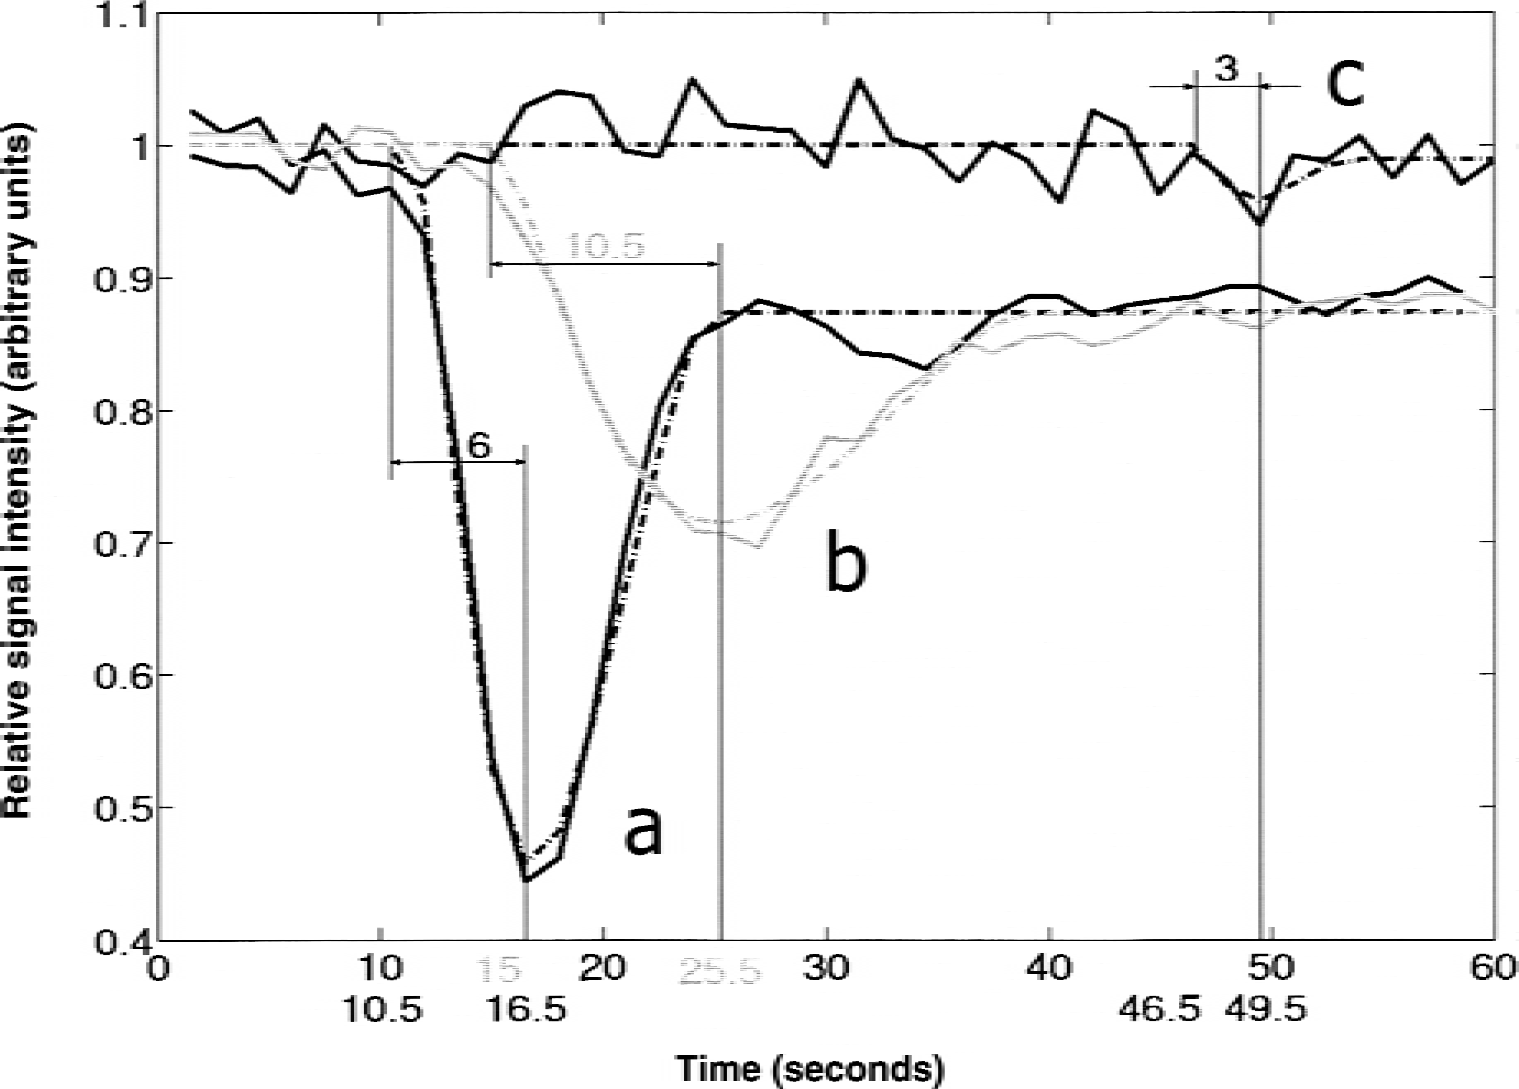
Examples of normalized relative signal intensity (in arbitrary units) versus time (in seconds) in volumes with different apparent diffusion coefficient (ADC) values in patient 5. The dotted curve represents the appropriate gamma variate fit. Graph (a) represents the change in signal intensity within the nonaffected hemisphere. Graph (b) shows the change within a volume with moderately decreased ADC value (60% to 70% of the mean contralateral ADC value). An example of “misfitting to noise” within a volume with ADC less than 50% of the mean contralateral ADC value is shown as graph (c), with a consecutive short relative mean transit time but an obvious time-to-peak delay.
Concerning the rCBF parameter, the current authors found a gradual and overall not significant decrease in rCBF, with a minimum of 85% within the volume with ADC values of less than 50%. Regional cerebral blood flow, as obtained by MR bolus tracking, is the only perfusion parameter derived from two different variables (time and signal intensity) of the concentration-time curve. This could result in additional noise, with consecutive loss of statistical power. In comparison with the weak association of rCBF and the ADC values, the rCBV parameter was deemed much more reliable. The rCBV reduction was much more pronounced within the infarct core and reached significant gradual differences between most ADC range volumes. The current data affirm the reliability of this parameter as an indicator of the infarct core, as was shown in several MRI studies of acute stroke (Hatazawa et al., 1999; Rordorf et al., 1998; Röther et al., 1996b; Ueda et al., 1999). The behavior of the peak parameter was very similar but showed a slightly more distinct decline (Fig. 2); this encourages its further application in clinical stroke studies.
Outcome
In the current study, volumes with severe initial ADC reductions were correlated with final lesion volumes in T2-weighted images. Thus, absolute ADC values might have implications for the predictive value of ADC for tissue viability and stroke outcome. In principle, moderate ADC decreases might serve as an indicator of tissue viability, with the property of true normalization in the event of early reperfusion. In a retrospective approach, Schlaug et al. (1999) found ADC values of 91% within an operationally defined penumbra in stroke patients, whereas ADC within the core of the ischemic lesion was lowered to 56% of control values. A promising approach for estimation of prognosis might be the generation of multiparametric probability maps (Alger et al., 2000). It is important for this method that PWI and ADC are not statistically independent in acute stroke patients.
However, there was not a good absolute correspondence of initial total ADC volumes and final infarct volumes (T2-weighted) in all patients. In three patients there was considerable lesion enlargement, and in one patient there was a lesion decrease of 18%. True normalization of ADC decreases with persistent normal MR signal intensities in the T2-weighted image is thought to be rare (Neumann-Haefelin et al., 2000). Kidwell et al. (2000) reported a true reversal of early decreased ADC values in six of seven patients after intraarterial thrombolytic therapy and a secondary ADC decrease in three of those patients. It seems therefore likely that early ADC normalization is bound to timely reperfusion. The relationship between the severity of ADC decreases and ADC normalization has not been studied and awaits further analysis.
In a small subpopulation in the current study (n = 3), large volumes with ADC values of less than 50% (proportion >25% of the total ADC volumes <80%;Table 1) indicated severely ischemic tissue in patients with total ADC volumes less than 80% of more than 100 mL. In these patients, large hemispheric swelling developed that required hemicraniectomy (patients 3 and 4), and one patient (patient 10) died of herniation. The constellation of severely decreased ADC values and a small PWI–DWI mismatch (Table 1) in major parts of the middle cerebral artery territory might serve as a parameter for early hemicraniectomy. This finding in a small series of patients needs further evaluation in a larger trial.
Conclusion
The results of the current investigation validate previous data from animal work where acute ischemic lesions exhibited a gradient of diffusion slowing from the ischemic core toward the periphery in acute stroke patients. In a clinical setting, the authors found a gradient of ADC decrease toward the center of stroke lesions mainly dependent on perfusion. The authors' observation of the dependency of ADC and tissue perfusion might prove useful for the estimation of stroke outcome using multiparametric probability maps (Alger et al., 2000).
Footnotes
Acknowledgment:
The authors thank Alexander de Crespigny for helpful instructions on the application of the software MRVision.