
Abstract
Despite promising results in preclinical stroke research, translation of experimental data into clinical therapy has been difficult. One reason is the heterogeneity of the disease with outcomes ranging from complete recovery to continued decline. A successful treatment in one situation may be ineffective, or even harmful, in another. To overcome this, treatment must be tailored according to the individual based on identification of the risk of damage and estimation of potential recovery. Neuroimaging, particularly magnetic resonance imaging (MRI), could be the tool for a rapid comprehensive assessment in acute stroke with the potential to guide treatment decisions for a better clinical outcome. This review describes current MRI techniques used to characterize stroke in a preclinical research setting, as well as in the clinic. Furthermore, we will discuss current developments and the future potential of neuroimaging for stroke outcome prediction.
Introduction
Stroke is the third leading cause of death and the leading cause of disability in developed countries globally. The major obstacle to effective acute stroke management is time. It is estimated that fewer than 10% of all stroke patients receive the only approved treatment, thrombolysis with recombinant tissue plasminogen activator (rtPA; Cocho et al, 2005). There are several reasons for this, the primary of which is that thrombolysis is only approved for use within 3 h after symptom onset, although recent studies have suggested benefit beyond that from 4.5 (Hacke et al, 2008) to as long as 6 h (Davis et al, 2008; Rother et al, 2002). Other potential reasons include lack of public awareness, intrahospital delays, or precaution on account of the increased risk (7%) of intracerebral hemorrhage (ICH) that accompanies rtPA (Bambauer et al, 2006; Kleindorfer et al, 2004). In addition, it is controversial whether small vessel occlusions (lacunar stroke) respond as well to thrombolysis as territorial strokes (Cocho et al, 2006; Hsia et al, 2003; Hwang et al, 2008; rtPA for minor strokes: the National Institute of Neurological Disorders and Stroke rt-PA Stroke Study Experience, 2005). Nevertheless, when successful, early recanalization is highly correlated with reduced infarct volume and improved outcome scores (Felberg et al, 2002; Uchino et al, 2005). Because acute neuroimaging is not consistently performed, it is difficult to estimate the number of patients that exhibit spontaneous recanalization. Reports vary between 77% in patients with cortical infarcts using computed tomography (CT) and 32% in patients with middle cerebral artery occlusion (MCAO), using magnetic resonance angiography (MRA; Jorgensen et al, 1994; Neumann-Haefelin et al, 2004). Clearly, the heterogeneity of the patient population makes the decision to treat a difficult one. Therefore, effective neuroimaging strategies are essential to improve the standard of patient care.
Although CT is still the most prevalent imaging modality in acute stroke, magnetic resonance imaging (MRI) is starting to measure up. The slightly longer acquisition times required for MRI represent a disadvantage. However, in less than 15 mins several different scans can be obtained that provide much more information regarding different tissue parameters. Magnetic resonance imaging can identify preexisting lesions and/or diseases, locate the thrombus, recognize ICH, classify stroke subtype, assess blood supply, and provide information about the approximate time of ischemia onset and the extent of injury. The function of MRI in acute stroke is to confirm the clinical diagnosis and to assess the risks and benefits for therapy. In an ideal situation, MRI would provide information that would assist with stratification of patients based on most likely outcome. In the acute clinical setting, important scenarios to differentiate for the clinician are: (1) spontaneous improvement, (2) improvement with therapy, and (3) no improvement despite therapy (Figure 1). In this review, we describe the MRI techniques currently used as surrogate markers and predictors of outcome in patients and experimental animal models of stroke. Future challenges of MRI-based outcome prediction in stroke will be discussed.
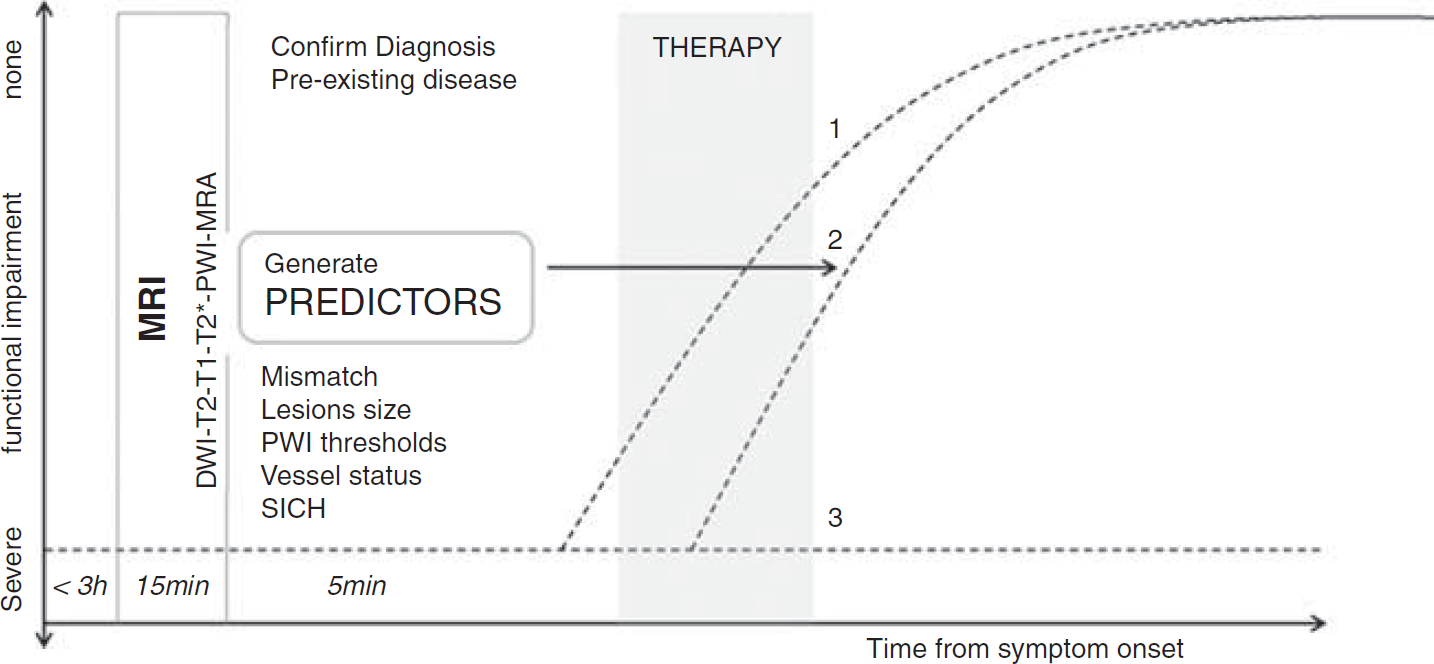
Magnetic resonance imaging (MRI)-guided stroke therapy. Three clinical scenarios are indicated in this diagram: (1) spontaneous improvement, (2) improvement in response to therapy, and (3) no spontaneous improvement or response to therapy Only in scenario 2 is therapy really effective, whereas side effects could worsen outcome in 1 and 3.
Surrogates for outcome assessment
One of the key issues in stroke assessment is how to best choose study end points that appropriately indicate outcome. Ideally, the end point should reflect the functional impairments caused by the disease and/or their effect on the quality of life. Therefore, the most common end points in the clinic are neurologic scales. Several neurologic scales have been used as surrogates for outcome, among them the modified Rankin scale, Glasgow Outcome Scale, and Barthel Index (Kasner, 2006). The modified Rankin scale and Glasgow Outcome Scale are used as indicators of functional independence for daily activities; and although both have been shown to be extremely reliable and reproducible (Banks and Marotta, 2007), they are not as comprehensive as the Barthel Index, which provides a more detailed examination of self-care abilities (Sulter et al, 1999). However, these measures are usually only performed out to 3 months because most spontaneous recovery is maximal by 10 weeks (Schiemanck et al, 2006). Therefore, these outcome surrogates have not been sufficiently studied long term, despite the fact that the aged brain may be capable of recovery many years after stroke.
In experimental animal research functional outcome surrogates are referred to as behavioral testing. Unfortunately, as most end point measures are collected within the first week of the ischemic event it is difficult to identify potential surrogates of functional outcome in the chronic setting. Nevertheless, several approaches have been used to assess functional outcome. A wide range of neurologic scores have been developed that attempt to mimic the clinical situation. They range from a simple 0 to 5 score based primarily on forelimb retraction (Bederson et al, 1986) to a slightly more detailed assessment that includes sensory response to stimuli (Garcia et al, 1995). Often this approach is preferred because neurologic scores are easy to perform, fast, and require very little equipment or expertise. However, the scores are not particularly sensitive to specific functional impairments and animals show a great deal of recovery. Other tests are designed to maximize the difference between the intact and impaired side of the body, typically, sensory capabilities of the forepaws. These are collectively referred to as asymmetry tests (Barth et al, 1990; Schallert et al, 2000). Ideally, tests designed to monitor skilled motor function in rodents should provide better comparability to the clinical situation. Challenging tests for skilled motor function exist, for example, skilled reaching for food in trays, on staircases (Montoya et al, 1991), or single food items (Whishaw et al, 1992). However, the highly labor-intensive and interpretive nature of these tests means they are often excluded from the literature.
Imaging surrogates
Infarct Size
Magnetic-resonance-assessed final infarct size has been consistently used as an outcome surrogate based on the notion that the size of the insult is correlated with outcome severity. Indeed, a recent meta-analysis of the clinical literature—not part of any randomized clinical trial—reported a correlation between MRI-based lesion size and functional outcome parameters (Schiemanck et al, 2006). This analysis included studies that used several different methods to estimate acute lesion size including diffusion and perfusion weighted imaging (DWI and PWI, respectively), as well as T2-weighted imaging. The T2-weighted volume estimations are typically smaller than the initial DWI or PWI lesion size calculations, and are more reliable for subacute and long-term detection than they are for acute detection. As such, they are often used as a surrogate for final infarct size (Kane et al, 2007). Diffusion weighted imaging and PWI for acute lesion size will be discussed later about their potential to predict final lesion size.
Despite the use of T2-weighted imaging to estimate final infarct size, debate exists regarding whether it is the most reliable measure. Fluid attenuation inversion recovery (FLAIR) is superior to conventional T2-weighted imaging regarding lesion conspicuity in the subacute stages (Ricci et al, 1999) because of its high sensitivity to very small accumulations of fluid by effectively nulling the signal from the cerebral spinal fluid. Fluid attenuation inversion recovery is currently included into the routine clinical acquisition scan package. Furthermore, interrater agreement using fluid attenuation inversion recovery has been reported to be better than for T2-weighted imaging (Neumann et al, 2009). Manual delineation is still the most common approach to estimate infarct size, despite the significant measurement error (Davis et al, 2008), because automated volumetry is confounded by preexisting disease, individual variances in shape, location, and severity of signal change.
Final infarct size has been used consistently as an outcome surrogate in the experimental animal setting. Infarct size has traditionally been measured with 2,3,5-triphenyltetra-zolium chloride, hematoxylin–eosin, or nissl-stained brain sections, though the increasing availability of MRI in the experimental research environment has started to produce studies in which T2-weighted imaging has been used to estimate final infarct size (Ashioti et al, 2007; Farr et al, 2007; Palmer et al, 2001). Infarct sizes assessed by T2-weighted imaging have been shown to correlate well by some (Palmer et al, 2001) and to underestimate histologic damage by others (Neumann-Haefelin et al, 2000). Unfortunately, infarct size has been the primary, and often only, end point measure collected in many experimental stroke studies for quite some time. There are hundreds of potential compounds/drugs that were perceived as potential neuroprotective agents because of their ability to reduce infarct size in rodent models of stroke. However, all have failed to provide any benefits in clinical trials, a comprehensive list of clinical drug trials can be found at the Stroke Trials Registry website of the Internet Stroke Centre (Goldberg). Some of the most popular examples that have made it to phase III clinical trials without evidence of clinical efficacy include glutamate antagonists (for example, Selfotel: Acute Stroke Studies Involving Selfotel Treatment) (Davis et al, 2000), sodium or calcium channel blockers (for example, Lubeluzole: Lubeluzole in Ischemic Stroke) (Diener et al, 2000), or the recently highly publicized free radical scavenger Cerovive: Stroke Acute Ischemic NXY-059 Treatment (SAINT I and II) (Diener et al, 2008). It is therefore likely that the criterion of infarct size alone is insufficient to be used as a sole outcome surrogate. Functional connectivity of adjacent brain regions can be affected by a stroke through retrograde degeneration between existing neuronal networks. This is not observable using infarct size estimations, but could be inferred with other imaging modalities.
Diffusion Tensor Imaging
Anisotropy is the direction-dependent diffusion of water, which is faster in the direction of fiber tracts than perpendicular to them. Therefore, diffusion tensor imaging (DTI) was developed to visualize the orientation and properties of white matter (Basser et al, 1994). In principle, DTI could thus be used to detect some degree of physical connectivity between brain regions, which could be used as an outcome surrogate in the long-term setting. Typically, DTI data are presented as two-dimensional fractional anisotropy (FA) maps. Although FA has consistently been shown to decrease after stroke as gray and white matter disintegrate (Buffon et al, 2005), some variability in FA has been observed acutely. Decreases (Morita et al, 2006; Zelaya et al, 1999) and increases (Bhagat et al, 2008; Ozsunar et al, 2004) have been observed, and though the exact mechanism of the increase remains unclear, it is possible that perpendicular diffusion is restricted hyperacutely. Recovery of FA values 3 years after stroke has been observed in the internal capsule of patients with upper limb impairments subjected to 30 days of motor training (Stinear et al, 2007). If a sufficient number of diffusion directions and gradient strengths are used, DTI data can be reconstructed as three-dimensional maps that are color coded for directional sensitivity and continuous virtual tracts can be traced based on the largest principal diffusivity between voxels (tractography). This strategy has been used to observe changes in the corticospinal tract after stroke (Moller et al, 2007) and to correlate DTI signals in certain fiber tracts of the ischemic hemisphere to the likelihood of outcome improvement (Pannek et al, 2009).
In agreement with the clinical reports, FA values also decrease in the ischemic territory of the rat brain over time (depicted in Figure 2). However, some groups have reported increases in FA values near the lesion boundary between 3 and 9 weeks after stroke (van der Zijden et al, 2008), which is enhanced with neural progenitor cell treatment (Jiang et al, 2006), as well as in the ipsilateral striatum around 21 days after stroke (Granziera et al, 2007). The latter two studies also used ex vivo DTI measurements to obtain tractography. Abnormal fiber trajectories were identified that originated in the ischemic and projected to the contralateral striatum in a small subset of animals with subcortical infarcts (Granziera et al, 2007), and increased numbers of tracts were observed projecting from the corpus callosum into the injured tissue (Jiang et al, 2006). However, conclusions regarding white matter reorganization must be interpreted cautiously on account of the sensitivity of the measurements and drawbacks with the analysis methods. In addition, the long acquisition times required for tractography represent a major drawback for in vivo experiments, particularly in the experimental animal setting. Scan times depend on resolution requirements, hardware capabilities, and sequence parameters. For example, to obtain an in-plane resolution of 400 μm2 using 30 diffusion directions and a single gradient strength, acquisition time is estimated to be approximately 30 mins. This would double with each additional gradient strength and/or average. Time can also be gained with hardware improvements, for example, parallel imaging, which is common in the clinic, and future improvements in analysis strategies could increase the potential of DTI as an imaging surrogate.
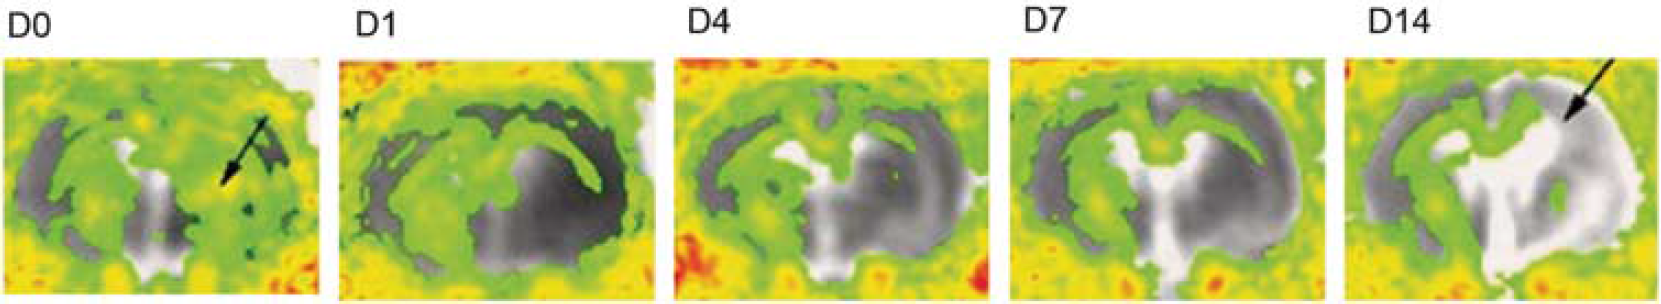
Changes in diffusion tensor imaging (DTI) in rats after transient middle cerebral artery occlusion (MCAO). Fractional anisotropy (FA) maps at different time points (DO–D14) averaged from eight animals, overlaid onto averaged apparent diffusion coefficient (ADC) maps. In the acute stages, there is a local FA increase (arrow on D0) in the ischemic territory. Subsequently, anisotropy decreases and fiber tracts degenerate ipsilateral to the lesion (arrow in D14). Corresponding ADC increases with tissue necrosis and liquefaction.
Functional MRI
Connectivity between brain regions can also be inferred by measuring brain activity in stroke patients using functional MRI (fMRI). Depending on the kind of functional deficit, individual tasks can be designed to pinpoint where brain activity is impaired and how the ischemic brain has adapted to the injury, which makes fMRI a complementary imaging surrogate to infarct size measurements. As to reorganization of motor function after stroke, several general patterns of fMRI activity changes have been observed, reviewed elsewhere (Calautti and Baron, 2003; Carey and Seitz, 2007; Cramer and Bastings, 2000; Grefkes and Fink, 2009). Activity significantly increases in motor-related and peri-infarct areas, and tasks performed by the impaired hand produce bilateral cortical activation, including regions not activated in intact patients. The heterogeneity of the patient population requires stratification of lesion types to identify trends. Subcortical lesions often recruit independently connected cortical regions, whereas patients with cortical lesions show recruitment of peri-infarcted cortices. In general, recruitment of peri-infarct tissue is associated with improved recovery.
The availability of only a few stimulus/response fMRI paradigms in rodents means that this field is relatively unexplored in the preclinical research environment. The most well-characterized paradigm is the detection of either a cerebral blood flow (CBF) or blood-oxygen-level-dependent response in the primary somatosensory cortex (S1) after electrical stimulation of the forelimbs (Mandeville et al, 1998; Silva et al, 1999). In general, blood-oxygen-level-dependent and cerebral blood volume responses to forelimb stimulation are decreased after MCAO, and become more variable when compared with an intact response in healthy control animals (Butcher et al, 2005). However, a few groups have observed changes in the fMRI response, which correlate with the clinical literature. Stimulation of the impaired limbs produced activation in the intact sensorimotor cortex, and formerly unresponsive regions in the peri-infarcted tissue (Abo et al, 2001; Dijkhuizen et al, 2001; Rother et al, 2002). Interestingly, when repetitive fMRI sessions were performed in the same animals, three types of responders were characterized: those that retained, those that lost, and those that exhibited only a transient loss of the blood-oxygen-level-dependent response that was independent of infarct size measurements (Weber et al, 2008). As is the case with DTI, fMRI could offer complimentary information to the standard infarct size estimations and could thus be considered a surrogate.
Outcome predictors
In contrast to surrogates, which are useful in the long-term setting to assess end point measures, outcome predictors are parameters that may be used in the acute setting of stroke to foresee the course of the disease or the potential benefit of treatment. Arguably the most common clinical predictor of outcome is the National Institutes of Health Stroke Scale (NIHSS), which is used in the acute stroke setting to assess a patient's neurologic symptoms. The National Institutes of Health Stroke Scale score has been shown to be highly correlated with differences in lesion size (Warach et al, 2000), and is an excellent predictor of outcome determined using the modified Rankin scale at 3 months (Johnston et al, 2009; Kasner, 2006). Ideally, as is the case with surrogates, additional predictors would be extremely useful and in this section we discuss several promising MRI predictors.
Magnetic Resonance Angiography
Magnetic resonance angiography is used acutely in the clinic for fast and effective diagnosis of acute stroke, primarily by identifying the location of the thrombus (Yu et al, 2002) and visualizing recanalization either spontaneously or in response to rtPA (Kimura et al, 2009). In terms of its predictive potential, MRA has been used to predict the degree of recanalization, which is highly correlated with outcome. The Thrombolysis In Myocardial Infarction grading system has been applied to assess the degree of the recanalization in patients with MCAOs using time-of-flight (TOF) MRA (Neumann-Haefelin et al, 2004). Patients with complete, and even minimal, recanalization exhibited significantly less lesion growth.
In addition to the success of recanalization therapies, MRA can be used to predict the risk of stroke by evaluating the degree of stenosis, and/or discrete changes in vessel walls, such as arteriovenous malformations or vasculitis (Kuker et al, 2008; reviewed in Latchaw et al, 2009). Although conventional intraarterial angiography is still the gold standard to evaluate the location and severity of vessel stenosis, the risks of this catheter-based procedure are significant. Imaging methods, such as ultrasound, can be preferred. Magnetic resonance angiography has been shown to be comparable and even superior to ultrasound for evaluating vessel stenosis (Nonent et al, 2004). In addition to TOF-MRA where blood flow is visualized noninvasively with short TR images, contrast-enhanced MRA (CE-MRA) is also routinely used. In CE-MRA, a Gadolinium bolus is injected intravenously and filling of the vessel lumen is recorded using T1-weighted images. Disadvantages of TOF-MRA when compared with CE-MRA are significantly longer scan times and less sensitivity to low flow, which potentially overestimates the degree of stenosis (Nederkoorn et al, 2003). Despite the recent suggestion that there is no greater benefit of CE-MRA (Babiarz et al, 2009), a meta-analysis has revealed that CE-MRA is slightly superior to TOF (Debrey et al, 2008). Another interesting application of MRA in stroke is its use to identify several characteristics of the atherosclerotic build up that could provide indications of plaque vulnerability (reviewed in Saam et al, 2007). For example, TOF was able to delineate the boundaries of the inflammatory fibrous cap rupture in atherosclerotic patients (Mitsumori et al, 2003), as well as fresh intraplaque hemorrhage (Yim et al, 2008). In addition, contrast agents, specifically ultrasmall superparamagnetic iron oxide nanoparticles, have been shown to accumulate inside the macrophages contained in the fibrous cap (Kooi et al, 2003), which could also enhance predictability of rupture potential.
Magnetic resonance angiography in the experimental setting can be used in much the same manner as the clinic, to determine thrombus location and recanalization, only when an embolic model is used (Hilger et al, 2002). However, the resolution is currently lacking to obtain images of smaller arteries or main stem branches, which makes implementation of MRA for examination of endothelial disease difficult. The most common model of MCAO in the rodent is the intraluminal filament technique, and model failure is a potential pitfall of this technique (Dittmar et al, 2005). Magnetic resonance angiography has been used to identify and exclude these animals earlier (Gerriets et al, 2004). Although use of MRA is limited in the experimental setting, development of new contrast agents for examination of atherosclerotic plaques can be tested easily.
Relaxometry
The susceptibility effects produced by iron in the blood appear as hypointensities in gradient echo images. Therefore, T2*-weighted images are used to identify ICH and or subarachnoid hemorrhage. It is generally accepted that CT is more accurate for ICH detection acutely (Warlow et al, 2003). However another study found that the two modalities were equivalent and that MRI was even slightly better (Kidwell et al, 2004). Indeed, a recent review regarding acute stroke imaging recommendations assessed the quality of articles based on level of evidence and suggested that the assumption that CT is more accurate for ICH detection than MR is based on a low level of evidence (Latchaw et al, 2009).
It has also been suggested that T2*-weighted MRI could be used to predict which patients might exhibit secondary ICH (SICH) after an ischemic stroke (Nighoghossian et al, 2002). Preexisting hypointensities in T2*-weighted images are often classified as cerebral microbleeds, and regardless of their age could represent increased risk of SICH. As mentioned previously, these patients are often excluded from rtPA treatment, though the prognosis of SICH is not necessarily poor when compared with the potential impact of the initial ischemic event (Derex et al, 2004; von Kummer, 2002). Furthermore, recent evidence suggests that in fact these patients should not be excluded from rtPA treatment. The Bleeding Risk Analysis in Stroke by T2*-weighted Imaging before thromboLysis study revealed no increased risk of SICH from thrombolysis (Fiehler et al, 2007). In a recent study, fluid attenuation inversion recovery images were able to delineate focal regions of hyperintensity before thrombolysis that were highly correlated with increased risk of SICH (Cho et al, 2008) and could thus be used as an attractive SICH predictor.
In experimental animal research, gradient echo imaging is the most common technique for reliable detection of ICH (Neumann-Haefelin et al, 2001). However, reproducibility of images from day to day represents a major problem with this technique because of the difficulties associated with shimming across the small rodent brain. Another application for T2*-weighted images is the detection of susceptibility agents such as contrast agents. Systemic intravenous administration of ultrasmall superparamagnetic iron oxide nanoparticles for phagocytosis by activated blood-borne macrophages as a method to image the peripheral inflammatory response after stroke is one such application (Rausch et al, 2002; Wiart et al, 2007). However, evidence indicates this technique may not be so robust (Desestret et al, 2009; Henning et al, 2009), and more variability has been observed in the clinical setting (Cho et al, 2007; Nighoghossian et al, 2007; Saleh et al, 2007). Therefore, albeit offering interesting insights into the poststroke inflammatory reaction, the current potential of these techniques for stroke outcome prediction is poor.
Diffusion-Weighted Imaging
Many ischemic lesions are difficult to detect within 3 h using CT (Roberts et al, 2002), which has caused DWI to become the mainstay of acute stroke imaging (reviewed in Latchaw et al, 2009; Masdeu et al, 2006). Diffusion weighted imaging measures random mobility of water (protons) in tissue. Opposing magnetic field gradients first dephase and then rephase the proton spins. If no net movement has occurred, the signal is attenuated. However, if diffusion is restricted, for example, because of intercompartmental water shift produced by cytotoxic edema during acute stroke, the corresponding diffusion signal is hyperintense, and the quantitative apparent diffusion coefficient (ADC) values (mm2/sec) decrease. Apparent diffusion coefficient maps more clearly discriminate cytotoxic edema from existing pathologic entities produced by the T2-shine-through effect that can be observed in the DW images (Detre et al, 1994). In general, ADC values do not change much until CBF drops below 20 mL/100 g per min. Subsequently, the most severe ADC reductions are found in the center of the perfusion deficit, indicating that specific ADC values are able to discriminate between infarct or necrotic tissues, and thus predict tissue outcome (Kraemer et al, 2005; Thomalla et al, 2003). When regions of interest were drawn around the initial DWI abnormality (core) and again around the hyperintense T2 region (final infarct size), both regions, as well as the difference between the two (tissue at risk), showed different ADC values: core, 0.56 ± 0.11; tissue at risk, 0.71 ± 0.11; and final infarct, 0.63 ± 0.11 × 10⁻³ mm2/sec (Na et al, 2004). The most severe ADC decreases (10−3 0.45 to 0.7 10−3 mm2/sec) are correlated with low cerebral metabolic rates of oxygen (CMRO2) (0.4 to 0.5 μmol/100 mL per min), which is consistent with irreversible tissue damage (Guadagno et al, 2006). However, ADC values become much more variable in tissue with CMRO2 levels that could be associated with either penumbra or benign oligemia (Guadagno et al, 2006). Furthermore, there have been a few reports where ischemic lesions were undetected with DWI (Lefkowitz et al, 1999; Wang et al, 1999), or that severe ADC decreases normalized, depending on the duration and severity of ischemia (Rother et al, 2002). Therefore, the ADC value of a voxel alone is not always sufficient to predict its fate. Recent automated postprocessing methods have tried to overcome this problem by incorporating regional ADC measures and local shape regularity constraints (Rosso et al, 2009). Lesion size estimated by DWI is often used to predict outcome as several studies have observed correlations with functional outcome scales (Barrett et al, 2009; Johnston et al, 2009), though it should be pointed out that a few studies have failed to find a correlation (Hand et al, 2006; Wardlaw et al, 2002).
As is the case in the clinic, ADC abnormalities are preferred for estimation of infarct size in animal research, and manual delineation showed a better correlation with 2,3,5-triphenyltetra-zolium chloride sections than threshold based estimations (Bratane et al, 2009). Nevertheless, several different thresholds have been used to correlate infarct size with histologic measurements. Apparent diffusion coefficient volumes, when expressed as threshold of 77% of control values, were highly correlated with measurements of reduced adenosine triphosphate and glucose consumption (breakdown of energy metabolism). Volumes determined with a threshold of 86% of control values were correlated with measurements of tissue acidosis 24 h later (Olah et al, 2001). An ADC decrease of 33% when compared with the contralateral side was also highly correlated with hemispheric lesion volume at 3 h after MCAO (Kazemi et al, 2004). Another group used semiautomated software to delineate the lesion based on a combination of ADC and T2-weighted abnormalities at various time points. Infarct size from hematoxylin–eosin sections was highly correlated with the measurements starting around 16 h after MCAO (Jacobs et al, 2000). If reperfusion occurs, the region of ADC abnormality will return to normal or near-normal values, and subsequent expansion in the subacute stages is variable (Li et al, 2000). The eventual extent of the ADC region by 24 h is highly correlated with occlusion duration (Neumann-Haefelin et al, 2000) and several groups have shown with histology that the signal is not solely confined to the neuronal population (Liu et al, 2001; Ringer et al, 2001). A recent review on the potential of DWI to predict infarct size accurately in experimental animal research indicated that there were only 13 reports that achieved quality scores sufficient to draw conclusions from. In general, manual delineation of lesion size from DWI was a better indicator of neuronal damage than lesions defined by using quantitative ADC thresholds (Rivers and Wardlaw, 2005). This implies that although quantitative ADC maps are crucial to diagnose acute ischemic damage unambiguously, ADC-defined thresholds may be too dynamic in the course of the disease to yield a robust outcome predictor.
Perfusion-Weighted Imaging
Perfusion-weighted imaging is of particular importance in stroke, as the drop in CBF (usually specified in mL/100 g per min) is one of the first in the cascade of events that ultimately result in brain damage. The extent, severity, and duration of the misery perfusion are a major determinant of outcome. In addition to confirming the diagnosis of stroke and indicating reperfusion, it has been shown that areas with severely compromised perfusion are more likely to undergo infarction, which makes PWI an interesting outcome prediction parameter (Butcher et al, 2003). When time of symptom onset is not certain, a persistent perfusion deficit on PWI can help stratify patients for therapy. Induced hypertension to avoid a remittance of symptoms because of low perfusion pressure after transient ischemia is also typically guided by PWI.
The most common clinical technique for PWI is dynamic susceptibility contrast (DSC) bolus tracking, which relies on intravenous administration of a contrast agent. The corresponding signal in the blood vessels, and surrounding parenchyma, is subsequently reduced (Villringer et al, 1988) and signal change over time can be used to calculate CBF, cerebral blood volume, and the average time required for any given particle of tracer to pass through the tissue after an ideal bolus injection, mean transit time (Barbier et al, 2001; Calamante et al, 1999; Ostergaard, 2005). Compared with the ‘gold standard’ of positron emission tomography (PET) imaging, DSC-derived CBF values have large standard deviations and tend to overestimate the hypoperfused tissue in stroke patients (Zaro-Weber et al, 2009). An inherent problem with DSC methods is that perfusion quantification algorithms rely on determining an arterial input function, which incorporates the concentration of the tracer over time in a voxel within a major artery, usually the middle cerebral artery. The input into this vessel, however, does not always resemble arterial input into the brain tissue, which can result in large and unsystematic errors (Calamante et al, 2002). In a recent comparison of different postprocessing algorithms and 10 different parameters of perfusion derived from bolus tracking it could be shown that (1) the choice of the parameter critically determines the ability to predict final infarct size and that (2) simple composite parameters such as the time-to-peak or first moment, resembling the arrival time of contrast in the voxel, might be superior to more sophisticated parameters that involve deconvolution of the arterial input function. A prolongation of first moment of 3.5 secs predicted infarction with a 75% sensitivity and 78% specificity (Christensen et al, 2009). Notably, MRI prediction was better in patients without reperfusion, indicating that, probably because of interindividual variance, perfusion thresholds might be even more difficult to determine on the verge of recanalization. In a different study, DSC perfusion maps were predictive of favorable clinical outcome to rtPA treatment when increasing the threshold for the delay of the time-to-peak residue function (Tmax) (Olivot et al, 2009).
Recently, a noninvasive alternative has become popular in preclinical research, arterial spin labeling (ASL) (Detre et al, 1994; Williams et al, 1992). Pulsed ASL produces contrast by nonselectively, and then selectively, inverting endogenous protons. The resulting signal difference is proportional to the amount of inflowing protons, or CBF. Magnetically labeling blood means this technique is more robust in situations of blood–brain barrier disruption (Calamante et al, 2002). However, quantification can be difficult as assumptions of the quantification algorithms, such as arterial transit time, are difficult to predict in cerebrovascular disease states (Wegener et al, 2007). As the method is still fairly new and not yet implemented on many clinical scanners, data are lacking to test the predictive value of ASL-PWI in stroke patients. Regardless, promising novel methods, such as velocity-selective ASL (tagging blood based on velocity rather than location) (Wong, 2007) and arterial territory mapping (Hendrikse et al, 2009; van Laar et al, 2008) are promising and currently receiving a great deal of attention, as these methods may predict if a certain vessel stenosis is really of relevance for cerebral perfusion in the individual or if collateral blood supply is compensating sufficiently.
In rodent models of stroke, PWI has not been frequently performed, in part because it is hard to implement because of signal-to-noise constraints. In addition to DSC-based techniques, ASL approaches have been recently introduced to small animal stroke imaging (Leithner et al, 2008; Wegener et al, 2007). There has been less ambiguity as to the value of PWI in outcome prediction in animal models compared with the clinical setting, which is very likely explained by the homogeneity of vascular occlusions in animal models in contrast to patients (location, duration, clot composition and so on). Cerebral blood flow thresholds have been shown to be useful for infarct size prediction. Voxels with a CBF < 30 mL/100 g per min were very likely to be part of the ‘core’ and proceed to infarction despite reperfusion, if ADC values were reduced, too (Shen et al, 2003, 2004).
The Mismatch Concept
Of central importance to stroke outcome is the concept of tissue at risk (Figure 3), which was only touched on in previous sections. Essentially, the region of brain most deprived of CBF (< 12 mL/100 g per min) is thought to be irreversibly damaged and destined for necrosis (infarct), whereas the surrounding areas retain some degree of CBF (12 to 22 mL/100 g per min) and thus represent a combination of tissue that will survive (oligemia) or whose fate is undecided depending on restoration of CBF (penumbra). Many different descriptions and classifications of these regions exist, reviewed elsewhere (Paciaroni et al, 2009; Sharp et al, 2000). Imagingbased identification of these regions is of great importance for outcome prediction and much effort has been made in this respect in the past decade.
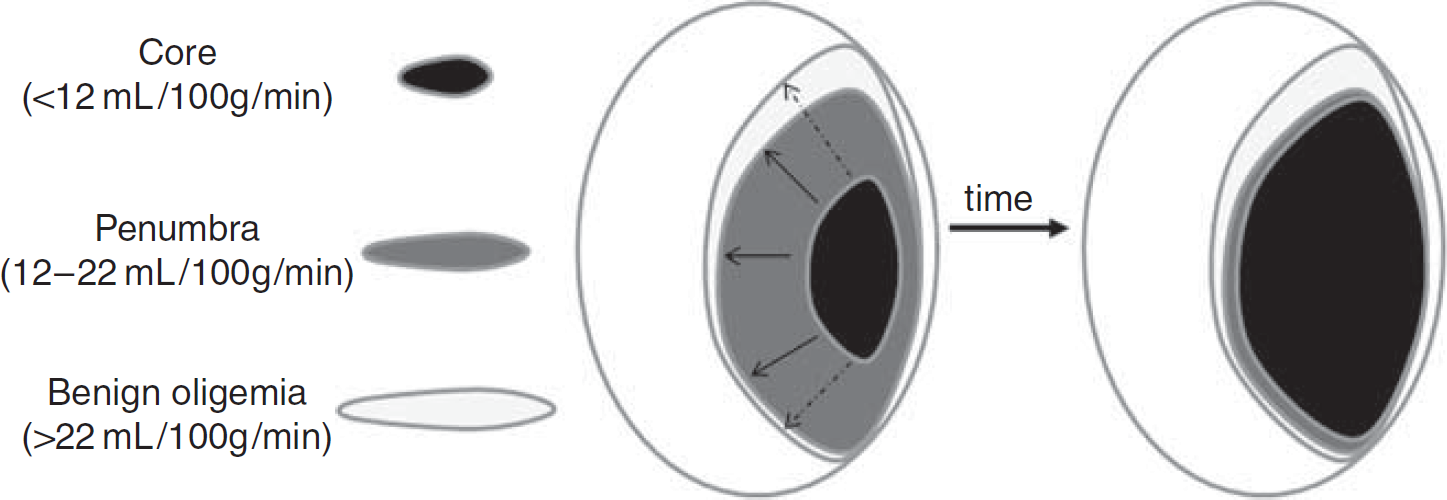
The penumbra. Cerebral blood flow (CBF) thresholds have been used to identify tissue that will exhibit irreversible damage (infarct core < 12 mL/100 g per min) and that could be salvageable (penumbra 12 to 22 mL/100 g per min) because some degree of metabolic activity remains. Theoretically, if CBF is not restored the core will gradually expand in the subacute stages as penumbral tissue dies. The magnetic resonance imaging (MRI)-defined diffusion/perfusion weighted imaging (DWI/PWI) ‘mismatch’ is the area of potential lesion growth. It is defined by the initial area of perfusion deficit (which usually includes the area of oligemia) minus the initial area with severe diffusion deficit (core). Growth of the core region can be variable (continuous or dashed arrows) depending on the defined DWI and CBF thresholds, reperfusion, and individual tissue resistance.
Initial observations in patients that the region of DWI was smaller than the region of PWI abnormality lead to the development of the idea that the DWI/PWI ‘mismatch’ could be used to identify tissue at risk (Baird et al, 1997; Neumann-Haefelin et al, 1999). A DWI/PWI mismatch is illustrated in Figure 4. A perfusion deficit encompassing 120% of the size of the DWI lesion is generally accepted as a relevant mismatch (Sims et al, 2009). If the mismatch resembles a correlate of the real penumbra, two important conclusions should be possible with the detection of a large MRI-defined mismatch: (1) infarct growth if reperfusion is not achieved and (2) a large area of salvageable tissue. The latter suggests that patients with a large mismatch should respond better to thrombolytic treatment with rtPA, which has been shown even beyond the 3 h time window (Beaulieu et al, 1999; Lorenz et al, 2006; Ostergaard, 2005). However, the selection of patients for thrombolysis based on an MRI-defined mismatch is controversial (Fiebach and Schellinger, 2009; Schabitz, 2009). Although two phase II trials (the diffusion and perfusion imaging evaluation for understanding stroke evolution (DEFUSE) and the Echoplanar Imaging Thrombolytic Evaluation Trial (EPITHET)) have indicated that patients with a mismatch might respond better to thrombolytic therapy, the DIAS-2 study did not show any benefit in patients selected for thrombolysis based on the existence of a mismatch (Albers et al, 2006; Davis et al, 2008; Donnan et al, 2009; Hacke et al, 2009). Of note, the mismatch in DIAS-2 was defined as a PWI lesion volume >20% of the DWI lesion volume by visual inspection at each participating stroke center. In DEFUSE and EPITHET, the mismatch (PWI/DWI lesion volume >1.2 and PWI/DWI lesion volume ≥10 ml) was determined by volumetric analysis at a later time point and did not influence stratification of patients into treatment groups. Although a systematic review ascertained that there is insufficient evidence to either provide or withhold thrombolytic treatment based on identification of a mismatch region (Kane et al, 2007), this is expected to change with the implementation of standardized, quantitative MRI analysis tools for ‘ad hoc’ calculation of the mismatch before treatment.
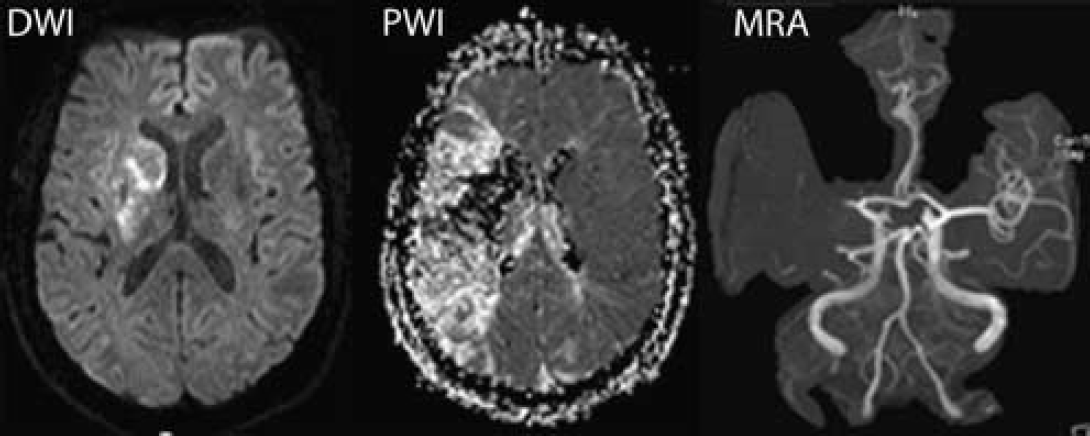
Identification of the diffusion/perfusion weighted imaging (DWI/PWI) mismatch. Diffusion-weighted images (left) and perfusion-weighted images (middle) in an 80-year-old patient at 8 h after the onset of acute aphasia, left-sided sensorimotor hemiparesis, and hemianopsia. Note: the small hyperintense lesion in DWI compared with the large area of hypoperfusion in PWI. Magnetic resonance angiography (MRA) reveals proximal occlusion of the left middle cerebral artery (kindly provided by J. Fiebach, Department of Neurology, Charité Universitätsmedizin Berlin).
As is clear from the previous section, there are many different methods in which to quantify CBF and the choice of which also impact estimation of the mismatch region. As such, there is no consensus regarding the best method to define the mismatch, which represents a problem regarding translation of findings between studies (Bandera et al, 2006). Recent advancements in techniques to estimate metabolic activity such as MRI-based assessment of CMRO2 are expected to contribute to this (Xu et al, 2009), as well as combined machines such as MR/PET (Beyer and Pichler, 2009). With this technology it would be possible to perform simultaneous measurements, such as the oxygen extraction fraction with PET together with DWI/PWI mismatch to achieve a more precise estimate of the penumbra. Although good agreement has been shown between the relative distributions of the MRI-derived mismatch and the PET-derived penumbra, the mismatch is still prone to errors (Takasawa et al, 2008). Reasons include technical challenges regarding quantification of perfusion-weighted MRI, the fact that the lesion on DWI may recover and that areas with benign oligemia are included into the MRI-defined mismatch definitions (Guadagno et al, 2004; Heiss et al, 2004; Sobesky et al, 2004, 2005). In a study where PET was conducted roughly 1 h after MRI assessment of CBF (using the DSC bolus-tracking technique) in patients with acute ischemic stroke, a CBF threshold of < 20 ml/100 g per min was found to best estimate hypoperfusion within the PET-derived penumbra (Zaro-Weber et al, 2009). The considerable interindividual variance, the influence of vessel disease, and the value of graded CBF ranges (e.g., 12 to 20 ml/100 g per min) for penumbra selection are areas of ongoing research in this field.
The concept of the mismatch has not been so extensively studied in animal stroke research. Mismatch regions have been reported in the acute stages of permanent MCAO, and in accordance with early clinical reports, the region of ADC abnormality gradually expands to encompass the region of perfusion deficit within the first 3 h (Bardutzky et al, 2007; Henninger et al, 2006; Meng et al, 2004). However, once CBF is restored in transient models, both DWI and PWI regions of abnormality are diminished and subsequent expansion is variable. In one study, core pixels were defined by a CBF decrease of more than 87% and an ADC decrease of more than 30%, whereas mismatch pixels were defined by a CBF decrease below and an ADC value above the defined thresholds (Bardutzky et al, 2007). Subsequent pixel fate was highly dependent on the duration of the MCAO. Durations of 35, 60, and 95 mins resulted in recovery of 46%, 28%, and 9% of the core pixels, respectively, whereas 85% of all mismatch pixels recovered regardless of occlusion duration. Again, quantification of these regions is highly dependent on the choices for thresholds, this can be further complicated by partial volume effects, which are present more frequently in high-resolution images (Ren et al, 2004). In addition, differences in the evolution of the mismatch region have also been reported to differ with experimental model (Henninger et al, 2006) and animal strain (Bardutzky et al, 2005), which are important considerations. As is the case with the clinic, alternative strategies may provide a more balanced perspective. For example, pH-weighted MRI applied to a DWI/PWI mismatch data set was able to identify regions that correspond to penumbra and benign oligemia (Sun et al, 2007). Combined PET/MRI (Judenhofer et al, 2008) and MRI/SPECT machines are increasingly used and also expected to make a contribution to a better characterization of the tissue at risk and tissue destined to undergo infarction in animal research.
Outlook
Magnetic resonance imaging can assist to predict the functional outcome of stroke patients. Several MRI parameters are correlated with a favorable outcome: (1) early recanalization on MRA, (2) small tissue defect on DWI, (3) small size and degree of perfusion deficit on PWI, (4) restored functional activity in peri-infarct areas on fMRI and intact descending pathways on DTI. However, the decision regarding whether a patient should receive thrombolysis solely based on MRI assessment remains problematic and controversial.
Many of the problems and open questions of stroke outcome prediction are similar in experimental animal research and in the clinic. However, the quality of preclinical research must be improved to make a better impact in the clinic. Low statistical power, flawed statistical interpretation, reproducibility, masking, randomization, quality control, and publication bias have all been suggested to contribute to the lack of effective translational stroke research (Dirnagl, 2006). Once preclinical knowledge is ready to be applied to patients, multicenter studies are the only way to reach sufficient numbers for relevant conclusions, at which point standardization of MR acquisition and analysis strategies is essential. In addition, more long-term measures are required for ultimate evaluation of attempts at outcome prediction. Nevertheless, the field of experimental neuroimaging with MRI is rapidly expanding. Improvements in hardware and sequences that decrease scan time while maintaining resolution will continue to impact the field. Post-processing strategies must evolve to these increasingly complicated data sets. It also seems clear that multimodal imaging strategies are necessary to develop more detailed patient profiles that can be used to predict outcome. Magnetic resonance imaging prediction of stroke outcome and treatment response will remain an area of exciting research and a realistic goal for the next decade.
Footnotes
The authors declare no conflict of interest.