
Abstract
In the investigation of ischemic stroke, conventional structural magnetic resonance (MR) techniques (e.g., T1-weighted imaging, T2-weighted imaging, and proton density-weighted imaging) are valuable for the assessment of infarct extent and location beyond the first 12 to 24 hours after onset, and can be combined with MR angiography to noninvasively assess the intracranial and extracranial vasculature. However, during the critical first 6 to 12 hours, the probable period of greatest therapeutic opportunity, these methods do not adequately assess the extent and severity of ischemia. Recent developments in functional MR imaging are showing great promise for the detection of developing focal cerebral ischemic lesions within the first hours. These include (1) diffusion-weighted imaging, which provides physiologic information about the self-diffusion of water, thereby detecting one of the first elements in the pathophysiologic cascade leading to ischemic injury; and (2) perfusion imaging. The detection of acute intraparenchymal hemorrhagic stroke by susceptibility weighted MR has also been reported. In combination with MR angiography, these methods may allow the detection of the site, extent, mechanism, and tissue viability of acute stroke lesions in one imaging study. Imaging of cerebral metabolites with MR spectroscopy along with diffusion-weighted imaging and perfusion imaging may also provide new insights into ischemic stroke pathophysiology. In light of these advances in structural and functional MR, their potential uses in the study of the cerebral ischemic pathophysiology and in clinical practice are described, along with their advantages and limitations.
Keywords
In the 1990s, major changes are occurring in stroke management. Unlike 10 years ago when the outlook for stroke victims was deemed to be hopeless and patients were managed nonurgently, patients presenting with the onset of focal neurologic symptoms are now managed emergently. Strokes are now referred to as “brain attacks”. The first Food and Drug Administration-approved drug for ischemic stroke treatment became available in 1996: recombinant tissue plasminogen activator (rt-PA). rt-PA was approved for the treatment of patients with acute ischemic stroke within 3 hours of the onset of symptoms (National Institute of Neurological Disorders and Stroke rt-PA Stroke Study Group Investigators, 1995). A large number of potential reperfusion and neuroprotective therapies are in development and clinical trial (Adams et al., 1995; Silver et al., 1996; Fisher, 1997).
In patients being considered for thrombolysis, urgent brain imaging has become essential to exclude intraparenchymal hemorrhage and early infarct signs (Hacke et al., 1995; von Kummer et al., 1996) and at present is performed with noncontrast brain computed tomography (CT). However, the existing structural imaging modalities (CT and magnetic resonance imaging [MRI]) do not reliably depict evolving ischemic lesions within the first 6 to 12 hours. The need for specific imaging of the ischemic pathophysiology is being increasingly recognized as attempts are made to minimize the risks of thrombolysis. Also, solutions are being sought to the recent spate of negative stroke trials which used only clinical data rather than the incorporation of specific pathophysiologic information for subject recruitment and evaluation, and the value of improved imaging data in the management of stroke patients is appreciated. For example, reperfusion therapy should be administered to patients in whom the artery is still occluded, there is tissue hypoperfusion, or there is still potentially viable tissue. Certain stroke therapies may be most effective for specific stroke subtypes.
Nuclear magnetic resonance (NMR) techniques were first used in the 1940s (Bloch, 1946; Purcell et al., 1946). The first images were obtained by Lauterbur in 1973. Structural MRI is the imaging method of choice for most neurologic disorders. In the detection of ischemic stroke lesions, structural MRI is more sensitive than CT, particularly for infarcts in sites such as the cerebellum, brainstem, and deep white matter (Ramadan et al., 1989; Bryan et al., 1991; Yuh et al., 1991; Amarenco et al., 1993). Where available, combined MRI and magnetic resonance angiography (MRA) have usually become the imaging modality of choice for delineating the extent of infarction beyond the first 12 hours and for noninvasively studying the extracranial and intracranial cerebral vasculature. During the past 6 to 10 years, advances in functional MR have occurred: diffusion-weighted imaging (DWI) sequences have been developed that are sensitive to the self-diffusion of water (Le Bihan et al., 1986) and can detect ischemic lesions at the earliest periods studied (Moseley et al., 1990a, b ) along with perfusion sequences (Belliveau et al., 1990; 1991). These techniques were recognized early for their potential clinical utility in the early detection of ischemia and investigation of patients with stroke. That initial optimism is now bearing fruit as the latest generation of clinical MRI scanners are capable of performing these methods, and they are becoming increasingly used in clinical practice.
In this review, we describe the possible applications of these structural and functional MR techniques in acute stroke, concentrating on DWI and perfusion imaging. The relevant technologic and methodologic aspects, the pathophysiologic considerations and background, and the potential clinical applications are discussed.
TECHNOLOGIC AND METHODOLOGIC CONSIDERATIONS
Practical aspects of MRI in the acute stroke setting include the fact that patients are often very ill, restless, and need close monitoring. Also, a proportion of patients may be claustrophobic and sedation is likely to be medically contraindicated.
Instrumentation
Because of logistic and physiologic constraints in performing DWI and perfusion imaging, the ultrafast method of echoplanar imaging (EPI) is ideally used (Mansfield, 1977; Stehling et al., 1991; Edelman et al., 1994a). This technique allows the acquisition of an entire image after a single radiofrequency pulse (single shot) in the duration of a single readout period (approximately 100 milliseconds). The main advantage is the insensitivity of the imaging method to patient movement artifacts of brain bulk motion, which severely compromises the quality of the DWIs. Although the hardware to perform EPI requires an additional expense for EPI-capable gradient coils, EPI is becoming widely available and has become a standard part of the current generation of 1.5 Tesla MR scanners. The faster gradients of EPI magnets allow the acquisition of images with very short echo times (TE) used in MRA. Incorporating EPI, DWI, and perfusion imaging into an acute stroke protocol that includes a rapid MRA, T1-weighted, T2-weighted, proton density, susceptibility-weighted and fluid-attenuated inversion recovery (FLAIR) sequences can take only 20 to 25 minutes to perform. An acute stroke protocol using only EPI, DWI, and perfusion imaging may be completed in 5 to 10 minutes. The limiting hardware factors in performing adequate DWI for acute stroke are the strength and the switching times speed for the gradient coils. The limiting factor for perfusion imaging is the magnetic field strength, which is directly related to the sensitivity of the methods to detect signal changes; perfusion imaging is possible with 1.0 Tesla, however, 1.5 Tesla or greater is preferred. For further details about the physics and technology of MR and DWI, the reader is referred to the appropriate reference texts (Le Bihan et al., 1986; Turner et al., 1991a; Le Bihan, 1995; Weisskoff and Edelman, 1996; Stetter, 1996).
Sequences
Diffusion-weighted imaging
What is diffusion? Diffusion is often thought of as a redistribution of molecules from a region of high concentration to a region of low concentration, typically described by Fick's first law of diffusion. In understanding the effects of diffusion in MRI, however, the “random walk model” is more suitable because it describes the effects of diffusion in the absence of any concentration gradient. Because of random thermal motions (Brownian motion), the water molecules in tissue change position and direction of movement in a random fashion. The relation of the parameters of the random walk to diffusion is described by Einstein's equation:

considering a one-dimensional walk, where 〈r2〉 is the root mean square distance traveled in time t and D represents the diffusion coefficient, a medium specific constant. Equation 1 is the basic equation of diffusion showing that spatial displacement increases with the square root of time. This description, by a single diffusion coefficient D, is valid for diffusion that occurs with equal probability in all directions and is called isotropic diffusion. However, in biological systems, water self-diffusion is not truly random because diffusion is restricted by natural barriers such as cell membranes and protein molecules. When the observation time is very short, most molecules do not have enough time to reach the barriers; therefore, they behave as if they are diffusing freely. As the observation time (diffusion time t) increases, the restricted molecule will strike the boundaries in its motion, preventing it from going far away from its starting point, so that its displacement will deviate from its behavior in a free medium. Figure 1 shows schematic random walks for free and restricted diffusion. This effect of restriction appears in the MR signal whenever the mean diffusion distances are of the same or higher order of the dimensions of the restricted compartment.
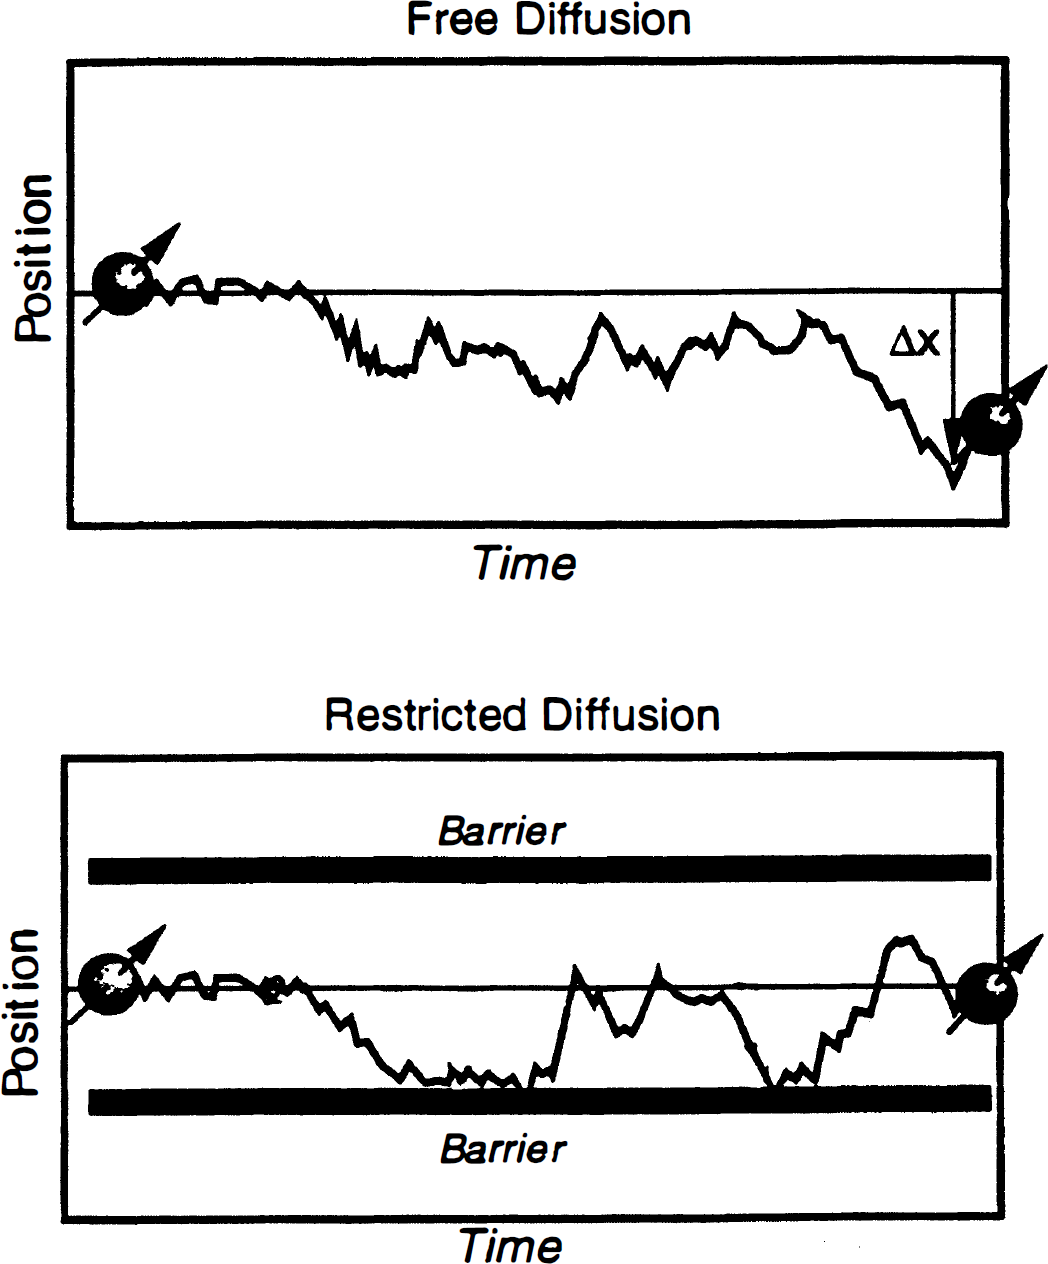
Free and restricted diffusion. This figure shows schematic random walks for free and restricted diffusion. When the observation time is very short, most molecules do not have enough time to reach the barriers; therefore, they behave as if they are diffusing freely. As the observation time (diffusion time t) increases, the restricted molecule will strike the boundaries in its motion, preventing it from going far away from its starting point, so that its displacement will deviate from its behavior in a free medium.
Diffusion is a three-dimensional process, and the molecular mobility in different directions may be affected by the presence of natural barriers that limit free diffusion. This spatial dependency is called anisotropic diffusion (Moseley et al., 1990a, b , c ; Moseley et al., 1991). For example, in the brain, water diffusion occurs readily along the white matter tracts, but diffusion perpendicular to the fiber is restricted by the myelin sheath. In the case of anisotropic diffusion, the scalar diffusion coefficient D is replaced by a more general mathematical description treating the diffusion as a tensor D, which accounts for three-dimensional movement.
Measurement of diffusion. NMR techniques may be used to detect diffusion as the nuclei of interest can be targeted by manipulating magnetization without interfering with the process of diffusion. The first report of self-diffusion with NMR was by Stejskal and Tanner (1965). NMR diffusion measurements were extended to MRI with the report of DWI in animals in 1984 (Wesbey et al., 1984). Diffusion-weighted imaging was reported in subacute and chronic strokes in humans by Le Bihan et al. in 1988 and by Chien et al. in 1990. Detection of acute stroke in cats was reported by Moseley et al. (1990a, b ) and in humans in 1992 (Warach et al., 1992a).
The overall principle of diffusion measurement is that the spatial location of each water molecule is tagged such that any net movement of a water molecule over the time of observation results in a signal loss or darkening of the images. In the simplest type of DWI sequence, this tagging is achieved by a pair of very strong pulsed magnetic field gradients (termed diffusion gradients) which are added to a spin-echo sequence (typically T2-weighted). The first of these diffusion gradients (the dephasing gradient) causes the spinning protons to fall out of phase with one another; the second diffusion gradient (the re-phasing gradient) rephases the protons completely with one another only if there has been no movement of the water molecules between the application of the two diffusion gradients, and a T2-weighted image would result as if the pair of diffusion gradients had not been added. When there is movement of water, the protons are not brought back completely into phase by the second diffusion gradient. The further the water has moved, the more out of phase it will be, and the more out of phase it is, the more signal attenuation (signal loss or image darkening) will occur. Thus, on DWIs, regions of relatively fast rates of diffusion (e.g., CSF) will appear darker than regions of normal brain, which appear darker than regions of hyperacute ischemic injury, which have slower than normal diffusion (Stejskal and Tanner, 1965; Le Bihan et al., 1986; 1988).
The amount of signal loss in DWI is related to the magnitude of the molecular translation (i.e., net diffusion) and to the strength of the diffusion weighting:

where D is the diffusion coefficient of the sample under investigation, S0 is the signal intensity of the unweighted image, and S(b) is the signal intensity of the images recorded using various b factors. The b value is specific for the particular pulse sequence used to measure diffusion and is a function of the diffusion gradient strength (G), the duration of the diffusion gradient pulse (δ) and the time of the diffusion measurement (Δ), i.e., the time between the beginning of the two diffusion gradients. For the typical diffusion-weighted pulse sequence, the b value is equal to:
where γ is the gyromagnetic ratio of hydrogen, a physical constant (26.75 times 107 rad/T.s). Although diffusion weighting increases with b value, at extremely high b values (e.g., due to long δ), excess T2 decay results in reduced signal and contrast and therefore reduced sensitivity for detecting acute lesions (Prasad and Nalcioglu, 1991). The optimal b value for determining diffusion in stroke has been estimated to be between 883 sec/mm2 and 1271 sec/mm2 (Benfield et al., 1996; Benfield et al., 1997).
These calculations are valid for isotropic diffusion measurements. As mentioned above, diffusion in biological tissue is anisotropic; therefore, to be completely specified, the independent components of the full diffusion tensor matrix must be measured (Basser et al., 1994a, b ; van Gelderen, et al., 1994; Ulug et al., 1997; Buxton et al., 1996). The diffusion description needs to account for the spatial dimension (axial, sagittal, or coronal) that the diffusion is measured in, which is dependent on the laboratory frame (magnetic field gradient axes) as well as the direction the diffusion gradient is applied in. In practice, the so-called trace of the diffusion tensor can be measured by averaging images obtained with diffusion gradients applied in three orthogonal planes (x, y, and z) to give Dav (Warach et al., 1995a; Ulug et al., 1997; Warach et al., 1997). Dav is not dependent on the orientation of the subject with respect to the magnetic field gradient axes and provides a good approximation to the diffusion tensor (Ulug et al., 1997).
Apparent diffusion coefficient in vivo. Because of restricted diffusion in biological tissues, self-diffusion of water is referred to as apparent diffusion and can be quantitatively described by the apparent diffusion coefficient (ADC). The ADC can be calculated by the Stejskal and Tanner equation (Stejskal and Tanner, 1965): the negative slope of the linear regression line relating b to the natural log of the signal intensity acquired at that b value. For the calculation of the ADC diffusion measurements performed, at least two b values are required, one of which can be the b = 0 value where there is no diffusion weighting. The accuracy of the ADC calculation is directly related to the range and the number of b values used for the measurement; ideally, four or more b values should be measured (Figs. 2 and 3).
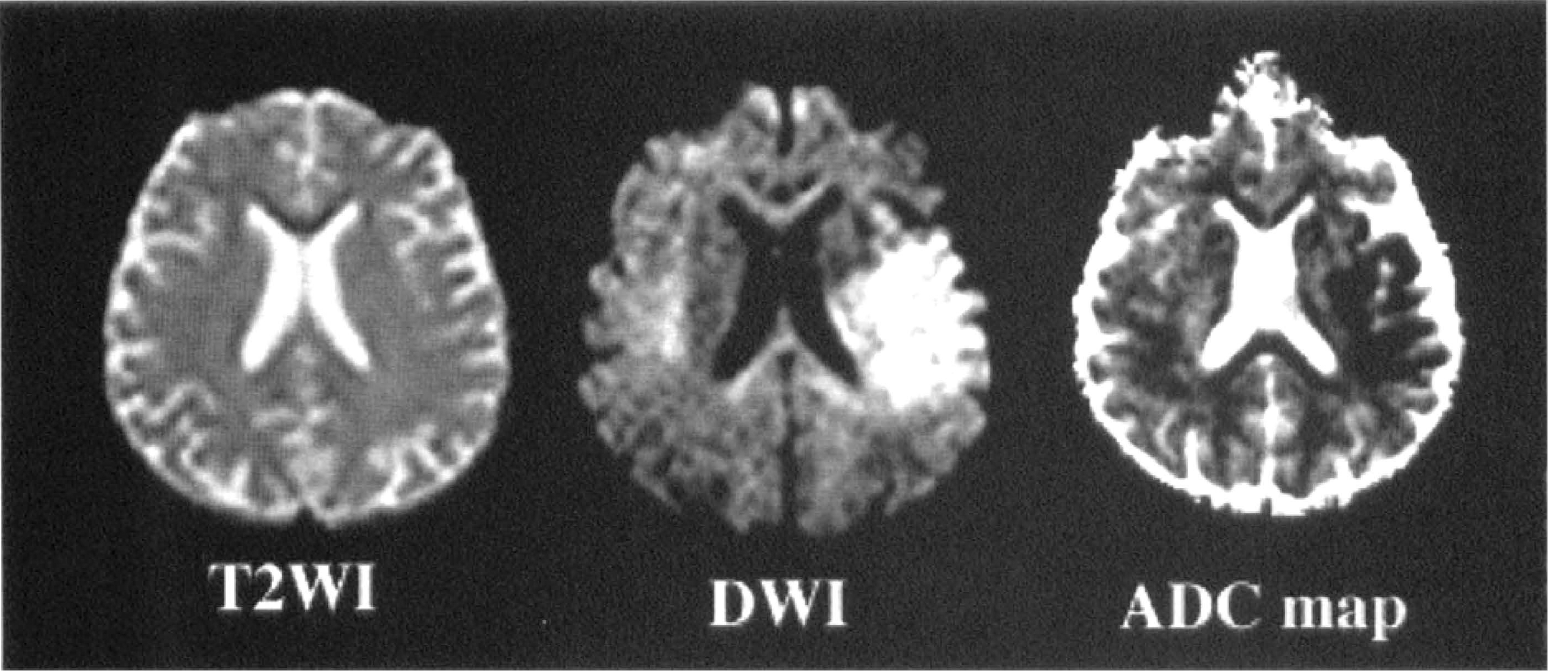
T2-weighted image (T2WI), diffusion-weighted image (DWI), and apparent diffusion coefficient (ADC) map of hyperacute ischemic stroke. Imaging from a patient studied 2 hours after the onset of a right hemiparesis and global aphasia. At 2 hours, the T2-weighted image was normal while the DWI showed signal hyperintensity in the left middle cerebral artery territory. On the ADC map the lesion appears dark because of the decreased ADC.
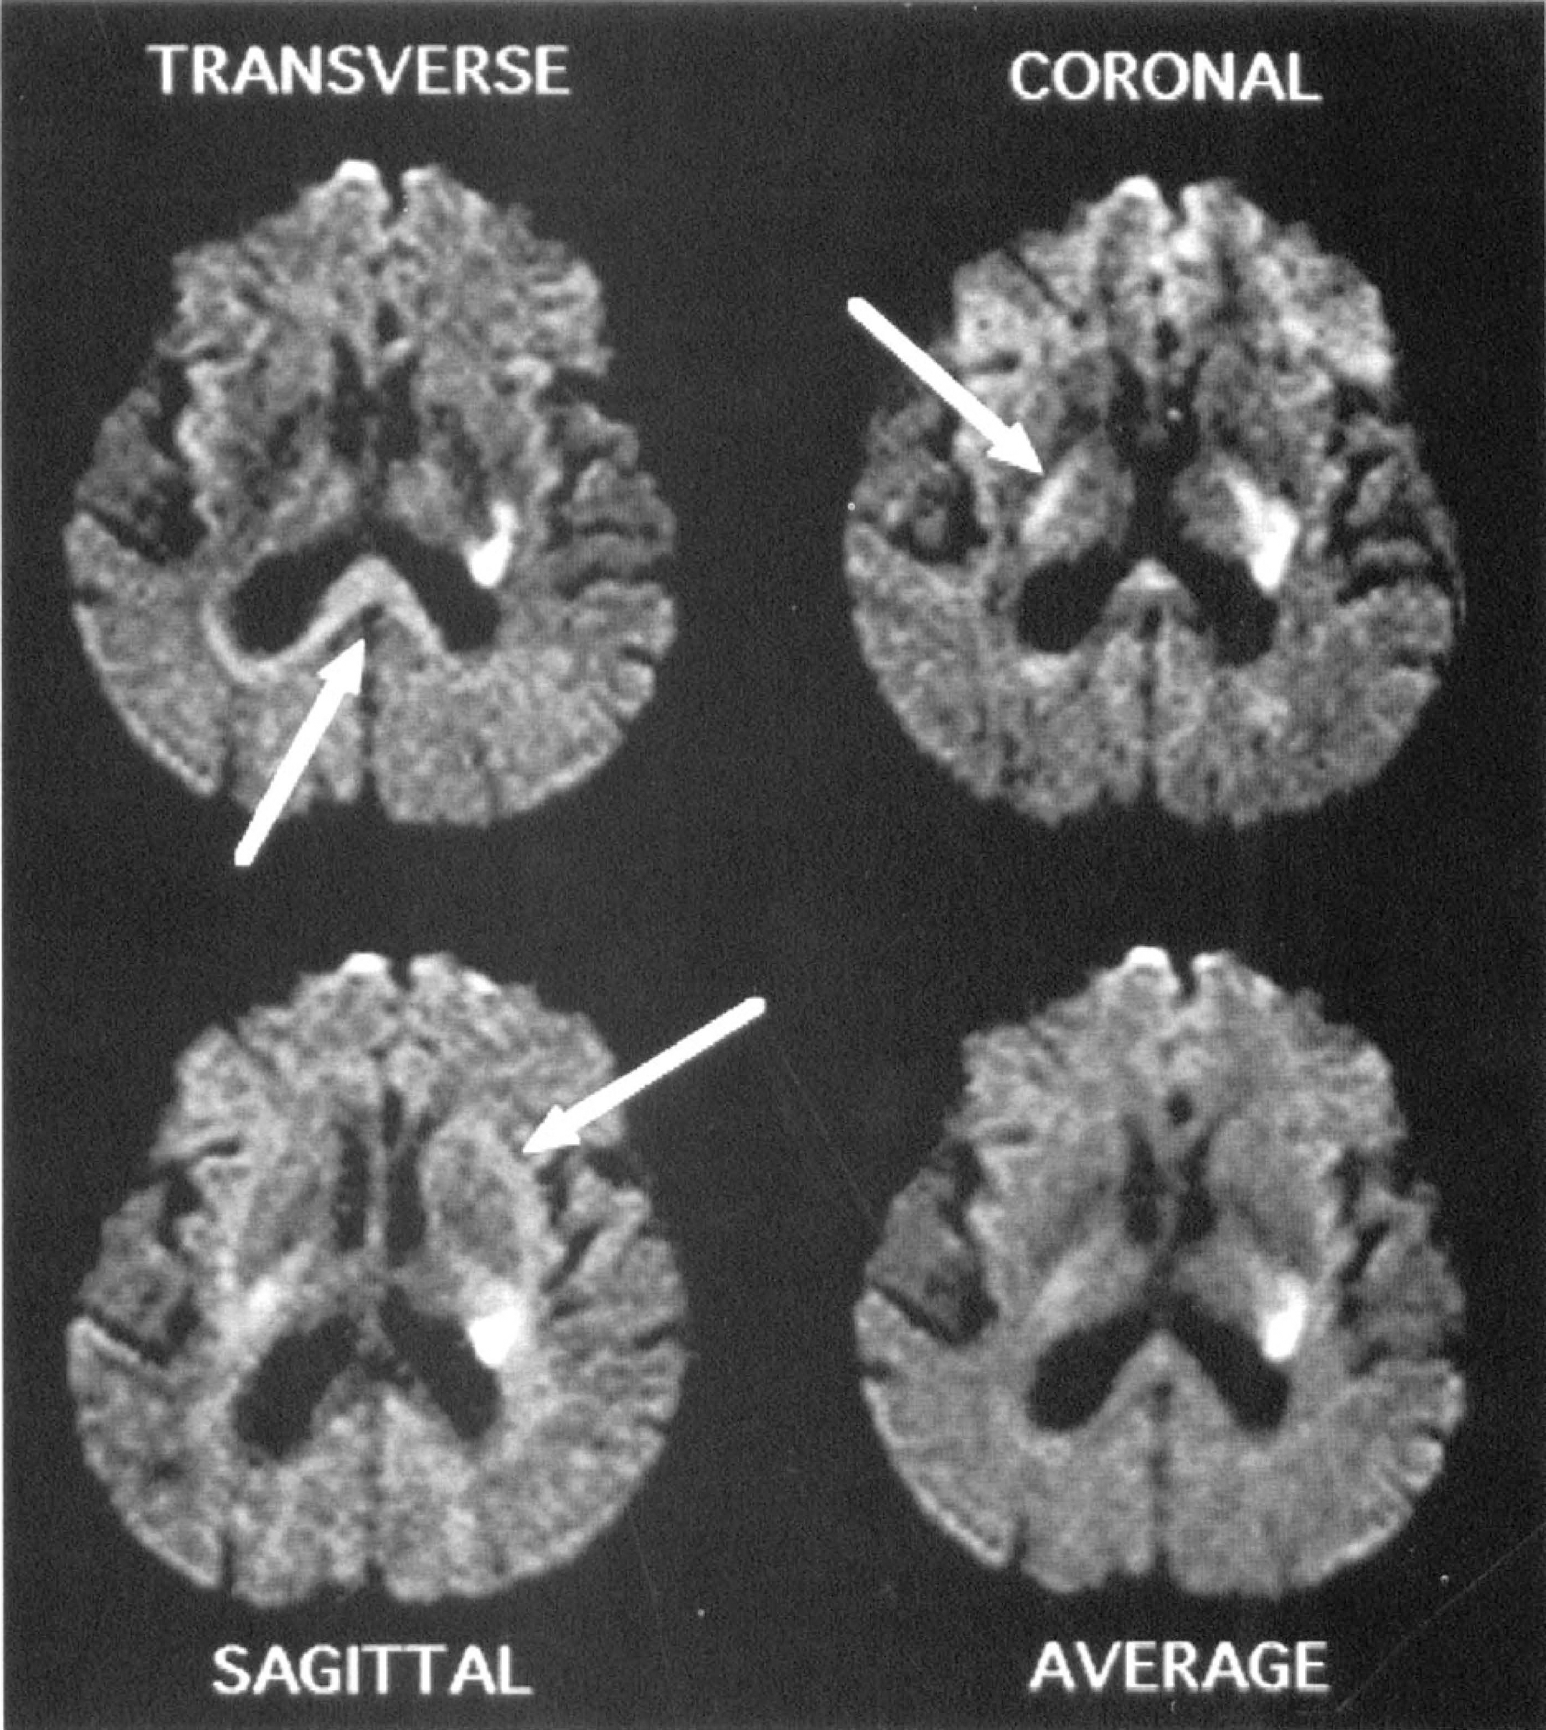
Diffusion anisotropy. Anisotropic diffusion-weighted image defines boundary of white matter lesions. Seven hours lesion in left internal capsule with diffusion gradients applied in transverse, coronal, and sagittal directions. White matter tracts oriented perpendicularly to the orientation of the diffusion gradient appear relatively hyperintense (arrows), whereas those parallel to the diffusion gradient appear isointense or hypointense. The hyperintensity of the lesion is present regardless of direction of diffusion gradient but its boundary blends in with the hyperintensity due to axonal anisotropy. The average of the diffusion-weighted image from the three diffusion directions produces a diffusion image relatively free of anisotropy. Hyperintensity at the inferior frontal poles at the top of this image is caused by susceptibility artifact. Reprinted with permission Warach et al., 1995.
Van Zijl et al. (1991) and Benveniste et al. (1992) have proposed that the normal ADC in the brain is a weighted average of the diffusion constants of the extracellular and intracellular compartments. Under physiologic conditions, approximately 20% of the brain water is distributed in the extracellular compartment and 80% in the intracellular compartment (Van Harreveld et al., 1965; Hossmann, 1971; Matusoka and Hossmann, 1982) and the membrane permeability of water is sufficient to ensure free exchange for the diffusion times of more than 20 milliseconds that are commonly used in DWI. The intracellular diffusion is presumed to be much lower than the extracellular diffusion because of intracellular barriers such as organelles and membranes. Values for water diffusion in the extracellular compartment (Dex = 3.25 times 10−3 mm2/sec, the value of the diffusion of water adjusted for temperature dependence) (van Zijl et al., 1991) and the intracellular compartment (Din = 1.43 times 10−4 mm2/sec) (van Zijl et al., 1991) were described and the mathematical calculation of 0.76 times 10−3 mm2/sec (0.8 × Din + 0.2 × Dex) is in agreement with measured ADC values in the normal brain (Benveniste et al., 1992).
In early clinical reports, normal ADC values varied from 0.8 to 1.2 times 10−3 mm2/sec for human gray matter. Because the diffusion gradient was applied in one direction at this time, the white matter ADC values ranged from 0.3 to 1.2 times 10−3 mm2/sec, depending on the orientation of the subject to the applied gradients (Chien et al., 1990; Warach et al., 1992a; Chien et al., 1992; de Crespigny et al., 1995; Warach et al., 1995a; Marks et al., 1996). The values for the CSF were 2 to 3 times 10−3 mm2/sec. More recently, Ulug et al. (1997) calculated the trace of the diffusion tensor in six volunteers and found that Dav values were more constant between subjects than the individual D values in each of the three orthogonal directions. There was minimal contrast between the gray matter (Dav = [0.92 ± 0.15] × 10−3 mm2/sec) and the white matter (Dav = [0.83 ± 0.06] × 10−3 mm2/sec) with the two main compartments being the brain (Dav across gray and white matter was [0.92 ± 0.11] × 10−3 mm2/sec) and the CSF (Dav = 3.05 times 10−3 mm2/sec). The effect of age on ADC values has been studied in a preliminary study by Gideon et al. (1994). There were no significant changes in the gray matter ADC values with age.
Diffusion-weighted imaging sequences. The earliest DWI studies were performed with spin-echo type sequences that were limited by the long acquisition time and the restriction of image acquisition to a single slice (Warach et al., 1992a, using TURBOSTEAM). With the implementation of ultrafast imaging strategies such as EPI, the effects of bulk motion were minimized and DWI became practical for the acute stroke setting (Warach et al., 1995a). The advantages of DWI using EPI are (1) the rapid acquisition of the order of tens of milliseconds; (2) the acquisition of multiple slices (whole brain can be imaged in 4 seconds (Warach et al., 1995a); and (3) studies of multiple different diffusion properties are possible. Limitations of EPI of the brain are strong chemical shift artifacts making precise fat suppression techniques obligatory, and strong susceptibility artifacts that cause image distortions, particularly in the posterior fossa and at the margins (anterior and inferior temporal lobes) and the paranasal sinuses.
Where EPI is not available, DWI has been applied to conventional MR systems—including navigated spin-echo (Marks et al., 1996) DWI, single-shot diffusion gradient and spin-echo (GRASE) (Liu et al., 1996), diffusion half-Fourier single-shot turbo spin-echo (HASTE) (Jakob et al., 1997) and diffusion line scanning (Gudbjartsson et al., 1996). Navigated spin-echo diffusion imaging can be performed on a clinical system and is associated with lower rates of susceptibility artifacts and better imaging of the posterior fossa than is possible with EPI (Moseley et al., 1995; Marks et al., 1996; Lutsep et al., 1997), although it may be limited by time resolution and the number of slices that can be obtained. A faster, non-EPI diffusion technique is diffusion HASTE. Diffusion HASTE involves single-shot diffusion imaging of the whole brain with a complete set of slices covering the brain obtained in approximately 1 minute. This allows the acquisition of diffusion images in all three directions; therefore, diffusion trace images and ADC trace maps can be measured in a reasonable time frame. Because diffusion HASTE is motion sensitive it requires cardiac gating to suppress artifacts due to CSF pulsations and brain motion. The advantages over EPI are reduced susceptibility artifacts, rendering good quality imaging with preserved anatomy possible in areas where EPI is associated with image distortions (e.g., the posterior fossa, and the potential for acquiring fast single-shot DWI on clinical scan systems with low magnetic fields that are not EPI compatible (Jakob et al., 1997).
Interpretation of diffusion-weighted imaging. Trace images provide a much more accurate delineation of the true extent of an acute ischemic lesion into the white matter than images representing diffusion in one direction only (van Gelderen et al., 1994; Warach et al., 1995a) (Fig. 3). On images obtained from the measurement of a single diffusion gradient, the white matter tracts exhibit different signal intensities depending on the direction of the diffusion-sensitizing gradient. Tracts running parallel to the applied diffusion gradient appear dark whereas those in the perpendicular orientation are bright. This effect can be minimized by measuring the diffusion trace. Apart from an acute ischemic lesion and anisotropy, signal hyperintensity on DWI can be due to previous stroke (T2 effect may not be suppressed on images with diffusion weighting), or susceptibility artifacts. For these reasons DWI images should always be interpreted with the T2 image or with a calculation of the ADC (Warach et al., 1995a; 1997).
Perfusion imaging
In the broadest sense, brain perfusion refers to one or more aspects of CBF. Parenchymal blood flow is the ratio of cerebral blood volume (CBV) to the transit time of blood through the tissue. The different techniques of MR perfusion imaging typically deal with blood volume, transit times, and blood flow as relative measures, although absolute quantification may also be possible. Two types of MR perfusion imaging have found applicability to clinical conditions and scientific studies—(1) susceptibility-based techniques that use either paramagnetic contrast agents such as those containing gadolinium (contrast agent bolus tracking) or endogenous changes in deoxyhemoglobin, which is an intrinsic paramagnetic molecule (blood oxygen level dependent [BOLD]); and (2) arterial spin labeling techniques.
Contrast agent bolus tracking. Dynamic contrast-enhanced susceptibility-weighted perfusion imaging or contrast agent bolus tracking is the most commonly used perfusion technique at present. MR blood volume estimations were described in the early 1990s (Moseley et al., 1990a; 1992; Belliveau et al., 1990; 1991; Edelman et al., 1990; Rosen et al., 1991) and are an analogue of Axel's (1980) work using iodinated contrast in CT. Paramagnetic contrast agents such as gadolinium cause susceptibility changes in the magnetic field when administered to circulating blood. The altered field homogeneity causes a marked decrease in the T2 relaxation time, which causes a reduction in signal intensity on images. As the contrast disappears from the detection plane, the homogeneity of the magnetic field is restored and the signal intensity returns toward normal. With fast imaging techniques, the bolus can be followed by performing serial scans every 1 to 2 seconds for 1 to 2 minutes. Gradient echo techniques using long TE are used, as by using long TE the images become T2-weighted, thus strongly susceptibility-weighted. This enhances the signal loss when the contrast reaches the blood vessels and the capillary bed. The gadolinium bolus (0.1 to 0.2 mmol/kg) is administered intravenously, either manually or by a power injector over 4 to 5 seconds.
The time curve is constructed from the changes in signal intensity as the bolus passes through (Fig. 4). The amount of signal loss is proportional to the concentration of the contrast agent and is directly proportional to the blood volume in healthy brain tissue (Belliveau et al., 1990; 1991). The quantifiable variable of interest is ΔR2* which is equal to -ln(Si/So)/TE where ΔR2* is defined as Δ(1/T2*), So is the precontrast signal intensity and Si is the signal intensity at time ti. The sum of ΔR2*, σΔR2* Δt, for all of the images in the series (assuming the time between images Δt is sufficiently short) is a value known to be proportional to in healthy brain tissue. In regions of breakdown of the blood-brain barrier, the relation between ΔR2 and tissue concentration may be altered (Rosen et al., 1991). The observed T2 signal loss may be attenuated by loss of the contrast agent from the intravascular space and T1 enhancement can lead to signal overshoot in the tissue where there is breakdown of the blood- brain barrier. These effects can theoretically be minimized by using large molecular weight contrast agents that remain intravascular and by minimizing T1 sensitivity, respectively (Rosen et al., 1991). Breakdown of the blood-brain barrier in ischemic stroke occurs predominantly after the first 24 hours.
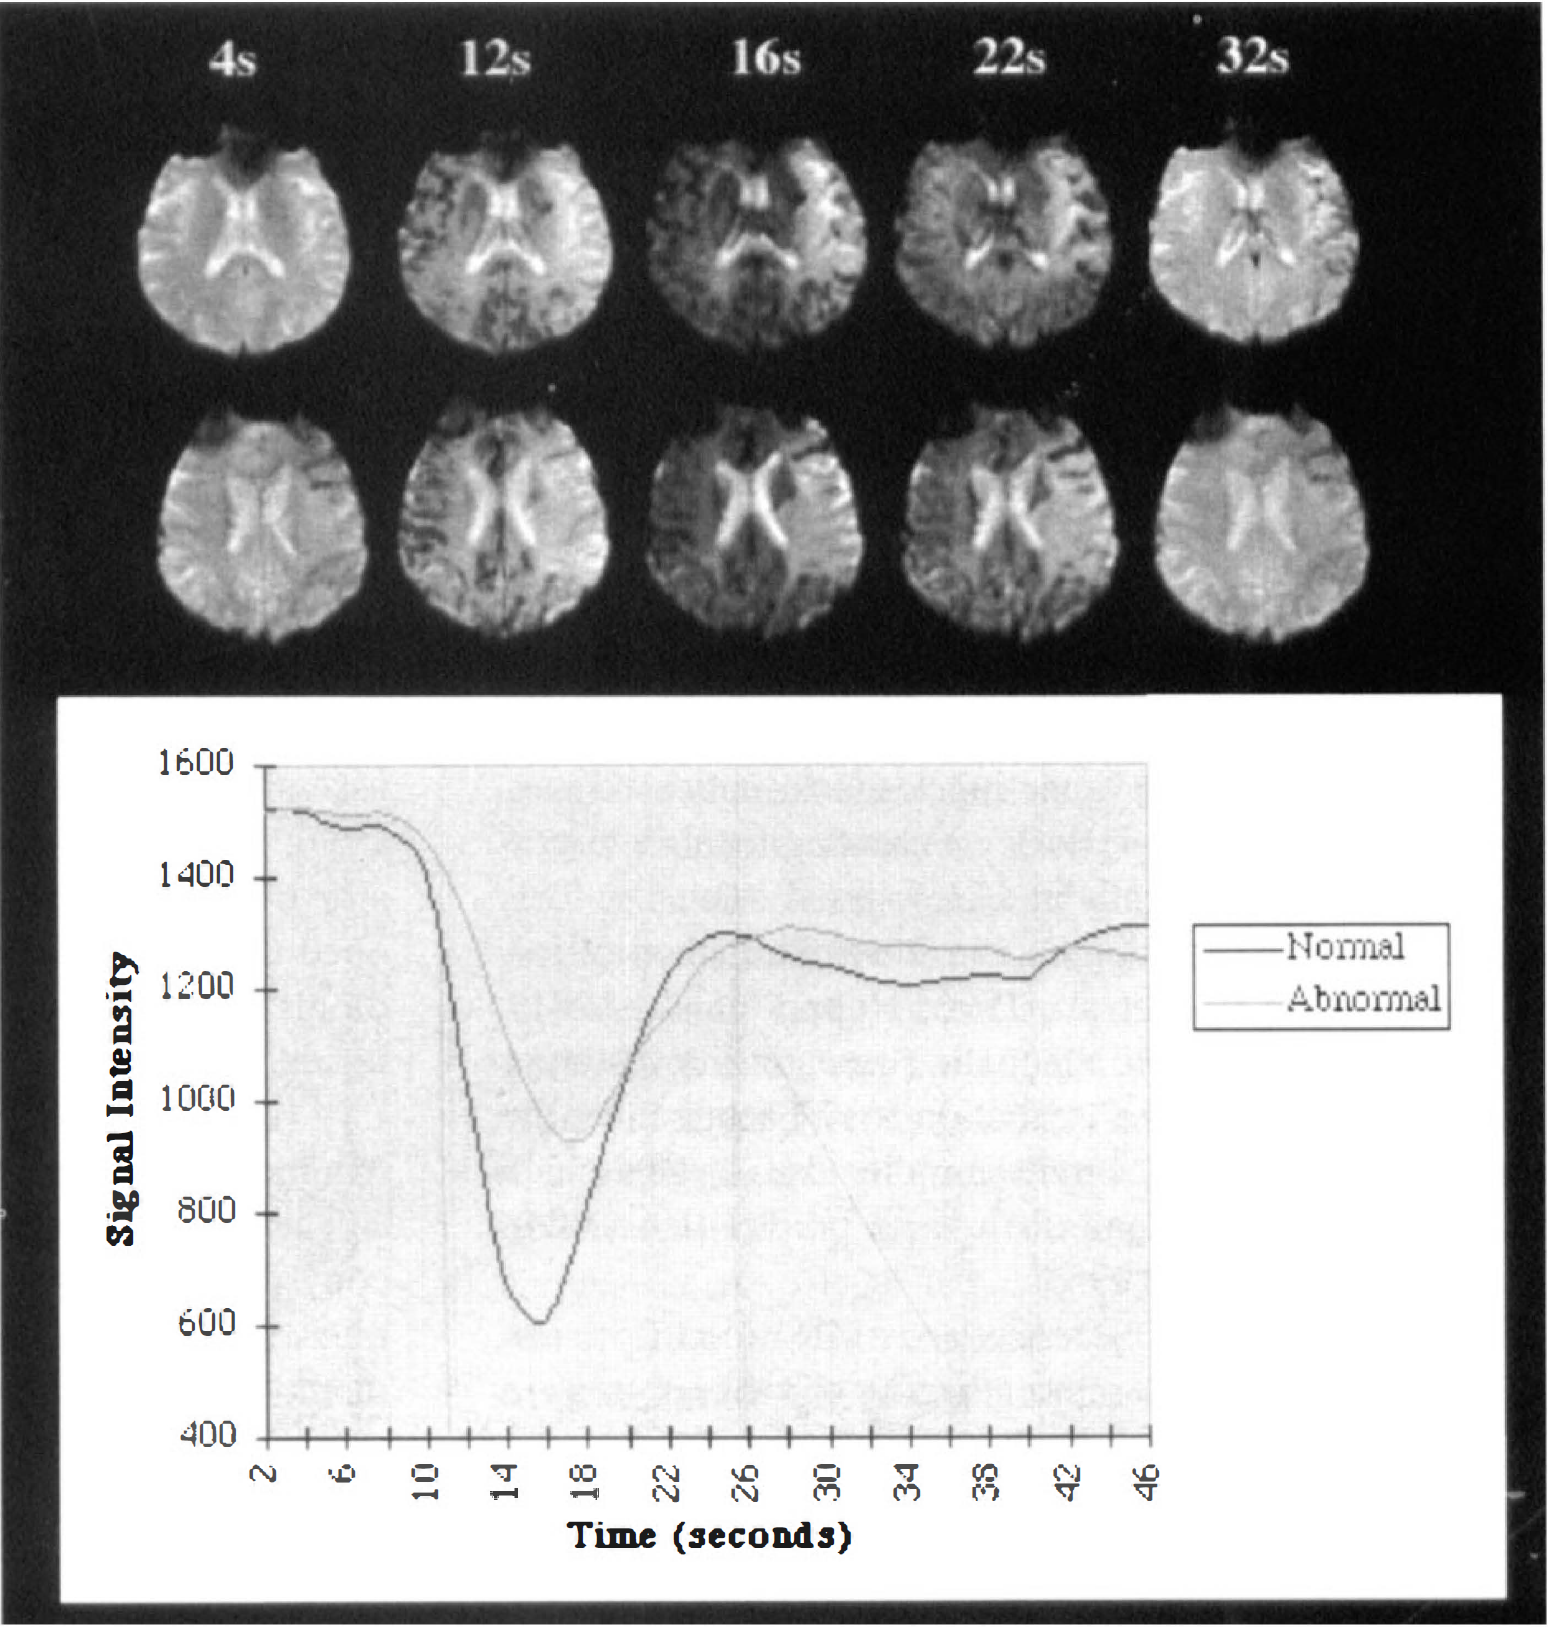
Contrast agent bolus tracking. The top shows rows that are representative images of the gadolinium bolus tracking technique used to provide perfusion images. Images were acquired at two second intervals after the intravenous administration of gadolinium. As the gadolinium passes through there is signal attenuation resulting from the decreased T2 relaxation time which returns to normal after the bolus has gone through. In this patient (same patient as in Fig. 2 who was studied at 2 hours) there is less signal attenuation in the region of the diffusion abnormality indicating reduced passage of gadolinium and a reduced perfusion. The bottom shows the time curve of the signal intensity. The images can be viewed qualitatively on screen or can be post processed to obtain maps of the relative cerebral blood volume, mean transit time, and CBF.
MR relative cerebral blood volume (rCBV) volume measurements have been validated against positron emission tomography (PET) CBV measurements (Rosen et al., 1991; Gückel et al., 1996). Blood volume images can also be analyzed qualitatively by observing the images as a cine loop to observe the relative decreases in signal intensity over the time course, and delays in the entrance or clearance of the contrast from the tissue (Warach et al., 1992b).
To calculate blood flow, data on the arterial input function need to be obtained to deconvolve the true mean transit time (MTT) from the observed transit time of the bolus. The time course of the signal change can then be used to measure the relative CBF (rCBF) using the central volume principle (Stewart, 1894; Meier and Zierler, 1954) which states that the normalized first moment of the efflux concentration curve (MTT) is the ratio of the tissue's volume to its flow. Although Weisskoff et al. (1993) have shown that in physiologic systems the normalized first moment of the time concentration curve is not equal to the true MTT, in computer simulation studies the measured MTT was found to be fairly accurate and arterial sampling or modeling of the cerebral vasculature (Gobbel et al., 1991) is not required. By observing the time between the first appearance of contrast in an image and its maximum concentration, one can derive more qualitative MTT-weighted and relative CBF (rCBF)–weighted images but with fewer assumptions about the relationship of the MR signal to the CBF (Fig. 5). Absolute quantitation of perfusion parameters has been proposed (Rempp et al., 1994)
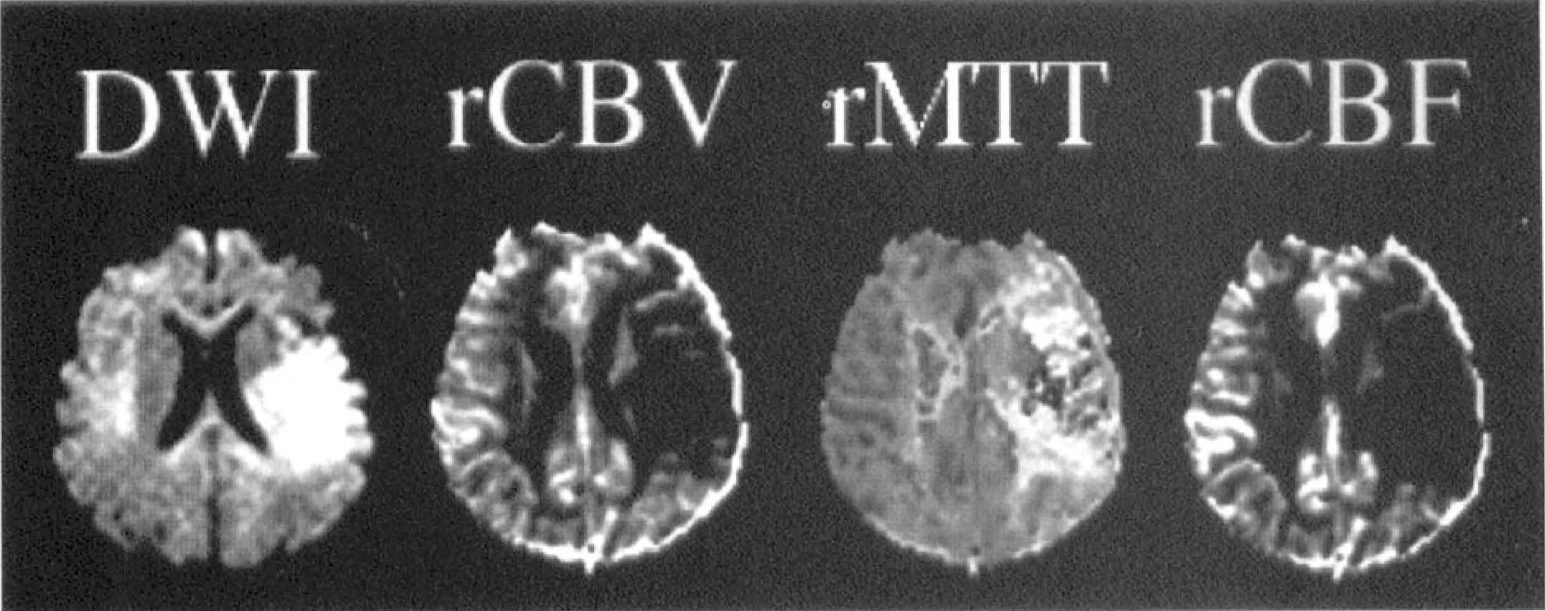
Reconstructed maps of relative cerebral blood volume (rCBV), mean transit time (rMTT), and relative cerebral blood flow (rCBF) from the patient in Figs. 2 and 4. These are semiquantitative calculations. There is reduced rCBV and rCBF (shown by darkening in the left middle cerebral artery territory) and prolonged MTT (appears more hyperintense in the left middle cerebral artery territory) in the region of the diffusion abnormality. The rCBV abnormality is smaller than the rCBF lesion suggesting that there may be vasodilatation at the periphery of the ischemic lesion. DWI, diffusion-weighted imaging.
Blood oxygen level dependent imaging. BOLD imaging detects changes in the concentration of deoxyhemoglobin that may occur under conditions of altered blood flow. Deoxyhemoglobin has intrinsic paramagnetic properties while oxyhemoglobin is diamagnetic. This technique is widely used in functional MRI studies of brain activation and the major advantage is that no contrast is required. During functional activation of the brain, an increase in blood flow coupled with an increase in tissue metabolism occurs, but the increased oxygen delivery is in excess of oxygen demands; therefore, less oxygen is extracted, there is less deoxyhemoglobin, there are fewer susceptibility effects, and there is increased signal intensity (Thulborn et al., 1982; Ogawa et al., 1990).
This technique has also been studied in induced hypoxia or ischemia where a decrease in the BOLD signal intensity has been observed reflecting decreased tissue oxygenation (Turner et al., 1991b; de Crespigny et al., 1992); increased deoxygenation leads to increased susceptibility within the erythrocyte creating local field gradients around these cells and less signal intensity. This may find a potential application in stroke pathophysiology studies (Prasad et al., 1996; Hoppel et al., 1991). However, the increased magnetic susceptibility resulting from increased oxygen extraction may be offset by the decrease in the tissue content of molecular oxygen which is also paramagnetic and difficult to predict (Hossmann and Hoehn-Berlage, 1995).
Arterial spin labeling techniques. MR blood flow imaging by spin labeling or spin tagging of water protons in an arterial source to a slice has the advantages that it is completely noninvasive, provides a more direct assessment of blood flow, and may generate absolute blood flow quantification. Blood flow quantification has been achieved by continuous adiabatic inversion of arterial spins and principles of tracer kinetic models of CBF determination (Roberts et al., 1994; Williams et al., 1992). Qualitative CBF measurements have been achieved using EPI, a single inversion pulse to inflowing arterial spins, and subtraction of tagged and untagged EPI images, termed EPI and signal targeting with alternating radiofrequency (EPISTAR) (Edelman et al., 1994b). This technique is potentially quantifiable but at present is limited to single-slice (Siewert et al., 1997) or at most several-slice (Alsop and Detre, 1996) acquisitions. A similar EPI strategy using selective versus nonselective inversion of inflowing spins is flow sensitive alternating inversion recovery (FAIR) (Kwong et al., 1995; Kim, 1995).
Limitations of MR perfusion imaging. The major limitations of bolus tracking MR perfusion methods are the requirement of good intravenous access with a larger bore intravenous catheter (18 gauge) and susceptibility image artifacts due to the paranasal sinuses. The extensive amount of postprocessing required limits the practical use of perfusion imaging in the immediate assessment of acute stroke and the optimal perfusion parameters for evaluating stroke lesions are yet to be determined, although findings have been reported in the assessment of carotid occlusive disease (Gückel et al., 1996; Nighoghossian et al., 1996). A rapid online reconstruction algorithm for perfusion data needs to be developed that can be used routinely (by technologists, radiologists, radiology residents, neurologists, and neurology residents).
Magnetic resonance spectroscopy
There is great interest in magnetic resonance spectroscopy (MRS) because of the potential identification and measurement of specific brain metabolites with this method, but the clinical applications of MRS are currently limited because of long acquisition times and the inherent insensitivity and poor spatial resolution (Williams et al., 1989). Proton [1H] MRS can be used to evaluate lactate which appears in ischemic tissue as a bilobed peak at 1.3 parts per million (Baker et al., 1990; Moseley et al., 1986; 1990a, b ; Kucharczyk et al., 1991a; Duijn et al., 1992; Gyngell et al., 1994) and an index of neuronal loss may be obtained from the ratio of N-acetyl-aspartate to choline (Moseley et al., 1990a). 31Phosphorus spectroscopy can provide information about pH and about the decrease in cellular energy substrates and the increase in their breakdown products that occurs in ischemia such as the interconversion of inorganic phosphate and ATP and phosphocreatine (Crockard et al., 1987; Sappey-Marinier et al., 1992; Moseley et al., 1986; Moseley 1990a, b ; Kucharczyk et al., 1991a). Other techniques include 23Na (sodium) imaging (Moseley et al., 1985; Christensen et al., 1996) and diffusion MRS (Merboldt et al., 1992; Posse et al., 1993; van Zijl et al., 1994; Hossmann and Hoehn-Berlage, 1995) which could be used to study the diffusion characteristics of specific metabolites, e.g., the change in the distribution of metabolites in the extracellular and intracellular compartments after ischemia or the temporal release and uptake of lactate and excitatory amino acids (Hossmann and Hoehn-Berlage, 1995). For the study of stroke, chemical shift imaging may be superior to MRS as a map of specific metabolite distribution within a slice can be obtained in the same acquisition time as for several MRS voxels; this could allow spatial comparison of the DWI lesion with the distribution of specific metabolites (Barker et al., 1994). Quantitative measurements of metabolite concentrations can be obtained and may be of value in drug development studies.
PATHOPHYSIOLOGIC STUDIES
The great attraction for the use of DWI and perfusion imaging in the investigation of ischemic stroke pathophysiology is that DWI provides the earliest known imaging marker of cellular injury in developing ischemic lesions and serial, high resolution studies can be performed to provide temporal information. Diffusion-weighted imaging and perfusion imaging have been widely used to detect and quantify ischemia in experimental stroke models (van Bruggen et al., 1994; Hossmann and Hoehn-Berlage, 1995; Hoehn-Berlage, 1995). This literature is reviewed in detail because it appears that these findings may provide insights of major relevance to human stroke, particularly in understanding the basis of the pathophysiologic changes that occur on diffusion images and understanding the mechanisms of ischemic lesion evolution.
MR studies of stroke evolution in experimental models
Experimental stroke models that have been used include focal and global ischemia models in rats (Finelli et al., 1995), gerbils (Busza et al., 1992), and cats (Moseley et al., 1990a, b ; Hoehn-Berlage, 1995; Miyabe et al., 1996). This discussion is mainly restricted to focal cerebral ischemia models involving temporary and permanent middle cerebral artery occlusion (MCAO). These models are generally reproducible and it is possible to control for many confounding factors (temperature, glucose, mechanism of ischemia, time of reperfusion) that cannot be controlled in the clinical setting.
Mechanism of restricted ADC in stroke
Although there is no controversy that hyperacute decreases in ADC in ischemic stroke reflect early cytotoxic edema, the relative contributions of various postulated biophysical mechanisms in the ADC reduction are not known. Postulated mechanisms include cytotoxic edema (Moseley et al., 1990a, b ; Mintorovitch et al., 1991), decreased extracellular space (Hasegawa et al., 1996), restricted intracellular diffusion (Neil et al., 1996), membrane depolarization and reduced cellular membrane permeability (Helpern et al., 1992), increased tortuosity of extracellular diffusion paths (Nicholson, 1993) and temperature effects. At present, a reduction in the extracellular space and cytotoxic edema seem to be the most likely mechanisms. A decrease of up to 50% of the extracellular space is known to occur in cerebral ischemia from studies of electrical impedance (Hossmann, 1971; Branston et al., 1978; Matsuoka and Hossmann, 1982). Stimulation of anaerobic glycolysis and idiogenic catalytic compounds leads to an intracellular accumulation of osmotically active products, and breakdown of the energy-dependent ion exchange pumps leads to equilibration of extracellular-intracellular ion gradients (Siesjö, 1992). There is a massive influx of sodium and water into the intracellular compartment and efflux of potassium into the extracellular compartment. Where there is no blood flow, the main source of the water and electrolytes is that contained in the extracellular space, and the intracellular compartment swells at the expense of the extracellular space. Simultaneous ADC measurements and electrical impedance measurements of ischemic tissue have confirmed that the ADC decrease is associated with a decrease in the extracellular space (Verheul et al., 1994). The hyperacute decrease in diffusion does not reflect change in the water content of the lesion in the first few hours because there is no signal intensity increase on T2-weighted imaging or on proton density imaging. ADC restriction can be induced by ouabain administration which specifically inhibits Na+, K+-ATPase, and by the excitotoxins glutamate and N-methyl-D-aspartate (NMDA), both of which induce cellular swelling (Benveniste et al., 1992). It has been argued that a shift of water from the extracellular space to the intracellular space is sufficient to explain the 40% decrease in ADC that is observed in hyperacute ischemic lesions (Benveniste et al., 1992). This calculation assumes that the respective diffusion constants remain the same during ischemia and that only the relative water distribution has changed; however, it is possible that there is also a decrease in the intracellular diffusion coefficient (Neil et al., 1996). Decreases in the intracellular diffusion of specific metabolites in both neurons and glia were reported in diffusion spectroscopic studies (Wick et al., 1995).
Theoretically, the acute decrease in ADC in ischemia could be due to a decrease in temperature or to reduced pulsations—the rate of diffusion is determined by the kinetic energy of the particles and is therefore temperature dependent (Le Bihan et al., 1989; Delannoy et al., 1991; Samulski et al., 1992; Hasegawa et al., 1994a; Harris and Woolf, 1980). However, it has been shown that there is a lag of 1 to 2 minutes before the ADC decrease (Davis et al., 1994) and the magnitude of the ADC decrease exceeds that which would be accounted for by the decrease in temperature (Hasegawa et al., 1994a). Membrane permeability change seems a less likely cause of restricted diffusion because no diffusion changes were found on anisotropy images in induced ischemia, indicating that permeability of myelin fibers did not change (van Gelderen et al., 1994). Increased extracellular tortuosity of diffusion paths does not take into account changes in the intracellular diffusion that may also occur. Niendorf et al. (1994) and Norris et al. (1994) found evidence of restricted diffusion in ischemic tissue at very short diffusion times (shorter than used in clinical DWI [Latour et al., 1994a]) and have proposed a model for diffusion at very short diffusion times that takes into account changes in extracellular volume, membrane permeability, and tortuosity of extracellular diffusion paths.
Restriction of the ADC may occur in conditions other than focal cerebral ischemia. Experimentally induced reductions in the ADC include experimental status epilepticus (Zhong et al., 1993) and transient depolarizations characteristic of spreading depression (Latour et al., 1994a), which in the nonischemic brain are both associated with a reduced extracellular space but not with energy failure; in these conditions, the ADC reduction is reversible. ADC decreases have also been shown in association with severe hypoglycemia where there is both severe energy failure and restriction of the extracellular space (Hasegawa et al., 1996). Hyponatremia, a model of cytotoxic edema, also causes a decrease in the ADC (Sevick et al., 1992).
Relation of restricted diffusion to blood flow
In numerous studies, regional correspondence has been shown between the region of perfusion deficit and the region of restricted diffusion (Finelli et al., 1992; Minematsu et al., 1992b; Quast et al., 1993; Roberts et al., 1993; Perez-Trepichio et al., 1995; Pierce et al., 1997). An absolute perfusion threshold for diffusion restriction in ischemic tissue has been difficult to specify because the duration of oligemia is likely as equally an important factor as the severity. In global ischemia in gerbils, Busza et al. (1992) found that slight signal hyperintensity occurred at CBF <30 mL/100 g/min but that at CBF 15 to 20 mL/100 g/min there was a sharp increase in signal intensity in the cortex and thalamus. These are similar flow thresholds reported for the development of lactate and cytotoxic edema, respectively (Astrup et al., 1981; Matsuoka and Hossmann, 1982; Hossmann, 1994; Hossmann and Hoehn-Berlage, 1995; Hoehn-Berlage et al., 1995). Dijkhuizen et al. (1994) reported that the DWI signal intensity increased when the CBF index (from bolus tracking measurements) decreased to less than 20% of the control level. In other laboratories it has been found that there is a gradual decrease in the ADC and the CBF from the periphery to the core (Kohno et al., 1995; Hoehn-Berlage et al., 1995; Hoehn-Berlage, 1995). In the study of Kohno et al. (1995), the areas of signal hyperintensity on DWI acutely corresponded to CBF levels less than 41 mL/100 g/min and a time-dependent increase in the CBF threshold for the signal hyperintensity less than levels of 50 mL/100 g/min was reported in the studies of Hoehn-Berlage et al. (1995) and Mancuso et al. (1995). It is concluded that the thresholds for the development of cellular injury and ADC decrease at a given CBF are likely to be directly related to the duration of ischemia.
Relation of restricted diffusion to metabolic alterations
Mintorovitch et al. (1994) correlated DWI signal change with tissue water content, ATPase activity, and electrolyte content. Within 30 minutes after rodent MCAO DWI changes had occurred and there was a 30% to 40% decrease in ATPase activity while tissue water content and electrolyte concentrations were normal. By 60 minutes, the ATPase activity had decreased further, the water and sodium content had increased, and the potassium level had decreased. These results indicated that DWI measures very early disturbances of ion pumps at a time when such changes are potentially reversible. ADC decreases can be induced by intraparenchymal administration of ouabain, an Na+-K+ ATPase inhibitor, and by infusions of NMDA or glutamate into the brain which activate NMDA receptors, a major mediator of neuronal ischemic neurotoxicity (Benveniste et al., 1992). In other studies the DWI signal intensity correlated with the accumulation of tissue lactate using combined MRS studies (Moseley et al., 1990a; Gyngell et al., 1994). In more recent studies where spatial localization of DWI changes and the distribution of electrolyte disturbances (using bioluminescence and fluorescence) were performed, the volume of tissue with ADC decrease at 2 hours after rat MCAO more closely matched the region of tissue acidosis than the smaller region of ATP depletion alone (Kohno et al., 1995; Hoehn-Berlage et al., 1995), possibly indicating an ischemic penumbra. Features of the ADC decrease in acute stroke are summarized in Table 1.
Diffusion-weighted imaging and the apparent diffusion coefficient in acute ischemic stroke
ADC, apparent diffusion coefficient; DWI, diffusion-weighted imaging; NMDA, N-methyl-D-aspartate.
Time course of the apparent diffusion coefficient in experimental stroke
Diffusion abnormalities, manifested by signal hyperintensity and a reduced ADC, are present within 2.5 minutes after arterial occlusion in cat and rodent MCAO models (Moseley et al., 1990a; Minematsu et al., 1992a; Pierpaoli et al., 1993; Davis et al., 1994; Hoehn-Berlage et al., 1995). The ADC decrease precedes changes on T2-weighted imaging by at least 2 to 3 hours at which time an increase in the tissue water content starts to occur (Moseley et al., 1990a). During the next 24 hours the ADC decreases further and the DWI lesion becomes increasingly hyperintense. The maximum decrease in the ADC to levels of 50% to 60% of the control values has occurred by 24 to 48 hours (Hoehn-Berlage et al., 1995). This is the same level reached after 20 minutes of cardiac arrest (Hoehn-Berlage et al., 1995) and may be the maximum extent to which reduction of the extracellular volume can occur (50%) (Matsuoka and Hossmann, 1982). Alternatively, according to Hoehn-Berlage et al. (1995), this may be the level at which all energy-dependent processes influencing the water diffusing properties come to a halt. A restricted ADC has always preceded the development of infarction.
In rodent stroke models, the ADC begins to normalize at 24 to 48 hours. In some cases early reversal or normalization of the ADC can occur when tissue recovery occurs (e.g., after reperfusion or treatment with NMDA-receptor antagonists) but more typically the ADC returns to normal transiently during the transition from acute decrease to increase at the time of chronic necrosis (which is termed pseudonormalization). Pseudonormalization of the ADC has histopathologic correlates of the emergence of eosinophilic neurons and the beginning of neuronal necrosis (Welch et al., 1995; Garcia et al., 1993; 1995). After pseudonormalization, the ADC becomes high in the chronic phase (Welch et al., 1995; Warach et al., 1992a; Warach 1995a, b ). The subsequent increase in the ADC probably reflects a loss of membrane integrity and cell necrosis as the infarct progresses from edema to gliosis to cyst formation confirmed histopathologically in the studies of Takahashi et al. (1993). In the core of the infarct, the ADC becomes increased when electron microscopy reveals cellular lysis (Pierpaoli et al., 1993). Table 2 summarizes the major characteristics of the DWI, ADC, and T2-weighted image signal characteristics at each stroke stage.
Signal characteristics and ADC typical at each stroke stage
ADC, apparent diffusion coefficient; DWI, diffusion-weighted image; T2WI, T2-weighted image.
Within the acute ischemic lesion the ADC restriction is heterogeneous (Welch et al., 1995). As the ischemic lesion enlarges over time it develops a core region that manifests a decrease in ADC early and peripheral regions that were develop later. Acutely the core central region has a more severe reduction in ADC at any one time point than the periphery of the lesion (which become more reduced over time), but over the next few hours the ADC continues to decrease in the periphery as well.
Evolution of stroke lesion volumes in focal ischemia models
In focal MCAO rodent stroke models DWI signal hyperintensity appears within minutes after occlusion (Moseley et al., 1990a; Minematsu et al., 1992a; Hoehn-Berlage et al., 1995). The DWI lesions are initially located in regions where the depth of ischemia is greatest (Quast et al., 1993; Hoehn-Berlage et al., 1995; Pierce et al., 1997). In cases of permanent MCAO, enlargement of the region of restricted ADC occurs over the next 24 hours (Minematsu et al., 1992a; Takano et al., 1996; Loubinoux et al., 1997) at which time the DWI lesion volume becomes equivalent in size to the final infarct measured histologically (Minematsu et al., 1992a, b ; Helpern et al., 1993; Jiang et al., 1993; Pierpaoli et al., 1993; Back et al., 1994; Knight et al., 1994). The ischemic lesion enlargement occurs variably in the cortex depending on the extent of collateral supply. The T2 changes are on average delayed by about 3 to 6 hours compared to the DWI lesions, but by 24 hours the DWI and T2-weighted image abnormalities are equivalent (Helpern et al., 1993; Knight et al., 1994; Loubinoux et al., 1997). This pattern of enlargement corresponds to that seen in serial PET studies in cats where there was a progressive enlargement of the region of metabolic disruption over the first 24 hours (Heiss et al., 1994; 1997).
In some rodent studies the ischemic lesion volume had reached its final size within 2 hours (Takano et al., 1996; Hoehn-Berlage et al., 1995), in some by 7 hours (Loubinoux et al., 1997), and in others by 24 hours (Minematsu et al., 1992a; 1993; Quast et al., 1993) probably dependent on the model used. Vasogenic edema appears within 6 hours and may cause an overestimation of lesion volume. Loubinoux et al. (1997) have described a method for distinguishing the two by assuming that the DWI lesion is due to cytotoxic edema and the T2 lesion to both; they reported that 24% of the ischemic lesion enlargement within the first 24 hours in rats was due to edema and that the lesion had reached its final size at 7 hours in this rat permanent MCAO model using the intraluminal suture method.
Perfusion changes precede the development of the DWI lesions. The area of restricted diffusion enlarges within the region of perfusion abnormality (Minematsu et al., 1992a, b ; Roussel et al., 1995; Roberts et al., 1993) and can be reversed in part or total by early reperfusion in both focal and global ischemia (Mintorovitch et al., 1991; Minematsu et al., 1992b; Kucharczyk et al., 1993; Jiang et al., 1993; 1994; Davis et al., 1994; Pierpaoli et al., 1996). Maximal decreases in ADC caused by global ischemia are completely reversible with early reperfusion within 12 minutes (Davis et al., 1994). In reversible MCAO ischemia models regression of lesions has been reported after 33 minutes of ischemia (Mintorovitch et al., 1991), 45 minutes (Müller et al., 1995), and 30 to 60 minutes of ischemia (Minematsu et al., 1992b; Kucharczyk et al., 1993). Hypothermia during reperfusion caused a more rapid normalization of the ADC (Jiang et al., 1994). Reperfusion prevented further expansion of the ischemic lesion volume in other reports and variably caused a decrease in the size of the ischemic lesion volume; the diffusion lesion remaining at the end of ischemia was predictive of the final infarct volume (Minematsu et al., 1992b; Hasegawa et al., 1994b; Jiang et al., 1994; Miyabe et al., 1996) with the reversibility of DWI lesions after reperfusion being dependent on the combination of the level of ADC decrease and the duration of ischemia (Miyabe et al., 1996). These results suggest that some or all of the lesion on the DWI is potentially reversible, that there is no absolute threshold of ADC decrease that predicts evolution to infarction as time and perfusion are essential factors, and that a DWI lesion and ADC decrease do not necessarily imply evolution to infarction.
After reperfusion there may be a temporary hyperemia of variable duration (Kucharczyk et al., 1993; de Crespigny et al., 1992; Müller et al., 1995a), but after prolonged ischemia it was not possible to restore perfusion in many cases; this might indicate that a no-reflow phenomenon or microvascular factors were responsible (Kucharczyk et al., 1993). In a few cases reperfusion was restored to be followed by a secondary decrease in blood flow; this might represent postischemic hypoperfusion due to reperfusion injury (Kucharczyk et al., 1993) or arterial reocclusion after thrombolysis (Reith et al., 1996). Postischemic brain injury may be increased by pre-existing hyperglycemia as a result of increased microvascular ischemia after reperfusion (Quast et al., 1997).
Core and ischemic penumbra
MR studies of the ischemic core and the ischemic penumbra are somewhat blurred because different definitions of core and penumbra have been used by different groups. In general, the core is regarded as the central most severely ischemic region where there has been energy failure, loss of maintenance of ionic concentrations, and where there is irreversible damage (Astrup et al., 1981). The ischemic penumbra was initially described as the zone of functionally impaired tissue around the core at which point the EEG became isoelectric, with a CBF of 17 to 23 mL/100 g/min (Astrup et al., 1981). More recently it has been described as tissue that is potentially salvageable (Memezawa et al., 1992), has preserved energy metabolism (Hossmann, 1994), has transiently disturbed metabolism or recurrent anoxic depolarization (Pulsinelli, 1992; Ginsberg and Pulsinelli, 1994), where there is lactate accumulation (Hoehn-Berlage et al., 1995) or tissue that is fundamentally reversible (Hakim, 1987).
Because the DWI lesion and ADC decrease occurs acutely with NMDA receptor stimulation and Na+-K+ ATPase failure (Benveniste et al., 1992), it is considered the core of the lesion. Recent evidence that DWI and ADC abnormalities may result from spreading depression (Gyngell et al., 1994; Latour et al., 1994b), and may be seen at the periphery of the lesion before ATP levels have completely disappeared (Hoehn-Berlage et al., 1995) suggest that the outer rim of the DWI lesion may be part of the penumbra. However, where there is ATPase failure and cytotoxic edema, the ADC will decrease. At 2 hours after MCAO in rodents, the periphery of the DWI lesion has been characterized by a normal ATP level, increased lactate level, a mild decrease in blood flow and a 10% decrease in the ADC (Hoehn-Berlage et al., 1995; Kohno et al., 1995). At this time the core had a marked decrease in ATP, increased lactate level, marked CBF reduction, and a 23% reduction in the ADC. By 7 hours the volume of tissue with ATP depletion matched the DWI lesion suggesting that the core had been recruited into the penumbra. These findings were confirmed in the study of van Zijl et al. (1995) in a reversible cat focal ischemia model; the region of ADC reduction below 80% corresponded with the 2,3,5-triphenyltetrazolium chloride (TTC) demonstrated infarct and even severe regions of ADC reduction were reversible. In other studies the periphery of the DWI lesion could be distinguished by its perfusion characteristics on bolus tracking (Pierce et al., 1997) (ADC reductions in the periphery of the DWI lesion were linearly correlated with the ΔR2* peak ratios but not the integral ratios) and by heat shock protein expression, a marker of potential neuronal viability after ischemia (Detre et al., 1997).
Around the core of the diffusion lesion the tissue may also be functionally affected and clinically symptomatic (Roussel et al., 1995); this hypoperfused tissue may be above the threshold for infarction, at least initially (Jones et al., 1981). Decreased CBF without DWI signal change has been reported in numerous studies (Finelli et al., 1992; Quast et al., 1993; Roberts et al., 1993; Pierce et al., 1997; Quast et al., 1997). Using gradient echo perfusion imaging, a region of signal increase in the T2- weighted images was found around the DWI lesion indicating increased oxygen extraction (Roussel et al., 1995). In tissue around the DWI lesion there was variation in the recovery time after transient ADC decreases which reflected the gradient of tissue perfusion; severely delayed recovery time after spreading depression may represent the ischemic penumbra (Röther et al., 1996a).
Mechanisms of infarct evolution
Cortical spreading depression-like (SD) transient depolarizations have been observed surrounding ischemic tissue in animal models and have been implicated in the growth of infarcts (Leao, 1944; Mies et al., 1993). The first observation of transient abnormalities on DWI, coincident with transient depolarizations in focal ischemia, was described by Gyngell et al. (1994). Latour et al. (1994b) subsequently described waves of transient ADC decreases propagating from a point of cortically applied potassium chloride, a known stimulus for spreading depression at 3 mm/sec (the rate of spreading depression). Similar waves of ADC decrease developed spontaneously after induced ischemia (Hasegawa et al., 1995; Takano et al., 1996). These spreading waves of ADC decrease have been interpreted as a manifestation of SD, with the ADC decrease occurring for reasons similar to the ADC decrease in ischemic tissue—disturbance of ionic homeostasis and redistribution of water from extracellular to intracellular. The phenomenon has been replicated in other laboratories (Busch et al., 1995; Röther et al., 1996a) and this ADC correlate has been used to study the physiologic basis by which SD leads to infarct growth and the mechanism whereby neuroprotective drugs have their therapeutic effect (Busch et al., 1996). The transient ADC decreases can be observed within minutes after onset of ischemia extending from the core of the lesion and into regions of moderately but not severely decreased tissue perfusion (Röther et al., 1996a) consistent with the view that these transients are associated with the ischemic penumbra and the enlargement of the area of infarction. SD were more likely to cause infarct enlargement if they were spontaneous than if they were induced by KC1 (Takano et al., 1996). Changes in signal intensity in T2-weighted images can be seen with induced spreading depression (Gardner-Medwin et al., 1994). A relationship to more rapid recovery after spreading depression in hyperglycemia has been reported (Els et al., 1997).
Prediction of infarction and irreversible damage
In planning therapeutic interventions it would be extremely valuable to be able to distinguish viable from nonviable tissue. Six signature patterns of T2 intensity and ADC values have been hypothesized by Welch et al. (1995) to predict the histopathologic outcome of the tissue. Type A is normal; type B is low ADC normal T2 (could predict recovery, predicts necrosis); type C is low ADC high T2 (could predict necrosis); type D is normal ADC, high T2 (transition to necrosis); type E is high ADC, high T2 (cell necrosis); and type F is high ADC, normal T2 (cell necrosis). Tissue signature D (appearance of eosinophilic neurons) does not appear for up to 24 hours after onset. Signatures D, E, and F were associated with infarction, and signature B (low ADC with normal T2) had an uncertain outcome (could be viable or could become an infarct).
More recently, Fisher (1997) suggested that it would be more practical to distinguish between reversible and irreversible lesions, rather than predicting the transition to infarction. This is because the histopathologic changes of infarction occur up to 12 hours after it is presumed that an irreversible insult has occurred (Garcia et al., 1993; 1995). Attempts have been made to study the ADC level at which a lesion is no longer reversible. The results indicate that there is no absolute threshold of ADC decrease that predicts if a lesion is irreversible; maximal decreases in the ADC are even reversible for short periods (Davis et al., 1994). Miyabe et al. (1996) studied the combination of time and level of ADC (measured by the diffusion tensor) in predicting the area destined to necrosis. They defined a level of 0.65 times 10−3 mm2/sec at 2 hours after transient MCAO in cats as predictive of infarction. In studies of global ischemia, animals without recovery of ADC exhibited global depletion of ATP and glucose and severe lactic acidosis, whereas animals with recovery of ADC showed replenishment of ATP and glucose to near control and a substantial reversal of lactic acidosis (Hossmann et al., 1994). It appears that it is the combination of the ADC decrease and the time after the ischemic insult that is the best predictor of the eventual tissue damage and that patterns of reversibility will depend on time from onset and combined imaging of perfusion, ADC, and biochemistry.
Reversibility of DWI lesions after reperfusion was described above. Areas of reversibility appear less intense on DWI (Minematsu et al., 1992b) and thresholds of reversibility in rats were estimated to be either less than 0.55 times 10−3 mm2/sec (Dardzinski et al., 1993) or a reduction of greater than 0.25 times 10−3 mm2/sec relative to the contralateral hemisphere (Hasegawa et al., 1994b). In cats (Miyabe et al., 1996) lesions were reversible if reperfusion occurred before Dav decreased to approximately less than 70% of control.
Therapeutic intervention
DWI and perfusion imaging have become established as valuable tools in drug development in experimental stroke models. The results and methodology used in these studies may be useful in planning human studies. Antagonists of NMDA receptors (Lo et al., 1994; Minematsu et al., 1993; Minematsu and Fisher, 1993; Verheul et al., 1994) and calcium influx (Kucharczyk et al., 1991a, b ; Seega and Elger, 1993) may cause reversal or prevent the expansion of some diffusion-weighted abnormalities, often in excess of 50% of lesion size if therapy begins sufficiently early. Free radical scavenger administration was associated with attenuation of ischemic damage in a temporary MCAO rodent model (Müller et al., 1995b). Thrombolytic therapy has been studied with variable results (Reith et al., 1996).
MR studies of ischemic stroke evolution in humans
The above serves to highlight that in experimental stroke DWI and perfusion imaging are reliable and sensitive for the detection of focal ischemia and for monitoring the evolution of ischemia, and that lesion evolution can be modified by interventions such as reperfusion and the administration of neuronal protective agents. These modalities have great potential to be applied to the study of human stroke. The literature on human stroke has lagged behind that on animals because of the limited availability of the technology, the medical instability of many patients who are not able to tolerate serial studies, and the fact that there are not many laboratories where there is both an interest in stroke and DWI. Studies are aimed at understanding the evolution of ischemic changes on DWI and in determining clinically useful patterns of diffusion and perfusion abnormalities. Initial results suggest that the evolution of ischemic lesions in humans is more prolonged and more heterogeneous than that found in experimental stroke models.
Time course of the ADC in human stroke
In human ischemic stroke, a reduced ADC has been seen as early as 105 minutes after onset (Warach et al., 1992a). Lesions become more hyperintense during the next 48 hours correlating with a further decrease in the ADC. As in animal studies, a decrease in the ADC has so far always preceded the development of infarction. The ADC has been found to have a two-phased time course (Warach et al., 1992a; 1995a; Schlaug et al., 1997a; Lutsep et al., 1997) with an initial decrease that is followed by a return to normal in the subacute to chronic phases termed pseudonormalization because the tissue is infarcted (Fig. 6). In the chronic phase the ADC subsequently became high due to increased water diffusion in the residual stroke cavity. The period during which the ADC remains restricted has varied between laboratories. In some the ADC had normalized by 48 hours (Welch et al., 1995; Chien et al., 1992) while in others the ADC pseudonormalized between 4 and 10 days (Marks et al., 1996; Sorensen et al., 1996; Warach et al., 1992a; Warach 1995a; Warach et al., 1996b; Lutsep et al., 1997; Schlaug et al., 1997a). Ulug et al. (1997) proposed that differences in the way the absolute D value was calculated may account for the discrepant results; in early studies the diffusion gradients were applied in the × direction (Warach et al., 1995a) in some laboratories while in others it was applied in the z direction (Welch et al., 1995). Similarly, variation in diffusion constants was noted in early animal and human studies and has been attributed to the result of different measurements with respect to diffusion anisotropy (van Zijl et al., 1994; Warach et al., 1997).
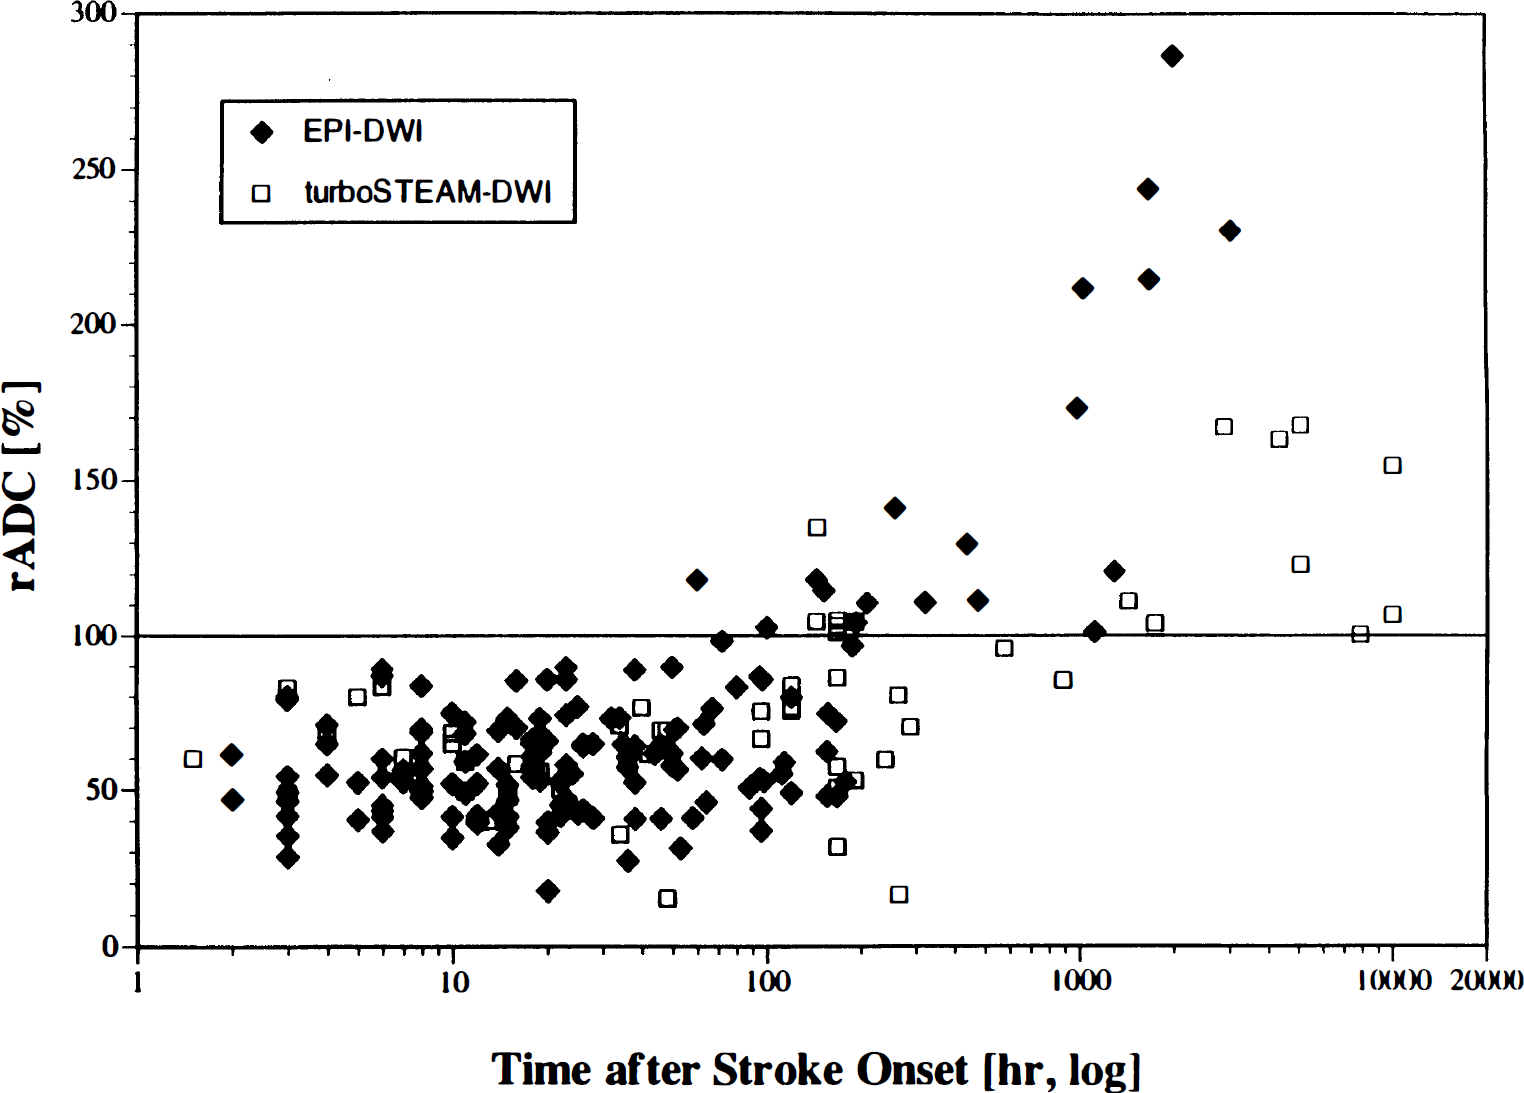
Time course of the apparent diffusion coefficient in humans. Scatterplot of the relative apparent diffusion coefficient values versus time in hours [log]. Reprinted from Schlaug et al., 1997a with permission.
More recent data on the time course of the ADC were calculated from a combination of images with the diffusion gradient applied in the × direction and diffusion trace images (Schlaug et al., 1997a) and found that the ADC remained low for up to 4 days. The ADC decreased to a mean maximum value of 58.3% of the contralateral region. It was suggested that the persistent reduction in the ADC within the first 4 days may reflect ongoing or progressive cytotoxic edema to a greater extent than extracellular edema and cell lysis. Earlier normalization of the ADC occurred in a few patients within the first 48 hours and was, in general, more common in patients with early reperfusion (Schlaug et al., 1997b). Some of this early normalization may represent a true normalization and tissue recovery or may represent the early evolution to infarction. These results suggest that the time course of ADC changes is more prolonged in humans than in rodent stroke models. The diffusion lesion may initially be heterogeneous but becomes more homogeneous over time (Welch et al., 1995). While reversal of DWI lesions has been well demonstrated in experimental models, to date there have only been a few reports of DWI lesion regression in humans (Marks et al., 1996; Sorensen et al., 1996).
Evolution of ischemic stroke lesion volumes
In patients studied very acutely in ischemic stroke, enlargement of ischemic lesion volumes was found on serial DWI studies performed during the first 53 hours (Baird et al., 1997a). For cases in which perfusion was also measured, enlargement of ischemic lesions occurred where there was a larger perfusion defect (measured by the relative MTT) but not where the perfusion abnormality was equivalent to or smaller than the DWI lesion (Baird et al., 1997a; Sorensen et al., 1996). In 43% of patients, the acute DWI lesion was smaller than the final infarct volume measured on T2-weighted images beyond 7 days while in the remaining 57% the acute lesion was equivalent to or larger than the final infarct measured on T2-weighted images, suggesting that it had already reached its final size at the time of the acute study (Baird et al., 1997a). Lesions in some patients continued to enlarge after 24 hours. In the majority of patients there was also a transient enlargement of the ischemic lesion volume between 24 and 53 hours, likely indicating vasogenic edema. The ultimate cause of the enlargement of the ischemic lesion volumes awaits determination, but it is speculated that in many cases it may represent an ischemic penumbra (Warach et al., 1993) (Fig. 7); other potential causes include delayed neuronal injury, apoptosis, spreading depression, reperfusion injury, or recurrent ischemia. In humans, the time course of the enlargement of cerebral ischemic lesions seems to be longer and more heterogeneous than in experimental stroke models and it is possible that in some cases tissue may be viable for longer than the 3 to 6 hours that is currently accepted by physicians (Baron et al., 1995).
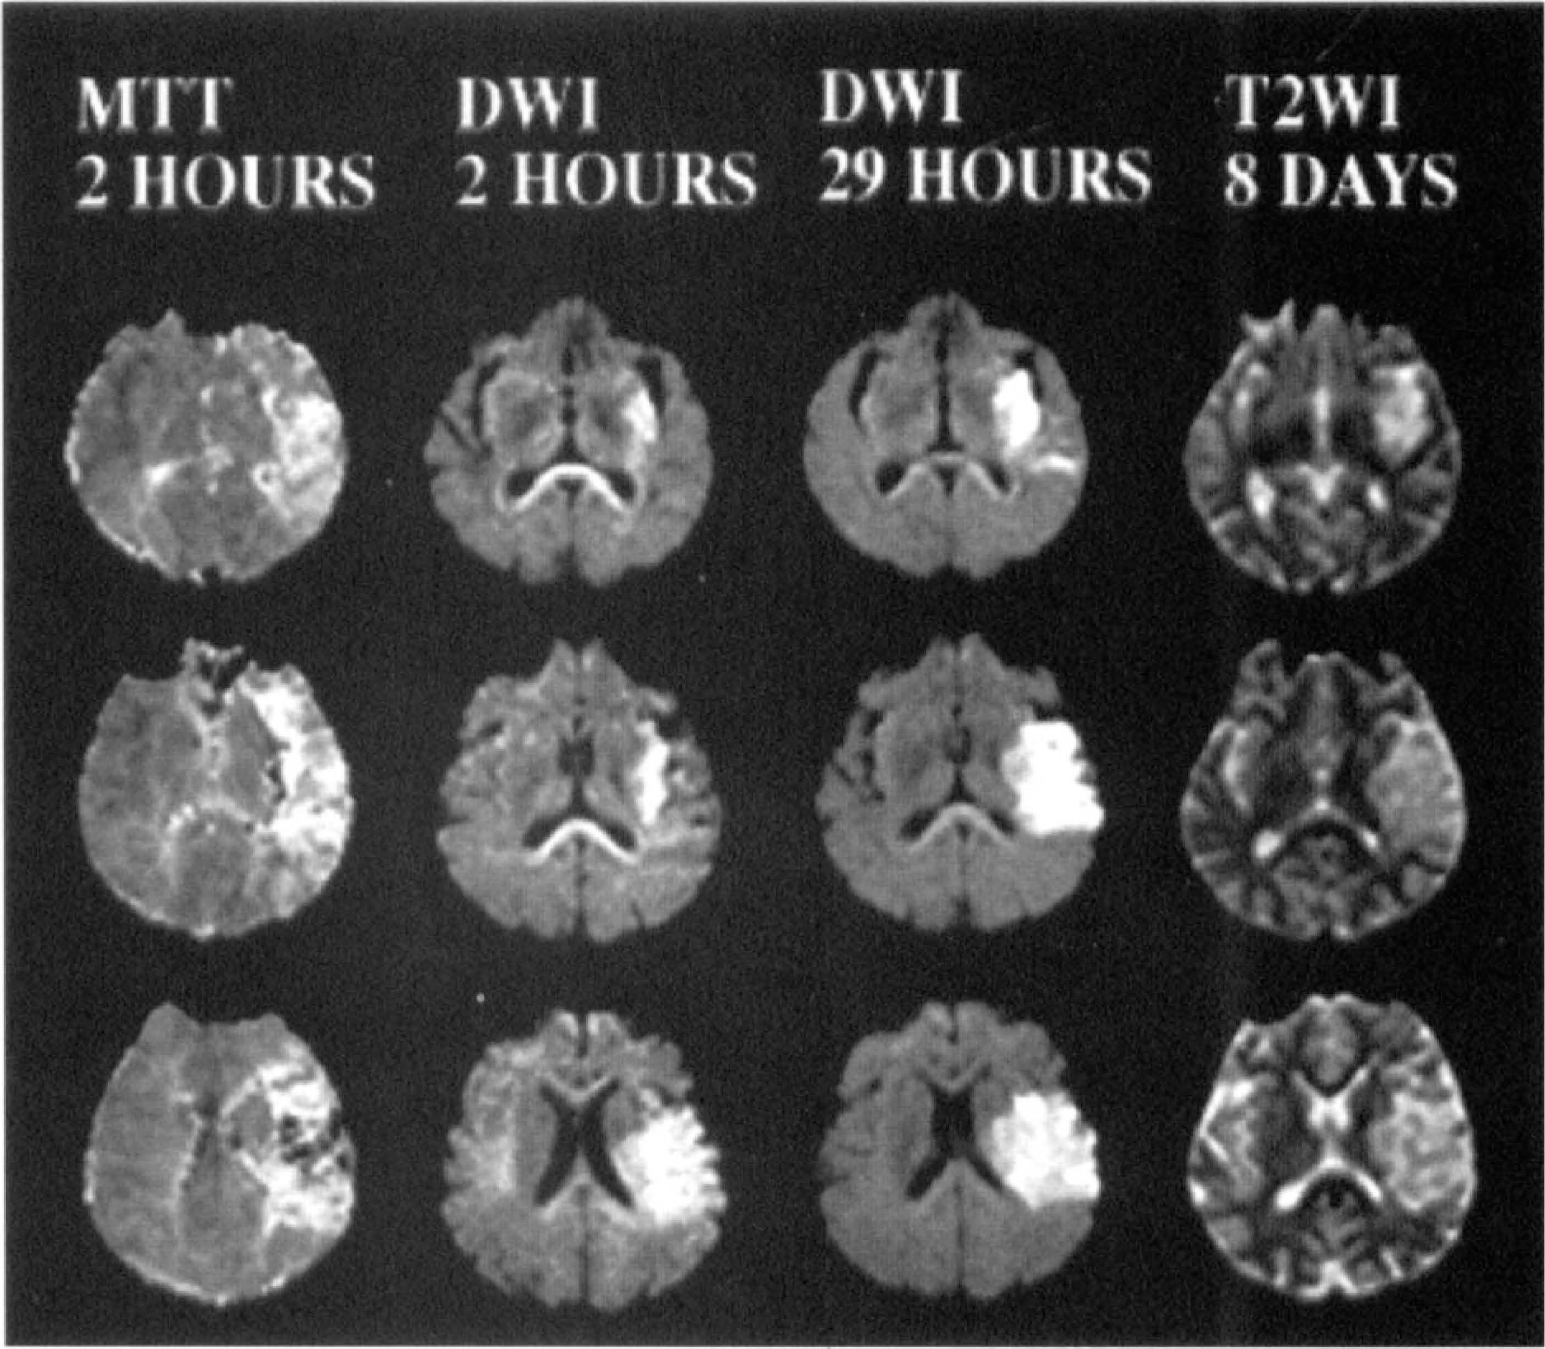
Enlargement of human cerebral ischemic lesion volumes. Serial magnetic resonance studies performed 2 hours, 29 hours, and 8 days after the onset of a left hemisphere syndrome (patient shown in Figs, 2, 4, and 5). At 2 hours there is restricted diffusion in the left middle cerebral artery territory along with a more extensive perfusion defect as shown on the mean transit time map. At 29 hours there had been enlargement of the ischemic lesion within the region of perfusion abnormality likely representing the ischemic penumbra. At 8 days there is a close correspondence between the infarct area on the T2-weighted image and the diffusion-weighted image lesion at 29 hours. DWI, diffusion-weighted images; MTT, mean transit time; T2WI, T2-weighted images.
Studies are in progress to determine the potential mechanisms related to ischemic lesion enlargement and perfusion patterns that are predictive of infarction and potential reversibility. Using the relative MTT image volume of perfusion abnormality, four patterns of perfusion-diffusion abnormalities have been seen within the first 24 hours: (type I) perfusion volume > DWI volume (70%), (type II) perfusion volume = DWI volume (10%), (type III) perfusion volume < DWI volume (10%), and (type IV) normal perfusion, abnormal DWI (10%) (Baird et al., 1997b). Types III and IV suggest that partial or total reperfusion has occurred at the time of the study and were present later (mean time, 9 hours) than types I and II (mean time, 6 hours). Ischemic lesion enlargement was significantly more likely to occur in patients with a type I pattern compared to all the other types supporting the preliminary findings that lesion growth seems to be dependent on the perfusion status of the tissue (Baird et al., 1997b).
Identification of boundaries of infarction
In addition to the MTT and DWI volumes, Sorensen et al. (1997) have studied the rCBF and rCBV perfusion parameters in acute stroke lesions. In 19 cases studied within 10 hours of onset, the volume of MTT abnormality (mean, 119.4 ± 123.0 cm3) and rCBF abnormality (mean, 111.5 ± 107.2 cm3) were larger than the mean CBV (46.6 ± 61.9 cm3) and the mean DWI volume (34.5 ± 55.2 cm3). The final infarct volume was intermediate between the DWI/rCBV and the MTT/rCBF volumes (mean, 66.5 ± 81.7 cm3). In the tissue with reduced rCBF but normal rCBV it may be speculated that there was some perfusion via collaterals, through autoregulatory vasodilation, or past an incomplete arterial occlusion (Powers and Raichle, 1985). In other reports, an increased rCBV was found in the peri-infarct tissue in acute and subacute strokes (Tsuchida et al., 1997). From their results Sorensen et al. (1997) concluded that perfusion and diffusion imaging in acute stroke could delineate the upper and lower boundaries of the volume of tissue at risk for eventual infarction. The tissue signatures of infarction identified by Welch et al. (1995) were described above; these have the potential to identify tissue that has progressed to infarction although the time course of the ADC was different in this report than in other clinical series (Ulug et al., 1997; Marks et al., 1996; Lutsep et al., 1997; Warach et al., 1997).
Schlaug et al. (1997c) operationally defined the ischemic penumbra as tissue with normal diffusion around the core of diffusion abnormality, with reduced perfusion (measured by rCBF or MTT) which increased at a subsequent scan. The regions operationally defined as the ischemic penumbra were characterized by a mean 73% increase in the MTT of the gadolinium bolus and a 29% increase in relative CBV. The rCBV volume measured to peak of the bolus arrival gave the best indicator of the penumbra. The core was characterized by a decrease in the rCBF and rCBV and extremely prolonged MTT. These findings may represent an important step towards defining MR thresholds of lesion evolution in stroke.
Other aspects
The above described preliminary findings are promising and complement the previous findings from the PET and single photon emission tomography literature, although there have been no correlative PET/functional MR studies in acute stroke to our knowledge. The BOLD technique may be potentially used to identify hypoxic tissue in stroke whereby increased oxygen extraction leads to increased deoxyhemoglobin and a decrease in the BOLD signal intensity (Turner et al., 1991b; de Crespigny et al., 1992). Chemical shift imaging seems to hold great promise for determining the metabolic correlates of DWI and perfusion changes (Barker et al., 1994) (Fig. 8). The clinical correlates of lesion enlargement and the operationally defined ischemic penumbra are of importance and await determination. Further areas of study include correlative histopathologic studies where this is possible.
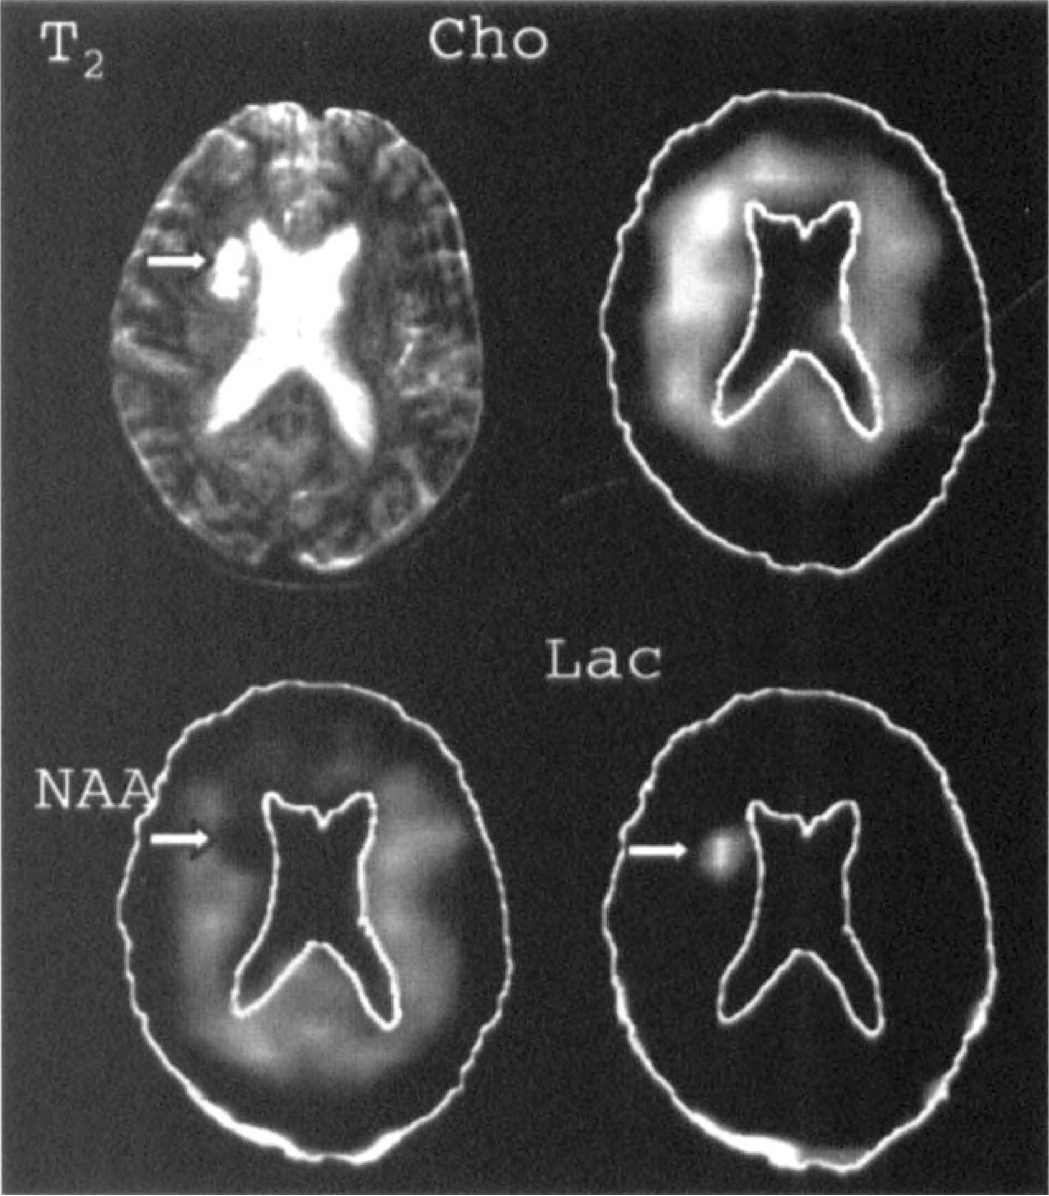
Chemical shift imaging. Non-water hydrogen metabolite images from a 56-year-old man 8 days after the onset of left hemiparesis, dysarthria, and central seventh cranial nerve palsy. The T2-weighted magnetic resonance image at upper left shows the anatomical infarct, indicated by the arrow. Distribution of signals from choline-containing compounds (Cho), N-acetyl compounds (mostly N-acetylaspartate [NAA]) and lactate (Lac) are shown in the other panels, with outlines of brain and ventricles drawn for anatomical orientation. NAA is decreased and Lac is increased in regions corresponding closely to the infarct (arrows), while the Cho signal is elevated more diffusely around it. Reprinted with permission from Radiology (Barker et al., 1994).
CLINICAL APPLICATIONS
In clinical practice, the diagnosis of ischemic stroke is based on (1) the clinical presentation, which can be incorrect in more than 10% of cases (Norris and Hachinski, 1982); and (2) the CT scan, which acutely shows minimal change at the most (Bryan et al., 1991). In the first 3 hours, when some patients are eligible for rt-PA therapy (National Institute of Neurological Disorders and Stroke Study Group Investigators, 1995), urgent CT brain imaging is most valuable for (1) excluding cerebral hemorrhage, (2) excluding other nonstroke pathologies and subarachnoid hemorrhage, and (3) detecting early infarct signs (Von Kummer et al., 1996). In the acute detection of ischemia a method is required that is easier to interpret. Methods for evaluating blood flow and arterial patency and for identifying viable and nonviable tissue are also increasingly needed as therapies may be tailored to the physiologic state of the tissue and for stratifying patients according to the potential risks of therapy.
The introduction of DWI, which provides the earliest clinically practical method for detecting acute ischemic stroke lesions, is likely to be welcomed by clinicians. Early reports have indicated the clinical utility of DWI in the early detection of acute ischemic lesions in distinguishing old lesions from new, in identifying the potential ischemic stroke mechanism, and in a potential cost-effectiveness role (Warach et al., 1995a, b ; Marks et al., 1996; Lutsep et al., 1997). Diffusion-weighted image lesions have been identified as early as 1.25 hours (Warach et al., 1995a) and 100 minutes after onset (Gonzalez et al., 1997; Hennerici et al., 1997). The main potential clinical utility of DWI and perfusion imaging appears to be within the first 24 to 48 hours after stroke, during ischemic lesion evolution, and before the development of T2-weighted image changes. Diffusion-weighted imaging is becoming more widely available, in some centers DWI has become part of the clinical routine and DWI is Food and Drug Administration—approved for the investigation of stroke. With the advent of DWI and perfusion imaging and the potential for the detection of acute hemorrhagic stroke with MR it has been suggested by some that a multimodality MRI in the acute stage could be a very valuable adjunctive diagnostic tool to CT (Fig. 9), or may even become the modality of choice in the hyperacute stroke setting.
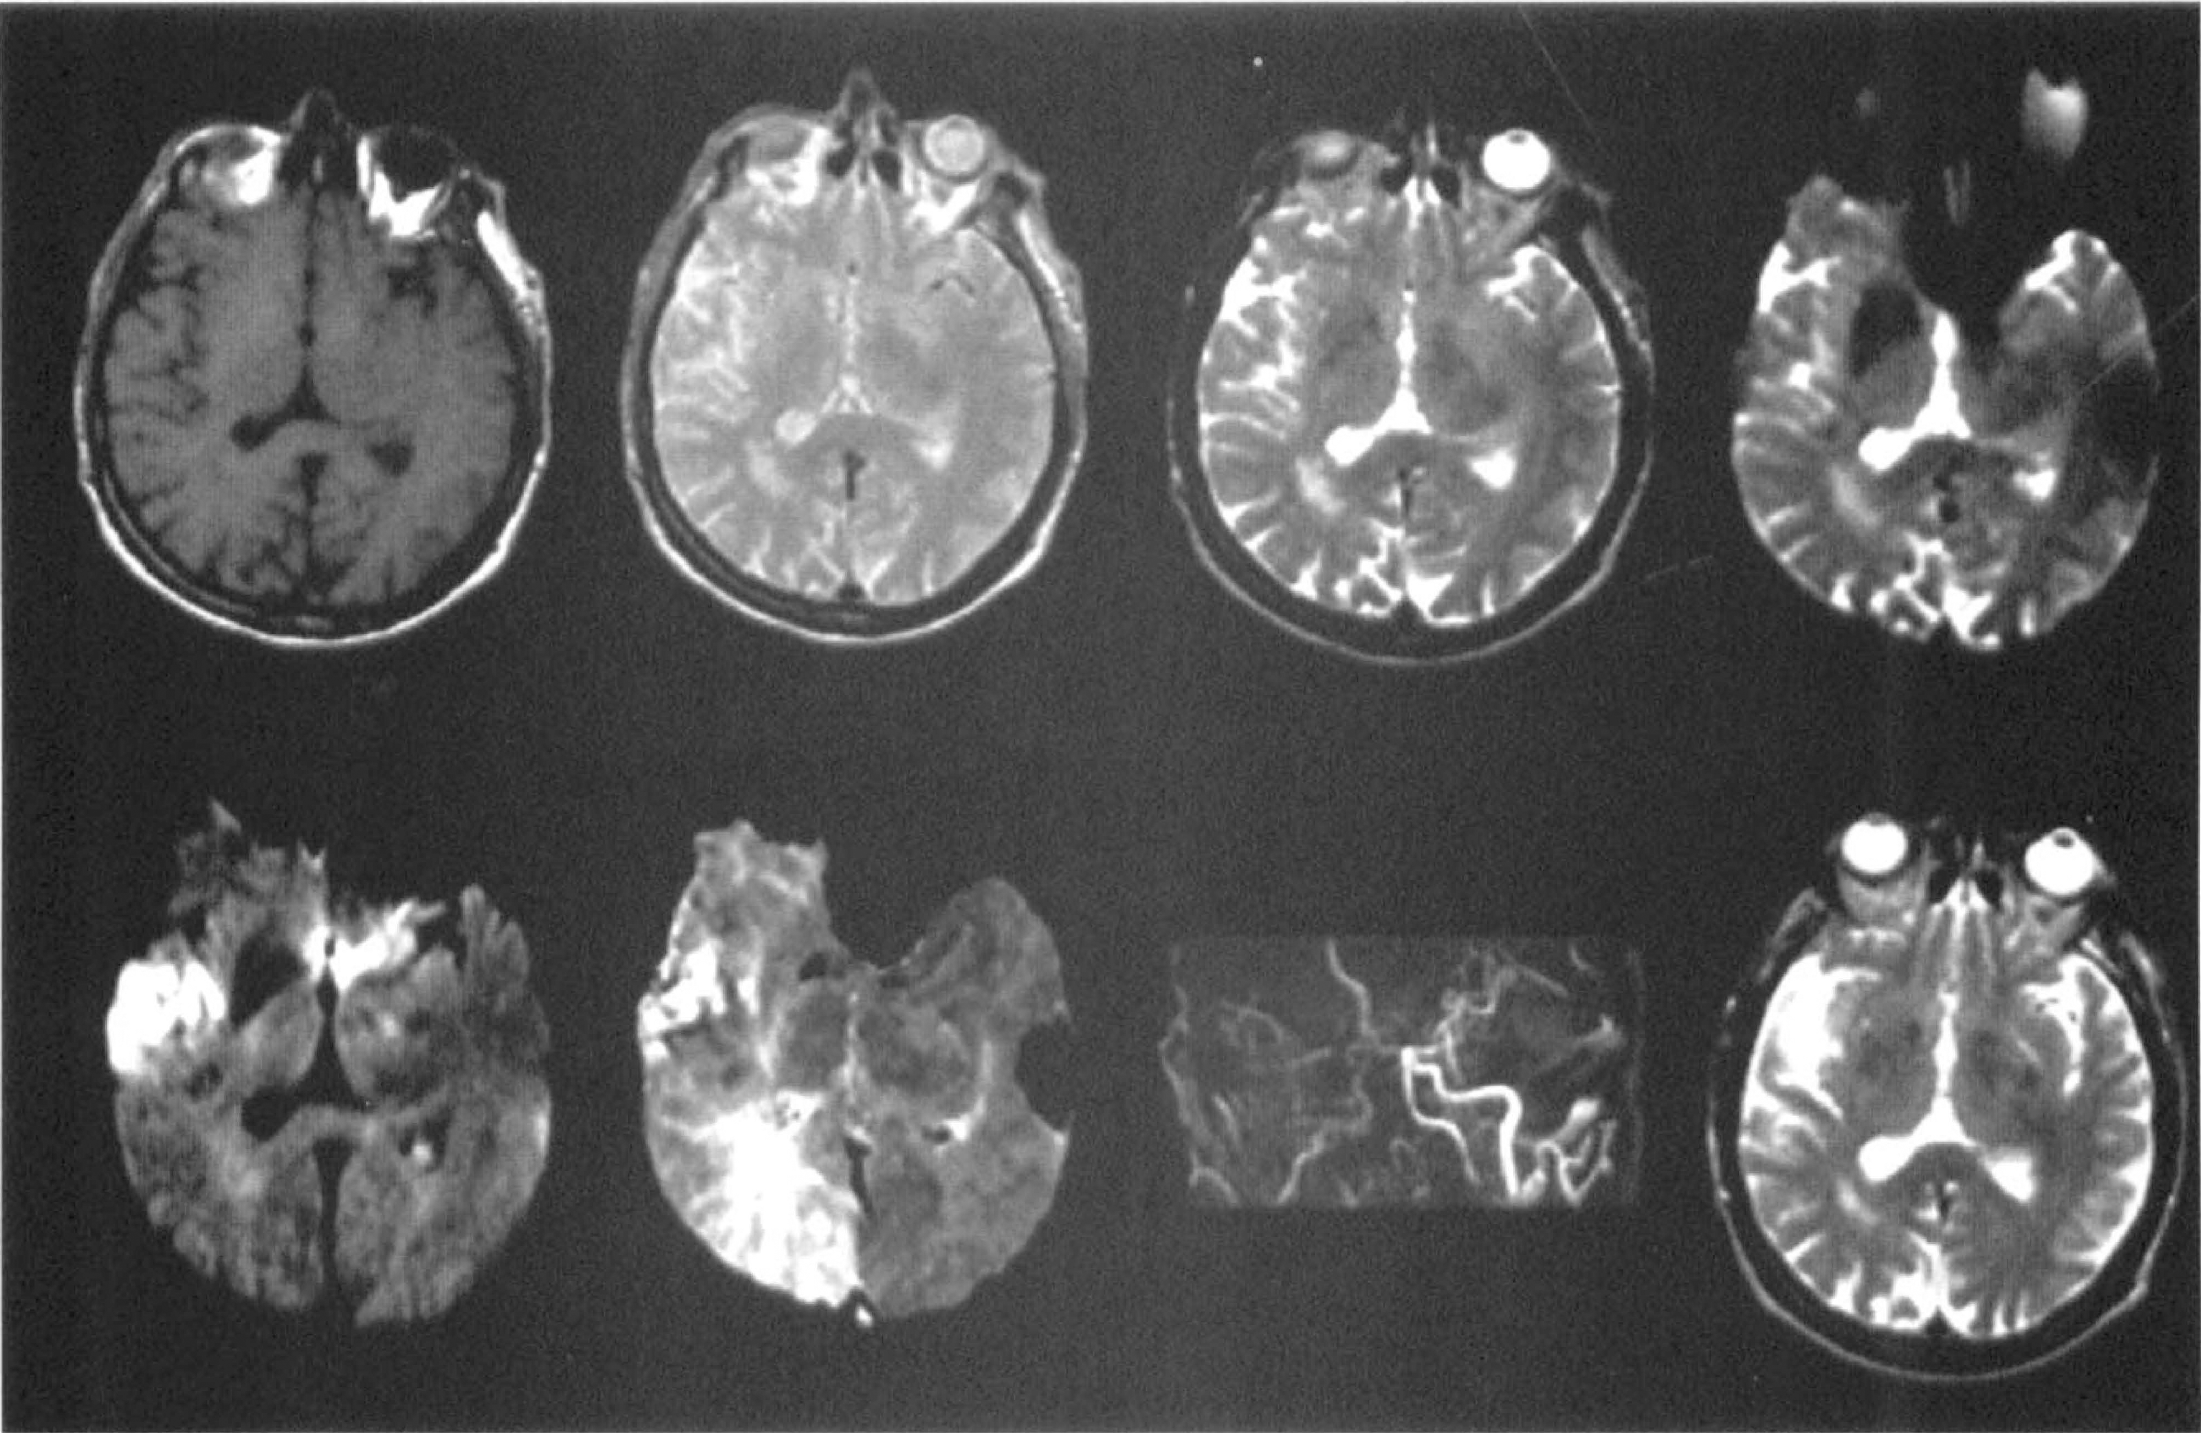
Multimodality magnetic resonance imaging of acute ischemic stroke. The top row (from the left to right) shows the T1-weighted image, proton density image, T2-weighted image, and susceptibility-weighted image from a patient studied 2 hours after the onset of left hand weakness and clumsiness and dysarthria. The bottom row (left to right) shows the diffusion-weighted image, the relative mean transit time perfusion map, magnetic resonance angiograph, and follow-up T2-weighted image, respectively. The magnetic resonance angiograph reveals extremely poor flow in the right internal carotid artery. The T1-weighted image, T2-weighted image, and proton density images are normal. There is signal hyperintensity on the diffusion-weighted image in a branch territory of the inferior division of the right middle cerebral artery and prolonged transit of the gadolinium bolus on the mean transit time map. Signal attenuation in the ischemic zone is present on the susceptibility-weighted image. Infarction in this region was confirmed on follow-up T2WI (bottom right image).
The current issues that must be clarified regarding the clinical utility of hyperacute MRI in stroke are (1) improving the time and practical efficiency of MR; (2) the availability of DWI; (3) the determination of the sensitivity and specificity of DWI in detecting stroke lesions as well as the accuracy of acute detection of intracerebral hemorrhage; (4) the determination of the clinical value of DWI and perfusion imaging for identifying tissue at risk, in providing prognostic information and selection for therapy; and (5) the development of software for rapid reconstruction and processing of perfusion data. Optimal scan interpretation requires an accurate knowledge of the time after stroke onset that the scan was acquired along with a knowledge of the clinical presentation and the pattern of the evolution of MR changes in stroke. Although the current data is preliminary the early results are very promising.
Sensitivity of detection of acute stroke with diffusion-weighted imaging and T2-weighted imaging
The sensitivity and specificity of DWI in acute stroke has been reported in several abstracts (Warach and Edelman, 1996a; Gonzalez et al., 1997; Schaefer et al., 1996). In 24 patients studied within 6 hours of symptom onset, the sensitivity and specificity of DWI were both 100% based on a comparison with the clinical localization of the stroke (Gonzalez et al., 1997). In another series of 122 patients studied within 48 hours, the sensitivity of DWI was 81% and the specificity was 100% based on clinical criteria (Warach and Edelman, 1996a). In two patients in this series, one patient with a brain tumor and one patient with a brain abscess, signal hyperintensity was present on DWI but the measured ADC measured was high, highlighting the importance of reading DWI in combination with the T2-weighted image or with an ADC map. Diffusion-weighted imaging has been studied in a variety of other conditions: signal hyperintensity on DWI has been described in a case of the new variant of Creutzfeldt-Jakob disease (Demaerel et al., 1997), but the ADC was not reported. Studies are awaited on a comparison of the sensitivity and specificity of DWI and T2-weighted imaging in the first 12 to 24 hours and on the sensitivity and specificity of DWI based on the infarct topography on late T2-weighted imaging. From lesion evolution studies it is already known that during the first 6–12 hours the perfusion lesion will generally be larger than the eventual infarct and that in a number of cases the DWI lesion will be smaller than the final infarct as lesions are still evolving during this time (Sorensen et al., 1996; Baird et al., 1997a).
Perfusion imaging will also provide very useful information in the acute stage; acutely the changes on MR perfusion imaging precede the DWI changes (Tong et al., 1997). Perfusion imaging in acute stroke was reported by Warach et al. (1992b) and more recently by Röther et al. (1996b) and Siewert et al. (1997) (using EPISTAR perfusion). Röther et al. (1996b) showed reduced rCBV within the first 6 hours in seven patients with subsequent territorial infarcts with dynamic susceptibility contrast-enhanced perfusion imaging. It was possible to differentiate between severely ischemic tissue and peri-infarct parenchyma, and it was possible to serially monitor perfusion changes. In the study of Warach et al. (1992b) dynamic contrast-enhanced T2-weighted MRI and magnetic resonance angiography were used to evaluate the rCBV and the intracranial arteries in 34 patients within 48 hours of the onset of symptoms. In 24 patients, an ischemic lesion was located and in 16 patients there was a severe stenosis or occlusion of a major intracranial vessel supplying the area of infarction (including the internal carotid, middle cerebral, basilar and posterior cerebral arteries but not small vessel branch occlusions). In 15 of 16 patients with demonstrated intracranial arterial occlusions shown on MR angiography, there was decreased blood volume along with delayed transit times of the gadolinium (Warach et al., 1992b).
Structural MRI does not reliably depict ischemic lesions within the first 8 to 12 hours although vascular abnormalities can be detected in the first 2 to 3 hours in some cases (Yuh et al., 1991). By 24 hours 50% to 80% of ischemic lesions can be detected on T2-weighted imaging (Yuh et al., 1991; Bryan et al., 1991) compared to approximately 50% for CT. The information about tissue structure and vasculature provided combined by T1-weighted and T2-weighted imaging, proton density imaging, and intracranial and extracranial MRA techniques is of superior value than more traditional imaging modalities (Kertesz et al., 1987; Bryan et al., 1991; Yuh et al., 1991; Alberts et al., 1992; Mohr et al., 1995). Structural MRI is particularly valuable for locating ischemic lesions in the posterior fossa (Amarenco et al., 1993) and the spinal cord. On FLAIR imaging the CSF signal is suppressed; this may improve the detection of small subacute and chronic infarcts in the cortex and periventricular regions (Brandt-Zawadzki et al., 1996) which are typically difficult to find on T2-weighted images and may account for a percentage of CT- and MR- negative strokes (Bryan et al., 1991; Alberts et al., 1992).
Detection of intracerebral hemorrhage
To be used in the acute stroke setting, it would be of great value if MR could reliably detect intracerebral hemorrhage. After hemorrhage, blood goes through several phases of breakdown that are detectable by MRI; the signal changes are dependent on the state of oxygenation. The first is the transition from oxyhemoglobin to deoxyhemoglobin; deoxyhemoglobin is a paramagnetic molecule that causes signal loss (darkening) in images due to magnetic susceptibility effects which are best seen on T2-weighted (susceptibility-weighted) pulse sequences (Patel et al., 1996). The time of transition to deoxyhemoglobin is not known (possibly it is from several hours to a few days). The next stage is intracellular methemoglobin to extracellular hemoglobin (after red cell lysis occurs) and then finally to hemosiderin (Mattle et al., 1996) (Table 3, Fig. 10). The accuracy of MR for acute intraparenchymal hemorrhage is debated. Several studies at ≤0.6 Tesla (Di Chiro et al., 1986; Zimmerman et al., 1988; Weingarten et al., 1991a, b ) found that MR was insensitive to acute hemorrhage.
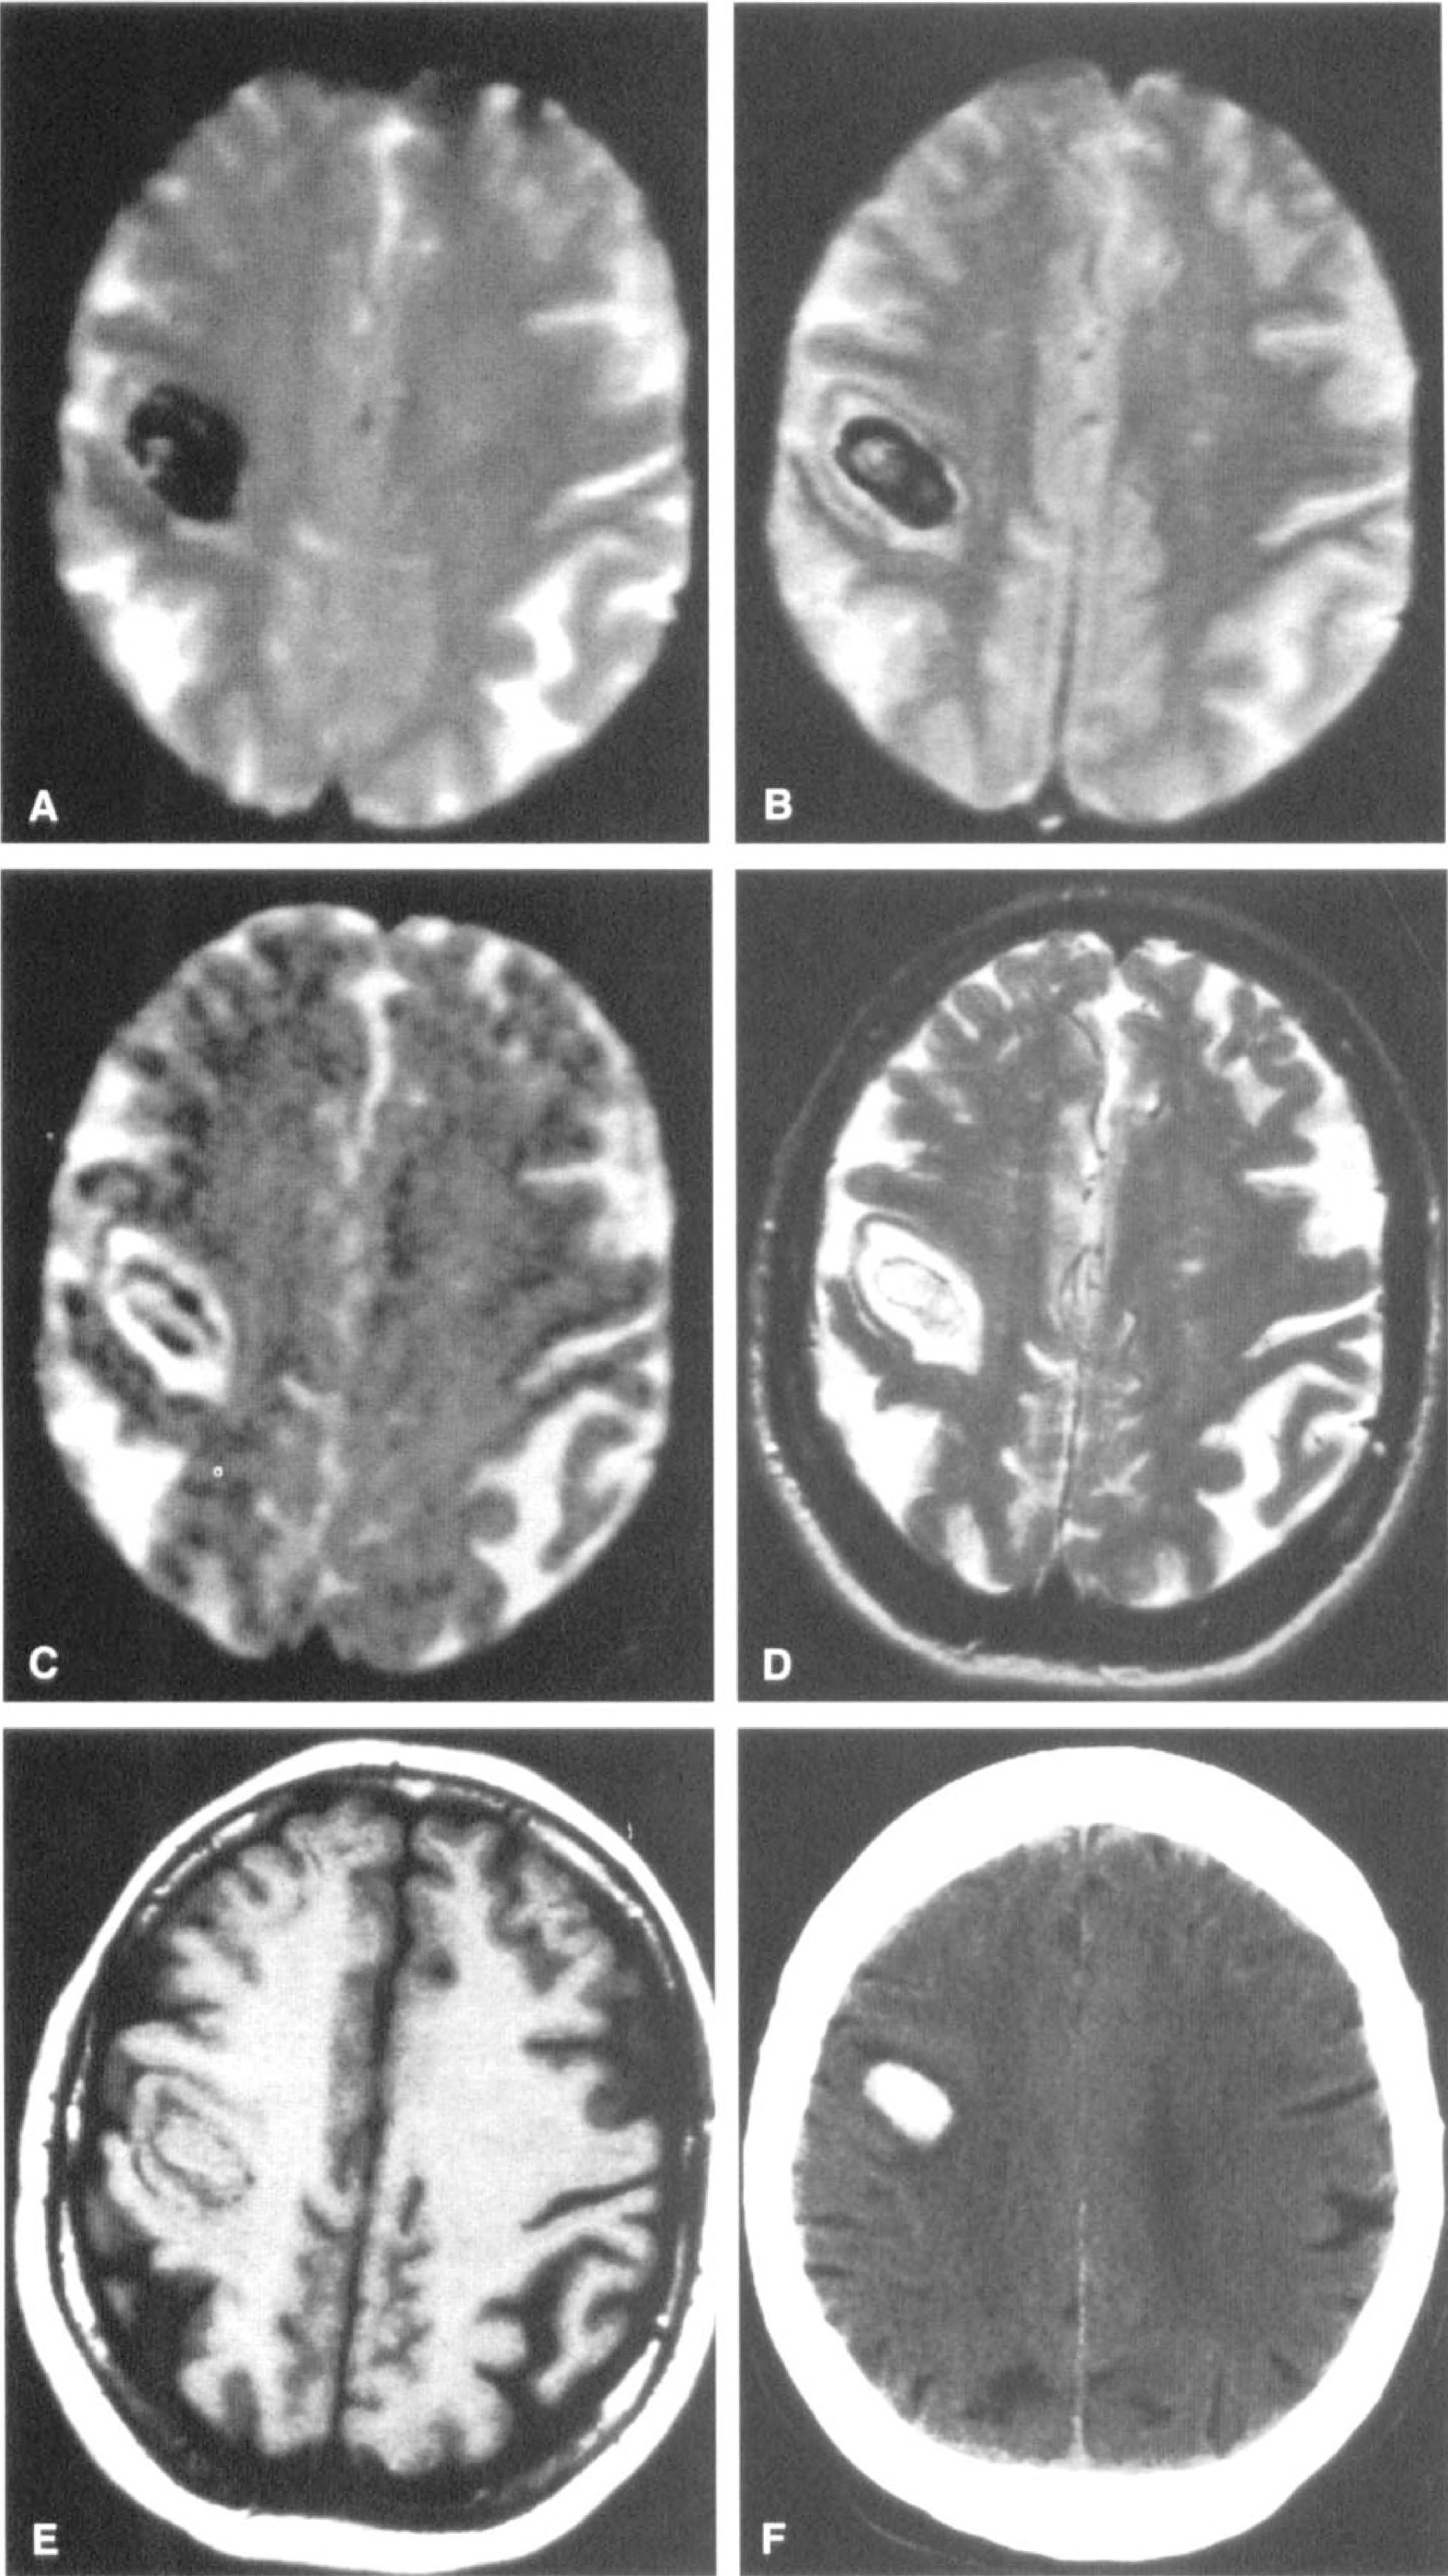
Detection of hyperacute intracerebral hemorrhage with magnetic resonance imaging. Magnetic resonance imaging study at 2.5 hours after onset of left hemiparesis and left facial numbness. (A) Echo-planar susceptibility-weighted image shows a right posterior frontal lesion with marked components of signal loss consistent with acute hemorrhage. (
Changes of intraparenchymal hemorrhage on MRI
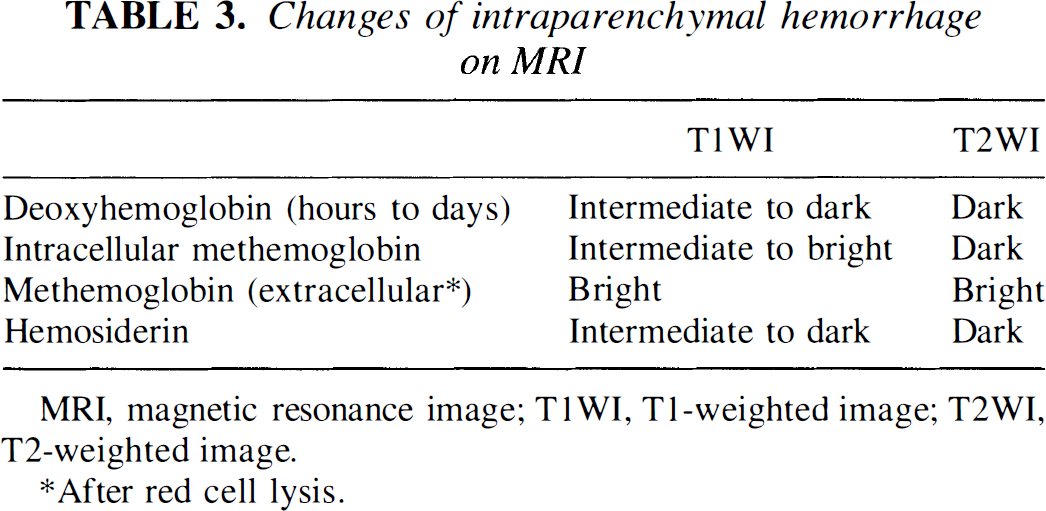
MRI, magnetic resonance image; T1WI, T1-weighted image; T2WI, T2-weighted image.
After red cell lysis.
Patel et al. (1996) hypothesized that MR at 1.5 Tesla may be more sensitive because susceptibility effects (and therefore sensitivity to hemorrhage) increase with field strength. Also, the sensitivity for hemorrhage may be increased with gradient echo and particularly echo planar techniques that are more sensitive to susceptibility effects (susceptibility sequences, T2* sequences). In this study hemorrhage was detected on MR within 2.5 to 5 hours of onset in six patients. The hemorrhage appeared as regions of marked signal loss due to susceptibility effects most evident on the more susceptibility-weighted images and particularly echoplanar gradient-echo sequences. On T1-weighted images, the lesion was isointense to white matter, with a thin hypointense periphery. On T2-weighted images, the lesion appeared slightly hyperintense to gray matter with surrounding T2 hyperintensity and numerous internal foci of signal loss. Susceptibility-weighted sequences have the drawbacks of artifactual signal loss and anatomic distortion in the inferior frontal and inferior temporal lobes. The hypointense rim on T1-weighted images and the hyperintense rim on T2-weighted images may represent a rim of iron storage due to early phagocytic activity (Thulborn and Atlas, 1991) or may represent a region of dephasing at the boundary of blood and brain with differing magnetic susceptibility (Edelman et al., 1986). There were no hyperintensities on T1-weighted images, suggesting that evolution to methemoglobin had not occurred within 5 hours. Although more studies are needed at 1.5 Tesla, with susceptibility weighting, these results are very promising. Acute MR is not recommended if there is clinical suspicion of subarachnoid hemorrhage as it may be masked by artifacts, although there has been a report of subarachnoid hemorrhage detection on FLAIR images (Noguchi et al., 1994).
Identification of potentially viable tissue and selection of patients for therapeutic intervention
In the era of acute stroke thrombolysis, there is increasing recognition of the importance of tailoring therapeutic intervention to the individual patient's physiology by characterizing the (1) proportions of viable and nonviable tissue, (2) arterial patency, and (3) tissue perfusion status. Several studies have tried to identify patients at higher risk of hemorrhage after thrombolysis (infarct signs on CT) (Von Kummer et al., 1996) (hypoperfusion on hexylmethylpropylene amineoxine single photon emission computed tomography) (Ueda et al., 1994). A number of neuroprotective therapies are on the horizon that could be administered according to the patient's perfusion status. Some work irrespective of perfusion status (competitive and noncompetitive NMDA receptor antagonists, glycine antagonists, presynaptic modulators of excitatory amino acid release, polypeptide growth factors and serotonin agonists) while others such as antiadhesion molecules and antioxidants work best in temporary occlusion models; these could be administered after reperfusion has occurred (Silver et al., 1996; Fisher, 1997).
Multimodality MR could be used to see if an arterial occlusion is still present (MRA), to see if reperfusion has occurred, and to assess the severity of the perfusion defect (perfusion imaging), and to theoretically identify the proportions of viable and nonviable tissue (combined DWI and perfusion imaging). In preliminary analyses, the area of mismatch between the diffusion and perfusion lesions may give an indication of the amount of tissue that is at risk; a large difference (hypoperfusion volume larger than the diffusion lesion) may signify a large area at potential risk while congruent DWI and perfusion lesions may signify a lesion that has reached its final size (Warach et al., 1993; Baird et al., 1997a). Preliminary clinical studies indicate a correlation between the volume of tissue at risk (the larger of the diffusion and perfusion lesions) and clinical severity as well as a correlation between the amount of clinical improvement after the stroke and the difference between the volume of tissue that was acutely at risk and the final infarct (Baird et al., 1997c).
Early on, however, some of the DWI lesion may be reversible and not all of the hypoperfused tissue may be symptomatic or at risk. Therefore, the tissue at risk may be better defined by characterizing the ischemic core and ischemic penumbra (i.e., the portion of hypoperfused tissue that is at risk for infarction) in more detail, from a combination of time-based ADC and perfusion thresholds (Miyabe et al., 1996; Fisher, 1997). The perfusion threshold for reversible clinical deficits lies above the infarction threshold in primates (Jones et al., 1981) and, theoretically, some patients may have clinically symptomatic tissue that is perfused at a level above the infarction threshold. It might become possible to distinguish between hypoperfused symptomatic tissue and hypoperfused asymptomatic tissue by characterizing the biochemical state of the lesion with MRS (Barker et al., 1994; Prichard, 1996; Prichard and Cummings, 1997). Work is currently focused on identifying clinically useful MR patterns of potential tissue viability.
Therapeutic evaluation
Combined DWI and perfusion imaging has become the standard method of demonstrating neuroprotection in animal models. In humans these techniques could be used to identify the appropriate patients by lesion size and location in therapeutic evaluation studies. This could allow a more homogeneous group of patients to be studied and might allow a more precise characterization of the mechanisms by which therapeutic efficacy (or inefficacy) may occur. This could reduce the number of patients needed in clinical trials. In preliminary studies in humans no significant effect on DWI lesion size was found using a noncompetitive NMDA receptor antagonist (Warach et al., 1995a) but in a pilot study of citicoline therapy reduced lesion volume occurred in citicoline-treated patients (Warach et al., 1996a). MR studies could be used as adjunctive measures in the therapeutic evaluation or eventually as end points in themselves if clinically relevant patterns of changes are identified.
Identification of stroke mechanism
Diffusion-weighted imaging in conjunction with intracranial and extracranial MRA can potentially provide information about the stroke mechanism (Figs. 9 and 11). Watershed ischemia may be associated with a large artery occlusion on MRA and with a watershed pattern of discrete DWI lesions in the arterial borderzones (Warach and Edelman, 1996a). Cardiogenic embolism may be associated with simultaneous lesions in both hemispheres or in the anterior and posterior circulations and in large artery-artery embolism there may be a large artery stenosis with a peripheral infarct (Warach and Edelman, 1996a; Gass et al., 1997). Multiple ischemic lesions on DWI are not uncommonly found, suggesting that acute ischemia may be multifocal and silent ischemia may not be uncommon. Many of these lesions progress to infarction but some may resolve while others may be too small to be detected by conventional T2-weighted imaging (Fig. 11).
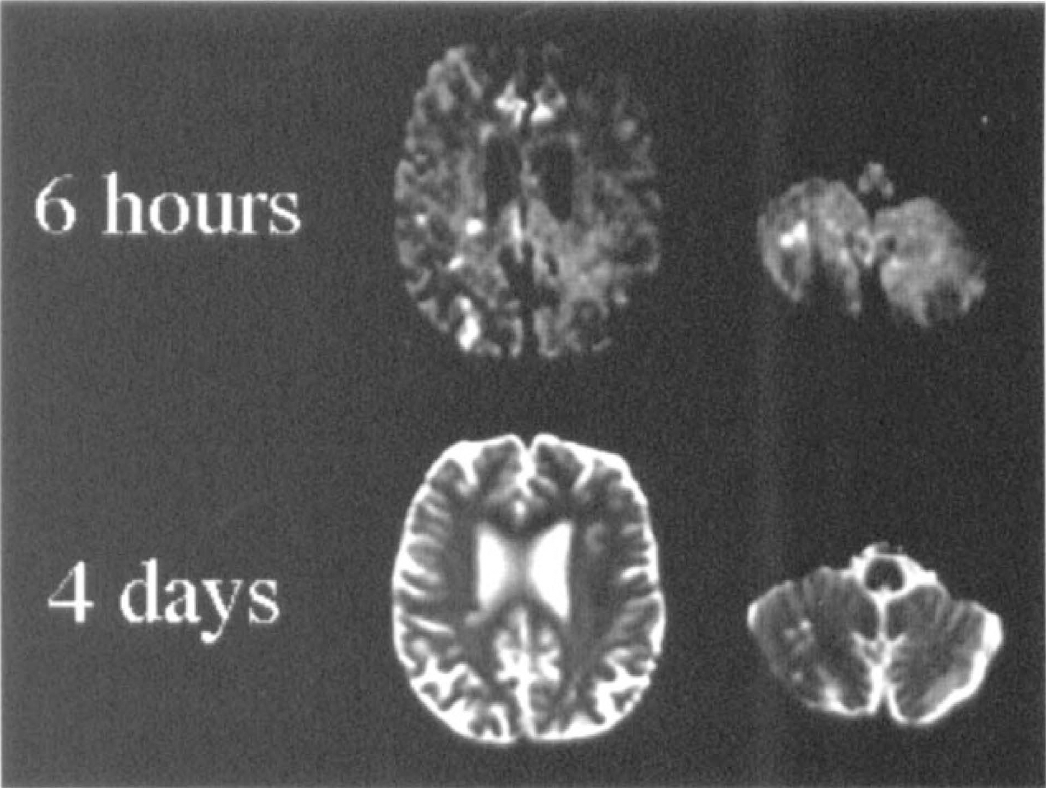
Detection of multiple ischemic foci with diffusion-weighted imaging. The top row shows the diffusion-weighted image obtained 6 hours after the onset of left hand weakness in a 63- year-old male. Multiple lesions are present in the right posterior parieto-occipital cortex (posterior watershed zone and adjacent cortex) as well as in the right cerebellar watershed zone. The corresponding T2-weighted image did not reveal any abnormality. Extensive workup failed to find the cause of these ischemic lesions. Infarction in many of these regions was present on follow-up T2-weighted imaging at 4 days (lower row).
Prognostic value
The prognostic value of acute MR may be important in planning management and discharge planning. Preliminary studies have shown a significant correlation between acute DWI lesion volume and clinical severity as well as late outcome measured by National Institutes of Health Stroke Scale score (Lovblad et al., 1997). Warach et al. (1996a) described three patterns of outcome in relationship to diffusion and perfusion status and found a good predictive value of combined imaging in distinguishing between patients who would improve and those who would not in 19 patients.
CONCLUSION
Structural MRI, in combination with MRA, is an established and valuable diagnostic tool in the workup of stroke patients beyond the first 12 to 24 hours after onset. Developments in functional MR techniques, including DWI, noninvasive perfusion MR methods, and ultrafast imaging strategies have occurred that may have a major impact in clinical practice within the first 12 hours after stroke onset as well as in the study of human ischemic stroke pathophysiology. Functional MR studies in experimental stroke models have provided new insights into the pathophysiology of ischemic stroke which may be of relevance to human ischemic stroke. Preliminary results in humans indicate the clinical utility of these methods. With the recognition of clinically useful patterns of MR lesions and in combination with MRA, it may become possible for therapeutic and clinical decisions to be based on the physiologic state of the tissue. The major limitations to the routine clinical use at present are availability, and practicality, as well as the time-intensive nature of the processing of perfusion data, but many of these problems are surmountable. If MR can be proven to be reliable in locating ischemic lesions and in ruling out hemorrhage, practical, and clinically useful MR signatures can be recognized, then MR may at the very least become a very valuable adjunctive method in the hyperacute stroke setting or the imaging modality of choice.
Footnotes
Acknowledgments
The authors thank Dr. P. Jakob and Dr. M. Patel for their helpful comments and assistance with Figs. 1 and ![]() , respectively.
, respectively.