
Abstract
The goal of this study was to develop a suitable kinetic analysis method for quantification of 5-HT2A receptor parameters with [11C]MDL 100,907. Twelve control studies and four preblocking studies (400 nmol/kg unlabeled MDL 100,907) were performed in isoflurane-anesthetized rhesus monkeys. The plasma input function was determined from arterial blood samples with metabolite measurements by extraction in ethyl acetate. The preblocking studies showed that a two-tissue compartment model was necessary to fit the time activity curves of all brain regions including the cerebellum—in other words, the need for two compartments is not proof of specific binding. Therefore, a three-tissue compartment model was used to analyze the control studies, with three parameters fixed based on the preblocking data. Reliable fits of control data could be obtained only if no more than three parameters were allowed to vary. For routine use of [11C]MDL 100,907, several simplified methods were evaluated. A two-tissue (2T‘) compartment with one fixed parameter was the most reliable compartmental approach; a one-compartment model failed to fit the data adequately. The Logan graphical approach was also tested and produced comparable results to the 2T’ model. However, a simulation study showed that Logan analysis produced a larger bias at higher noise levels. Thus, the 2T' model is the best choice for analysis of [11C]MDL 100,907 studies.
Positron emission tomography (PET) has been used to measure receptor-related parameters in vivo for several neurotransmitter systems. The 5-HT2A receptor may play an important role in several psychiatric disorders such as depression (Yates et al., 1990) and schizophrenia (Joyce et al., 1993), so a reliable tracer method for evaluation of these receptors would be of great use. Various radiopharmaceuticals have been developed to investigate 5-HT2A receptors, including [11C]N-methylspiperone (Wong et al., 1984), [18F]setoperone (Blin et al., 1988), and [18F]altanserin (Sadzot et al., 1995). These tracers, however, either do not show high selectivity for the 5-HT2A subtype or have radioactive metabolites that cross the blood–brain barrier.
MDL 100,907 ((R)-(+)-α-(2,3-dimethoxyphenyl)-1-[2-(4-fluorophenyl)ethyl]-4-piperidine methanol) is a highly selective 5-HT2A receptor antagonist (Sorensen et al., 1993). Several investigators have evaluated [11C]MDL 100,907 with PET. Mathis et al. (1996) demonstrated in vivo specific binding in rat and baboon. Lundkvist et al. (1996) also performed displacement and pretreatment studies with ketanserin and showed no evidence of specific binding in the cerebellum. Ito et al. (1998) presented the first data obtained in humans with [11C]MDL 100,907. They applied a model with two tissue (2T) compartments for analyzing regional time–activity curves (TACs), and all regions including the cerebellum were well described by this model. Because the cerebellum curve was not adequately described by a one-tissue (1T) compartment model, they concluded that specific binding in the cerebellum could not be neglected and that a reference region approach was not fully appropriate.
To evaluate this tracer further, we performed studies in rhesus monkeys with [11C]MDL 100,907. We used preblocking studies to determine the appropriate model configuration for free and nonspecifically bound tracer. From this model, we added a compartment for specific binding to be used for analysis of control data. By comparing control and preblocking studies, we determined whether there is specific binding in the cerebellum. We also tested several simpler methods to analyze [11C]MDL 100,907 data with the goal of defining a suitable method to quantify 5-HT2A receptor parameters when preblocking data are unavailable.
METHODS
Radiosynthesis
[11C]Methyl iodide was trapped at room temperature in a vial containing the 3-hydroxy precursor (MDL 105725, 0.200 mg; 0.56 μmoles), acetone (400 μL) and tetrabutylammonium fluoride (2 μL, 1.0 mol/L in tetrahydrofuran) less than 20 minutes before alkylation. The vessel was sealed and heated to 80°C for 3 minutes. The mixture was filtered (10 μm polyethylene frit), diluted with 500 μL high pressure liquid chromatography (HPLC) eluent, and transferred into an HPLC injector. The mixture was purified by semipreparative HPLC (52% 10 mmol/L TEA-NaH2PO4 [pH 8], 48% acetonitrile) at 6 mL/min on a Beckman Ultrasphere ODS (Thomson, Springfield, MA, U.S.A.), 5 μ, 10 × 250-mm column. The product, [11C]MDL 100907, was eluted at the same retention time as authentic standard (9.25 minutes). The eluent was diluted with 20 mL water and passed through a 1-mL C-18 cartridge (Waters Lite, Milford, MA, U.S.A.) and washed with 5 mL water. The trapped activity was eluted with 0.5 mL ethanol and diluted to 10 mL with normal saline. The specific activity and radiochemical yield at end of bombardment were 6,600 ± 2,300 mCi/μmol and 17% ± 8%, respectively. Radiochemical purity was 99.0% ± 0.9%.
PET studies
PET studies were performed in rhesus monkeys (6.3 to 12.6 kg). The animals were initially anesthetized with ketamine to permit endotracheal intubation and insertion of an intravenous line. The monkeys were then transported to the PET suite and placed under isoflurane anesthesia (1% to 2%). Head position was fixed with a stereotactic head holder to obtain coronal brain slices. Blood pressure, electrocardiogram, temperature, and end-tidal Pco2 were continuously monitored. These studies were carried out under a protocol approved by the NIH Clinical Center Animal Care and Use Committee.
In three monkeys, two control scans were performed in the same day for test–retest comparisons, with injections separated by approximately 3 hours. In four monkeys, a control study was performed, followed by a preblocking study. In two additional monkeys, a single control study was performed. Thus, a total of 12 control and 4 preblocking studies were performed.
PET scans were acquired on the GE Advance tomograph (GE Medical Systems, Waukesha, WI, U.S.A.), which acquires 35 slices, 4.25 mm apart, with 6- to 7-mm reconstructed transverse resolution. After a transmission scan, three scans with 4-mCi injections of [15O]water were performed to measure cerebral blood flow (CBF) using three-dimensional acquisition and reconstruction, including the scatter correction of Stearns (1995). Arterial blood was continuously withdrawn (3.8 mL/min) during a 1-minute scan, radioactivity was counted with a NaI(T1) detector, and data were corrected for randoms, deadtime, and sensitivity. Dispersion correction was performed by deconvolution of the measured dispersion function, and time shifts between blood and brain data were determined by aligning scanner count rate data to the blood data. The resulting arterial input function was used to calculate CBF (Herscovitch et al., 1983), assuming a partition coefficient of 0.8 mL/g. Three studies were acquired and averaged to reduce the statistical uncertainty in the CBF values.
[11C]MDL 100,907 was administered as a bolus. Because accurate measurement of the input function is critical for kinetic modeling, the injected radioactivity dose of 20 to 39 mCi was selected to achieve a high radioactivity concentration in the blood to improve our ability to detect plasma metabolites by HPLC, where the sample fractions at late times are count-limited. The specific activity at injection time was 700 to 1,800 mCi/μmol, and the injected mass of MDL 100,907 was 3.0 ± 1.4 nmol/kg. Dynamic scans were acquired in two-dimensional mode (three-dimensional mode was not used because the randoms and deadtime would be too high) for 120 minutes, consisting of 33 frames with durations ranging from 30 seconds to 5 minutes. Scatter correction was performed with the method of Bergstrom et al. (1983).
To estimate the level of nonspecific binding, we performed preblocking studies in which 400 nmol/kg unlabeled MDL 100,907 was administered as an intravenous bolus 5 minutes before the tracer injection. To assess whether receptor occupancy by the injected MDL 100,907 in the control studies was detectable, in one monkey we performed two PET scans with a large difference in injected mass at the same radioactivity dose. In the first scan, approximately 3 mCi [11C]MDL 100,907 (0.225 nmol/kg) was administered and a 120-minute dynamic scan was performed in three-dimensional mode. For the second scan, approximately 3 hours later, unlabeled MDL 100,907 was added to approximately 3 mCi of [11C]MDL 100,907 to produce a total mass dose of approximately 3 nmol/kg, comparable to that of the 12 control scans.
Input function
Arterial blood samples were taken from a permanently implanted arterial access port. Each sample was centrifuged for 1 minute, and a 0.1-mL aliquot of plasma was counted in a calibrated gamma counter. Ten samples (3, 5, 8, 12, 20, 30, 40, 50, 60, and 90 minutes) were used for metabolite determination by ethyl acetate extraction. In addition, as a reference sample, we collected one blood sample before tracer injection to which [11C]MDL 100,907 was added. For each sample, a 0.15-mL aliquot of plasma was added to 0.45 mL borate buffer (pH 9), followed by 0.6 mL ethyl acetate. The mixture was centrifuged, and samples of the organic and aqueous phases were counted. To determine whether the radioactivity in the organic phase was only parent compound, HPLC analysis of the ethyl acetate phase of samples taken at 0, 5, 12, 20, and 30 minutes was performed (later samples were not analyzed by HPLC because of insufficient counting statistics). A Waters Symmetry C-18 column (3.9 × 150 mm) (Waters) was used with solvent 37% acetonitrile and 63% 10 mmol/L TEA-NaH2PO4 buffer. HPLC fractions were collected for 30 minutes (1 sample per minute), and each sample was counted in the calibrated gamma counter. The average recovery of counts from the HPLC samples was 92.6% ± 4.1 %. HPLC results showed that only the parent compound was extracted by ethyl acetate; in other words, there are no lipophilic metabolites of [11C]MDL 100,907. Therefore, the fraction of counts in the ethyl acetate phase can be used to determine the parent fraction. The reference sample was also used to measure the fraction of radioactivity unbound to plasma proteins (free fraction) by ultrafiltration.
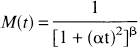
The unmetabolized fraction, M(t), of the arterial input function was determined from the ratio of organic phase to total plasma counts, after correction for the extraction efficiency based on the reference sample (mean extraction efficiency 86.5% ± 1.3%). The following empirical equation was used to describe M(t):
Data analysis
Irregular regions of interest (ROIs) were drawn on images summed from portions of the dynamic scans (0 to 5 and 40 to 60 minutes). The regions were frontal, cingulate, occipital, parietal, and temporal cortex, basal ganglia, thalamus, and cerebellum. In addition, a region that encompassed the whole brain was defined on 14 or 15 slices by automatic edge detection. TACs were generated for each region.
Preblocking study analysis. First, the data from the preblocking studies were analyzed to determine the appropriate model for free and nonspecific binding, under the assumption that all the specific 5-HT2A binding sites were occupied by the injection of cold MDL 100,907. Models with one- and two-tissue compartments were used to analyze these TACs. The two T compartments for the preblocking study presumably reflect free and nonspecific binding. Nonlinear fitting was performed to estimate the kinetic parameters K1 (mL/min/mL), k2, k5, and k6 (min−1) for the 2T compartment model (Fig. 1), and the total volume of distribution V (mL/mL) was calculated as (K1/k2)(1 + k5/k6). For the 1T compartment model, the influx and efflux rate constants, K1 and k¶ime;2, were estimated.
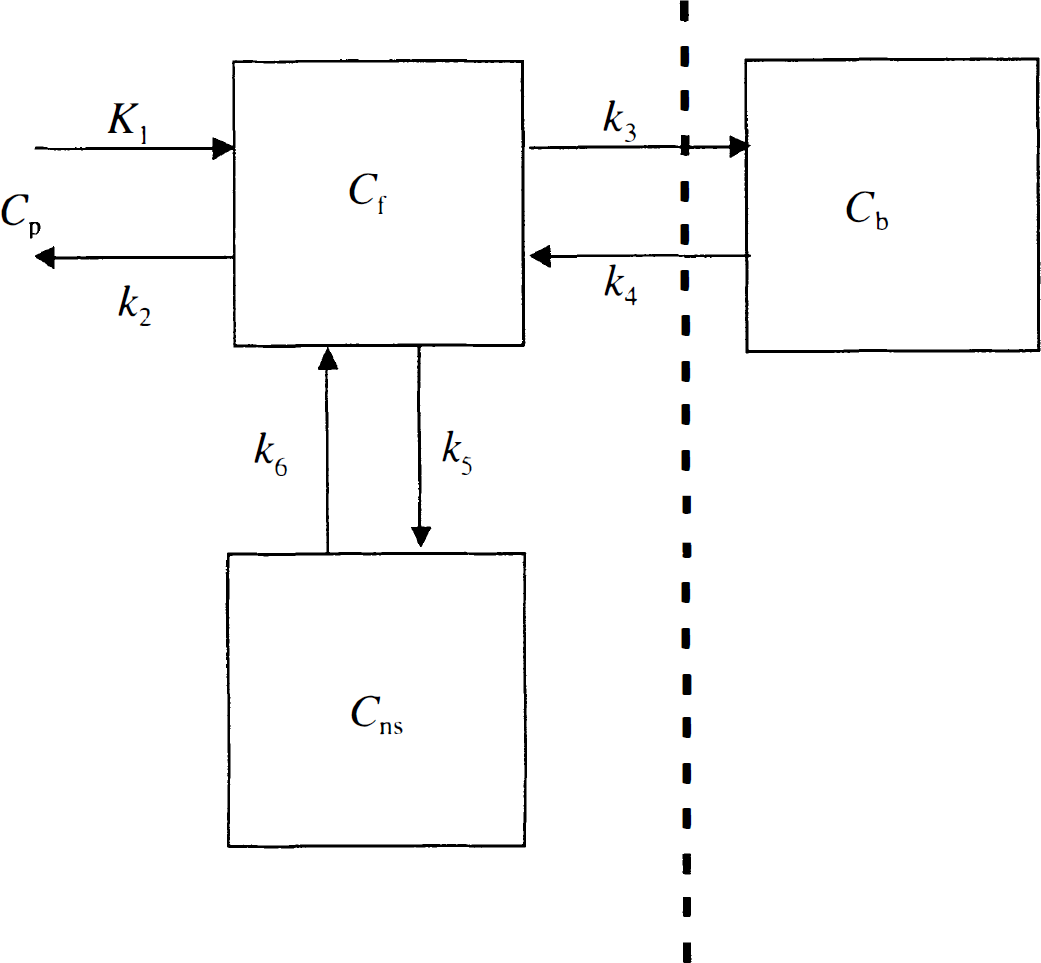
Three-tissue compartment model for [11C]MDL 100,907. Cp, radioactivity concentration in plasma; Cf, tissue free ligand; Cb, specifically bound tracer; Cns, nonspecifically binding ligand. The portion of the model to the left of the dashed line was used for analysis of the preblocking studies.
Control study analysis. Because two T compartments were necessary to describe the preblocking data, to include specific binding, a model with three tissue compartments (3T) was used for the control studies (see Fig. 1). The three T compartments have six rate constants, with k3 and k4 representing the rates of association and dissociation from the receptor, respectively. However, it is not possible to estimate simultaneously the six parameters from control TACs. Therefore, to apply the 3T model, the data of the preblocking studies were first analyzed with a 2T model. Using the whole-brain curve of the preblocking study, four parameters (K1, k2, k5, and k6) were estimated. To improve the stability of subsequent fits, the ratio k5/k6 from the whole-brain fit was fixed for all regions under the assumption that the fraction of nonspecifically bound tracer was constant throughout the brain. Three parameters, K1, Ve (K1/k2), and k5, were then estimated for all regions in the preblocking study with fixed k5/k6. Next, using data from the control study, K1,k3, and k4 were estimated for all regions with fixed regional values of Ve, k5, and k6. V was calculated as Ve(1 + k3/k4 + k5/k6), and the binding potential (BP) was calculated as k3/k4.
In all cases, a correction for the time delay Δt between the plasma input curve and the brain was performed using the whole-brain TAC. A 1T model including Δt was applied to these data for 0 to 30 minutes. This estimated Δt value was used for all regions. In performing least-squares fitting, the data were weighted according to the noise-equivalent counts (NEC) (Strother et al., 1990) for each frame, and the model accounted for the averaging of counts over each frame duration. To eliminate the contribution from intravascular radioactivity, the first two frames (1 minute of data) were discarded during the fitting process.
Preblocking occupancy simulation. Based on the preblocking data, we proposed the 3T model for the control [11C]MDL 100,907 data. This approach is appropriate if the 5-HT2A receptors were completely occupied by the cold MDL 100,907. If receptor blockade was not complete, it might be incorrect to assume that a 2T model is necessary to describe free and nonspecific binding. To verify that the specific binding sites were in fact completely blocked for the entire study, a simulation was performed. From the input functions of the control studies scaled by injected dose (n = 12), an input function (nmol/g/min) for cold MDL 100,907 was generated for a bolus injection of 400 nmol/kg (assuming a mean body weight of 8.7 kg). From this input function, Cb, the concentration of bound MDL 100,907 was computed based on the 3T model (see Fig. 1) and the following differential equations:
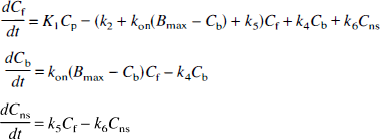
[11C]MDL 100,907 parameter values for frontal cortex were used in the simulation. Bmax values of 13, 33, and 83 pmol/g for human frontal cortex (Laruelle et al., 1993), rat prefrontal cortex (Leysen et al., 1982), and monkey insular cortex (Lopez-Gimenez et al., 1998), respectively, were used. The parameter kon was calculated as k3/Bmax. A fourth-order Runge-Kutta algorithm was used to solve the above differential equations.
Simplified methods
The 3T model requires several parameter values obtained from the preblocking data and is thus not a practical method for routine use. Therefore, we tested the following simplified approaches (Koeppe et al., 1991) to define the best method for [11C]MDL 100,907:
1T model: Estimated parameters were K1 and k¶ime;2.
2T model: Estimated parameters were K1, k′2, k′3, and k4
Two-tissue compartment model with fixed Ve (2T′): For all regions, K1/k′2 was fixed to the value obtained from the 2T fit of the cerebellum TAC.
Logan graphical analysis (Logan et al., 1990).
Logan analysis requires the definition of the linear portion of the curve obtained after data transformation. This time can differ for each region and for each subject. To choose this time period automatically for each region, linear least-squares fitting was performed to estimate the slope V using data from t0 to 120 minutes, where the starting time t0 was varied. The optimal t0 was chosen as the one where the linear fit produced the minimum coefficient of variation—that is, σv/V, where σv is the standard error of V. In comparing the simplified methods, V values were computed and compared with the 3T V values.
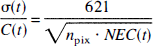
Simulation of simplified methods. To evaluate the simplified methods, computer simulations were performed by simulating TACs with the 3T model. A standard metabolite-corrected input function was obtained from the control studies (n = 12). TACs of frontal cortex (high binding region), basal ganglia (medium binding region), and cerebellum (low binding region) were computed using the standard input function and averaged kinetic parameters of K1 to k6 from the 3T control fits. The statistical noise at time t (σ(t)) was estimated from the mean NEC and the mean pixel count (npix) in each ROI from the following relation (Watabe et al., 2000):
RESULTS
Input function
The parent compound was rapidly metabolized, with unmetabolized fractions of 67% ± 10%, 20% ± 5%, and 11% ± 3% at 5, 30, and 60 minutes, respectively. Peripheral metabolism was faster than that reported for humans by Ito et al. (1998) (40% unmetabolized at 50 minutes), similar to other tracers. Figure 2 shows an example of the unmetabolized fraction of [11C]MDL 100,907 with the fitted curve from Eq. 1. The parameters α and β in Eq. 1 were estimated as 0.408 ± 0.023 and 0.262 ± 0.075 (n = 16), respectively. The plasma free fraction was 34.0% ± 3.7% (n = 16).
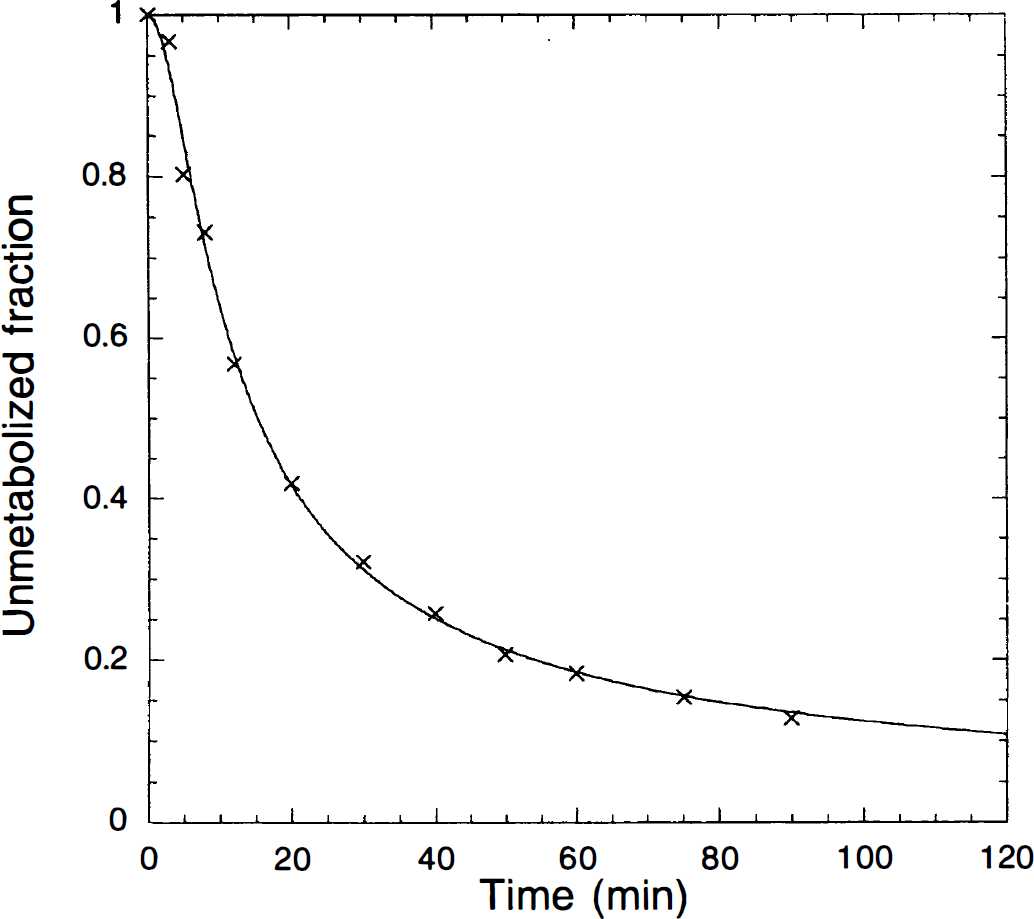
Example of the unmetabolized fraction of [11C]MDL 100,907. The symbols (x) are the observed data and the solid line is the fitted curve (Eq. 1).
PET studies
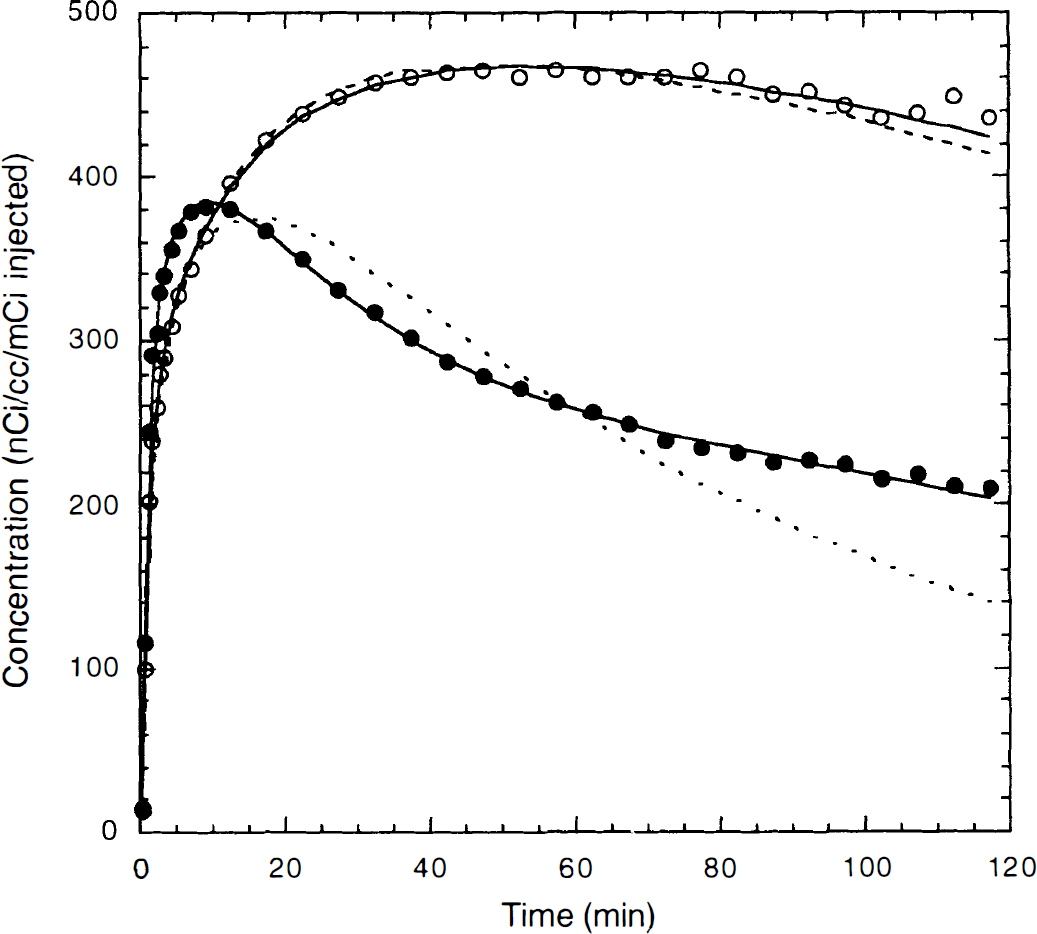
Preblocking studies. After 400 nmol/kg MDL 100,907 was administered, there was a minor drop in heart rate and blood pressure; these parameters returned to baseline within approximately 20 minutes. Figure 3 shows an example of TACs for frontal cortex and cerebellum with fitted curves for the preblocking study. The cold dose of MDL 100,907 blocked specific binding, as can be seen by comparing the preblocking data with the control TACs (Fig. 4). For all regions, the 1T model was not sufficient to describe the TACs (see Fig. 3). The F statistic showed that the 2T model produced a statistically better fit than the 1T model in all cases (P < 0.001).
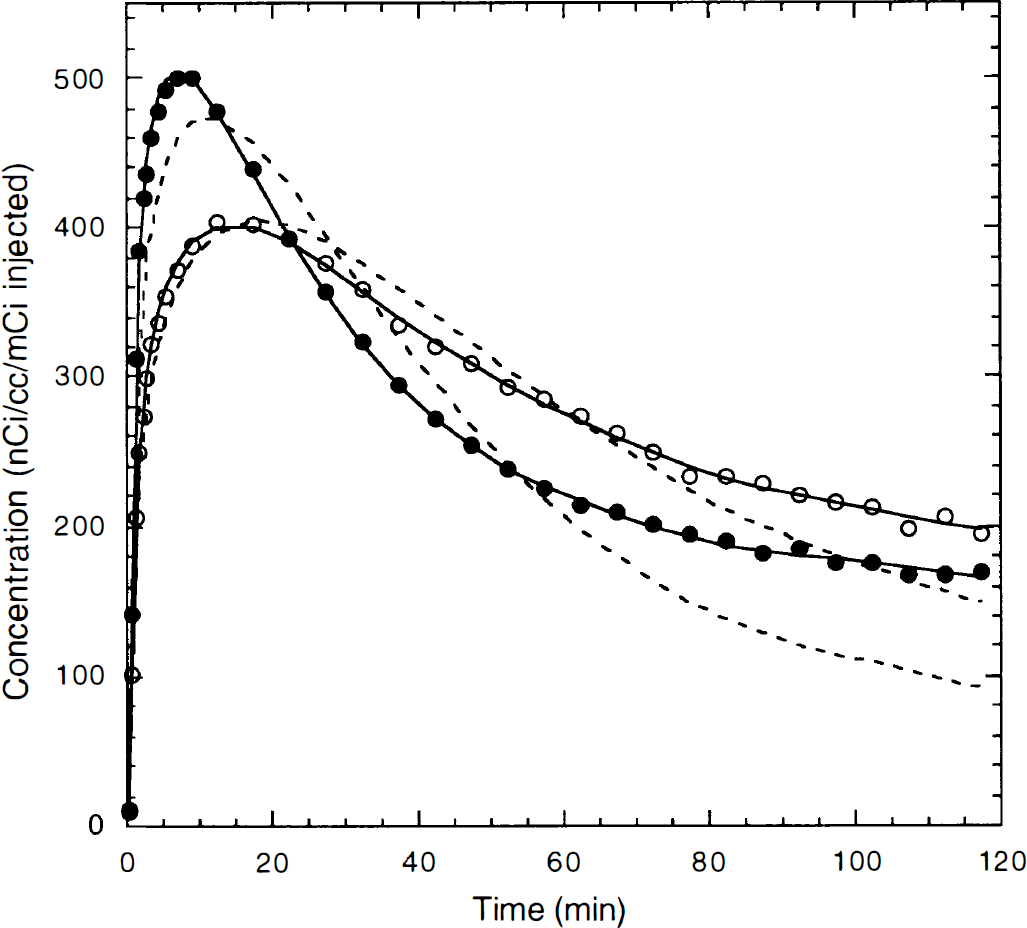
Typical example of fitting results for the one- and two-tissue compartment models for a preblocking study. The symbols represent the observed radioactivity concentration values in frontal cortex (○) and cerebellum (●). The solid line is the fitted curve by the two-tissue compartment model; the dashed line is the fitted curve by the one-tissue compartment model.
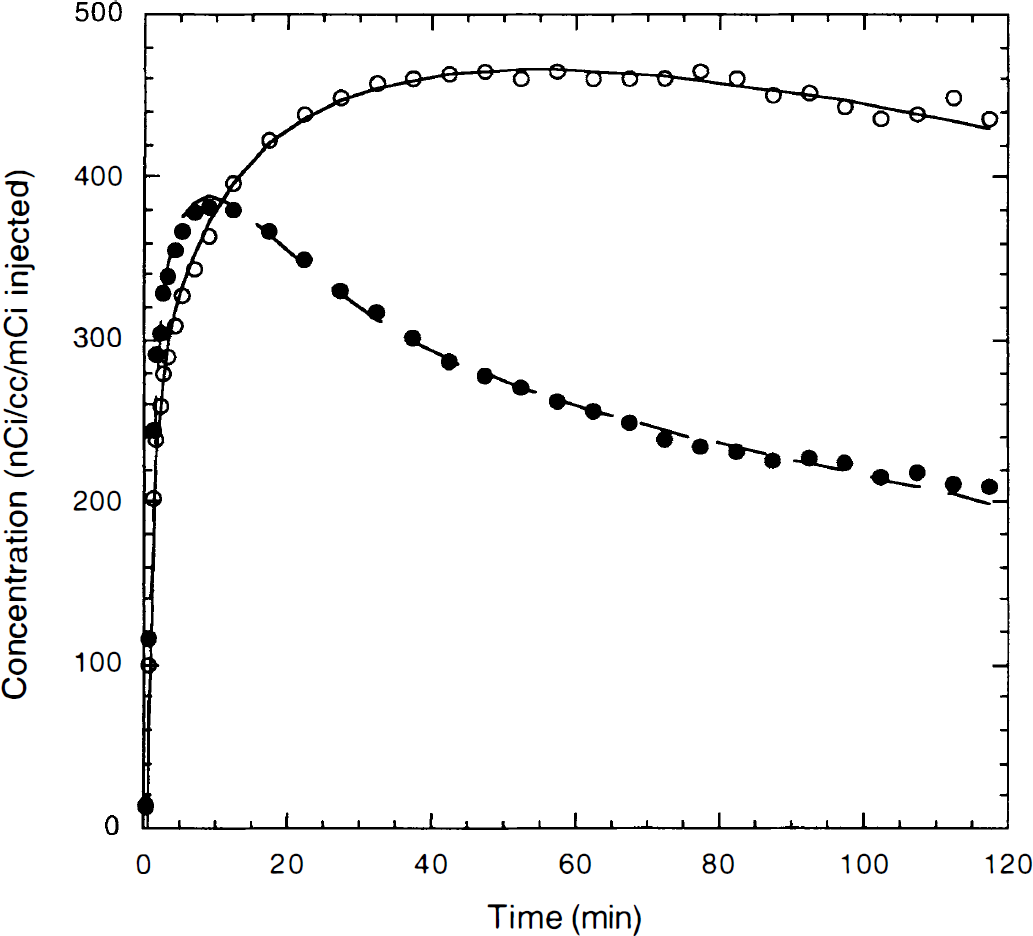
One example of time–activity curves from frontal cortex (○) and cerebellum (●) from a control study with fitted curves by the three-tissue compartment model.
Regional parameters K1, Ve, and k5 from the preblocking study with fixed k5/k6 are shown in Table 1. The ratio k5/k6 used in each fit was determined from a fit of the whole-brain TAC of that monkey. The group k5/k6 values were 1.10 ± 0.20 (n = 4). K1 values were high, with large interanimal standard deviations. There was also substantial variability in k5, even with a fixed value for the k5/k6 ratio. V ranged from 20 to 28 mL/mL, with much smaller interanimal variability. There were no regional differences in the parameters K1, k5, or V, but a significant regional variation was detected in Ve (P < 0.001, analysis of variance).
Parameter estimates from the preblocking study (n = 4)
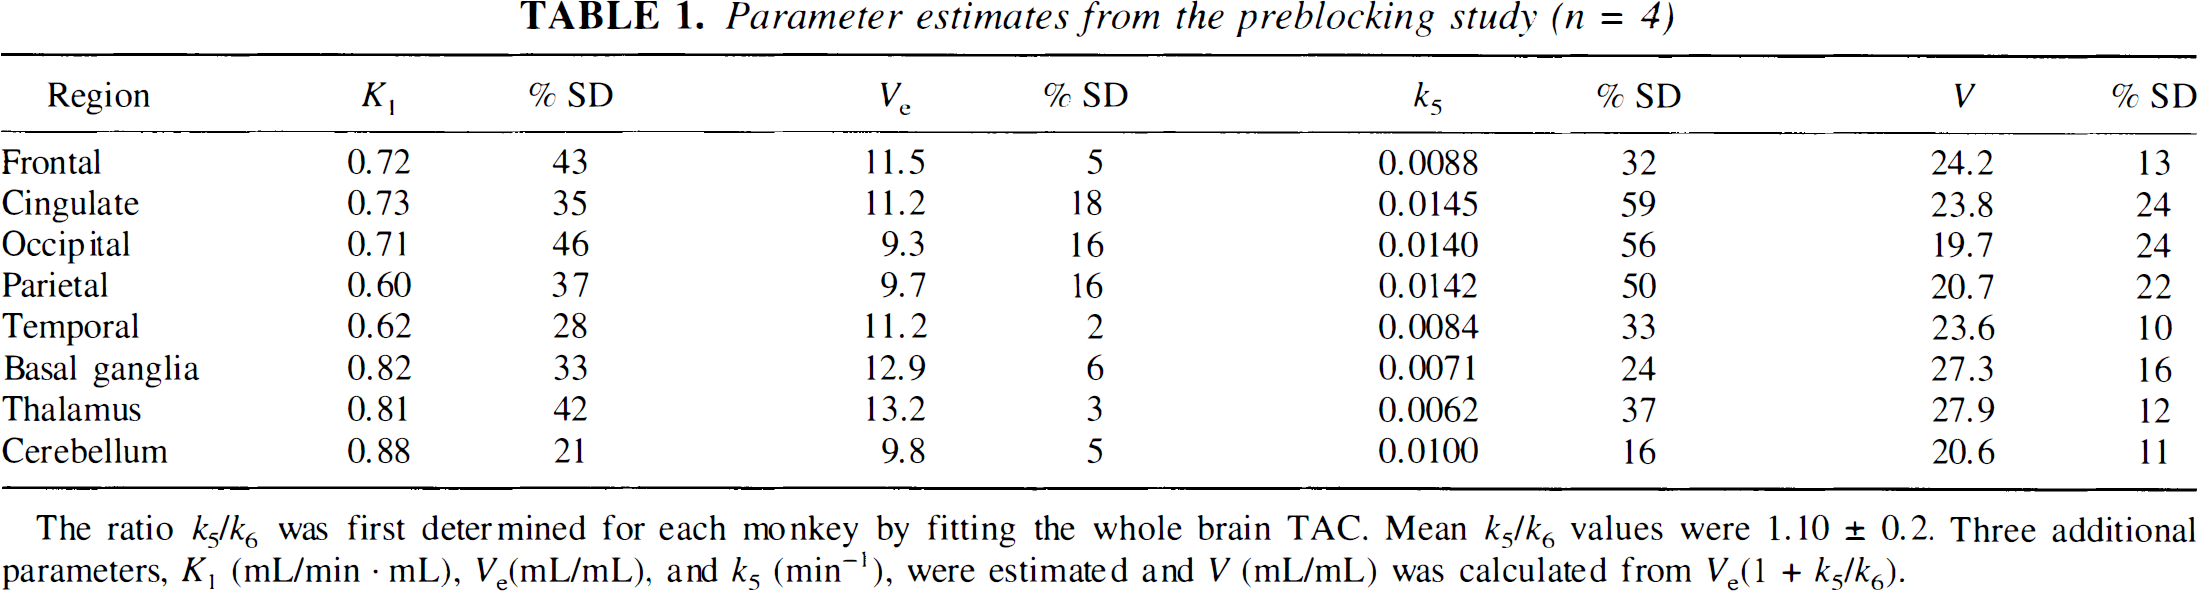
The ratio k5/k6 was first determined for each monkey by fitting the whole brain TAC. Mean k5/k6 values were 1.10 ± 0.2. Three additional parameters, K1 (mL/min · mL), Ve(mL/mL), and k5 (min−1), were estimated and V (mL/mL) was calculated from Ve(1 + k5/k6).
Control studies and the 3T model. By using regional mean Ve and k5 values and the global k5/k6 ratio from the four preblocking studies, the 12 control studies were analyzed with the 3T model. Figure 4 shows one example of TACs from frontal cortex and cerebellum with the fitted curves. Table 2 shows the estimated parameters from the 3T model (n = 12). The highest values for the total volume of distribution (V) were observed in frontal cortex, with intermediate values in basal ganglia and the lowest values in cerebellum. In all regions including the cerebellum, the control V values were significantly greater than the preblocking values (one-tailed t-test, P < 0.01), which suggests the presence of specific binding in the cerebellum. As expected, binding potential (BP) values had a similar pattern to the V values, but with a larger percentage variability because the average nonspecific binding level determined from the preblocking studies was subtracted. This regional pattern with a rank order of frontal cortex > basal ganglia > cerebellum agrees with the in vitro distribution of the receptors in rat and human brain (Pazos et al., 1985, 1987).
Parameter estimates from the 3T model for control studies (n = 12)
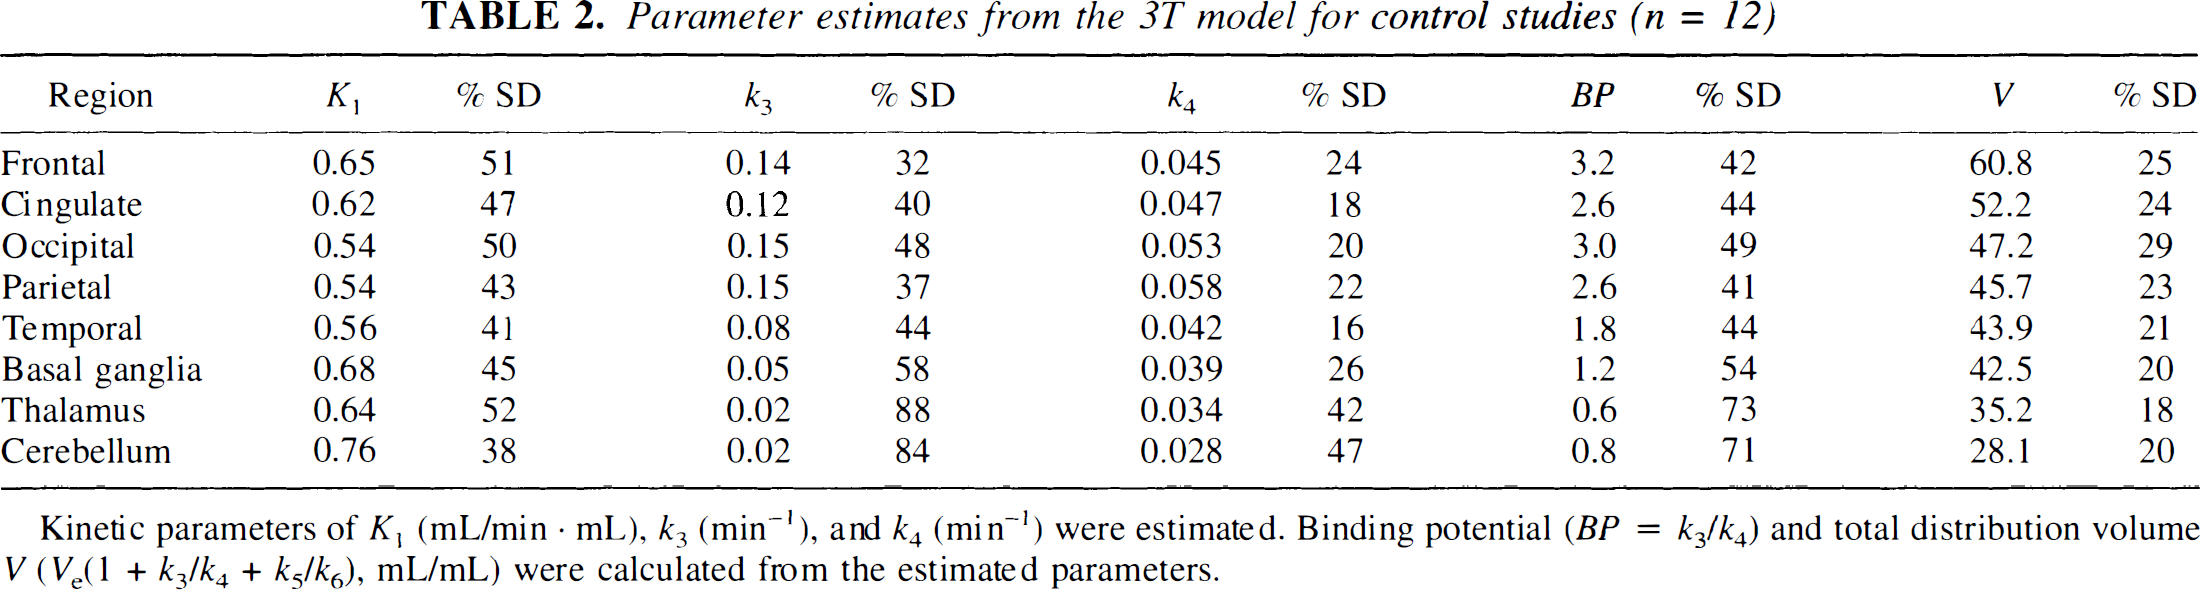
Kinetic parameters of K1 (mL/min · mL), k3 (min−1), and k4 (min−1) were estimated. Binding potential (BP = k3/k4) and total distribution volume V (Ve(1 + k3/k4 + k5/k6), mL/mL) were calculated from the estimated parameters.
The volume of distribution V is expected to be linearly proportional to the plasma free fraction, fp (Carson et al., 1998). When V values were normalized by fp (i.e., V/fp), the percentage standard deviation of all regional values was reduced by approximately 20%.
As shown in Tables 1 and 2, K1 values were large in all regions, which indicates that extraction is high and that tracer delivery is limited by blood flow. There was also a strong correlation between K1 values of [11C]MDL 100,907 and CBF values measured with [15O]water (K1 = 1.35 CBF − 0.08, r = 0.93, n = 96, 12 control studies × 8 ROIs). The scale factor of 1.35 may reflect methodologic differences in input function measurement and time delay correction.
In the fitting procedure, the time delay, Δt, between the arterial input function and the brain TACs was included. If the time delay correction was not applied, the fit quality was significantly worse, as measured by the Akaike Information Criterion (Akaike, 1976) (paired t-test, P < 0.001). As shown in Tables 1 and 2, [11C]MDL 100,907 has high K1 values, and thus the correction for time delay is important.
Test–retest reliability. Three animals were scanned twice in the same day under control conditions. V values in all regions decreased in the second scan from 3% to 24% in two of the three animals. In one animal, the V values in all regions increased from 20% to 40%. The regions with high specific binding such as frontal cortex had larger percentage changes in V than regions with low specific binding, such as the cerebellum. Changes in K1 between successive scans were also variable but showed no consistent pattern. Part of the variability in V values is caused by uncertainty in the measurement of the input function. This effect is reduced by calculating the ratio of regional V values to that in cerebellum, in which case the test–retest reliability was improved. For example, for frontal cortex, the mean absolute test–retest percentage differences in V and the V ratio were 27% and 17%, respectively. Another possible explanation for the variability is the mass of injected MDL 100,907. In all three cases, the scan with the lower injected mass had the higher V values, suggesting that the injected mass in the control studies had an effect on the specific binding.
Preblocking occupancy simulation. To assess the completeness of receptor blockade in the preblocking study, a simulation was performed. For the simulated Bmax values of 13 and 33 pmol/g, more than 99% of the binding sites were occupied 1.5 to 2.0 minutes after injection of cold MDL 100,907. At 120 minutes, the occupancy remained at greater than 97%. For a Bmax value of 83 pmol/g, the occupancy peaked at 99% at 7 minutes (2 minutes after tracer injection), with occupancy decreasing to 92% by 120 minutes. These simulation results support the assumption that the preblocking data represent only free and nonspecifically bound tracer in the brain.
Simpler methods
To develop a fitting procedure appropriate for human data, where preblocking values are not available, the 1T, 2T, and 2T′ models were tested. As shown in Fig. 5, the 1T model (dashed line) could be used to represent TACs for receptor-rich regions such as the frontal cortex. It was not, however, a suitable model to represent the TACs in receptor-poor regions such as the cerebellum. In these regions, the 2T model produced adequate fits. However, in high V areas such as the frontal and occipital cortex, the 2T model did not reach convergence or obtained values of k3 and k4 with large standard errors. For example, of the fits that did converge, the mean percentage standard error of k3 for the frontal cortex was 21% for the 2T model versus 8% for the 2T′ model. It appears that the combination of kinetic parameters for this tracer produces unreliable estimates of the parameters of the 2T model in regions with high specific binding.
Table 3 shows the estimated kinetic parameters from the 2T′ model for the control studies. This model was able to fit TACs from all regions quite well. In the 2T′ model, k3 and k4 were estimated with standard errors of 5% to 10%. K1 values estimated by the 2T′ model and 3T model were strongly correlated, with the 2T′ values being slightly smaller than the 3T values (K1 (2T′) = 0.930 K1(3T) + 0.0278, r = 0.995). The k3 and k4 values from the two models were less strongly correlated (r = 0.827 and 0.825, respectively), as were the BP values (r = 0.794). However, the V values were highly correlated (V (2T′) = 1.00 V(3T) − 4.58, r = 0.973).
Parameter estimates from the 2T′ model for control studies (n = 12)
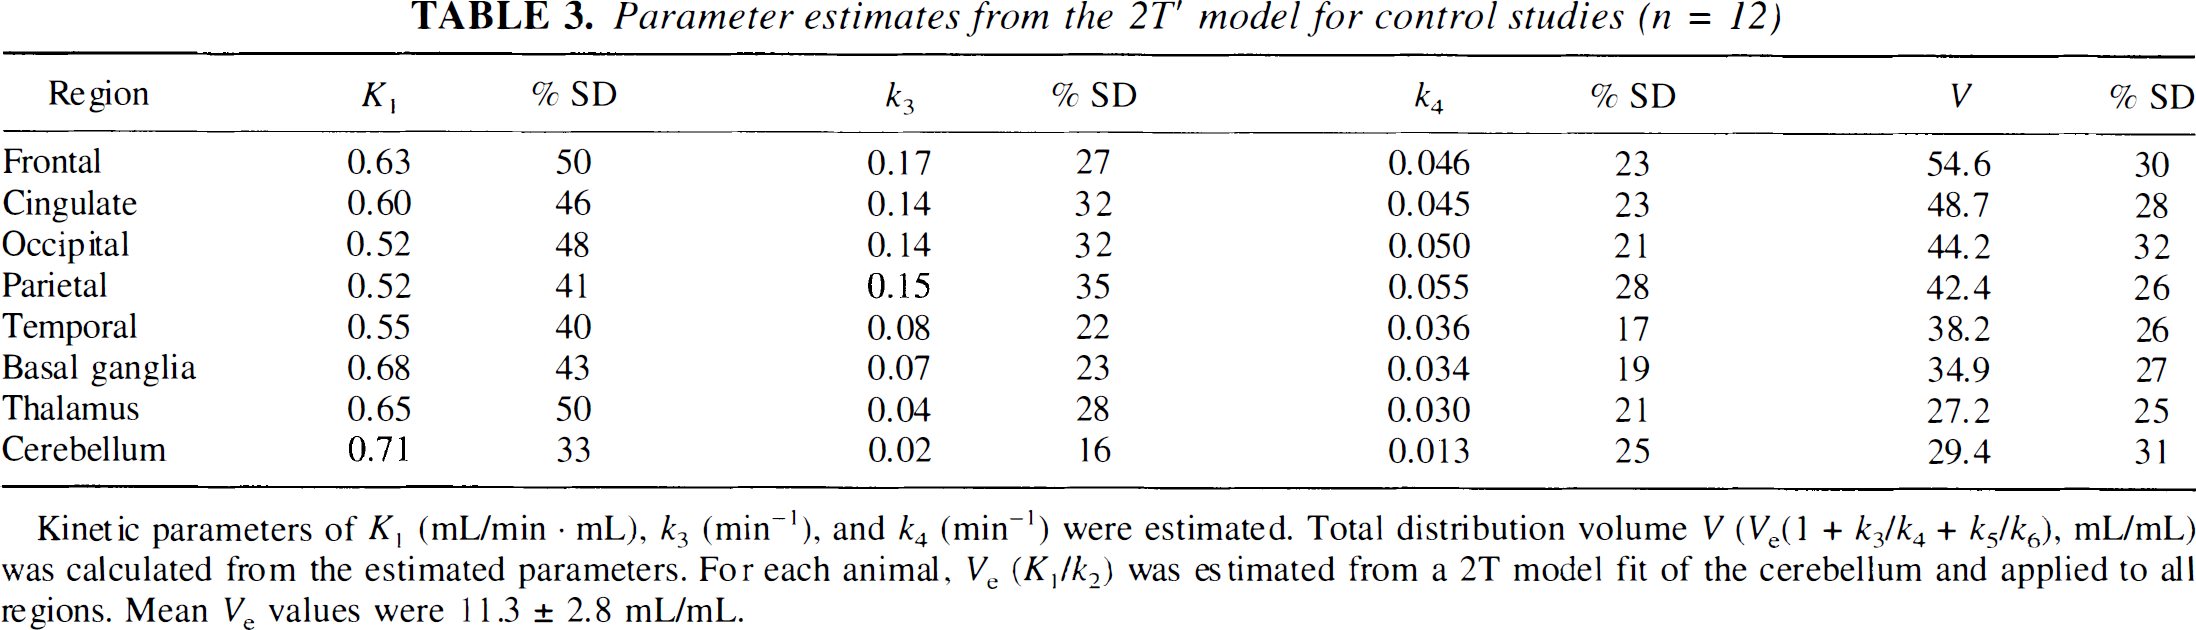
Kinetic parameters of K1 (mL/min · mL), k3 (min−1), and k4 (min−1) were estimated. Total distribution volume V (Ve(1 + k3/k4 + k5/k6), mL/mL) was calculated from the estimated parameters. For each animal, Ve (K1/k2) was estimated from a 2T model fit of the cerebellum and applied to all regions. Mean Ve values were 11.3 ± 2.8 mL/mL.
The 3T model produced less variance in mean k4 values across regions than the 2T′ model (see Tables 2 and 3), i.e., 29% coefficient of variation for 3T and 40% for 2T′. If k4 is the receptor dissociation rate and the ligand binds to a single receptor, there should be a small variance in k4 across regions. This reduction in interregional variation in k4 therefore suggests that the 3T model may in fact be more physiologically appropriate than the 2T′ model.
Table 4 shows the V values estimated by all methods. V values from the 1T model were smaller than values from the 3T model in all regions (P < 0.001). Logan values were similar to the 3T values, but with higher variability. The times t0 for beginning the Logan linear fitting that were chosen by the automatic algorithm were 32 ± 25, 30 ± 9, and 59 ± 9 minutes for frontal cortex, basal ganglia, and cerebellum, respectively. This variability in t0 between regions is not unexpected, given that the Logan method was derived from the 1T model, i.e., if the data are consistent with a 1T model, the Logan curve should be linear from t0 = 0. The large t0 value for cerebellum indicates the cerebellum curve consists of multiple compartments, consistent with the poor fit to the 1T model (see Fig. 5). The t0 value for frontal cortex was lower than that in the cerebellum, consistent with its behavior as close to the 1T model. There was large variability in the t0 values for frontal cortex, but this did not have a major effect on the V values. If t0 was fixed to the mean value of 32 minutes for frontal cortex, the resulting V value was 57.9 ± 18.0 mL/mL, compared with the original value of 58.5 ± 19.5 mL/mL.
Fitting results for a control study in the frontal cortex (○) and cerebellum (●) with the one-tissue compartment model (dashed line) and the two-tissue compartment model with fixed Ve (2T′; solid line).
Comparison of control V values between methods
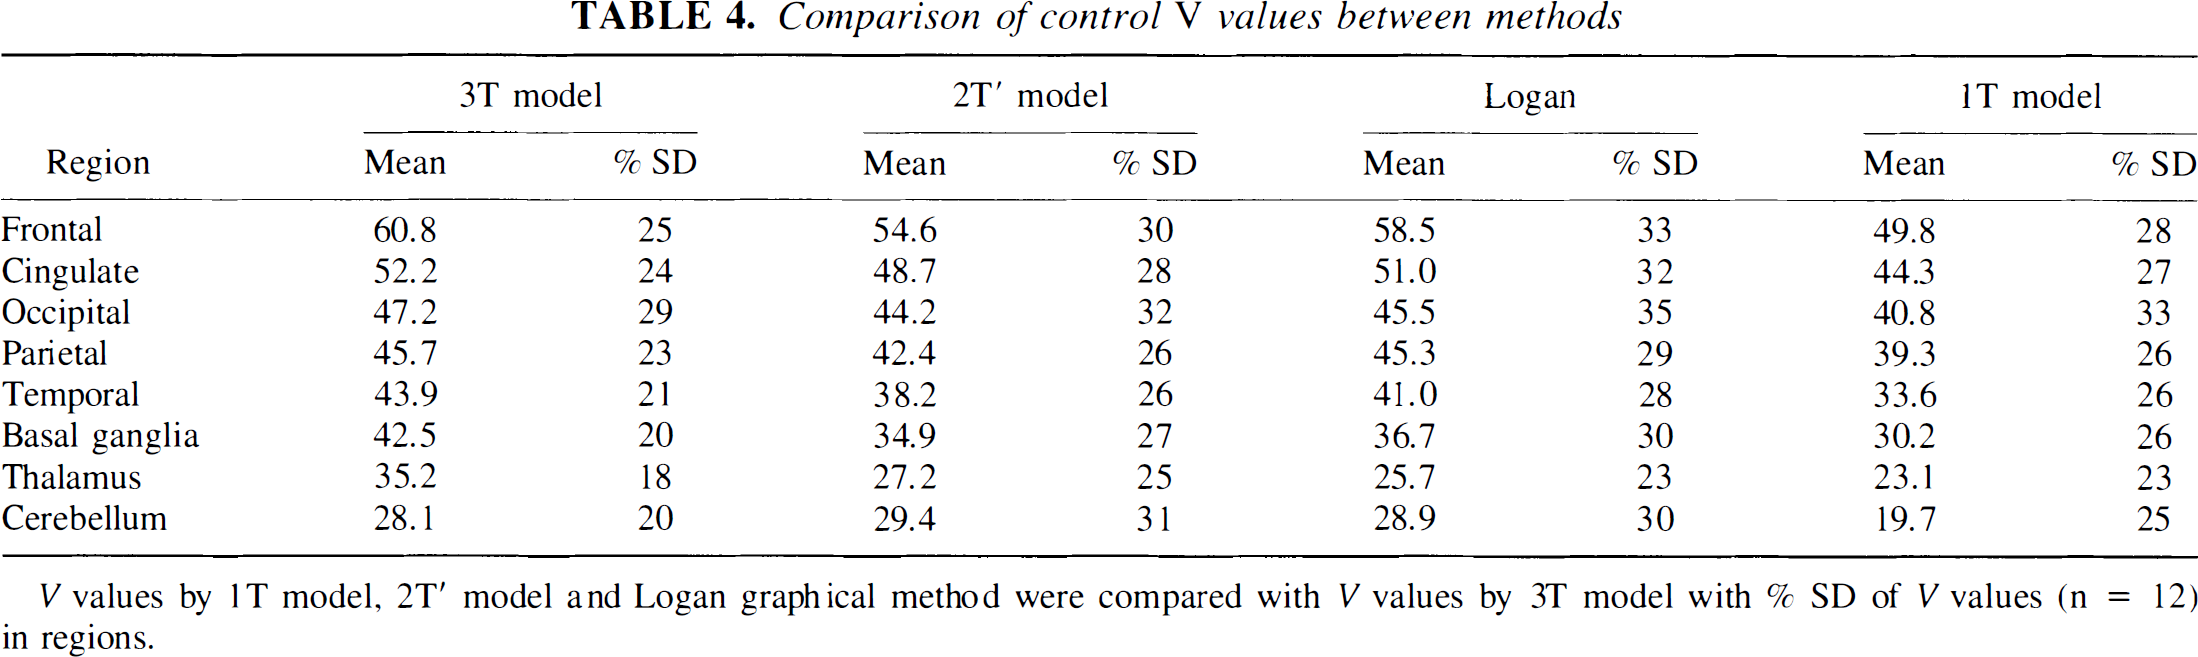
V values by 1T model, 2T′ model and Logan graphical method were compared with V values by 3T model with % SD of V values (n = 12) in regions.
Simulation of simplified methods. Table 5 shows the results of the simulation of the 3T model with estimation of V by three methods with different noise levels. Logan analysis and the 2T′ model underestimated V compared with the 3T model, similar to the results observed in the actual PET data (see Table 4). However, there were several differences between the simulation and the observed data (see Tables 4 and 5). For example, the statistical uncertainty of the 2T′ estimate was somewhat smaller than with the Logan method in Table 4, but the reverse was true for the simulation. The absolute variability level in the simulation was much lower than the real data because the simulation used averaged kinetic parameters. With the higher noise level, the 3T and 2T′ data did not demonstrate any change in V estimates, and the variability increased in the expected manner. However, in the higher-noise case, the Logan values became more biased and the variability did not increase as much as expected. This effect was partly caused by the automatic method for choosing t0, although increased bias in the Logan estimates persisted even with fixed t0 in the higher-noise case. Bias in Logan slopes has been previously demonstrated (Carson, 1993; Slifstein and Laruelle, 1999) and is produced in part by violating the assumptions of the linear least-squares fit, i.e., the independent variables are not noise-free and the noise in each data value is not independent.
DISCUSSION
In this study, we examined several models for analysis of [11C]MDL 100,907 PET data. Based on the preblocking data, a model with two tissue compartments is necessary to describe free and nonspecifically bound tracer. Therefore, we used the 3T model for the control studies where specific binding was present. Although the 3T model may be the most physiologically appropriate model to describe the kinetics of [11C]MDL 100,907, the method is not practical for application to routine human studies because of the need for preblocking data. For those purposes, simpler methods—the 2T′ model (fixed Ve) or the Logan graphical method—are viable alternatives to estimate the volume of distribution, V.
Simulation results
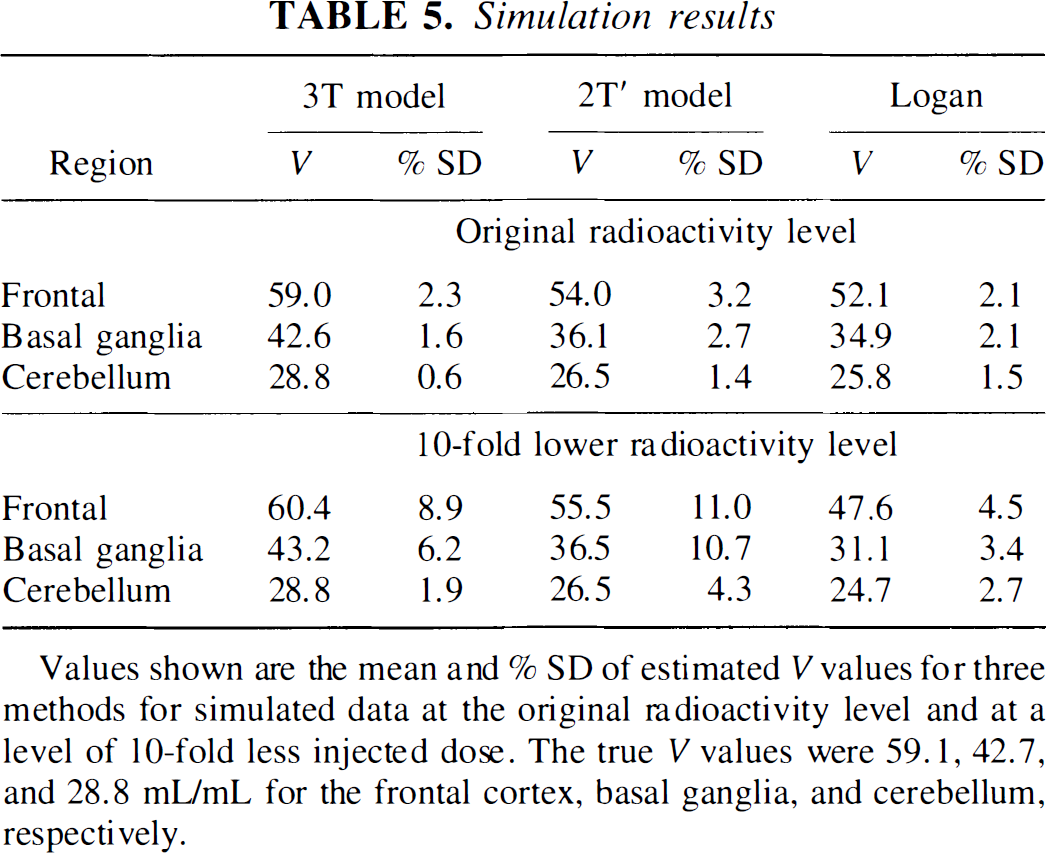
Values shown are the mean and % SD of estimated V values for three methods for simulated data at the original radioactivity level and at a level of 10-fold less injected dose. The true V values were 59.1, 42.7, and 28.8 mL/mL for the frontal cortex, basal ganglia, and cerebellum, respectively.
Serotonin tracers
Several radiotracers have been used to assess 5-HT2A receptors, with the quantification method varying by ligand. Biver et al. (1994) analyzed [18F]altanserin human data using a 3T model. First, K1, k2, k3, and k6 were estimated in the cerebellum, and parameters of other regions were estimated with fixed values of k2, k5, and k6. Human [18F]altanserin data were also analyzed by Logan graphical analysis (Sadzot et al., 1995) applied to preblocking and control studies. Assuming that there was only nonspecific binding in the cerebellum, BP was computed from the Logan slopes of the receptor-rich region and the cerebellum. However, in the preblocking study, the Logan plot was not linear for the cerebellum before 15 minutes after injection, indicating that a 2T model was necessary for the cerebellum, similar to our results. Interpretation of [18F]altanserin data, however, is affected by the presence of radiolabeled metabolites in the brain (Lopresti et al., 1998; Tan et al., 1999).
[123I]R93274 is a highly selective 5-HT2A receptor ligand for single photon emission computed tomography. Baboon data were analyzed with a 2T model (Abi-Dargham et al., 1997), and it was again found that this model provided a significantly better fit for the cerebellum than the 1T model. Other ligands for the serotonin 5-HT2A receptor include [18F]setoperone (Blin et al., 1988, 1990; Kapur et al., 1997) and [11C]NMSP (Wong et al., 1984), although both of these tracers have significant affinity for the D2 receptor as well.
Model compartments and nonspecific binding
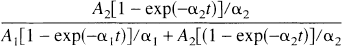
With both the 3T and 2T′ models, reliable fits of control data could be obtained only if no more than three parameters were allowed to vary. The four parameters of the 2T model could not be reliably estimated in control studies, particularly in the regions with highest receptor binding because of numerical identifiability problems. This effect has been found with several receptor-binding ligands and is caused by the combination of kinetic parameter values, i.e., one of the two exponentials in the model equations is the dominant term. The impulse response fraction (Carson et al., 1998) can be used to predict the reliability of kinetic parameter estimation for the 2T model:
Thus, successful modeling of a TAC by a 1T model is by no means demonstration of the lack of specific binding. Further, the need for two compartments to describe a TAC is not proof of specific binding, as demonstrated by our preblocking data. This interpretation differs from that of Ito et al. (1998), who suggested that there was specific binding in the cerebellum based on the need for a 2T model. We interpreted the two compartments in the preblocking data as corresponding to free and nonspecifically bound tracer. However, we have no validation data to show that the preblocking fit succeeded in accurately separating the total binding into those two components. If this separation is incorrect (i.e., Ve is inaccurate), then the estimates of k3 and BP will be affected. It is also possible that the second tissue compartment corresponds to low-affinity binding to a high-density receptor distributed uniformly in the gray matter. Other factors such as tissue heterogeneity may contribute to the need for a 2T model in a region with no specific binding.
In performing the analysis, the early data points were excluded so that intravascular radioactivity could be ignored in the model. This approach is appropriate only if tissue radioactivity concentrations are high in comparison to whole blood activity (including metabolites). This is the case for [11C]MDL 100,907. In the preblocking studies, V, the equilibrium ratio of tissue to metabolite-corrected plasma, was approximately 20 mL/mL. At late times, the parent compound represents approximately 10% of plasma radioactivity, so assuming a blood volume of approximately 4% (0.04 mL/mL), intravascular radioactivity can contribute no more than 0.4 mL/mL to the measured V values (i.e., ~2%). This component will be smaller in the control studies.
Comparison with human results
The estimated parameters K1 and k2 from the 3T model were similar to the parameters obtained in humans (Ito et al., 1998) with the 2T′ model. The range of k3 and k4 values was also similar in the human data (k3: 0.03 − 0.33 min−1; k4: 0.01 − 0.06 min−1) compared with the monkey data (k3: 0.01 − 0.33 min−1; k4: 0.02 − 0.08 min−1). V values obtained in the control data were 40% to 60% smaller in cortical regions than those obtained in human data (Ito et al., 1998); however, the mean V values in cerebellum were similar (human 31, monkey 28 mL/mL). Possible contributing factors to the differences between human and monkey include species differences, specific activity, and the partial volume effect. In addition, anesthesia may also affect receptor binding by altering the environment of the membranes in which the receptors reside (Kobayashi et al., 1995).
Specific binding in the cerebellum
By comparing the results of the preblocking and control studies, we found that there was specific binding in the cerebellum, consistent with in vitro findings (Pazos et al., 1985, 1987). In this study, ROIs were placed directly on the PET images, and errors in ROI placement could produce biases in the TACs, particularly in the cerebellum, which had the lowest uptake. To verify that the specific binding in the cerebellum was not an artifact of ROI placement, we used magnetic resonance (MR) images (coronal images of 192 × 192 × 80 pixels; pixel size 0.4 × 0.4 × 1 mm) to verify region placement. MR-to-PET registration was carried out by the method of Woods et al. (1993) using PET images summed from 0 to 60 minutes after injection. This analysis was applied to control and preblocking studies in three animals. There was a change of only 2% ± 5% in the cerebellum V values (using the 3T model for the control studies and 2T model for the preblocking studies) between manually drawn and MR-registered ROIs. Thus, the specific binding of the cerebellum was not an artifact of ROI placement.
Use of a reference region for receptor analysis (Lammertsma and Hume, 1996) is highly desirable because it avoids the complexity of arterial sampling and metabolite determination. Such a method is valid if the reference region has little or no specific binding and if the results agree with estimates obtained using the arterial input function. In many cases, the cerebellum has been used as a reference region. Because we found specific binding in the cerebellum, it appears that this region is not suitable for use in a reference region analysis. A second limitation on the use of the cerebellum as a reference region is that the conventional analysis assumes that the TAC of the reference region can be well described by a 1T model (Lammertsma and Hume, 1996). Mathematically, it is possible to develop a reference tissue model in which there are two compartments in the reference region, although it is more difficult to determine the kinetic parameters than in the conventional method because of the additional parameters.
Receptor occupancy by injected MDL 100,907
We used a large dose of radioactivity, motivated by the need for good statistical counts to measure plasma metabolites. Therefore, we were concerned that even with high specific activity, some receptor occupancy by the injected MDL 100,907 was possible in the control studies, particularly in light of the test–retest results. To assess occupancy in control studies, we used a human frontal cortex Bmax value of 164 ± 14 fmol/mg protein (Laruelle et al., 1993), a value lower than that reported for monkey and rat. If 80 mg protein corresponds to 1 g brain tissue (Snyder et al., 1984), Bmax is 13.1 pmol/g. If the bound concentration is approximately 400 nCi/cc/mCi injected (see Fig. 4) for a 30-mCi injection and specific activity is 1,000 mCi/μmol, then the bound concentration is approximately 12 pmol/cc. This comparison suggests that we must consider the effect of injected mass on calculated V. If the injected mass did produce detectable receptor occupancy, we would expect to find a significant correlation between mass/kg and V or BP values. We did find a negative correlation between V and injected mass (r = −0.448), but it did not reach statistical significance (P = 0.07, one-tailed).
To test the potential mass effect directly, we performed PET scans in one animal with a large difference in injected mass (0.23 and 3 nmol/kg) at the same radioactivity dose. We analyzed the two scans by the 3T model and obtained V values for frontal cortex of 84.1 and 75.8 mL/mL and for cerebellum of 33.8 and 35.8 mL/mL in the first and second scans, respectively. Therefore, this single experiment suggested only a moderate effect of injected mass on the control data.
To examine the discrepancy between the predicted occupancy and that found in this paired study, a simulation was performed in a similar manner to that used for the preblocking study. TACs for the frontal cortex were generated with 0.25 and 2.5 nmol/kg injected MDL 100,907 using a standard input function and mean kinetic parameters and varying the value of Bmax. To match the result of approximately 10% reduction in V value (84.1 to 75.8 mL/mL) between the two experiments, a Bmax value of 50 pmol/g was required. This value is within the range of values reported in monkey (Lopez-Gimenez et al., 1998). We conclude that occupancy by unlabeled MDL 100,907 in the control studies had a modest effect on our results.
Choice of simplified method
Although the 3T model is presumably the most physiologically appropriate model, this approach is not practical for routine use because it requires knowledge of parameters from a preblocking study. The 2T′ model seems to be the best compartmental method among the simplified methods. However, the method's assumptions are not ideal. In the 2T′ method, the Ve value from the 2T fit of the cerebellum was applied to all regions. This approach might be physiologically appropriate if Ve represented the total pool of free plus nonspecifically bound tracer; however, Ve from the 2T model (11.3 mL/mL) significantly underestimated V from the preblocking studies (20 to 28 mL/mL).
Alternatively, use of the Logan graphical method is awkward for [11C]MDL 100,907 because the timing for beginning the linear fit (t0) is variable between subjects and regions. It is possible simply to use a fixed time for all regions. The Logan graph did not become linear until approximately 60 minutes in the cerebellum, however; thus only a small fraction of the statistical counts would be used because of the short half-life of 11C. The simulation indicated that the Logan graphical method can produce biased parameters, particularly when the noise level in the data was increased, consistent with previous simulations (Carson, 1993; Slifstein and Laruelle, 1999). Therefore, we conclude that the Logan method, with its ease of implementation, is useful only when there are sufficient statistics in the data. For higher-noise cases the 2T′ model is the best choice for analysis of [11C]MDL 100,907 studies.
Footnotes
Acknowledgments
The authors thank Ms. Wendy Greenley for her excellent technical support, the entire NIH PET Department staff, Dale Kiesewetter, PhD, for helpful comments, and John Bacher, DVM, and his staff for veterinary assistance.