
Abstract
α[C-11]Methyl-
Alpha-methyl-
MODELING OF α-METHYL-l -TRYPTOPHAN KINETICS
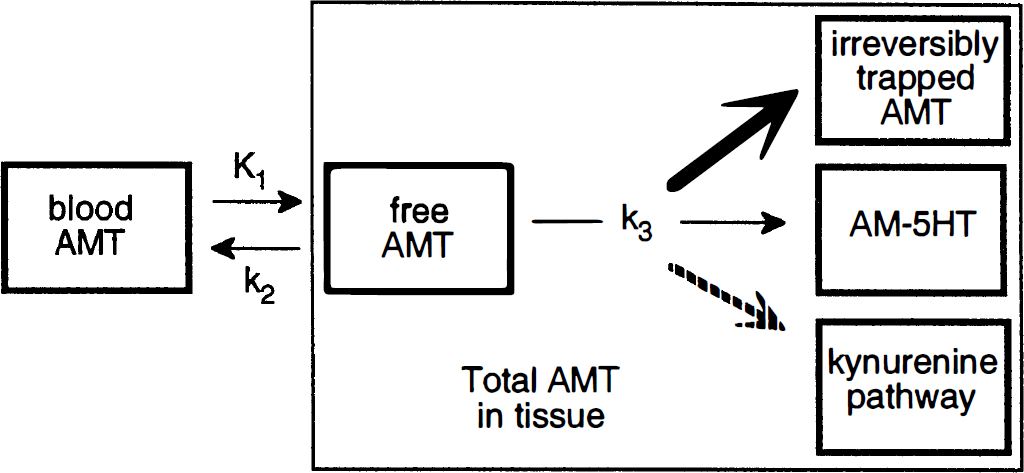
Studies of [C-14]AMT in rat (Diksic et al., 1990) and [C-11]AMT in dogs (Diksic et al., 1991), baboons (Shoaf and Schmall, 1996), and humans (Muzik et al., 1997; Nishizawa et al., 1997; Chugani et al., 1998a) have suggested that the kinetic behavior of the tracer AMT can be described by a three-compartment model using first-order rate constants (schematically represented in Fig. 1). The inflow rate constant K1 (mL/g per minute) and the outflow rate constant k2 (1/min) both describe the exchange of [C-11]AMT between vascular space and the cell cytoplasm (transport across the blood-brain barrier, the interstitial space, and the cell membrane), and k3 (1/min) describes the rate of synthesis of α[C-11]methyl-serotonin. This is essentially the same model described by Sokoloff et al. (1977) for estimation of the glucose metabolic rate using the tracer [C-14]2-deoxyglucose. Sokoloff exploited the property of 2-deoxyglucose which is irreversibly trapped in brain tissue and measured the unidirectional uptake rate. Similarly, because α-methyl-serotonin is not a substrate for the degradative enzyme monoamine oxidase (Missala and Sourkes, 1988), accumulation of α-methyl-serotonin occurs in serotonergic terminals. According to the 2-deoxyglucose model, the glucose metabolic rate is equal to the product of the plasma glucose concentration and the K-complex (the K-complex is equal to the term [K1k3]/[k2 + k3]) divided by the “lumped constant” (a term which corrects for differences in transport and metabolism between glucose and 2-deoxyglucose). However, although AMT is similar to 2-deoxyglucose with regard to an irreversible pool of tracer uptake in the third compartment, there are important differences between the two tracers and how the model can be applied.
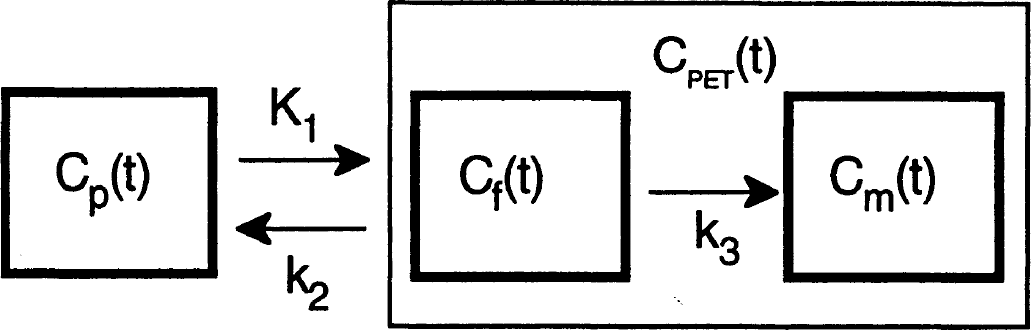
Tracer kinetic model for [C-11]alpha-methyl-tryptophan ([C-11]AMT). The inflow rate constant K1 and the outflow rate constant k2 both describe the exchange of [C-11]AMT between vascular space (Cp) and the cell cytoplasm (Cf). Once present in the cytoplasm, [C-11]AMT is converted to [C-11]alpha-methyl-serotonin (Cm) by means of an irreversible, 2-step enzymatic process which is characterized by the rate constant k3. The positron emission tomography (PET) tissue signal is denoted as CPET and represents a combination of both the Cf and Cm signals.
TRYPTOPHAN AND GLUCOSE TRANSPORT DIFFER
2-Deoxyglucose competes only with glucose for transport into the brain by means of the glucose transporter. The plasma concentration of glucose is approximately equal to the Km of the glucose transporter under normal circumstances (for review, see Lund-Andersen, 1979). In contrast, tryptophan accounts for only approximately 5% of the total large neutral amino acid pool (Pardridge, 1977; Smith et al., 1987) with which the tracer [C-11]-AMT competes at the blood-brain barrier for entry into the brain. Furthermore, the large neutral amino acid transporter is close to saturation under normal circumstances (Oldendorf, 1971; Smith et al., 1987). Therefore, even large changes in plasma tryptophan concentration will have little effect on the transport of [C-11]AMT into the brain. In the example shown in Fig. 2, a 100% increase in plasma tryptophan results in only a 5% change in total large neutral amino acid pool with which [C-11]AMT must compete for brain entry. Thus calculating the serotonin synthesis rate by multiplying the K-complex for [C-11]AMT by the plasma-free tryptophan level as proposed by Diksic and colleagues (Diksic et al. 1990, 1991; Nishizawa et al., 1997) is erroneous.
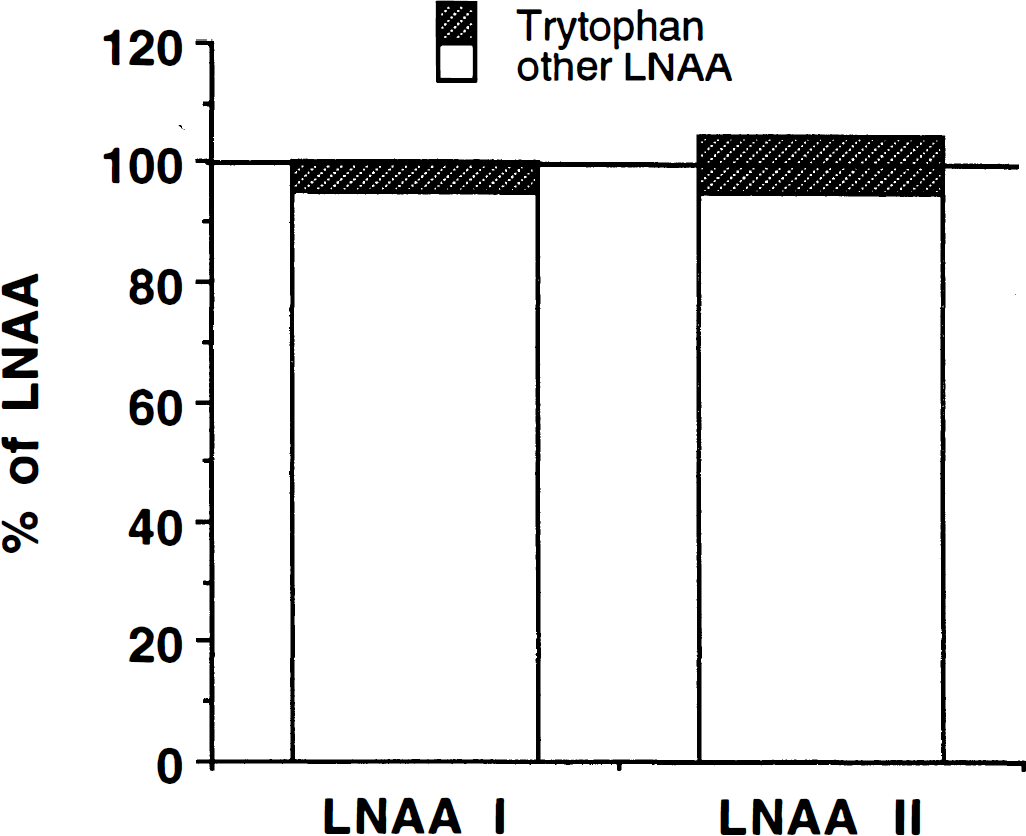
The transport of large neutral amino acids (LNAA) across the blood-brain barrier (BBB) is saturated under normal conditions. Therefore, [C-11]AMT in plasma competes with the sum of all LNAA for transport across the BBB, not only against plasma tryptophan. Because tryptophan constitutes only a small fraction of the LNAA pool (about 5%), even doubling the tryptophan concentration will change the LNAA pool by only 5%, causing a change of the same magnitude in the transport of [C-11]AMT.
REGULATORY MECHANISMS OF HEXOKINASE AND TRYPTOPHAN HYDROXYLASE DIFFER
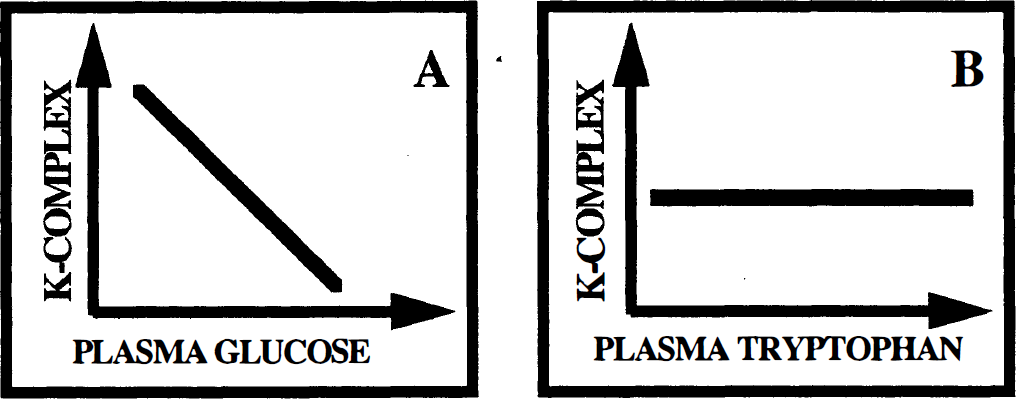
The glucose metabolic rate is governed by the needs of the tissue through the tight regulation of hexokinase and is independent of the plasma concentration of glucose under normal physiologic conditions. Therefore, any increase or decrease in the plasma glucose concentration results in a reciprocal change in the unidirectional uptake rate constant (or K-complex), rendering the value of the K-complex alone useless without global normalization (Fig. 3A). In contrast, the rate of serotonin synthesis is influenced by changes in plasma tryptophan concentration. An increase in plasma tryptophan results in increased transport into the brain and increased serotonin synthesis rate (Fernstrom and Wurtman, 1971). Indeed, studies of serotonin synthesis in brainstem slices show that increasing tryptophan concentration does not decrease the activity of tryptophan hydroxylase (Hamon et al., 1981). Similarly, studies using the AMT model by Shoaf et al. (1998) in monkeys also demonstrate that plasma tryptophan and plasma-free tryptophan values do not show an inverse relationship to the K-complex for AMT (Fig. 3B).
(
K-COMPLEX OR “SEROTONIN SYNTHESIS CAPACITY” IS A STABLE TRAIT
Shoaf et al. (1998) showed that values for K-complex were highly reproducible in the same animal under the same test-retest conditions, whereas values for plasma tryptophan and free tryptophan were not. These data suggest that for AMT, the K-complex is a stable parameter characteristic for the individual and thus has meaning independent of the plasma tryptophan or plasma-free tryptophan, values which would be used to calculate the serotonin synthesis rate according to the model as applied for glucose metabolism. With regard to stability of the K-complex, the kinetics of AMT can be more correctly compared to those of
We have suggested that for AMT, the K-complex is a stable parameter which represents, in physiologic terms, the serotonin sythesis capacity of the individual (Chugani et al., 1998a), whereas the application of the operational equation described above to [C-11]AMT with plasma values of tryptophan or free tryptophan concentration appears to be incorrect. Because the K-complex is a stable value, changes in plasma-free tryptophan would result in proportional changes in the calculated serotonin synthesis rate if one were to use the glucose model. However, previous animal experiments do not support an increase in the serotonin synthesis rate which is proportional to the plasma tryptophan or free tryptophan concentrations. For example, a 100% increase in plasma tryptophan concentration resulted in a 50% increase in brain tryptophan and only a 20% increase in brain serotonin content (Fernstrom and Wurtman, 1971). Similarly, a two-fold increase in plasma-free tryptophan resulted in a 53% increase in forebrain tryptophan (Bloxam et al., 1980).
RANK ORDER OF K-COMPLEX VALUES
The rank order of regional brain values for K-complex are consistent with the rank order for serotonin content in human brain (Chugani et al., 1998a). Although the highest concentrations of serotonin and various measures of innervation density measured in vitro are localized to serotonergic cell bodies in the brainstem nuclei, the brainstem was not among the regions with high K-complex values. This finding is not unexpected, however, because of the limits of the spatial resolution of PET technology (reconstructed image in-plane resolution obtained is 5.5 ± 0.35 mm at full-width-at-half-maximum and 6.0 ± 0.49 mm in the axial direction) compared to the small size of the nuclei containing the several thousand serotonergic cell bodies located near the midline of the brainstem (Tork, 1990; Tork and Hornung, 1990), as well as the problem of partial volume in very small structures (Hoffman et al., 1979). The rank order of K-complex values for the remaining brain regions, however, showed a statistically significant correlation with the rank order of serotonin content in human brain (Costa and Aprison, 1958; Cochran et al., 1976; Mackay et al., 1978; Bucht et al., 1981). The highest values for serotonin synthesis capacity were found in putamen, caudate, thalamus, and hippocampus. Among cortical regions, limbic areas such as rectal gyrus, anterior cingulate gyrus, and transverse temporal gyrus demonstrated higher rates of serotonin synthesis than other regions of the cortex.
GENDER DIFFERENCES IN SEROTONIN SYNTHESIS
Previous studies have shown that there are gender differences in serotonin synthesis in both humans and animals, with females having a small but significantly higher serotonin synthesis rate than males. Specifically, reports in female rats compared to male rats showed significantly higher serotonin content (Kato, 1960; Rosencrans, 1970; Carlsson et al., 1985), higher 5-hydroxy-tryptophan accumulation after inhibition of aromatic amino acid decarboxylase (Watts and Stanley, 1984; Carlsson et al., 1985), as well as higher serotonin accumulation after monoamine oxidase inhibition (Rosencrans, 1970; Carlsson et al., 1985; Carlsson and Carlsson, 1988). In our studies, values of the K-complex for AMT in humans also showed a small but significantly higher value in women than in men (Chugani et al., 1998a). In contrast, multiplication of the K-complex with the free plasma tryptophan concentration produced the opposite result (Nishizawa et al., 1997). They report 50% higher serotonin synthesis rates in males than in females, at odds with studies in the literature.
DEVELOPMENTAL CHANGES IN SEROTONIN SYNTHESIS
Developmental changes in brain serotonin content and serotonin receptor binding have been demonstrated in nonhuman primates (Goldman-Rakic and Brown, 1982; Lidow et al., 1991). There is a rise in serotonin content in cortex beginning before birth reaching a peak at 2 months of age, followed by a slow decline until 3 years of age (Goldman-Rakic and Brown, 1982). Expression of serotonin receptors showed a similar developmental time course (Lidow et al., 1991). In humans, measures of the serotonin metabolite 5-hydroxyindole acetic acid (5-HIAA) in cerebrospinal fluid show higher values in children compared to adults (Seifert et al., 1980; Hedner et al., 1986). For nonautistic children, we showed that the K-complex for AMT was >200% of adult values until the age of 5 years and then declined toward adult values. Furthermore, K-complex values declined at an earlier age in girls than in boys (Chugani et al., 1999). The earlier decline in the developmental curve for whole brain serotonin synthesis capacity in girls as compared to boys is consistent with earlier onset of puberty in girls (Tanner et al., 1976).
K-COMPLEX OR SEROTONIN SYNTHESIS CAPACITY IS SENSITIVE TO CHANGES IN BRAIN DISORDERS
There are numerous lines of evidence suggesting a role of serotonin in autism (for review see Cook and Leventhal, 1996). In contrast to the developmental pattern described for nonautistic children above, serotonin synthesis capacity increased gradually between the ages of 2 and 15 years to values 1 1/2 times those of normal adult values and showed no gender difference in autistic children (Chugani et al., 1999). These data suggest that the developmental process with a period of high brain serotonin synthesis capacity during childhood is disrupted in autistic children. Furthermore, we have found focal asymmetries of [C-11]AMT uptake in frontal cortex, thalamus, and cerebellum in autistic children (Chugani et al., 1997).
Migraine is another disorder in which serotonin pathophysiology has been implicated (for review, see Silberstein, 1994). Measurements of plasma 5-HT and 5-HIAA levels between and during migraine attacks showed low 5-HT and high 5-HIAA levels in plasma between migraine attacks (Ferrari et al., 1989). During migraine headache in patients without aura, the plasma 5-HT was higher and 5-HIAA levels and platelet monoamine degradative enzyme activities were lower than in controls. Ferrari et al. hypothesized that 5-HT turnover is enhanced between migraine attacks and is relatively decreased during attacks in patients having migraine without aura. Our finding of increased brain serotonin synthesis capacity in migraine patients without aura between attacks is consistent with increased 5-HT turnover and supports this hypothesis (Chugani et al., 1999).
UNIDIRECTIONAL UPTAKE OF AMT INTO TISSUE: SEROTONIN SYNTHESIS IS “THE TIP OF THE ICEBERG”
Shoaf et al. (1999) assert that AMT is no different from FDOPA and that both tracers are simply measuring amino acid transport. However, the distribution of these tracers is proportional to the serotonergic (AMT, Chugani et al., 1998a) or to the dopaminergic (FDOPA, Snow et al., 1993) innervation. In our human data obtained from dynamic AMT PET studies, we found that at 60 minutes after tracer injection about 50% of the activity was in a “trapped” pool, but we do not have data to show whether this activity represents unchanged AMT or a metabolite (Chugani et al., 1998a). Furthermore, we showed that the rank order of regional K-complex values matched that of serotonin content-but the magnitude of the difference among structures was much lower for K-complex than for serotonin content. We interpreted this difference to mean that there is a large unmetabolized pool. This interpretation is supported by animal studies by Diksic et al. (1990) and a recent report by Gharib et al. (1999). Thus, we have reported K-complex values which we suggest are an index of serotonin synthesis (or under some circumstances kynurenine pathway metabolism, see below), but the technique cannot be construed to measure the serotonin synthesis rate. In essence, the serotonin synthesis component of the tracer uptake is superimposed on a large unmetabolized pool of AMT (Fig. 4).
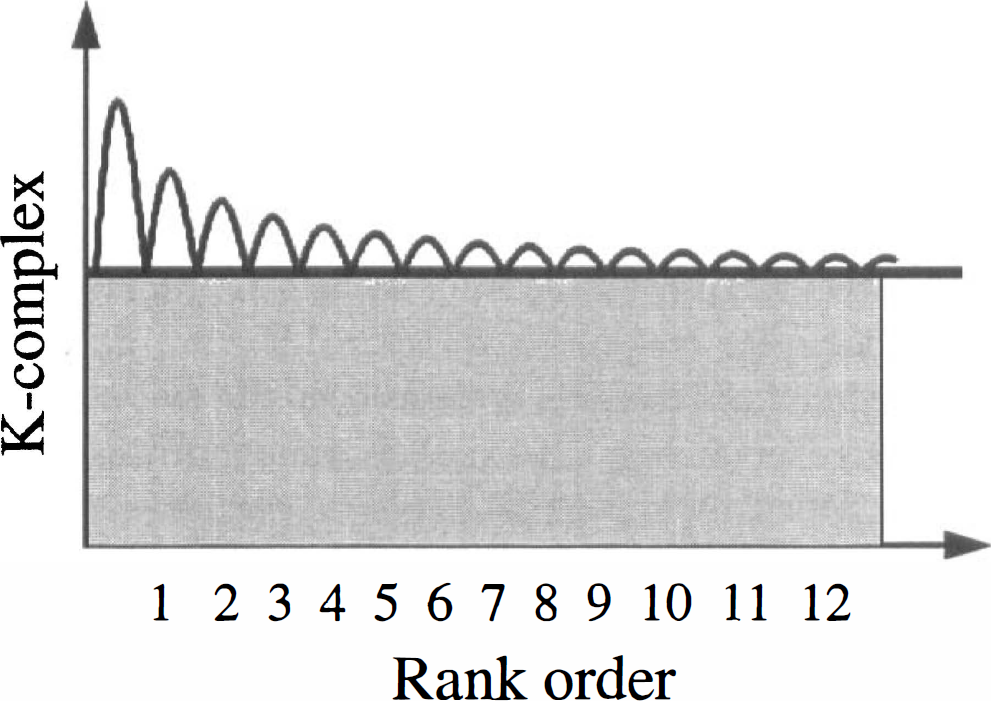
The rank order of K-complex values in brain regions correspond to that of serotonin content. However, the serotonin synthesis component of the tracer uptake is superimposed on a large unmetabolized pool of [C-11]AMT (represented by gray shading) which seems to be irreversibly trapped in brain tissue.
Shoaf et al. (1999) question the unidirectional uptake of AMT into tissue based on kinetic analysis of dynamic AMT PET data. It is extremely difficult to prove or disprove the existence of unidirectional AMT uptake (i.e., the existence of a metabolic compartment) using dynamic PET and [C-11]AMT. The problems associated with this task are numerous (Muzik et al., 1997). First, the time to reach dynamic equilibrium of AMT is long compared to the physical half-life of the [C-11] tracer. The best estimates suggest that dynamic equilibrium is reached not earlier than after 80 minutes (Muzik et al., 1997), four times the length of the physical half-life of [C-11] (20 minutes). Data acquired during this equilibrium phase are most important for a reliable estimation of parameters k2 and k3 characterizing accumulation of tracer into tissue. However, because of the low uptake of tryptophan into brain tissue (about 2%) and the short physical half-life of [C-11], for all practical purposes the length of the acquisition period is limited to approximately 60 minutes. After this time, the quality of the PET images is highly compromised by the low-count statistics of this tracer. In addition, by this time the necessary decay-correction magnifies the statistical noise by a factor in the order of 10, making it difficult to estimate the k2 and k3 parameters more reliably. Our previous results comparing a three-compartment model against a two-compartment model applied to the initial 60 minutes of data were inconclusive (Muzik et al., 1997). Based strictly on the magnitude of the residuals, the three-compartment model configuration did not describe the data significantly better than the two-compartment model configuration. However, visual examination of the residuals indicated that they were not randomly distributed around zero but showed sections that were all positive, then negative, positive, and negative. These “runs” in the residuals were not observed in the results obtained from the three-compartment model.
Because the identifiability of individual rate constants in the three-compartment model configuration is low, the Patlak graphical approach can be used to determine the K-complex. A requirement for application of the Patlak graphical approach is that the system under study is in dynamic equilibrium, i.e., that the total amount of tracer in the free tissue compartment is constant (Patlak et al., 1983). Only when dynamic equilibrium is reached do the differential equations transform into a linear equation and the K-complex can be estimated as the slope of a straight line. In the case of AMT, the linearity of the Patlak plot is compromised by the relatively long time until the system reaches a dynamic equilibrium relative to the time when loss of tracer from the metabolic compartment becomes measurable. It was shown by Phelps et al. (1979) that even for FDG a k4 has to be taken into account for measurements longer than 120 minutes. Thus, by the time the dynamic equilibrium is reached, loss of tracer becomes measurable and the Patlak-plot might never be truely linear, despite the existence of a conceptually unidirectional compartment. This situation is even further compounded by the low metabolic rate of tryptophan, producing a very small K-complex (slope parameter). Nevertheless, the possible minor nonlinearity of the Patlak-plot attributable to violation of the dynamic equilibrium requirement has little effect on the rank order of regional values of the K-complex. Results of our compartmental analysis suggest that the amount of time needed to reach dynamic equilibrium is fairly constant between cortical and subcortical regions, with the exception of the cerebellum (Muzik et al., 1997; Chugani et al., 1998a). The reason for the apparently longer half-life of the free precursor pool in the cerebellum as compared with other brain structures is unclear and warrants further investigation. In any case, the curves in the remaining gray matter regions will all “bend” by the same amount, and the rank order of the Patlak slopes will be independent from the time interval from which they were derived.
From all the above it is clear that the presence of an unidirectional compartment for AMT has to be established in animal studies, a work rigorously performed by the early investigators in rodents (Missala and Sourkes, 1988; Diksic et al., 1990; Cohen et al., 1995; Gharib et al., 1999). Shoaf et al. (1999) challenge these previous studies based on high-performance liquid chromatography analyses of brain tissue extracts of [14C]-labeled tracer from four rhesus monkeys, reporting that only 5% of the radioactivity in midbrain represented α-methyl-serotonin at 180 minutes after tracer injection. Their findings are in contrast to those reported in the rat by Diksic et al. (1990) who stated that at 180 minutes postinjection 45% of the radioactivity in dorsal raphe was α-methyl-serotonin, and those of Gharib et al. (1999) who reported that 52% of the radioactivity was a-methyl-serotonin at 180 minutes postinjection. In contrast to the rat studies, Shoaf et al. performed high-performance liquid chromatography analysis on extracts from a crude dissection of the midbrain and pons rather than dissecting the raphe nuclei. This methodologic problem, rather than species differences, probably accounts for the discrepancy between the rat and primate studies.
In summary, we believe that the rat studies demonstrate unequivocably the presence of irreversible uptake of AMT. However, these studies also demonstrate that the serotonin synthesis component is a fraction of the irreversible uptake of the tracer (Fig. 5). Thus, although lacking properties for measuring the absolute synthesis rate, AMT uptake is useful as an index or capacity for serotonin synthesis.
The figure shows schematically the fate of [C-11]AMT in brain. After transport of [C-11]AMT across the blood-brain barrier, free [C-11]AMT in the cytoplasm is either metabolized to [C-11]AM-5-HT or is irreversibly trapped, presumably in a serotonin synthesis precursor pool. It appears that this irreversibly trapped pool is larger than the metabolic pool. Furthermore, under pathologic conditions [C-11]AMT can also be metabolized by means of the kynurenine pathway. Thus, the resulting K-complex represents the combined unidirectional uptake into all three pools.
[C-11]AMT IS A TRACER OF THE KYNURENINE PATHWAY UNDER SOME PATHOLOGIC CONDITIONS
In addition to metabolism by tryptophan hydroxylase, tryptophan is metabolized by tryptophan 2,3-dioxygenase (Haber et al., 1993) and indoleamine 2,3-dioxygenase (Yamazaki et al., 1985) by means of the kynurenine pathway in the brain. Under normal circumstances, the metabolites of these pathways are between 100- and 1000-fold lower than the concentration of tryptophan in the brain (Saito et al., 1993). In comparison, the sum of the concentrations of serotonin and its metabolite 5-HIAA is approximately one-fifth the concentration of tryptophan in brain (Hery et al., 1977). Therefore, the kynurenine pathways are not expected to contribute to the accumulation of [C-11]AMT in brain under normal circumstances. However, after ischemic brain injury or immune activation, induction of indoleamine2,3-dioxygenase can result in a 10-fold increase in quinolinic acid (a metabolite of the kynurenine pathway) in brain (Saito et al., 1993), and, therefore, this pathway should be considered in the disease state. We have preliminary data that this pathway is important in patients with tuberous sclerosis complex and epilepsy (Chugani et al., 1998b).
Our rationale for applying AMT in epilepsy patients was based on evidence implicating serotonergic mechanisms in epileptogenesis. The levels of 5-HT and 5-HIAA have been reported to be higher in actively spiking temporal cortex, as compared to nonspiking cortex (Louw et al., 1989; Pintor et al., 1990). In addition, Trottier et al. (1996) demonstrated with immunohistochemical methods that epileptogenic dysplastic tissue is characterized by serotonergic hyperinnervation in patients with focal cortical dysplasia. However, we have reported preliminary biochemical studies of tissue obtained at surgery that the increase in [11C]AMT uptake in cortical tubers (Chugani et al., 1998c) does not represent increased 5-HT synthesis (Chugani et al., 1998b). Resected tissues (cortex, an epileptogenic tuber with high AMT uptake and a nonepileptogenic tuber with low uptake) were analyzed for tryptophan hydroxylase activity, 5-HIAA, 5-HT, and quinolinic acid. Cortical tissue and the tuber with low AMT uptake contained measurable amounts of 5-HT, 5-HIAA, and tryptophan, but only tryptophan was detected in the tuber with high AMT uptake. Furthermore, tryptophan hydroxylase activity was very low in the epileptogenic tuber. In contrast, quinolinic acid, a tryptophan metabolite of the kynurenine pathway, was 5-fold higher in the epileptogenic tuber than in nonepileptogenic tuber. It is pertinent that quinolinic acid is a convulsant through its action as an agonist at N-methyl-
CONCLUSION
Based on the studies and issues discussed above, we conclude that AMT is a useful tracer for examination of serotonergic mechanisms, although this tracer cannot be used to measure the absolute serotonin synthesis rate (Fig. 5). Furthermore, in certain pathologic states, increased AMT may represent increased metabolism by means of the kynurenine pathway rather than increased serotonin synthesis. A prime concern of future studies is to determine the role of the pool of AMT which is irreversibly transported but not metabolized for up to 3 hours after tracer injection.