
Abstract
[11C](+)McN5652 is a selective serotonin reuptake inhibitor with subnanomolar potency for the serotonin transporter, and is currently being used for positron emission tomography studies. However, quantification of the regional [11C](+)McN5652 binding potential in vivo is a controversial issue because of its complex characteristics. The authors examined the regional differences in nonspecific binding and proposed simple methods for estimating the binding potential of [11C](+)McN5652. The regional difference in nonspecific binding was evaluated by the activity ratio of the thalamus compared with the cerebellum for inactive-isomer [11C](−)McN5652 and [11C](+)McN5652 saturation studies. The distribution volume of the thalamus was approximately 1.16 times larger than that of the cerebellum. The thalamus-to-cerebellum distribution volume ratio was estimated by nonlinear least square and graphical methods, with and without arterial input function. The graphical method with k2′ without blood sampling was practical and most applicable for estimation of the distribution volume ratio because this method is more stable than the nonlinear least square method in the simulation study. Binding potential estimated with the distribution volume ratio of [11C](+)McN5652 and the correction with distribution volume ratio of [11C](−)McN5652 represent the most reliable parameters for the assessment of serotonin transporter binding.
Keywords
The serotonin (5-HT) transporter (5-HTT) is located on the presynaptic terminals of the serotonergic neuron and plays an important role in the regulation of serotonergic neurotransmission by means of reuptake of released 5-HT in the synaptic cleft. It has been suggested that dysfunction of 5-HTT might underlie neuropsychiatric disorders such as mood disorder and Parkinson disease (Stanley et al., 1982; Raisman et al., 1986; Severson et al., 1985). Although several selective serotonin reuptake inhibitors (SSRIs), such as fluoxetine, paroxetine, and citalopram, have been labeled with 11C or 18F to observe the 5-HTT in vivo (Kilbourn et al., 1989; Hammadi et al., 1993; Hume et al., 1989, 1991, 1992), most ligands are not suitable because of insufficient specific binding in vivo. Trans-1,2,3,5,6,10-β-hexahydro6-[4(methylthio) phenyl] pyrrolo [2,1-a] isoquinoline ([11C]McN5652) has high affinity for 5-HTT and shows relatively high accumulation in high-density regions of 5-HTT, such as the thalamus (Suehiro et al., 1993a,b; Szabo et al., 1995a,b; Shank et al., 1988; unpublished data). McN5652 has optical isomerism, and its pharmacologically active enantiomer (+)McN5652 is at least twice as potent as its pharmacologically inactive enantiomer (−)McN5652 (Shank et al., 1988; Smith et al., 1991; Szabo et al., 1995a).
Recently, several methods have been used to quantify [11C](+)McN5652-specific binding. However, a relatively high fraction of nonspecific binding and the possible differences of nonspecific binding among regions have made it difficult to accurately evaluate specific bindings (Szabo et al., 1995a; Scheffel et al., 1998; Buck et al., 2000; unpublished data). If there were regional differences in nonspecific binding, estimation of transporter occupancy would be unreliable because of the unsettled baseline. Previous studies have overlooked this problem of nonspecific binding. In the present study, we examined regional differences in nonspecific binding and proposed simple methods to estimate the binding potential (BP) of [11C](+)McN5652 using the graphical method with or without arterial plasma input function.
MATERIALS AND METHODS
Radiotracer preparation
[11C](+)McN5652 and [11C](−)McN5652 were synthesized by S-methylation of the corresponding desmethyl precursor with [11C]CH3I using automated equipment (Sasaki et al., 1996). Each precursor was prepared by demethylation of the corresponding McN5652, stabilized by adding a protecting agent for the thiol group, dithiothreitol (DTT), to the reaction mixture immediately, and purified by HPLC (column, Megapak SIL C18-10 [250 × 7.5 mm, inner diameter]; mobile phase, acetonitrile/0.1-mol/L ammonium formate [pH 4.0, 0.5% DTT]).
Subjects
Fourteen subjects (12 healthy volunteers, mean age 22 years, range 20–24 years; 2 patients with depression, age 30 and 50 years) participated in this study (Table 1). All healthy volunteers were free of any somatic, neurologic, or psychiatric disorders, and had no history of current or previous drug abuse. Two depressed patients receiving high doses of clomipramine were included in this study, but for ethical reasons the healthy volunteers could not take doses high enough to produce full saturation of 5-HTT. The patients met the DSM-IV criteria for major depressive disorder and had received long-term treatment with clomipramine for more than 6 months.
Subjects and procedures
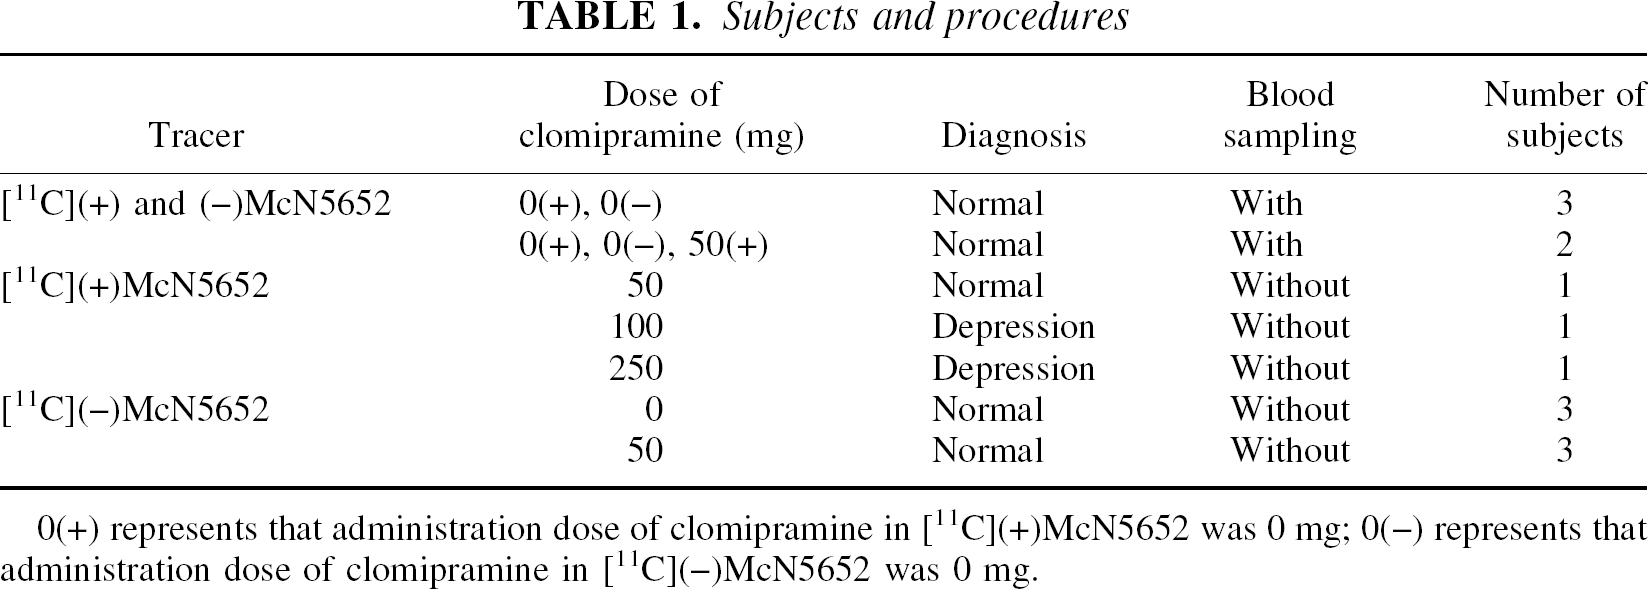
0(+) represents that administration dose of clomipramine in [11C](+)McN5652 was 0 mg; 0(−) represents that administration dose of clomipramine in [11C](−)McN5652 was 0 mg.
The study of comparison among quantification methods comprised five healthy volunteers (five men, mean age 21 years, range 20–24 years) who were examined with [11C](+)McN5652 and [11C](−)McN5652, and who underwent arterial blood sampling.
In the study of regional differences in nonspecific binding, five subjects (three healthy volunteers, two patients) with [11C](+)McN5652 and clomipramine and 6 healthy volunteers with [11C](−)McN5652 and with or without clomipramine were studied. Two (healthy volunteers) of the five subjects with [11C](+)McN5652 also participated in the previously described study of comparisons among quantification methods, and arterial blood sampling was performed only in these two subjects. In the examination with [11C](+)McN5652, the three healthy subjects were administered 50 mg clomipramine orally 5 hours before the injection, and the two patients were taking 100 and 250 mg clomipramine daily, respectively. In the examination with [11C](−)McN5652, three of the six subjects were administered 50 mg clomipramine orally 5 hours before the injection. The radioactivity ratio of the thalamus and cerebellum of these 11 subjects was compared with that of [11C](+)McN5652 without clomipramine.
The ethics and radiation safety committees of the National Institute of Radiological Sciences (Chiba, Japan) approved the study, and written informed consent was obtained from each subject.
Positron emission tomography
Positron emission tomography (PET) scans were performed using a Siemens ECAT47 system (Siemens, Knoxville, TN, U.S.A.), which provides 47 slices with 3.375-mm (center-to-center) thickness. Radioactivity was measured in two-dimensional mode and the data were reconstructed using a Ramp filter with a cut-off frequency of 0.5 (full width at half maximum 6.3 mm). The subjects were placed in a supine position with eyes closed and ears unplugged. To minimize head movement during each scan, head fixation devices (Fixster Instruments, Stockholm, Sweden) and thermoplastic attachments made to fit the individual subject were used. A transmission scan of 10 minutes with a 68Ge-68Ga source was followed by a dynamic 90-minute scan with a bolus injection of 707.4 to 758.5 (mean, 728.0 ± 21.0) MBq [11C](+)McN5652. The specific radioactivities were 65.2 to 118.5 (mean, 99.4 ± 20.1) GBq/μmol at the time of injection. A dynamic 90-minute scan with a bolus injection of 455.1 to 728.2 (mean, 625.9 ± 138.2) MBq [11C](−)McN5652 was performed on the same day. The specific radioactivities were 37.1 to 109.9 (mean 63.9 ± 27.3) GBq/μmol at the time of injection. The interval between the [11C](+)McN5652 and [11C](−)McN5652 studies was at least 2 hours, and the studies were performed in random order.
The PET images were coregistered to magnetic resonance images using SPM99 (Wellcome Department of Cognitive Neurology, London, U.K.), and regions of interest were defined over the cerebellum and thalamus based on these coregistered images.
Arterial blood sampling
Arterial blood samples were taken 13 times during the initial 3 minutes after the tracer injection, then 8 times during the next 17 minutes, and then once every 10 minutes until the end of the scan. Each blood sample was separated into plasma and blood cell fraction by centrifugation. To each plasma fraction, at 3.5, 9, 19, 29, 39, 49, 59, 69, 79, and 89 minutes after injection, acetonitrile was added and then centrifuged. The obtained supernatant was subjected to radio-HPLC analysis (column μ Bondapak C18; mobile phase, 50/50 acetonitrile/0.1-mol/L ammonium formate). The plasma time-activity curve was corrected by the amount of unchanged ligand in plasma.
Compartment models
Parameters related to the distribution volume (DV) were estimated for the thalamus and cerebellum using least square fitting and graphical methods. Compartment models (Fig. 1) were used for the analysis of [11C](+)McN5652 and [11C](−)McN5652. The one-tissue compartment model was used for [11C](−)McN5652 data. For data regarding [11C](+)McN5652, the two-tissue compartment model was used for the thalamus, and the one-tissue compartment model was used for the cerebellum. Although the cerebellum has a small amount of 5-HTT (Laruelle et al., 1989), it can be regarded as having negligible specific binding sites for [11C](+)McN5652 in vivo. K1 was used to describe the uptake of the tracer across the blood-brain barrier, k2′ was used to represent the back diffusion from tissue to vascular space, and k3′ and k4 were included to describe the binding and dissociation of the radioligand at the serotonin transporter site (Koeppe et al., 1991).
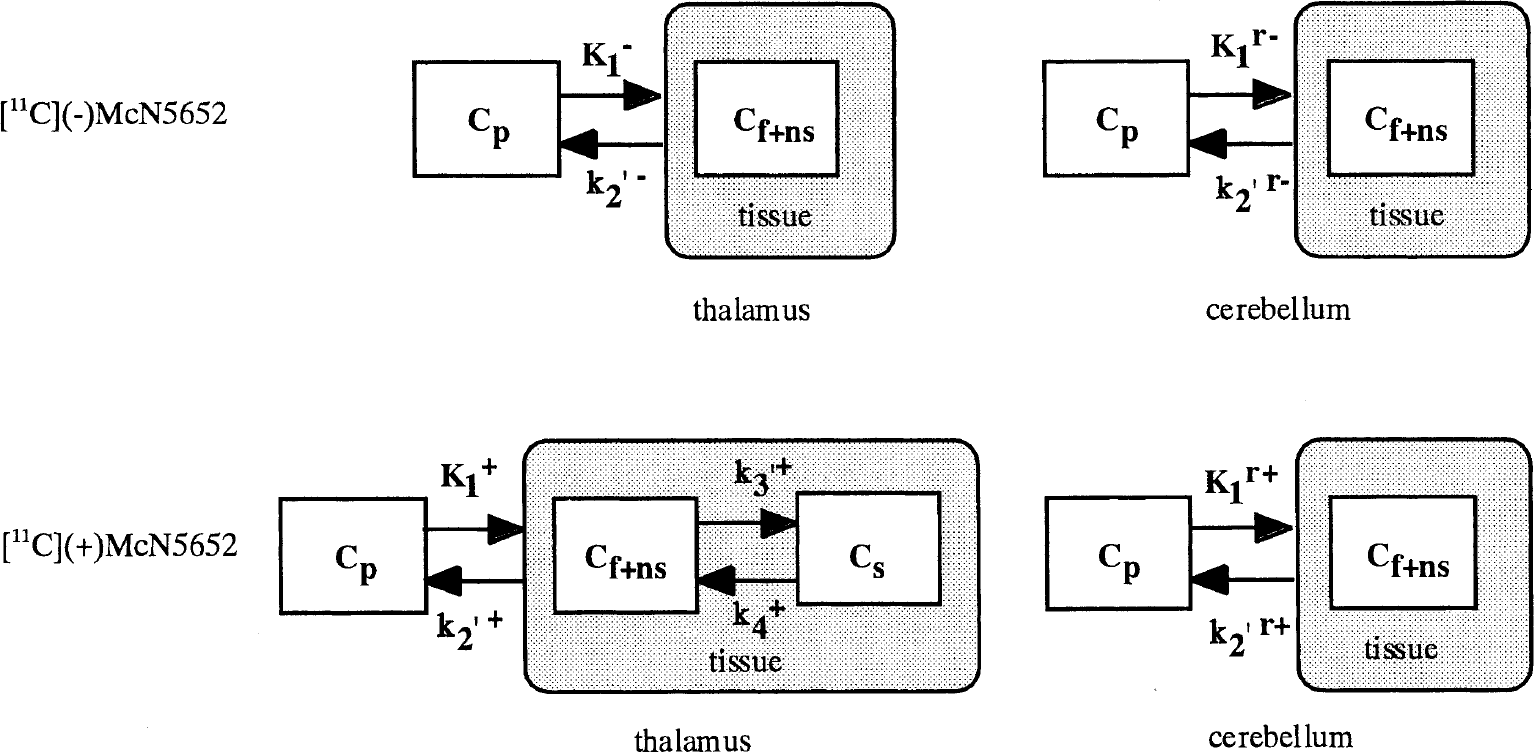
Kinetic models of the thalamus and cerebellum for [11C](−)McN5652 (
Estimation of distribution volume with arterial input function
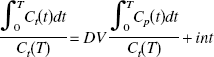
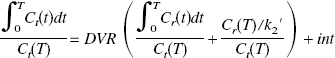
Estimation of distribution volume ratio without arterial input function
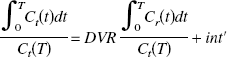
To estimate BP noninvasively without arterial blood sampling, the DV ratio (DVR) of the thalamus to the reference region (cerebellum) was calculated directly using the graphical method.
Estimation of binding potential
We have defined BP as k3′/k4 (Mintun et al., 1984). In general, k3′/k4 is assessed by the equation
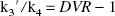
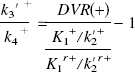

This assumption is based on the result of the measurement in which the value of DVR(+) in the saturation study of [11C](+)McN5652 was almost equal to DVR(−). The BP was estimated from Eq. 4 or 8. When BP was estimated from Eq. 8, the mean value of DVR(−) for five studies was used instead of the individual DVR(−). The BP values estimated from these methods were compared with k3′/k4 estimated by the NLS method.
Simulation study
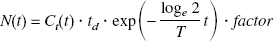
Simulated time-activity curves for the thalamus and cerebellum with [11C](+)McN5652 were generated with several noise levels to investigate the reliability of parameter estimates for the NLS and graphical methods. A dynamic tracer concentration for [11C](+)McN5652 was derived from the k values and a measured input function according to the human PET imaging protocol (60 seconds × 4, 120 seconds × 13, 240 seconds × 5, 480 seconds × 5). The true k values (K1 = 0.46, k2′ = 0.021, k3′ = 0.026, k4 = 0.019 or K1 = 0.46, k2′ = 0.021, k3′ = 0.015, k4 = 0.019 for thalamus, K1 = 0.43, k2′ = 0.022 for cerebellum, respectively) were determined from measured data by using the two-tissue or one-tissue compartment model.
The noise level for each frame was determined according to the collected total count given by
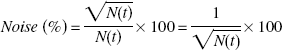
The rate constants (K1, k2′, k3′ and k4 for thalamus, K1 and k2′ for cerebellum) were estimated by the NLS method with a modified Marquardt method for 1,000 time-activity curves. Parameter estimates were considered invalid if K1, k2′, k3′ and k4 were outside the range 0.0 < K1 < 1.0, 0.0 < k2′ < 0.5, 0.0 < k3′ < 0.5, 0.0 < k4 < 0.5, 0.0 < K1/k2′ < 100.0, 0.0 < k3′/k4 < 10.0. DVtotal and DVR were also estimated by the graphical method. The reliability of the estimates of parameters was evaluated by the mean and SD of the estimates, and the relation between noise and reliability of estimates of parameters was investigated for each analysis method.
RESULTS
Distribution volume of [11C](−)McN5652
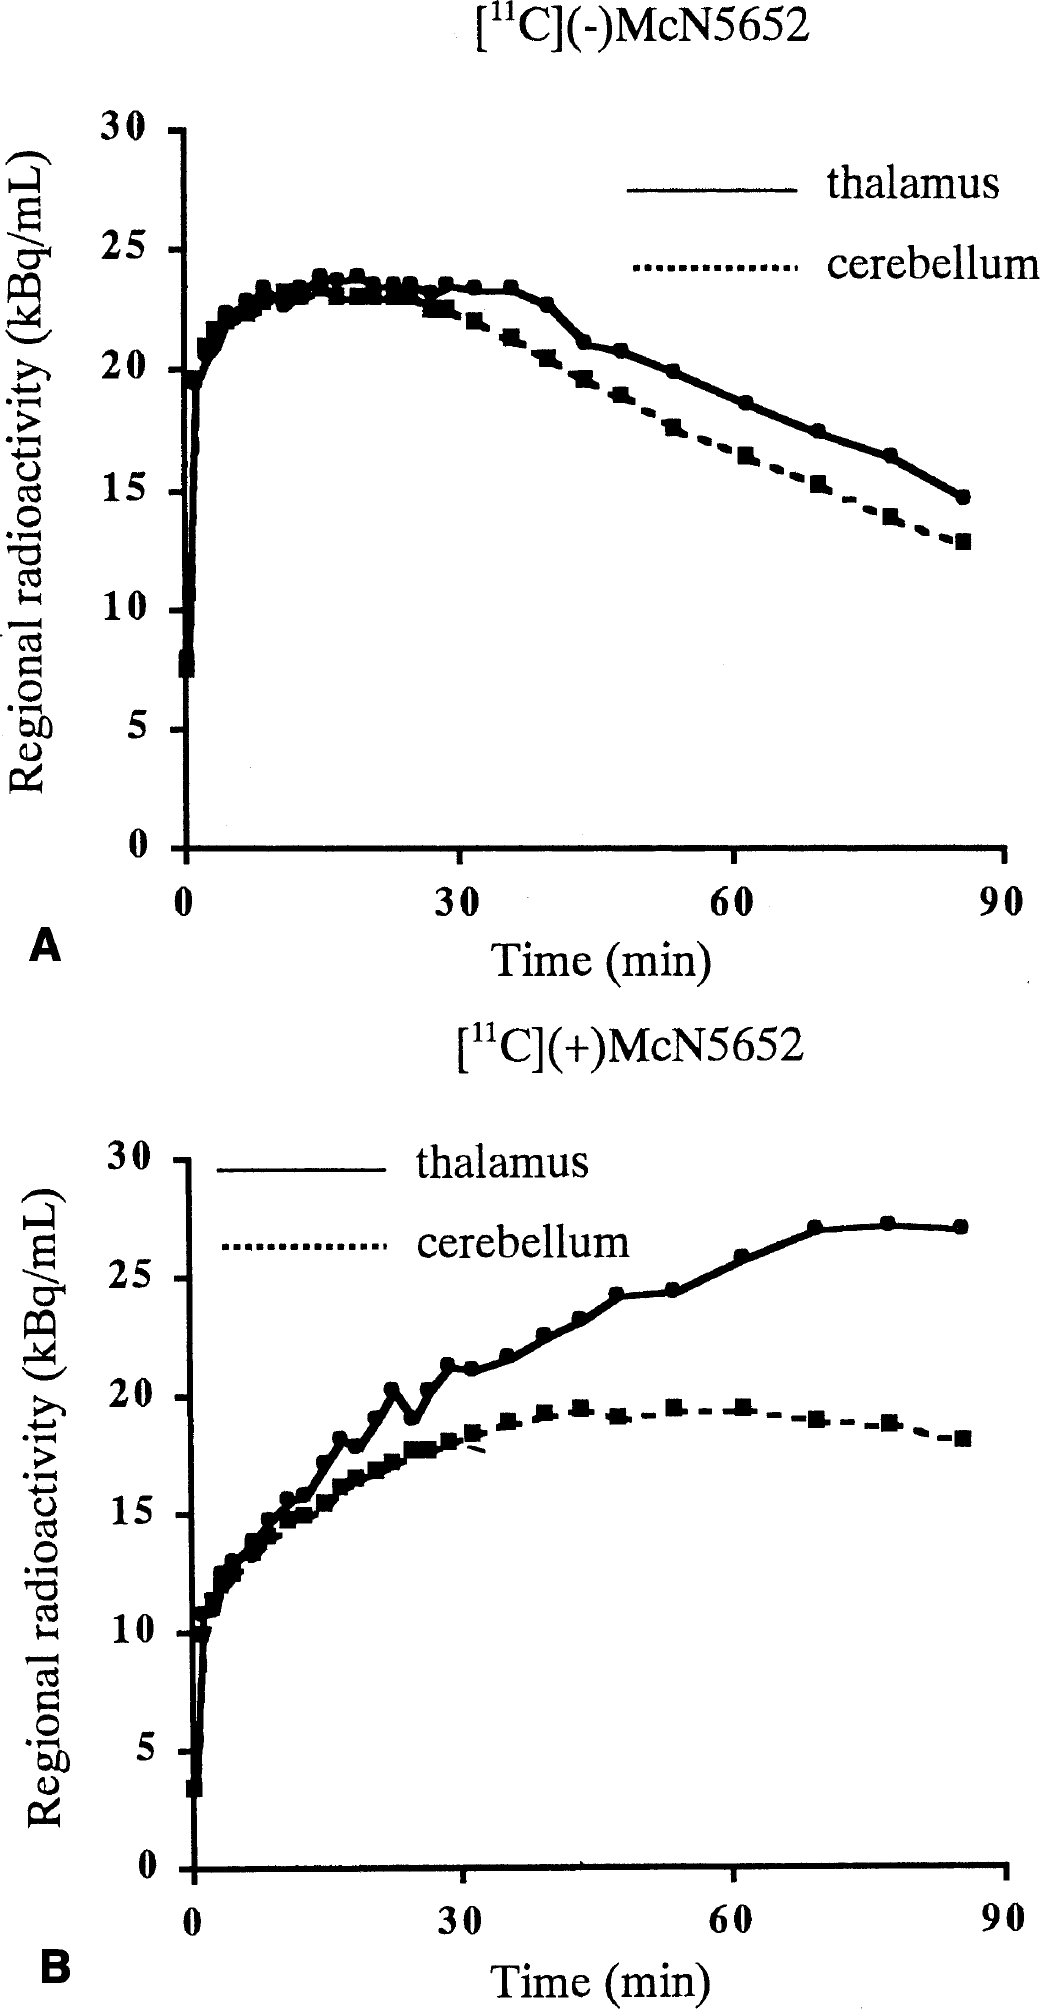
Typical examples of tissue time-activity curves of [11C](−)McN5652 for the thalamus and cerebellum are shown in Fig. 2A. Distribution volumes of the thalamus and cerebellum were estimated with metabolite-corrected arterial input function (Fig. 3A) by both the NLS method with the one-tissue compartment model and the graphical method. The DVR estimates of both methods are listed in Table 2. The results show that mean DVR(−) was 1.18 and 1.16 using the NLS and graphic methods, respectively. This means that the DV of the inactive enantiomer was larger in the thalamus than in the cerebellum. The DVR(−) values by means of the NLS and graphic methods were almost the same. The estimated value of DVR(−) ranged from 1.11 to 1.23 for the NLS method and from 1.13 to 1.23 for the graphical method. Coefficient of variance (COV, SD/mean [%]) of five studies was 3.77% and 3.63% for the NLS and graphic methods, respectively. The dispersion of DVR(−) among subjects was not significant.
Distribution volume ratio of thalamus to cerebellum for [ 11 C](−)McN5652
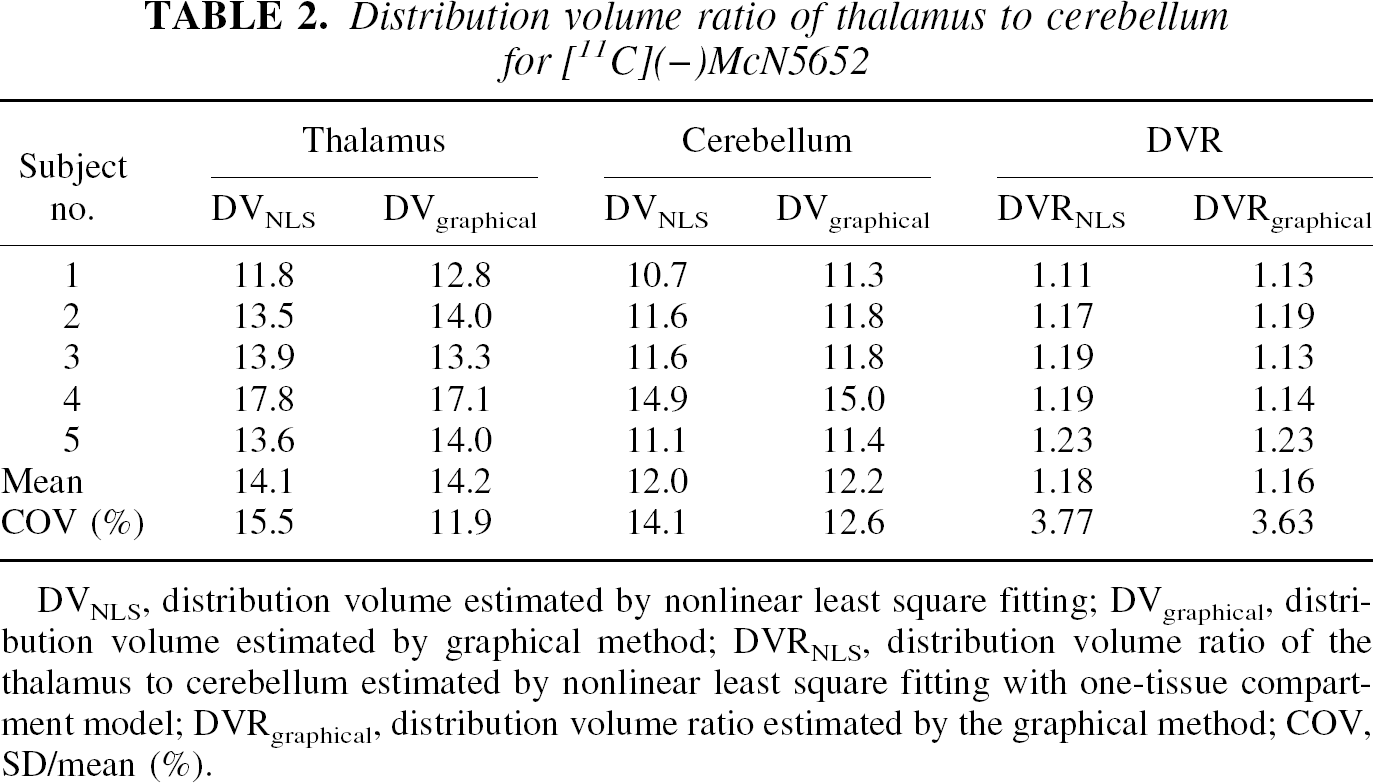
DVNLS, distribution volume estimated by nonlinear least square fitting; DVgraphical, distribution volume estimated by graphical method; DVRNLS, distribution volume ratio of the thalamus to cerebellum estimated by nonlinear least square fitting with one-tissue compartment model; DVRgraphical, distribution volume ratio estimated by the graphical method; COV, SD/mean (%).
Time-activity curves of the thalamus and cerebellum for [11C](−)McN5652
Distribution volume of [11C](+)McN5652
Typical examples of tissue time-activity curves for the thalamus and cerebellum with [11C](+)McN5652 are shown in Fig. 2B. The values of K1/k2′, k3′/k4 and DVtotal were estimated by the NLS method, and DVtotal was also estimated by the graphical method with metabolite-corrected arterial input function (Fig. 3B). A summary of the comparison of parameter estimates using both methods is presented in Table 3. In the cerebellum, DVtotal ranged from 18.1 to 22.0 using the NLS method and from 17.4 to 22.0 using the graphical method. The COV of five studies was 7.96% and 10.8% using the NLS or graphical method, respectively. The mean DVtotal using the NLS method was 20.5 and that of the graphical method was 19.8, indicating that the values of the two methods were similar. In the thalamus, the mean value and COV of five studies were 19.7 and 17.0% for K1/k2′, 1.14 and 34.8% for k3′/k4, and 41.7 and 18.2% for DVtotal estimated from the NLS method with the two-tissue compartment model. For the graphical method, the mean DVtotal was 37.2 and COV was 23.8%. The DVtotal estimated from the NLS method was larger than that from the graphical method for all cases, and DVtotal in the thalamus showed variations among subjects.
Distribution volume of the thalamus and cerebellum for [ 11 C](+)McN5652
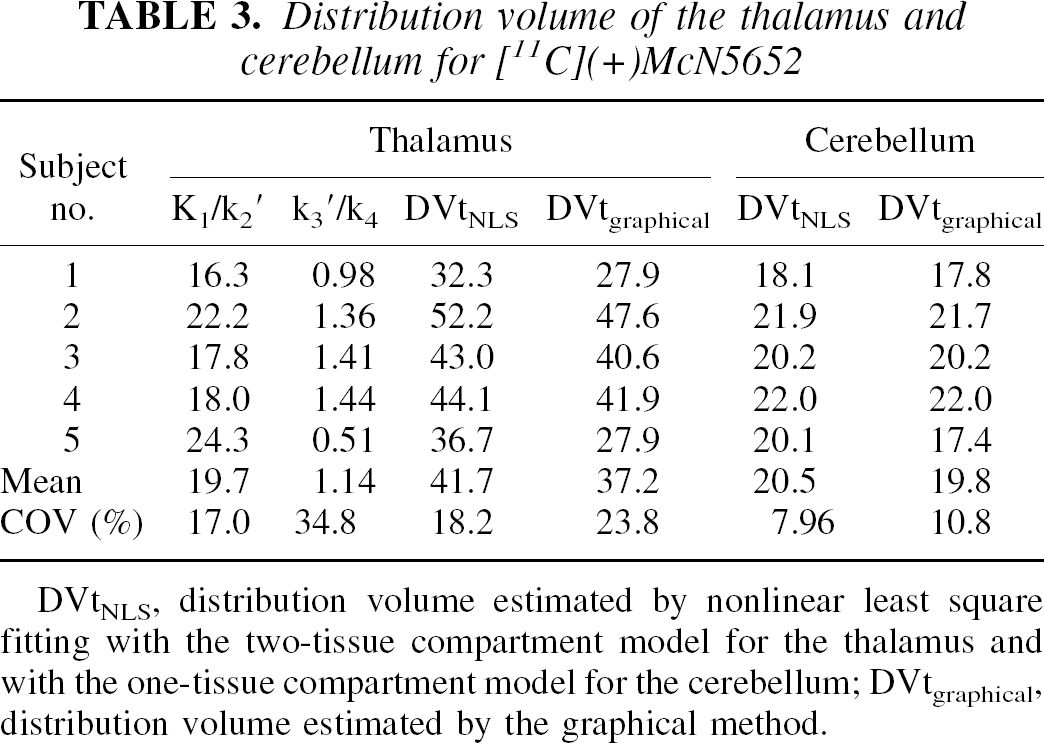
DVtNLS, distribution volume estimated by nonlinear least square fitting with the two-tissue compartment model for the thalamus and with the one-tissue compartment model for the cerebellum; DVtgraphical, distribution volume estimated by the graphical method.
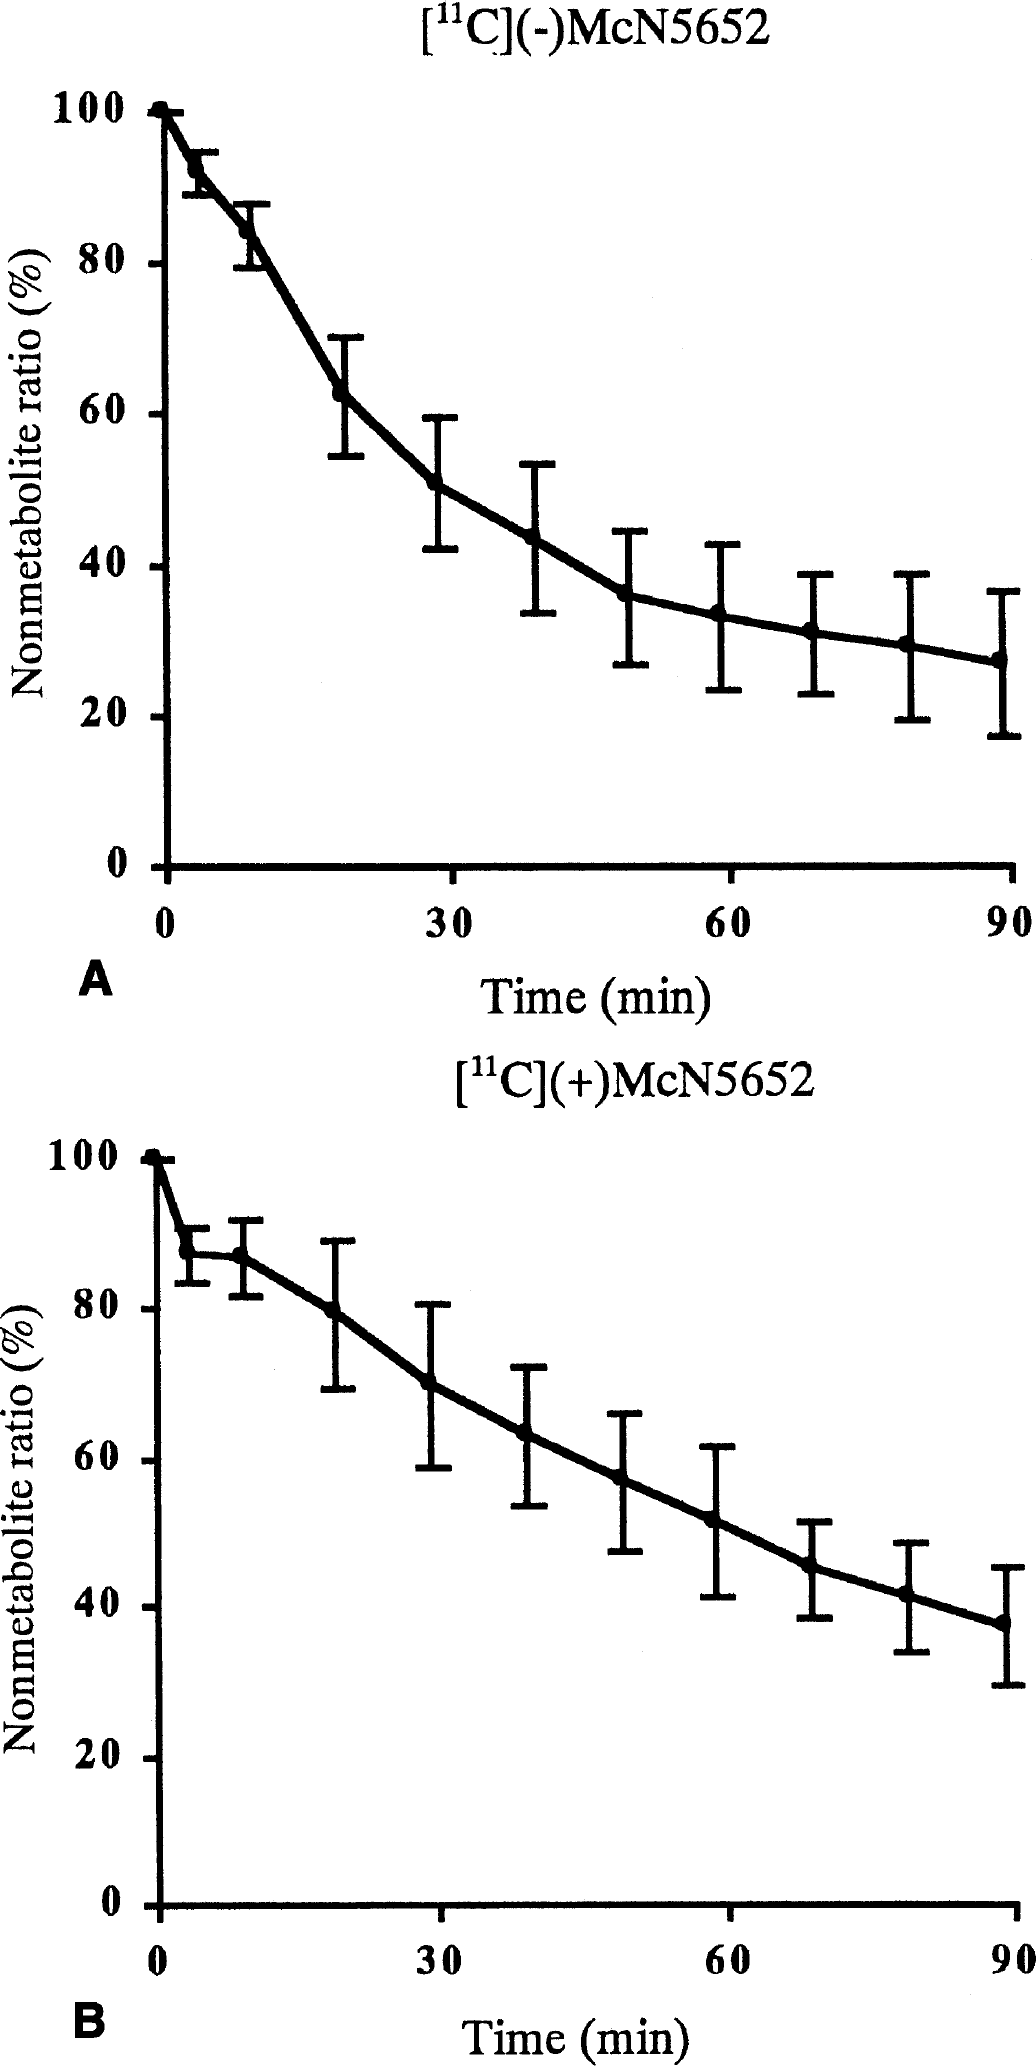
Time curve of the ratio of nonmetabolite ligand to plasma concentration for five studies in [11C](−)McN5652 (A) and [11C](+)McN5652 (B).
Nonspecific binding of [11C]McN5652
The time-activity curves of [11C](+)McN5652 in the thalamus did not reach the same level as those in the cerebellum in the patient taking 250 mg clomipramine per day (Fig. 4). The ratio of the area under the time-activity curve of the thalamus to cerebellum from 40 to 86 minutes was approximately 1.12. The ratios of the areas under the time-activity curves for 11 subjects are listed in Table 4. The mean ratio of [11C](−)McN5652 of three subjects with 50-mg clomipramine pretreatment was almost the same as that of [11C](−)McN5652 without clomipramine. The ratios of the thalamus to cerebellum using [11C](+)McN5652 after pretreatment with 50 mg clomipramine and the patients taking 100 or 250 mg clomipramine were very similar to that of [11C](−)McN5652.
Accumulated activity ratio of the thalamus to cerebellum
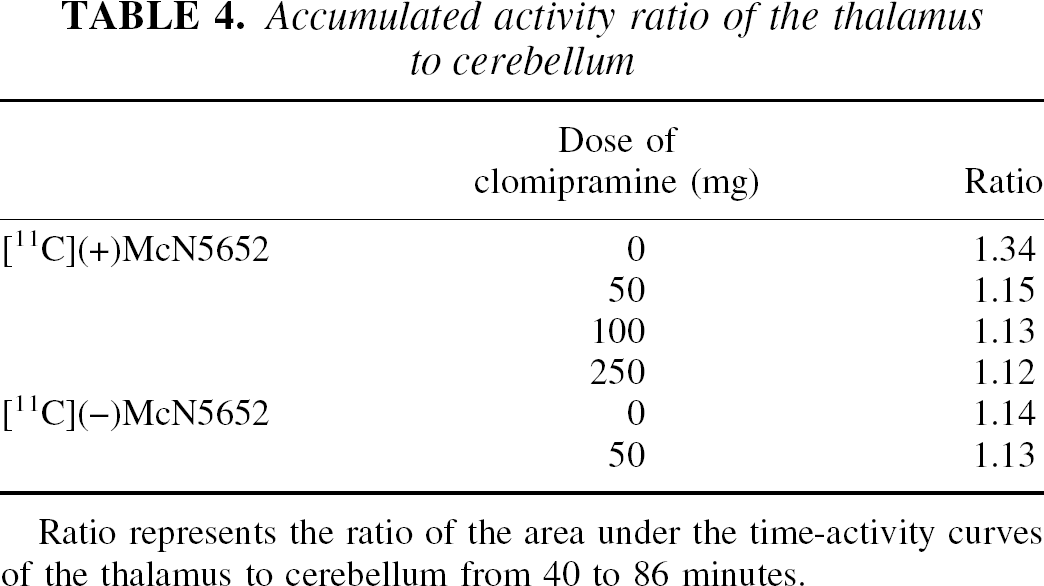
Ratio represents the ratio of the area under the time-activity curves of the thalamus to cerebellum from 40 to 86 minutes.
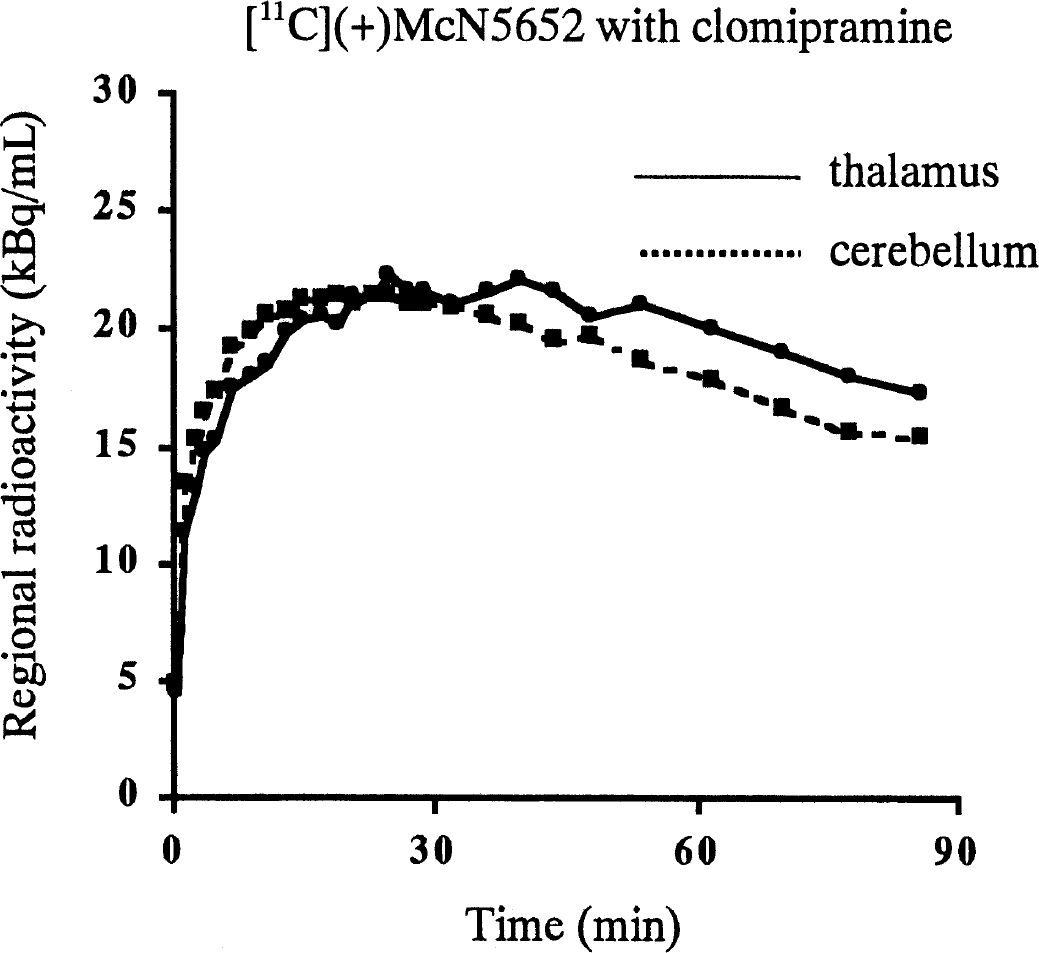
[11C](+)McN5652 time-activity curves of a patient taking 250 mg clomipramine. The injected radioactivity was normalized to 370 MBq.
Correlation between graphical method with and without arterial input function
The DVR estimated from the graphical method with arterial input function was compared with that estimated from the graphical method without arterial input function (reference method) with or without k2′, and the correlation is shown in Fig. 5. A strong correlation was found between the graphical methods with and without arterial input function. The slope of the regression curve for [11C](+)McN5652 with k2′ was 0.96, whereas that without k2′ was 0.16. The DVR estimated from the reference method without k2′ was smaller than that estimated with the arterial input function.
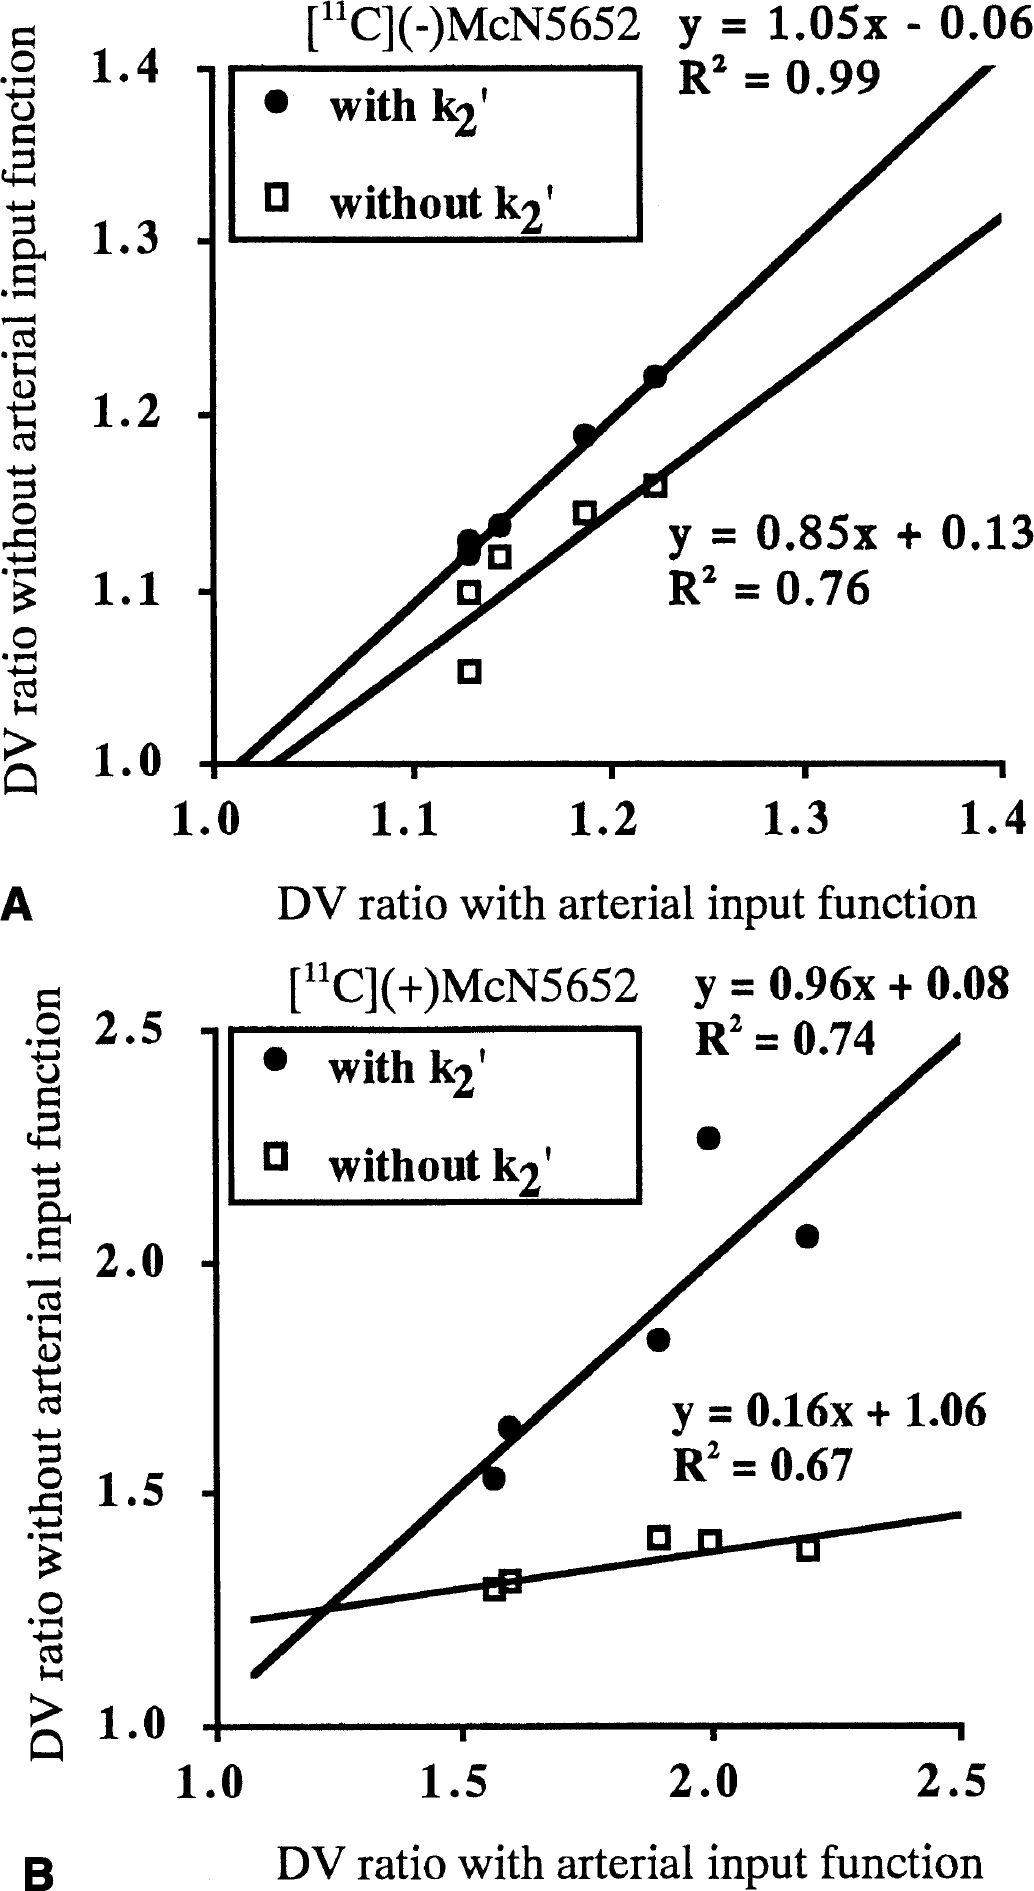
The relation between the DV ratio of the thalamus to cerebellum estimated from the graphical method with and without arterial input function and with and without k2.
Binding potential of the thalamus
The DVR was derived from the DV of the thalamus and cerebellum, which was estimated individually by the graphical method with arterial input function; BP was calculated from Eqs. 4 and 8 by using individual DVR(−) or mean DVR(−) values. Figure 6 shows BP estimated by the graphical method using Eq. 4 (without DVR(−)), Eq. 8 (with individual DVR(−) and with mean DVR(−)) compared with k3/k4 estimated by the NLS method. As a matter of course, BP estimated from the conventional method using Eq. 4 was larger than that estimated from our new method using Eq. 8. The BP from Eq. 4 ranged from 0.57 to 1.20, the mean value was 0.86, and COV was 31.3%; BP from Eq. 8 by using individual DVR(−) values ranged from 0.31 to 0.85, the mean value was 0.60, and COV was 39.7%. The BP from Eq. 8 by using mean DVR(−) ranged from 0.35 to 0.89, the mean was 0.60, and COV was 38.5%. The BP values estimated from Eq. 8 with individual or mean value of DVR(−) were almost the same.
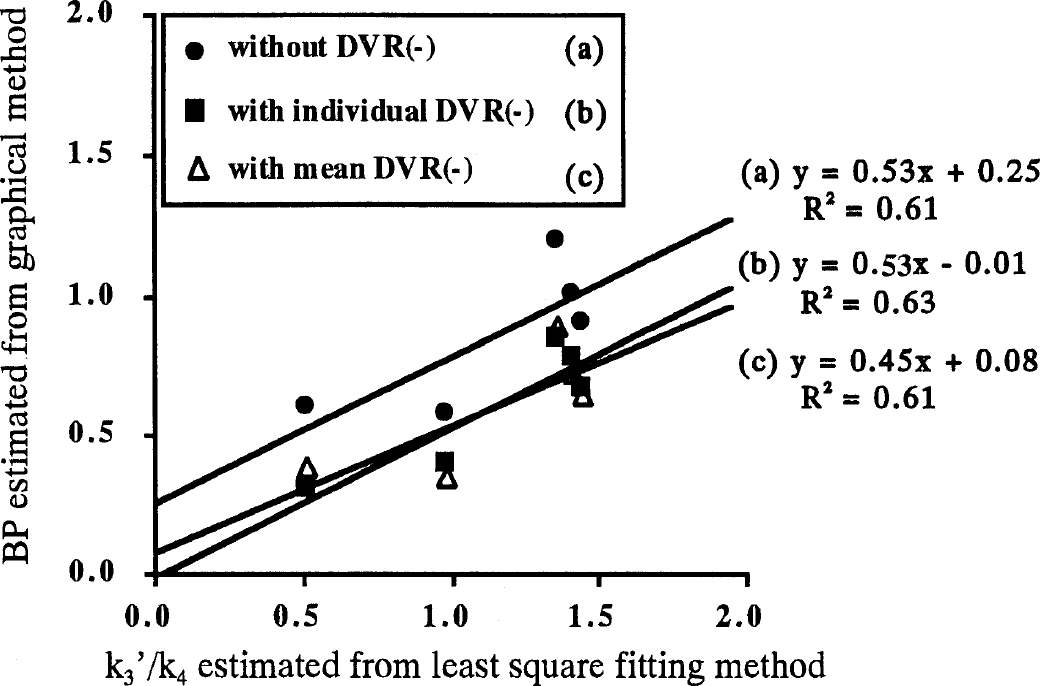
The relation between k3′/k4 estimated from the nonlinear least square method and the binding potential estimated from the graphical method with arterial input function for the thalamus with [11C](+)McN5652. In the graphical method, binding potential was estimated by DVR(+)-1 (without DVR(−), closed circles), DVR(+)/DVR(−)–1 (with individual DVR(−), closed squares), and DVR(+)/DVR(−)mean-1 (with mean DVR(−), open triangles).
The regression lines were estimated for these three methods (Fig. 6). The intercepts of two regression lines obtained by the new method (with individual and with mean DVR(−)) were near zero (−0.01 and 0.08), whereas the intercept of the regression line by the conventional method (without DVR(−)) was 0.25.
Reliability of parameter estimates
In the NLS method, the dispersion of K1/k2′, k3′/k4 and DVtotal became large as the noise increased, as shown in Fig. 7. The SD of parameter estimates for the thalamus with the two-tissue compartment model was much larger than that for the cerebellum with the one-tissue compartment model. When the noise level was 5%, COV of DVtotal for the cerebellum was 2% (Fig. 7A). However, for the thalamus, COV of K1/k2′, k3′/k4 and DVtotal was approximately 30%, 95%, and 80%, respectively, when BP was 0.79; COV of K1/k2′, k3′/k4 and DVtotal was approximately 30%, 65%, and 60%, respectively, when BP was 1.37. The mean value of K1/k2′ estimates for the thalamus became smaller (Fig. 7B), whereas k3′/k4 and DVtotal became larger (Figs. 7C and 7D) as noise increased.
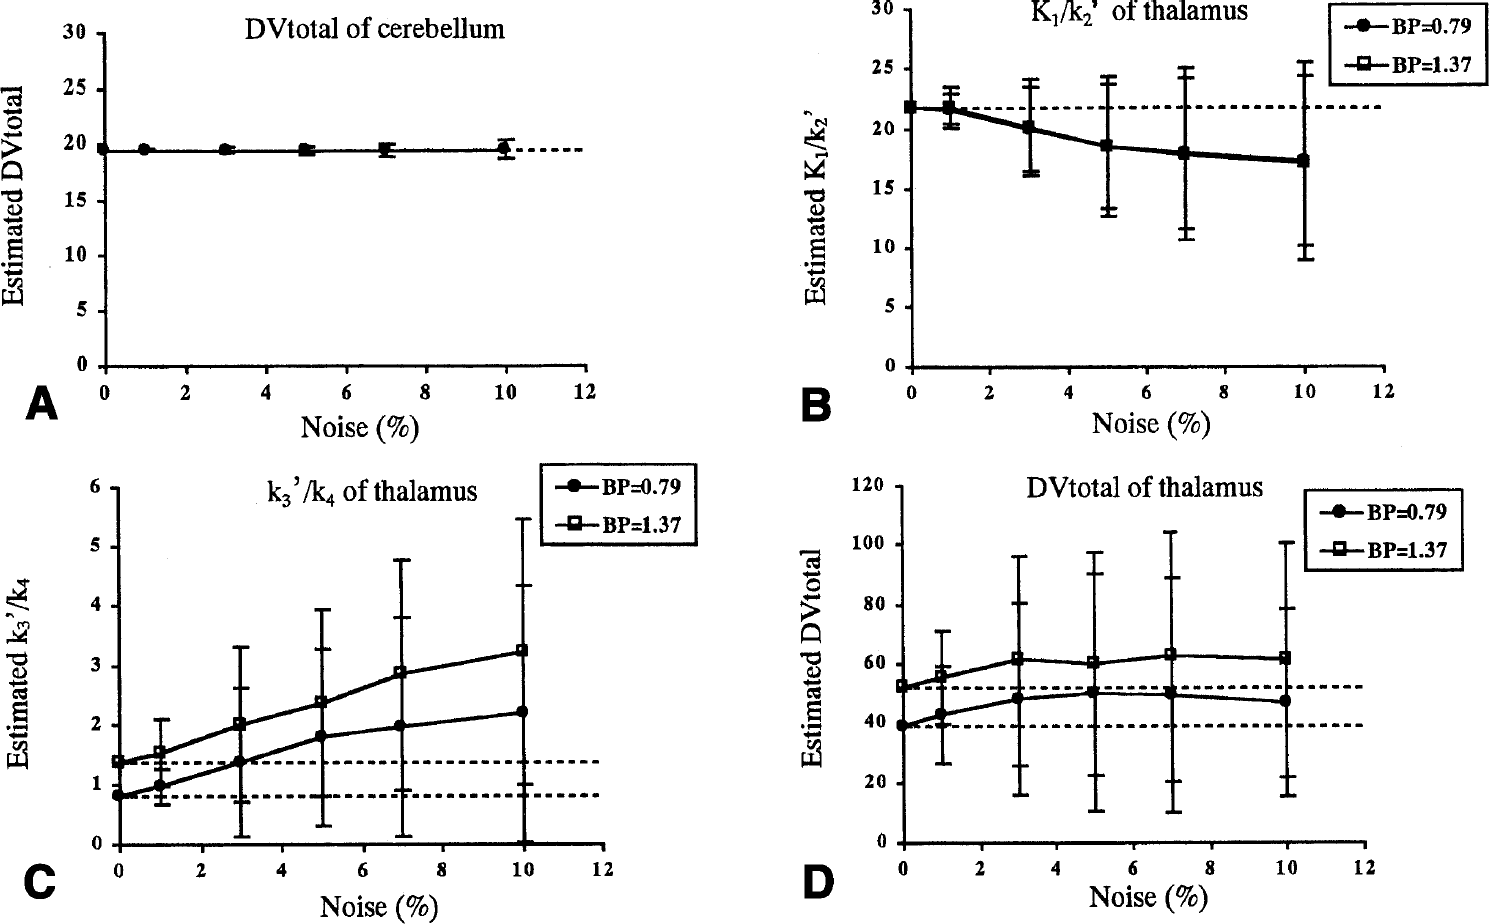
The relation between the noise and reliability of parameter estimates for the nonlinear least square method. Shown are the mean value and SD for the simulation data with noise at 0%, 1%, 3%, 5%, 7%, and 10%.
The relations between noise and reliability of parameter estimates using the graphical method with arterial input function are shown in Fig. 8. In the thalamus, the DVtotal estimates became small as noise increased (Fig. 8B). At a 5% noise level, mean DVtotal was 32.4 and COV was 9% when BP was 0.79, and mean DVtotal was 40.3 and COV was 12% when BP was 1.37. The tendency of underestimation became stronger as noise increased and BP became larger. When the noise level was 10%, the mean of DVtotal estimates was 28.1 and COV was 15% for the simulated data in which BP was 0.79, and the mean DVtotal was 31.5 and COV was 19% for the simulated data in which BP was 1.37; the mean DVR of these two cases was very similar. In the cerebellum, although the DVtotal became smaller as noise increased, the deviation was much less than that in the thalamus (Fig. 8A).
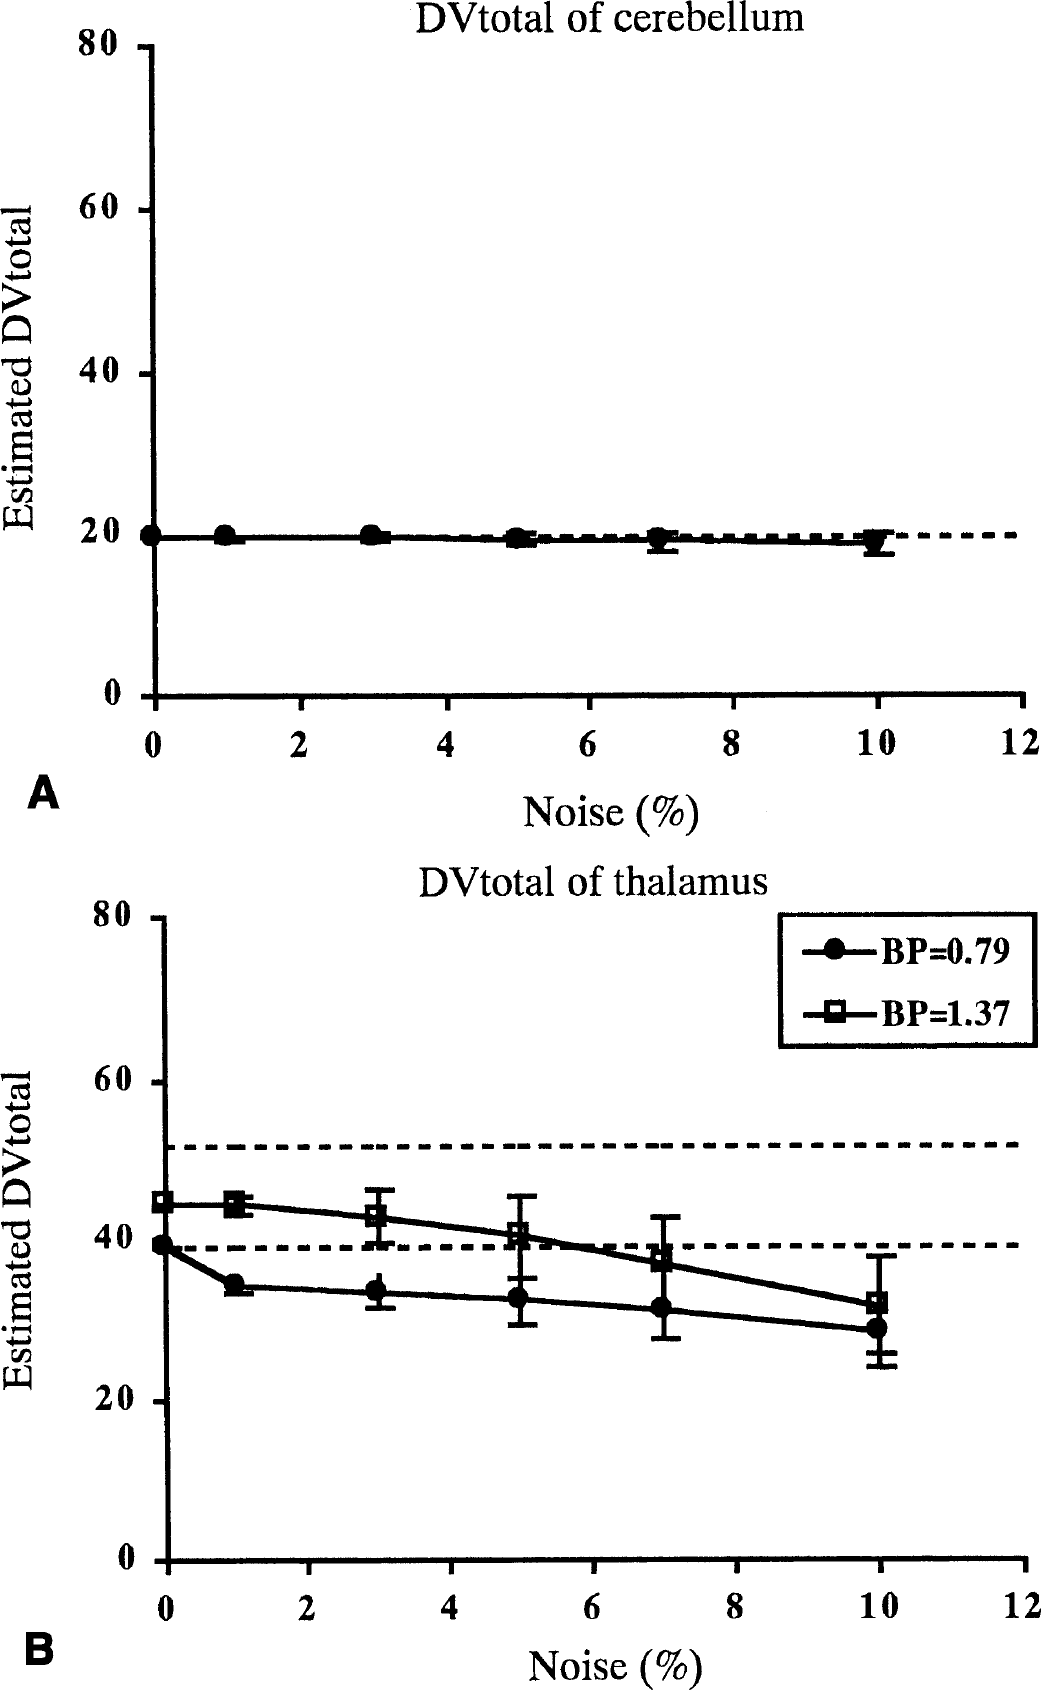
The relation between noise and reliability of DVtotal for the graphical method with arterial input function. Shown are the mean value and SD for simulation data with noise at 0%, 1%, 3%, 5%, 7%, and 10%. Dotted lines represent true values. DVtotal was estimated as the slope of the regression line by using points between 40 and 86 minutes. Relation for the
In the reference method with k2′, the mean of DVR estimates became smaller and SD became larger as noise increased (Fig. 9A), the same pattern as with the graphical method with arterial input function. At a noise level of 5%, mean DVR was 1.64 and COV was 12% when BP was 0.79, and mean DVR was 2.02 and COV was 15% when BP was 1.37. However, in the reference method without k2′, the mean DVR estimates did not change and SD did not increase as the noise level increased (Fig. 9B). At a 5% noise level, mean DVR was 1.35 and COV was 3% when BP was 0.79, and mean DVR was 1.51 and COV was 3% when BP was 1.37. As for the reference method without k2′, the DVR estimates were smaller than the true value even if the noise level was low.
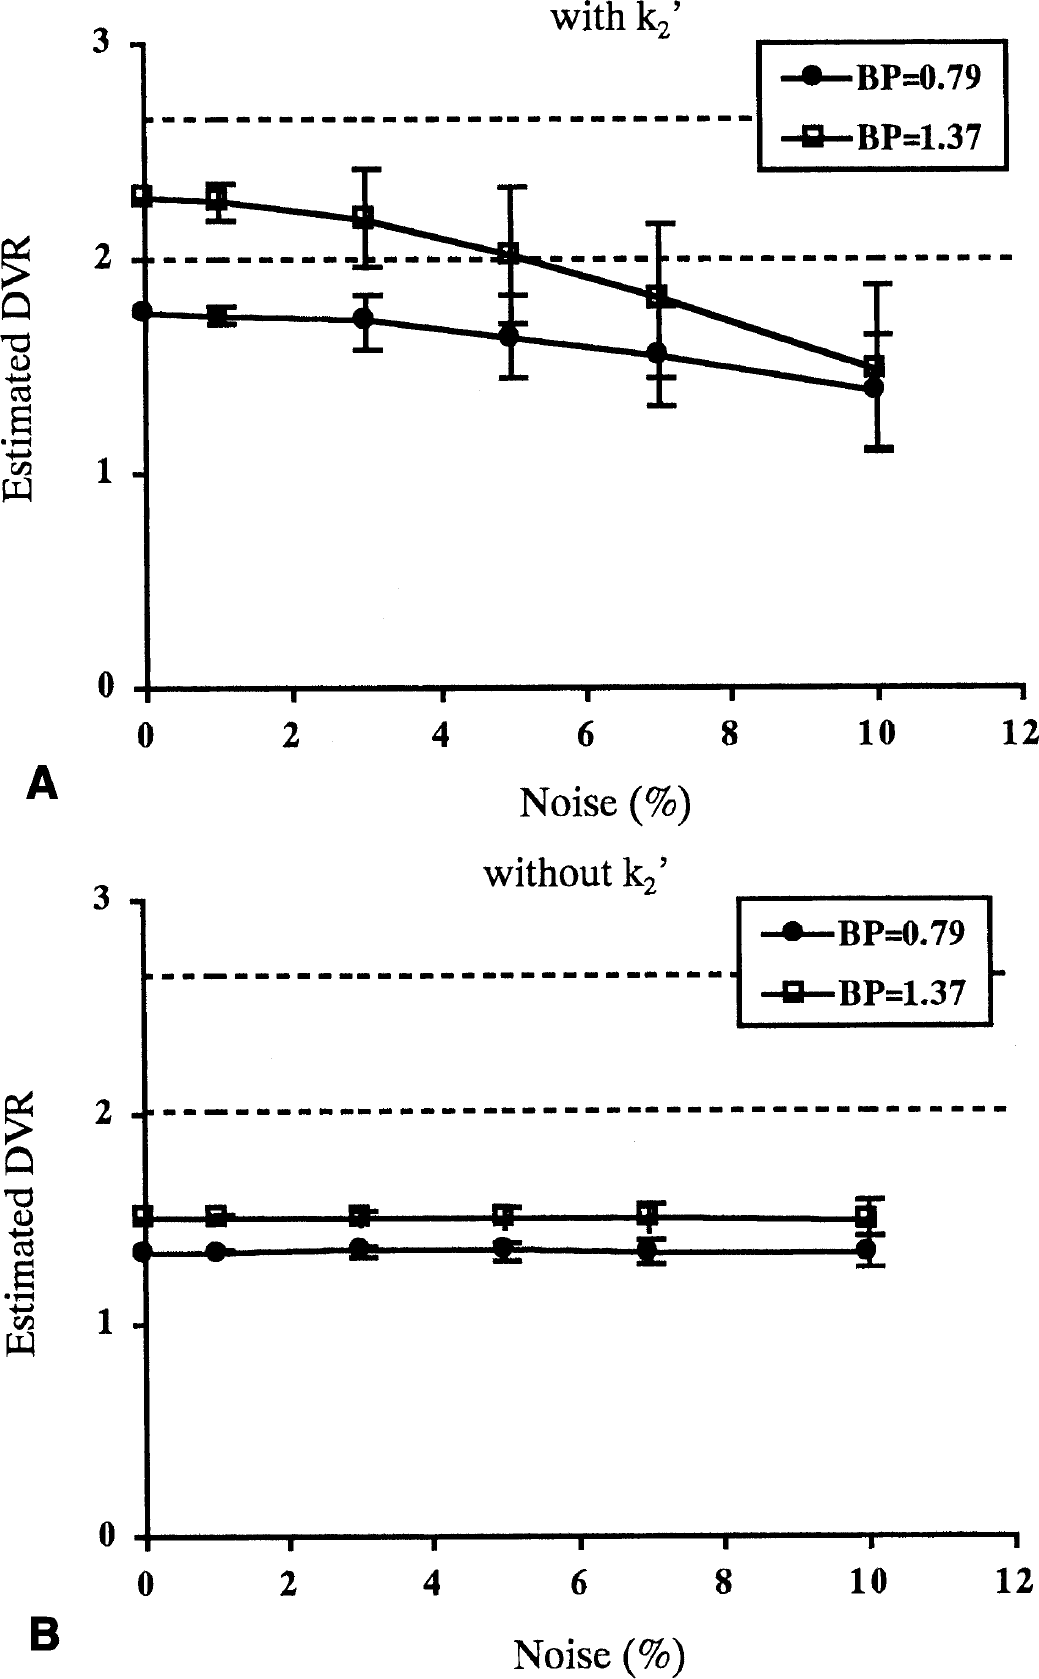
The relation between noise and reliability of parameter estimates for the graphical method without arterial input function with k2′, k2′ = 0.022
DISCUSSION
Effect of nonspecific binding on binding potential
The radioactivity concentration in the target region such as the thalamus includes the radioactivity of both nonspecific and specific binding. In dopamine D2 receptor studies, the amount of nonspecific binding is usually estimated from activity in a region without specific binding, such as the cerebellum. If the distribution of nonspecific binding is uniform or if the amounts of nonspecific binding for both specific and nonspecific regions are the same, BP is calculated using the conventional method of Eq. 4. In the [11C](+)McN5652 study, however, the time-activity curve of the thalamus did not meet that of the cerebellum with negligible specific binding sites for [1C](+)McN5652 in vivo either in healthy volunteers taking 50 mg clomipramine or in patients taking 100 or 250 mg clomipramine (Fig. 4). The thalamus-to-cerebellum ratio of [11C](−)McN5652 saturated with clomipramine did not differ from that of [11C](−)McN5652 without pretreatment (Table 4), suggesting that [11C](−)McN5652 has no specific binding component in vivo and the thalamus-to-cerebellum ratio of [11C](+)McN5652 saturated with clomipramine was similar to that of [11C](−)McN5652. The BP estimated by Eq. 4 does not become zero when k3′ equals zero, as shown in Fig. 6. This fact indicates that K1/k2′ in the thalamus is not equal to that in the cerebellum, and that the distribution of nonspecific binding of [11C](+)McN5652 may not be uniform in the brain.
However, Parsey et al. (2000) reported that the DVtotal of [11C](+)McN5652 was significantly higher than that of [11C](−)McN5652 in the cerebellum; we obtained a similar result (Tables 2 and 3). Moreover, the shapes of the time-activity curves of the cerebellum were different between [11C](−)McN5652 and [11C](+)McN5652 (Fig. 2), but similar between [11C](−)McN5652 and [11C](+)McN5652 with clomipramine (Fig. 4). The washout was quicker for [11C](−)McN5652 and [11C](+)McN5652 with clomipramine, as if there were specific binding in the cerebellum. However, we evaluated the DVtotal of [11C](+)McN5652 in the cerebellum both with and without clomipramine, and the values of the DVtotal of [11C](+)McN5652 in the cerebellum before and after the pretreatment with clomipramine were not changed (unpublished data). The change in the shape of the time-activity curves of the cerebellum may be attributed to the change in plasma input due to the high uptake of [11C](+)McN5652 in the lung (Suhara et al., 1998; unpublished data). In vitro binding studies with [3H]paroxetine have reported that the cerebellum has a small amount of 5-HTT (Laruelle et al., 1989) and that its density is approximately 27 fmol/mg protein, approximately 10% of that of basal ganglia (Backstrom et al., 1989). Because there was no difference between [11C](+)McN5652 distribution volumes with and without clomipramine, the cerebellum could be used as a practical reference region in vivo. However, it is still not an ideal reference region because of the regional differences of nonspecific binding. The difference of DVtotal in the cerebellum between [11C](−)McN5652 and [11C](+)McN5652 might be explained by the stereo-specificity for drug binding to plasma proteins and for transport across membranes (Lawrence et al., 1984; Jian et al., 1997; Farde et al., 1988). These data indicated that the absolute DV value of [11C](−)McN5652 was not desirable for determining the derivation of BP. However, the binding condition was assumed to be physiologically much closer within the brain tissue. Therefore, although DVtotal based on the plasma concentration cannot be used directly, the reference tissue method and DVR could be used to estimate the nonspecific binding in vivo.
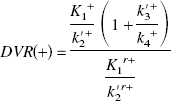
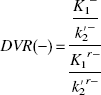
Instead of the conventional method used in Eq. 4 in which the regional difference of the nondisplaceable distribution volume is not considered, the difference of K1/k2′ between target and reference regions is taken into account in Eq. 8 (Fig. 6). Based on the finding that the thalamus-to-cerebellum ratio of [11C](+)McN5652 under the saturated condition was almost the same as that of [11C](−)McN5652 (Table 4), the regional difference of nonspecific binding can be corrected with the parameter of [11C](−)McN5652. The DVtotal of the thalamus for [11C](−)McN5652 was 1.16 times larger than that of the cerebellum (Table 2) and was similar among all subjects. Moreover, the DVtotal ratio of the thalamus to cerebellum for [11C](−)McN5652 was almost equal to that of [11C](+)McN5652 saturated by clomipramine. Assuming that the K1/k2′ ratio of the thalamus to cerebellum in Eq. 7 is equal to the DVR of [11C](−)McN5652, the BP is calculated from Eq. 8 as DVR(+)/DVR(−)–1. In the conventional method, the ratio of target K1/k2′ is regarded as equal to the reference K1/k2′. However, we found that K1/k2′ may differ between the target and reference regions. Using Eq. 8, BP will become zero when the value of k3′ is zero (i.e., without specific binding). In the human study, the intercept of the regression line between k3′/k4 estimated with the NLS method and BP estimated from Eq. 8 approached zero, as shown in Fig. 6.
In the simulation study, the DVR(+) estimated using the graphical method was smaller than the true value (Fig. 8), whereas k3′/k4 estimated using the NLS method became larger as noise increased (Fig. 7C). In the simulation study with a 3% noise level, mean DVR(+) was approximately four fifths of the true value by the graphical method, and mean k3′/k4 was approximately 1.5 times larger than the true value estimated using the NLS method. Therefore, the underestimation of BP is considered to be due to the effect of noise and the properties of the graphical method. Although BP estimated by the conventional method does not become zero when k3′ is zero, a relative evaluation of BP could be performed as a qualitative analysis because the regression curves obtained from Eqs. 8 and 4 are parallel to each other. However, this bias—the nonzero intercept—will introduce an error in some cases, such as in the evaluation of transporter occupancy.
Expanding our method for BP estimation, the occupancy of [11C](+)McN5652 can be estimated more precisely with the DVR of [11C](−)McN5652 by the following equation:
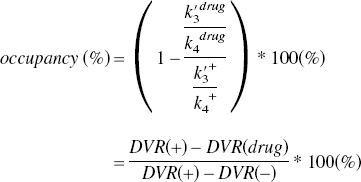
The disadvantage of this new method is that it requires [11C](−)McN5652 in addition to [11C](+)McN5652. However, in the present study with normal volunteers, the value of DVR(−) was very similar among subjects (1.16 ± 0.042), and the mean value can be used as that of DVR(−) for calculating BPs.
In this study, we used the thalamus as the target region because the uptakes of cortical regions were similar to that of the cerebellum, and the signal of specific binding was not enough for reliable quantification (Parsey et al., 2000; unpublished data).
Reference method without arterial blood sampling
The DVR estimated using the reference region with the k2′ value was compared with that obtained using the graphical method with arterial input function, and good agreement was observed between these two methods (Fig. 5). The reference method with k2′ needs the k2′ value of the reference tissue as an input parameter, and usually mean k2′ of the reference tissue is used in Eq. 2. Logan et al. (1996) investigated the variations in DVR with the change of k2′ value in a [11C]dMP study with simulation, and reported that variations of ±25% from the original k2′ value resulted in a change in DVR of 3% to 4%. In our simulation study with [11C](+)McN5652, the input k2′ varied between ±25% from the true k2′ value (k2′ = 0.022) and the change in DVR was 2% to 5%. This result indicates that the error in k2′ value does not significantly affect the DVR value. The SD of parameter estimates in the simulation study was under 15% at 5% noise, a reliability level almost the same as that of the thalamus with plasma input. However, DVR came to be underestimated as noise increased. This tendency was similar to the results with the plasma input.
Although the DVR estimated from the reference method without k2′ had good correlation with the results with plasma input, the value obtained was smaller than that obtained with plasma input (Fig. 5). In the simulation study, DVR without k2′ was also underestimated, even though the noise level was low (Fig. 9). The reference method without k2′ depends on the assumption that (DVR/k2′)Cr(T)/Ct(T) is small or reasonably constant (Logan et al., 1996, 2000). In this study with [11C](+)McN5652, (DVR/k2′)Cr(T)/Ct(T) was not small enough [(DVR/k2′)Cr(T)/Ct(T) >50], which could be the reason for the underestimation (Logan, 2000). However, there was good correlation between the graphical method with arterial input function and the reference method without k2′. Moreover, in the simulation study, the SD of parameter estimates for this method without k2′ was smaller than that for other methods, and the mean DVR did not become smaller when noise increased (Fig. 9). Therefore, the reference method without k2′ can also be useful for comparing the values of BP.
Reliability of estimated parameters
Regarding the analysis model of [11C](+)McN5652, some groups recommended the one-tissue compartment model (Szabo et al., 1999; Parsey et al., 2000) and others suggested the two-tissue compartment model (Buck et al., 2000). Although k3′ and k4 can be estimated individually by the NLS method with the two-tissue compartment model, these parameter estimates are very sensitive to noise. Deducing the noise level from residual error, the noise level of region-of-interest analysis for human data was 3% to 5%. At this noise level, the mean difference between the parameter estimate and true value of k3′/k4 was more than 50% and DVtotal was approximately 30% (Fig. 7). Moreover, the mean value of K1/k2′ estimates became smaller and k3′/k4 became larger than the true value as noise increased (Fig. 7). To improve the reliability of parameter estimates, parameter coupling is often used (Buck et al., 2000; Kegekes et al., 1997), though deciding on a fixed value is difficult with human data in which the true value is not known. Therefore, the NLS method with the two-tissue compartment model does not seem to be practical for the analysis of [11C](+)McN5652. In comparison with the two-tissue compartment model, parameter estimates with the one-tissue compartment model are more robust and less affected by noise. However, the one-tissue compartment model does not apply to the regions with specific binding. Goodness of fit of the one-tissue and two-tissue compartment models was evaluated in the thalamus using F test statistics, and the mean F value of five studies was 5.91. Because F > 3.35 means improvement of the fit, the two-tissue compartment model was considered suitable for the thalamus (Buck et al., 2000).
The graphical method is simpler than the NLS method, and the slope of the regression line represents DVtotal. However, DVtotal estimates became smaller with increasing noise (Fig. 8), and this tendency became more obvious as the value of k3′/k4 became larger. Nonetheless, dispersion was far less than that with the NLS method. Taken together, the graphical method appears to be a good method for [11C](+)McN5652 because parameter estimates are robust and little affected by noise.
CONCLUSIONS
We have presented a method for the quantification of [11C]McN5652 binding in which the regional difference of nonspecific binding was considered. The graphical method with k2′ without blood sampling is practical and most applicable for estimation of the DVR, because this method is more stable than NLS and does not need blood sampling. The BP estimated with the DVR of [11C](+)McN5652 and the correction with DVR(−) represents the most reliable parameter for the assessment of 5-HTT binding, but BP without correction with the DVR(−) value can also be used for the comparison of groups. However, to evaluate the transporter occupancy, the DVR(−) value is essential. 5-HTT occupancy can only be measured accurately using both (+)McN5652 and (−)McN5652, and the selective loss of 5-HTT can be measured by this method. However, if there were any changes in nonspecific binding in the disease process, interpretation of the estimated change of 5-HTT would require some caution.