
Abstract
We report a novel forward-model implementation of the full reference tissue model (fFTRM) that addresses the fast-exchange approximation employed by the simplified reference tissue model (SRTM) by incorporating a non-zero dissociation time constant from the specifically bound compartment. The forward computational approach avoided errors associated with noisy and nonorthogonal basis functions using an inverse linear model. Compared to analysis by a multilinear single-compartment reference tissue model (MRTM), fFTRM provided improved accuracy for estimation of binding potentials at early times in the scan, with no worse reproducibility across sessions. To test the model’s ability to identify small focal changes in binding potential using a within-scan challenge, we employed a nonhuman primate model of focal dopamine release elicited by deep brain microstimulation remote to ventral striatum (VST) during imaging by simultaneous PET and fMRI. The new model reported an unambiguously lateralized response in VST consistent with fMRI, whereas the MRTM-derived response was not lateralized and was consistent with simulations of model bias. The proposed model enabled better accuracy in PET [11C]raclopride displacement studies and may also facilitate challenges sooner after injection, thereby recovering some sensitivity lost to radioactive decay of the PET tracer.
Introduction
Considerable progress has been made in improving the dynamic information provided by receptor-targeted measurements by Positron Emission Tomography (PET) after the early studies based upon state measurements. Rather than comparing two physiological states that are well-separated in time using sequential PET scans, an intervention can be performed during a single dynamic scan.1,2 To produce interpretable and accurate estimates of changes in receptor binding, the timing of the challenge must be selected judiciously to enable estimation of baseline binding potentials from the early part of the tracer uptake curve while also providing sufficient data to quantify a change in binding later in the scan as signal quality deteriorates due to radiotracer decay. The simplified reference tissue model (SRTM,3,4) particularly using a linear-model implementation often denoted as MRTM, 5 is commonly used as a framework for analysis of within-scan challenges after incorporating a challenge term. 6 To describe changes in receptor occupancy resulting from drug infusions, this methodology is widely accepted for [11C]raclopride studies and can even yield some information about drug dynamics.7–10 SRTM was first described as a method for [11C]raclopride, which exhibits relatively fast receptor kinetics. The majority of published PET behavioral studies using [11C]raclopride have been analyzed by SRTM-based methods. 11
Dynamic PET studies, particularly those using [11C]raclopride, have been applied extensively in attempts to detect dopamine released in response to behavioral tasks, with reported changes in occupancy falling in range of approximately 2–10%; 11 by comparison, oral amphetamine produces an occupancy of nearly 15% in human striatum. 12 In the regime of small changes in occupancy associated with behavioral tasks as reported previously (<10% 11 ) the accuracy of SRTM may be insufficient, particularly using within-scans designs that quantify baseline binding potentials using limited data from the beginning of the scan. SRTM assumes a fast-exchange approximation for specific binding and dissociation to collapse nondisplaceable and specifically bound ligand into a single compartment, whereas a full reference tissue model (FRTM13,14) avoids this approximation but suffers from poor identifiability in the absence of any constraints. Differences between these models become larger at lower values of binding potentials (BPND) and dissociations constants (k4) and during rapid changes in tissue radioligand concentrations, 15 which are pronounced early in a scan. Simulations informed by literature rate constants suggest that the “one-tissue” approximation of SRTM can lead to errors exceeding 10%,16,17 even with [11C]raclopride. 15
To address the fast-exchange approximation of SRTM, we previously described an inverse solution for FRTM (rFRTM) that modifies MRTM basis functions with an additional term but otherwise proceeds using iterative linear model methods. 15 However, methods that employ noisy data-derived basis functions5,15 suffer from several drawbacks: cost functions become invalid model discriminators because they are partially driven by regressor noise, and solutions may be biased by model inversion in the presence of noise and nearly colinear regressors. Rather than rely upon cost functions for model identification, rFRTM approached the problem of model identification by selecting k4 to minimize regional variance of the reference-region efflux rate constant (k2′). This method proved hard to automate, and fits could be particularly bad at certain values of k4. Thus, this report describes a novel implementation of FRTM, which was developed in response to observed limitations in SRTM and rFRTM. The new method was evaluated on experimental [11C]raclopride data in the context of within-scan challenges, which quantify baseline binding potentials using a limited amount of data and therefore provide a more severe test on model accuracy than sequential bolus studies.
Model bias is expected to be a monotonic function of baseline binding levels,15,17 and simulations suggest that the single-compartment approximation can induce bias on the order of 10–15% in estimations of challenge-induced occupancy over a 5-fold range of binding potentials, 15 as encountered in the striatum in the current study. Conversely, receptor concentrations generally are symmetric across hemispheres within only minor asymmetries on the order of 10% reported. 18 Hence, we expect nearly symmetric analysis bias in BPND, and we developed a lateralized stimulation model to help disentangle BPND-dependent analysis bias from a biological response.
In this study, we employed targeted unilateral electrical microstimulation (EM) of the ventral tegmentum area (VTA) in a nonhuman primate (NHP) in order to elicit focal lateralized dopamine release in the nucleus accumbens as way of testing the accuracy of [11C]raclopride PET measurements of dopamine release. Dopaminergic innervation along the mesolimbic pathway connecting VTA and nucleus accumbens is well established, and several prior studies have utilized VTA-EM in NHP to demonstrate either behavioral reinforcement, 19 its role in perceptual learning,20,21 fMRI activation,19,22 or dopamine release. 23 As a correlate for PET displacement, our study provided concurrent fMRI measurements of the VTA-EM response. Thus, this animal model, in conjunction with simultaneous PET and fMRI, represents a unique opportunity to test PET analysis methodologies and estimate effect sizes that may apply to human behavioral studies.
Methods
Model development: fFRTM
To avoid matrix inversion and to provide nearly noiseless model estimates for use in cost functions, we opted to proceed with a forward model implementation FRTM (fFRTM) based upon a denoised reference region time vector as the starting point of the model. Denoising was accomplished by locally estimated scatterplot smoothing (LOESS), i.e. the Savitzky–Golay filter, 24 using a smoothing scale that increased linearly versus time to maintain sufficient accuracy during rapid changes in concentration at early time points while providing sufficient smoothing at noisier late time points. In fact, results were not highly dependent upon the amount of smoothing, but this method provided a nearly noiseless starting point for forward-model calculations and facilitated sub-frame interpolation, as described below. As in our prior rFRTM model, fFRTM stabilized voxel-wise analysis by using a single global dissociation rate (k4) derived from data. Hence, the model was simplified much like SRTM, except that the dissociation time constant (1/k4) was changed from zero in SRTM to a value determined from the data in fFRTM. Supp. Figure 1 compares a forward and inverse FRTM solution using the same fixed rate constants to illustrate the way that noise in data-derived regressors can corrupt the quality of fits, producing unreliable cost functions.
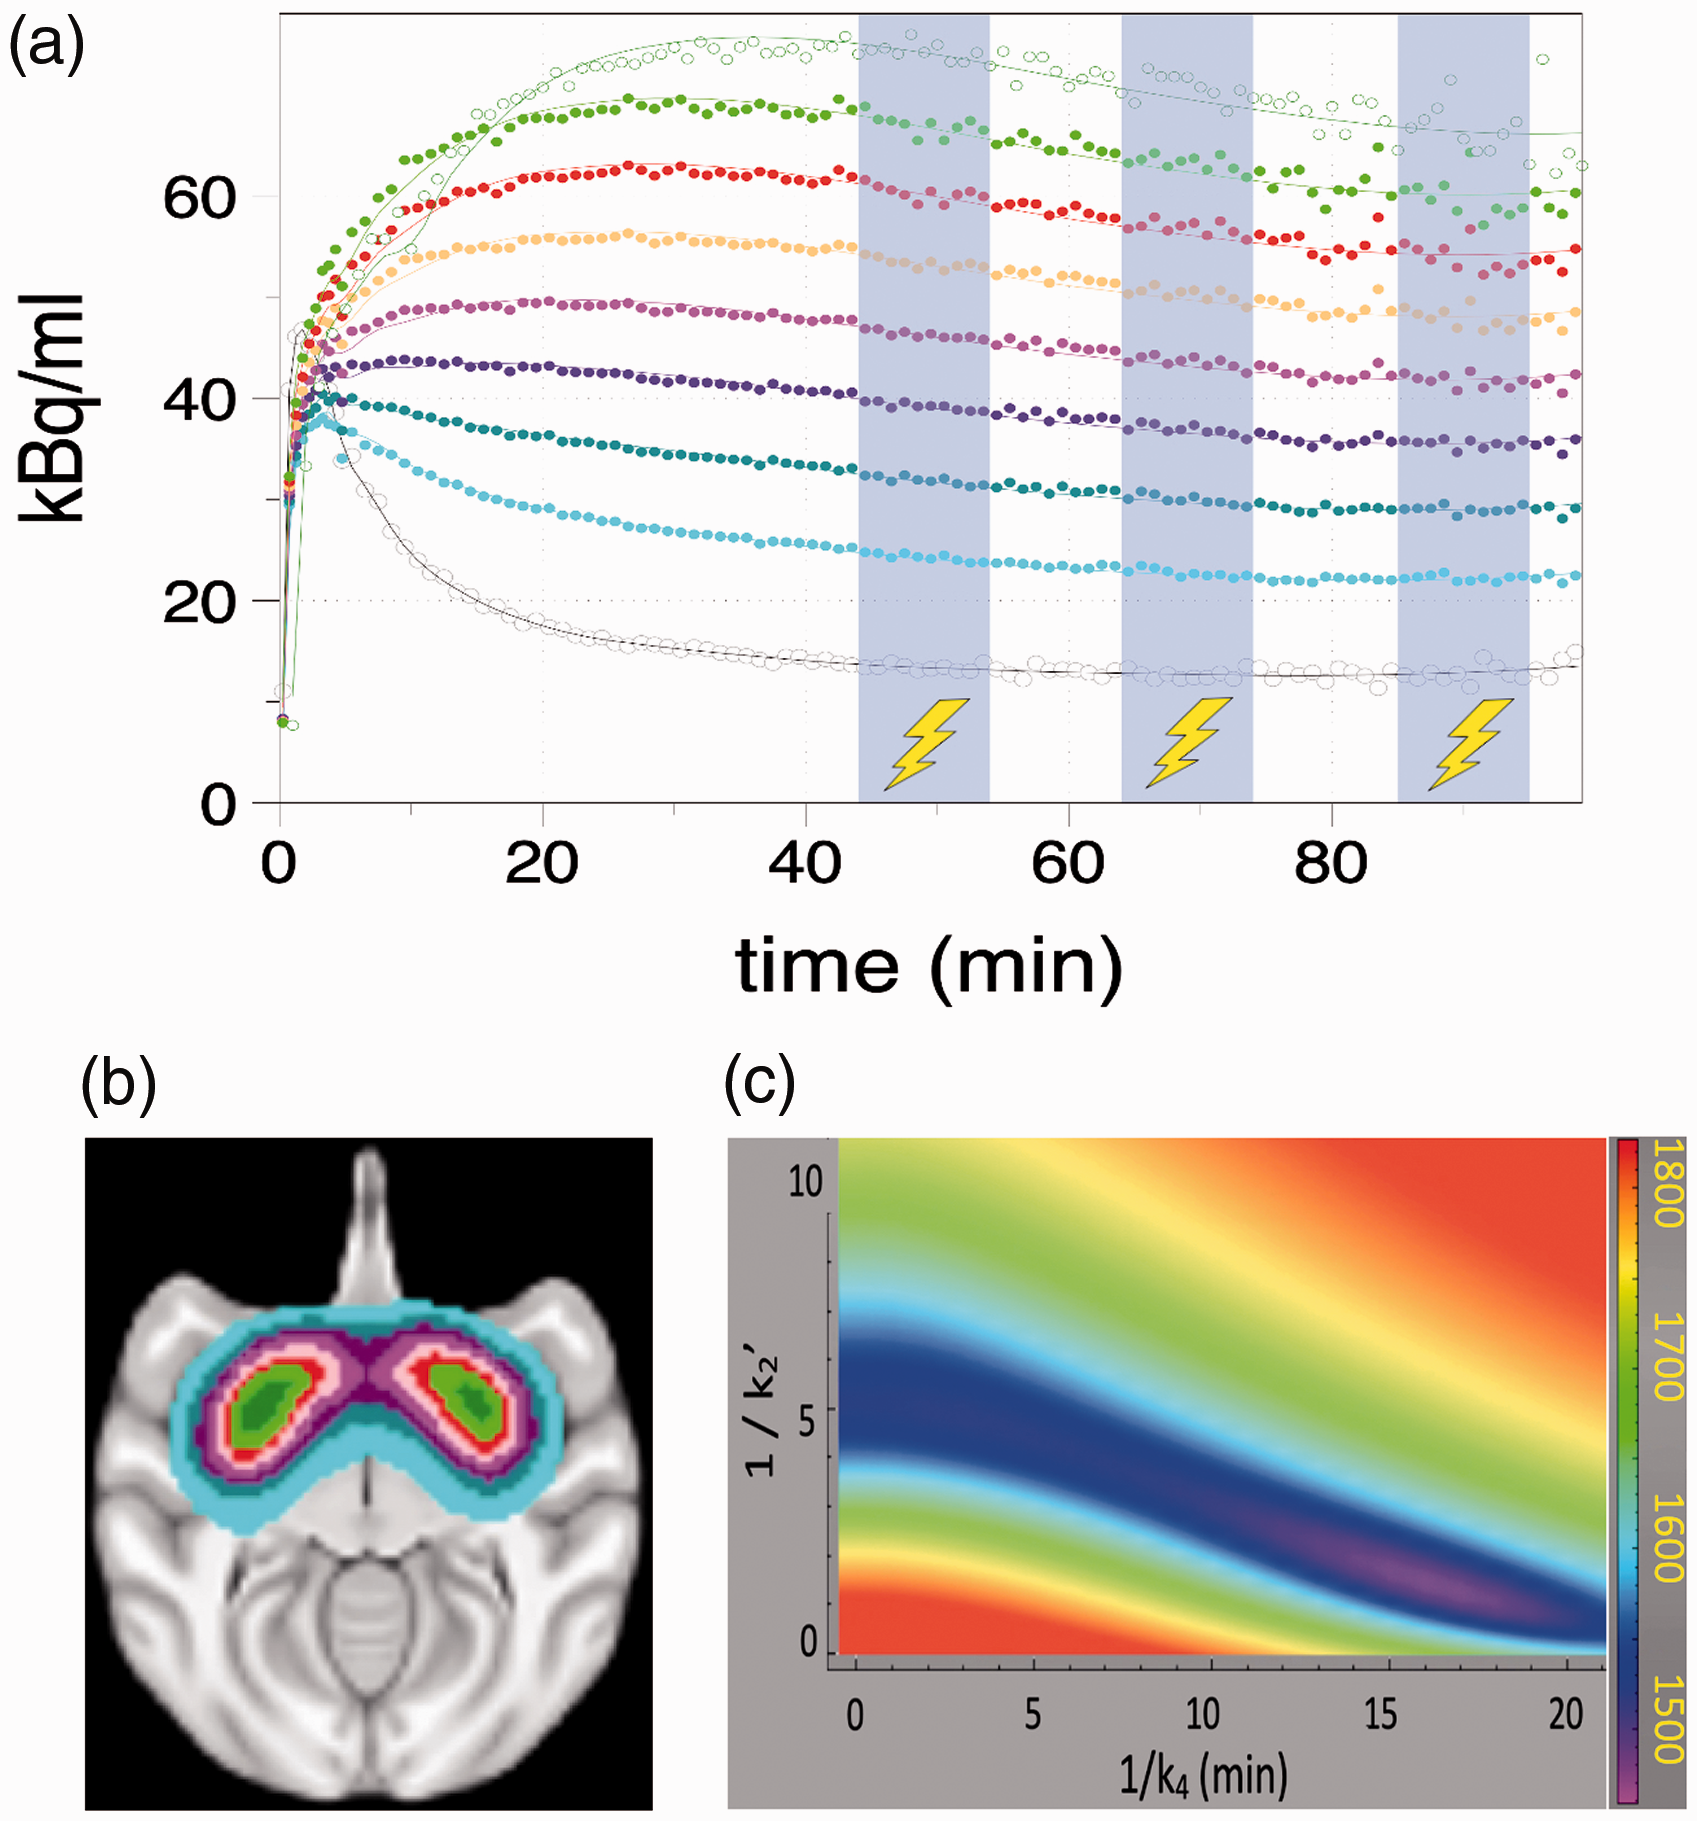
Time-activity curves from one representative experimental study at different levels s of BPND. Blue shaded regions show periods of deep brain microstimulation of VTA. Gray points (bottom curve) show reference region data and a smoothed curve to the data (gray line) that was employed as input to the forward model calculations. Other points and curves show striatal data and fits with colors matched to the regions in the brain image (b). A grid search in the parameters k4 and k2′ generates contours describing the AIC (c), which determines the best global values of the two parameters at the minimum of the contour.
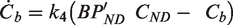
To implement a forward-model, we solved the FRTM first-order differential equations using a simple forward Euler method. To reduce inaccuracies associated with integration of binned data, we used a time step equal to 10% of each PET frame duration based using LOESS interpolation, and we verified that smaller integration bins did not appreciably change results. Initial conditions assumed that the tissue concentration in the first sub-bin was comprised of non-displaceable (CND) radioligand, with a specifically bound concentration (Cb) of zero. We modelled the response to a challenge using a simply step change in binding potential at the onset of the challenge. The general parameter set included three values per time vector


We hypothesized that SRTM would not represent the best global fit using a single value of k2′, because the 3-parameter SRTM method obtains best fits by shifting the value of k2′ versus BPND by biasing the underlying parameters (k2′ = k2/R1), whereas a suitable choice of k4 can reduce BPND-dependent bias in k2′,
15
Thus, we determined the best global values of the k4 and k2′ by optimizing the goodness of fit to a set of regions that were generated automatically to span binding potentials of interest. Using a first-pass analysis based upon MRTM2 5 to provide a map of BPND, regions were generated by grouping voxels with similar BPND. Very low binding potentials carry little information about k4, which is a property of the specifically bound compartment, so we employed a threshold on BPND (0.5) and then grouped voxels into BPND-dependent regions above threshold using a BPND step size of 0.5. Subsequently, the regions were analyzed using a two-dimensional grid search in k4 and k2′ to find the pair that jointly minimized the Akaike Information Criteria (AIC) for the set, where AIC is defined using the number of time bins (n) and the variance between the model and fit (σ).

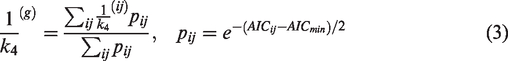
Because AIC can be related to model likelihood using an exponential function, we opted to derive the best global time constants 1/k4(g) as a weighted summation over the two dimensional grid, with indices (i,j) corresponding to steps in the two-dimensional space of 1/k4 and 1/k2′.
Subsequently, we determined a single value of k2′ from a 3-parameter fFRTM analogously to the method used by SRTM26 and MRTM5 using all regions employed in the calibration step of equation (3).
Given the best rate constants determined in the calibration step, parametric maps of BPND, R1, and ΔBPND were generated by nonlinear optimization: a single coarse grid search provided parameter starting values, which were refined by a repetitive iterative gradient descent method. The iterative nature of the methodology greatly increased computation time relative to the simple one-step inversion of MRTM2, but parallel computing reduced analysis time per study to just a few minutes.
Animal model and data acquisition
Chronic electrical microstimulation of VTA in a baboon (female, 6 years old) was achieved following methods previously described. 19 A microstimulation electrode array consisting of 23 microwires was implanted unilaterally in the right VTA using peri-operative MRI-guided navigation, and the electrode coupling was embedded within an accessible chamber attached to a headset on the baboon, followed by several weeks of healing before onset of experiments. Supp. Figure 2 shows the spatial relationship of the microwire array, VTA, and ventral striatum (VST), which is more than 1 cm removed from the site of microstimulation. All procedures were approved by and complied with the regulations of the Institutional Animal Care and Use Committees (IACUC) at Massachusetts General Hospital, and are reported according to ARRIVE guidelines.
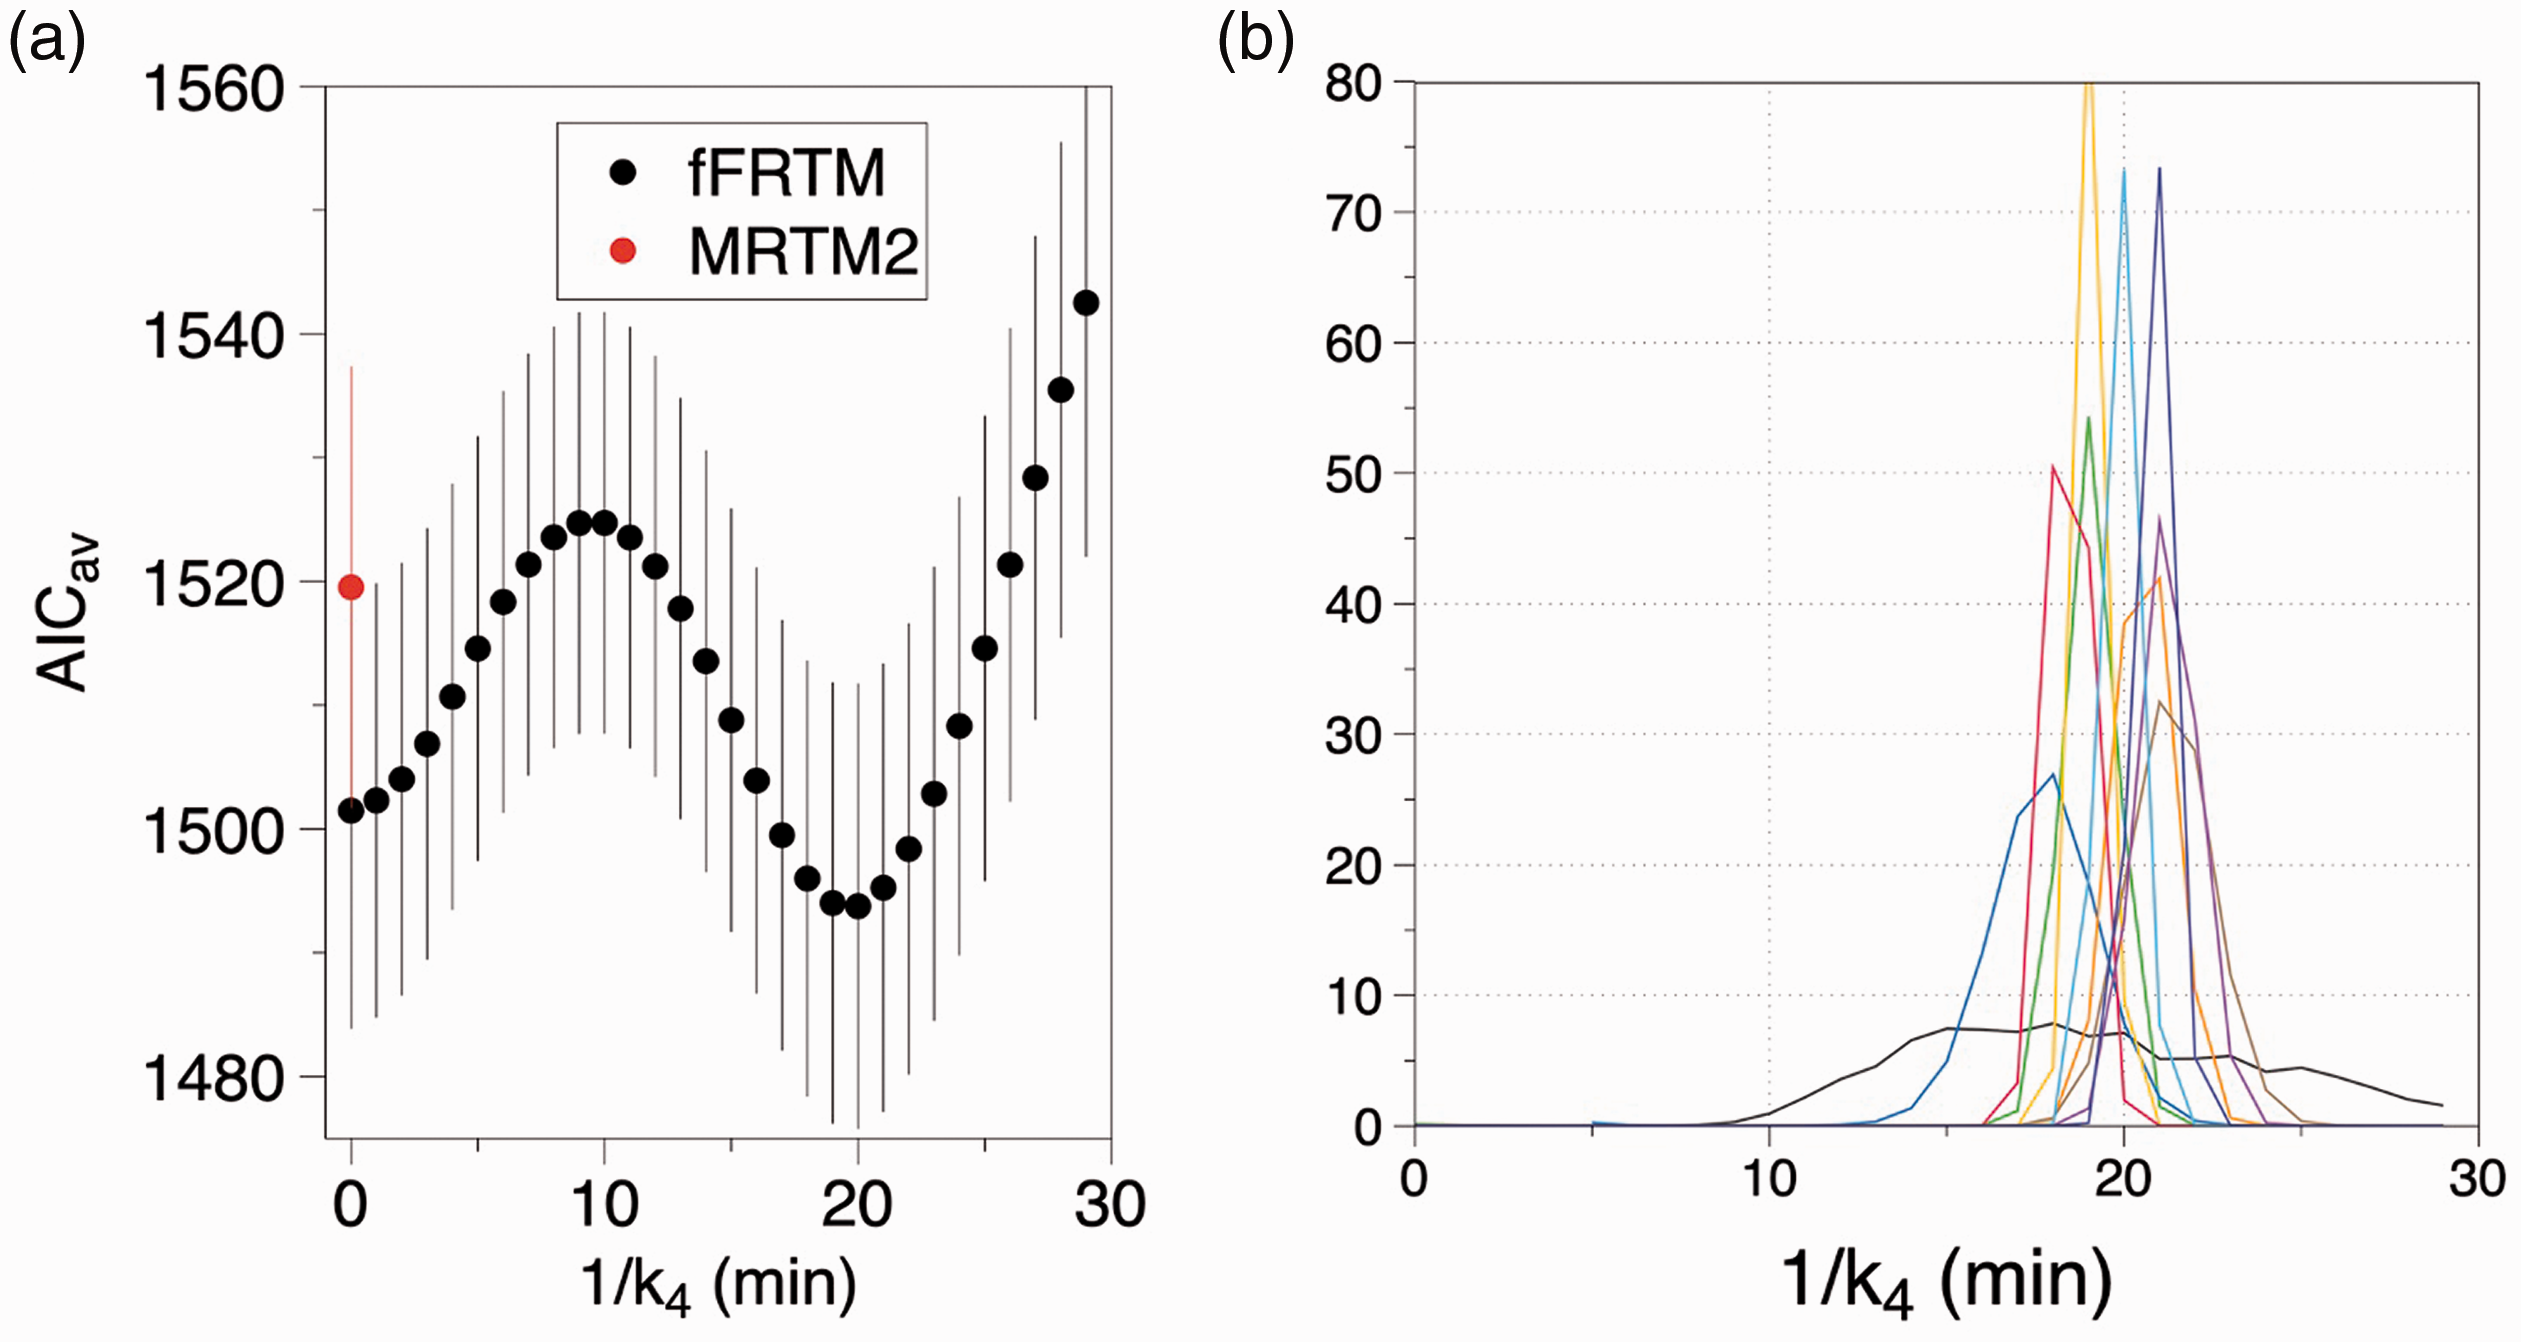
(a) The average one-dimensional projection of minimum AIC along the 1/k4 axis across sessions shows a minimum at about 16 min (a, black); this defines a peaked probability distribution for model selection (a, blue). Probability distributions for all scans define mean ± SD of 16.9 ± 3.0 min (b). SRTM corresponds to 1/k4 = 0.
Data were collected over a period of 3.5 months following implantation of electrodes. All imaging—composed of 10 scans over 6 sessions—occurred in an animal anesthetized by isoflurane (1–1.5%) following induction by a ketamine/xylazine mixture. Two scans were performed on four of the days, with 2–3 hours between scans. Repeated sessions occurred with no less than 12 days between studies.
Stimulations were performed using a World Precision Instruments (Sarasota, FL, USA) DS8000 stimulator. Stimuli consisted of pulse trains applied at 100 Hz for 200 ms using a constant current of 1 mA applied to two microwires. Stimuli were repeated in a nested block design, with pulse trains delivered using interpulse intervals of 8 or 16 sec throughout time blocks that persisted for at least 10 min with no less than 25 min of stimulation per scan. The onset of stimulation occurred between 30 and 44 min, except for one scan which commenced at 25 min. Scan designs are summarized in Table 1, with a typical design depicted in Figure 1(a). All scans lasted 100 minutes and included within-scan microstimulation after an initial baseline period.
fMRI and PET data were collected simultaneously using a head-only PET/MR scanner consisting of a 3 T MRI scanner and an MR-compatible PET insert (BrainPET; Siemens AG, Healthcare Sector). A vendor-supplied human head radiofrequency transmit coil was used in conjunction with a smaller and more sensitive PET-compatible monkey 8-channel receiver coil.27 To increase fMRI sensitivity,28 we injected 10 mg/kg ferumoxytol (Feraheme; AMAG Pharmaceuticals) intravenously and used a multi-slice echo-planar imaging sequences with TR/TE = 3000/22 and 2-fold acceleration in the phase-encoding direction.29 When using ferumoxytol, fMRI signal reflects changes in CBV. The PET radioligand [11C]raclopride was administered as a bolus plus constant infusion with the aim of reaching an equilibrium condition prior to the challenge time. List-mode data were sorted in the line-of-response space and reconstructed with the ordinary Poisson-ordered subsets expectation maximization algorithm. Data were binned using 30 sec frames for the first 5 min and 1 min frames thereafter. Each frame was reconstructed with 2.5-mm isotropic voxels to match the resolution of the scanner.30
Studies (n = 10) were performed across 7 days over 15 weeks using subtle variations in a deep brain microstimulation paradigm. Derived parameters from data analysis included two time constants and maps of BPND and the stimulation-induced change in BPND. Regional definitions: ipsilateral ventral striatum (iVST) was defined from the fMRI response; contralateral VST (cVST) was defined as a symmetric ROI in the opposite hemisphere, and contralateral putamen (cPut) was defined from the nonhuman primate atlas.
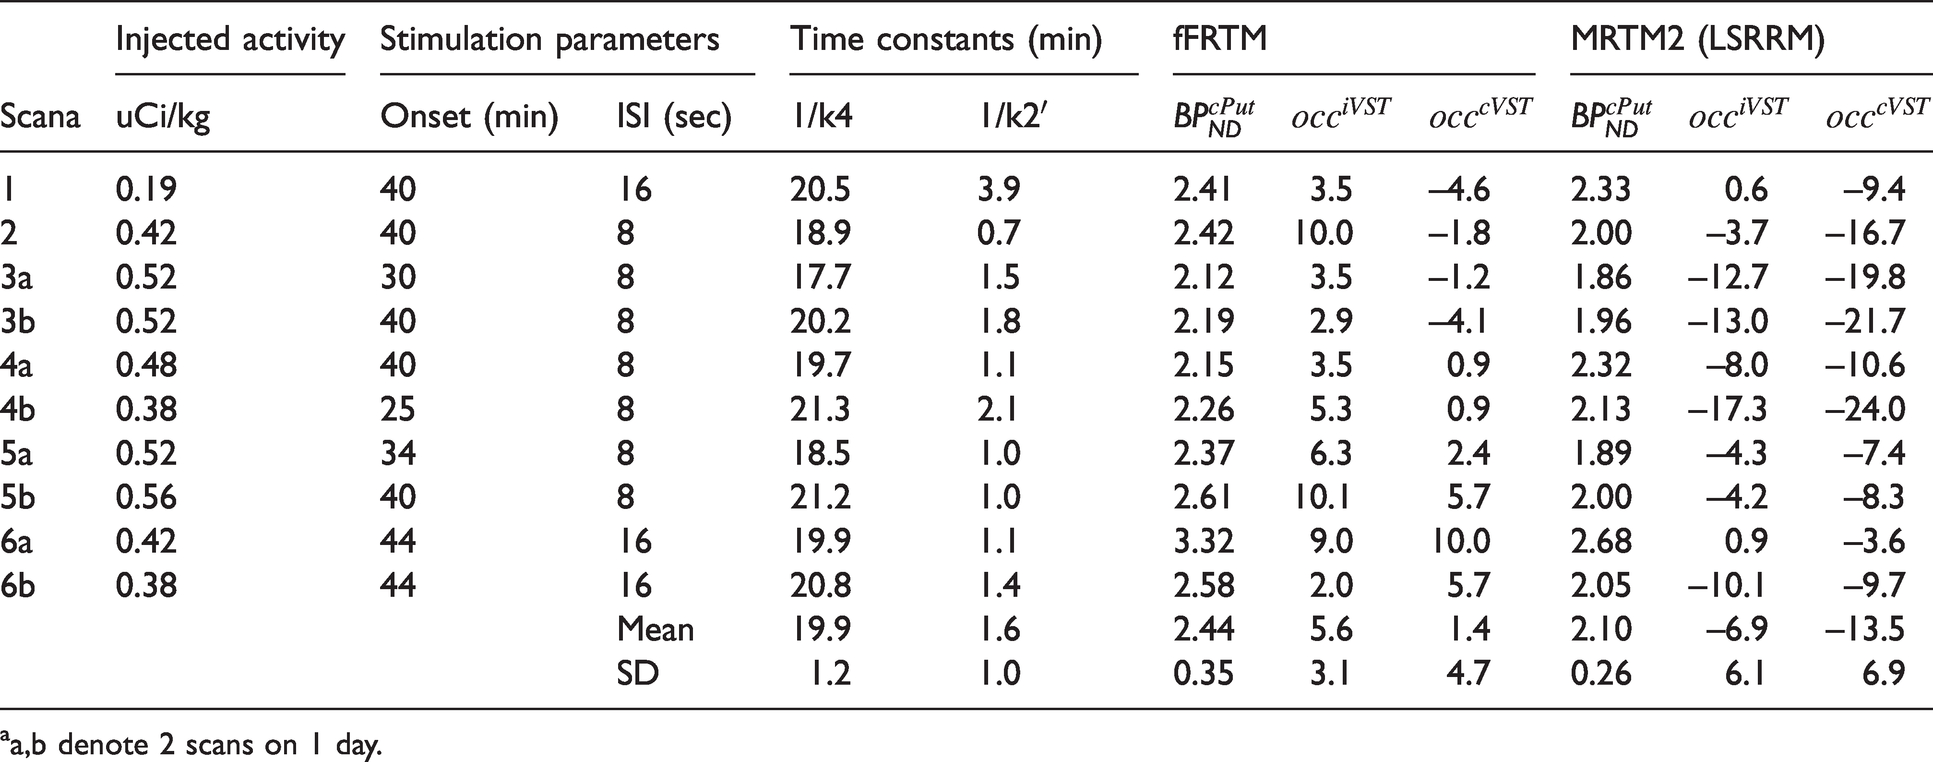
aa,b denote 2 scans on 1 day.
Following acquisition, reconstructed PET and MR Data were aligned to a multi-subject baboon MRI template 31 based upon each session-specific T1-weighted MRI anatomical volume. To help delineate regions of interest (ROIs) to inform the results, we employed a macaque atlas 32 aligned to the baboon template. Isotropic spatial smoothing of 6 mm was applied to functional data from both modalities. fMRI analysis use an impulse response model to fit data based upon the timing of individually applied stimuli, and PET analysis used a single step change in binding potential, as indicated in equation (1).
Analyses were performed at the level of individual voxels and also using ROIs. For voxel-wise analysis, a random-effects model evaluated PET and fMRI results across sessions using a summary-statistics approach, 33 and statistical maps employed a threshold of p < 0.01 after applying a Bonferroni correction to account for multiple comparisons according to the number of independent resolution elements above a BPND threshold of 0.5, with a final value of p < 1.5 × 10⁻⁴. For ROI analyses, the striatum was subdivided into eight independent and lateralized ROIs based upon anatomy (Supp. Figure 3), and the statistical threshold employed a Bonferroni correction for eight comparisons. Additionally, we defined a lateralized region based upon the fMRI response above the statistical threshold, and compared this against the corresponding region in the contralateral hemisphere.
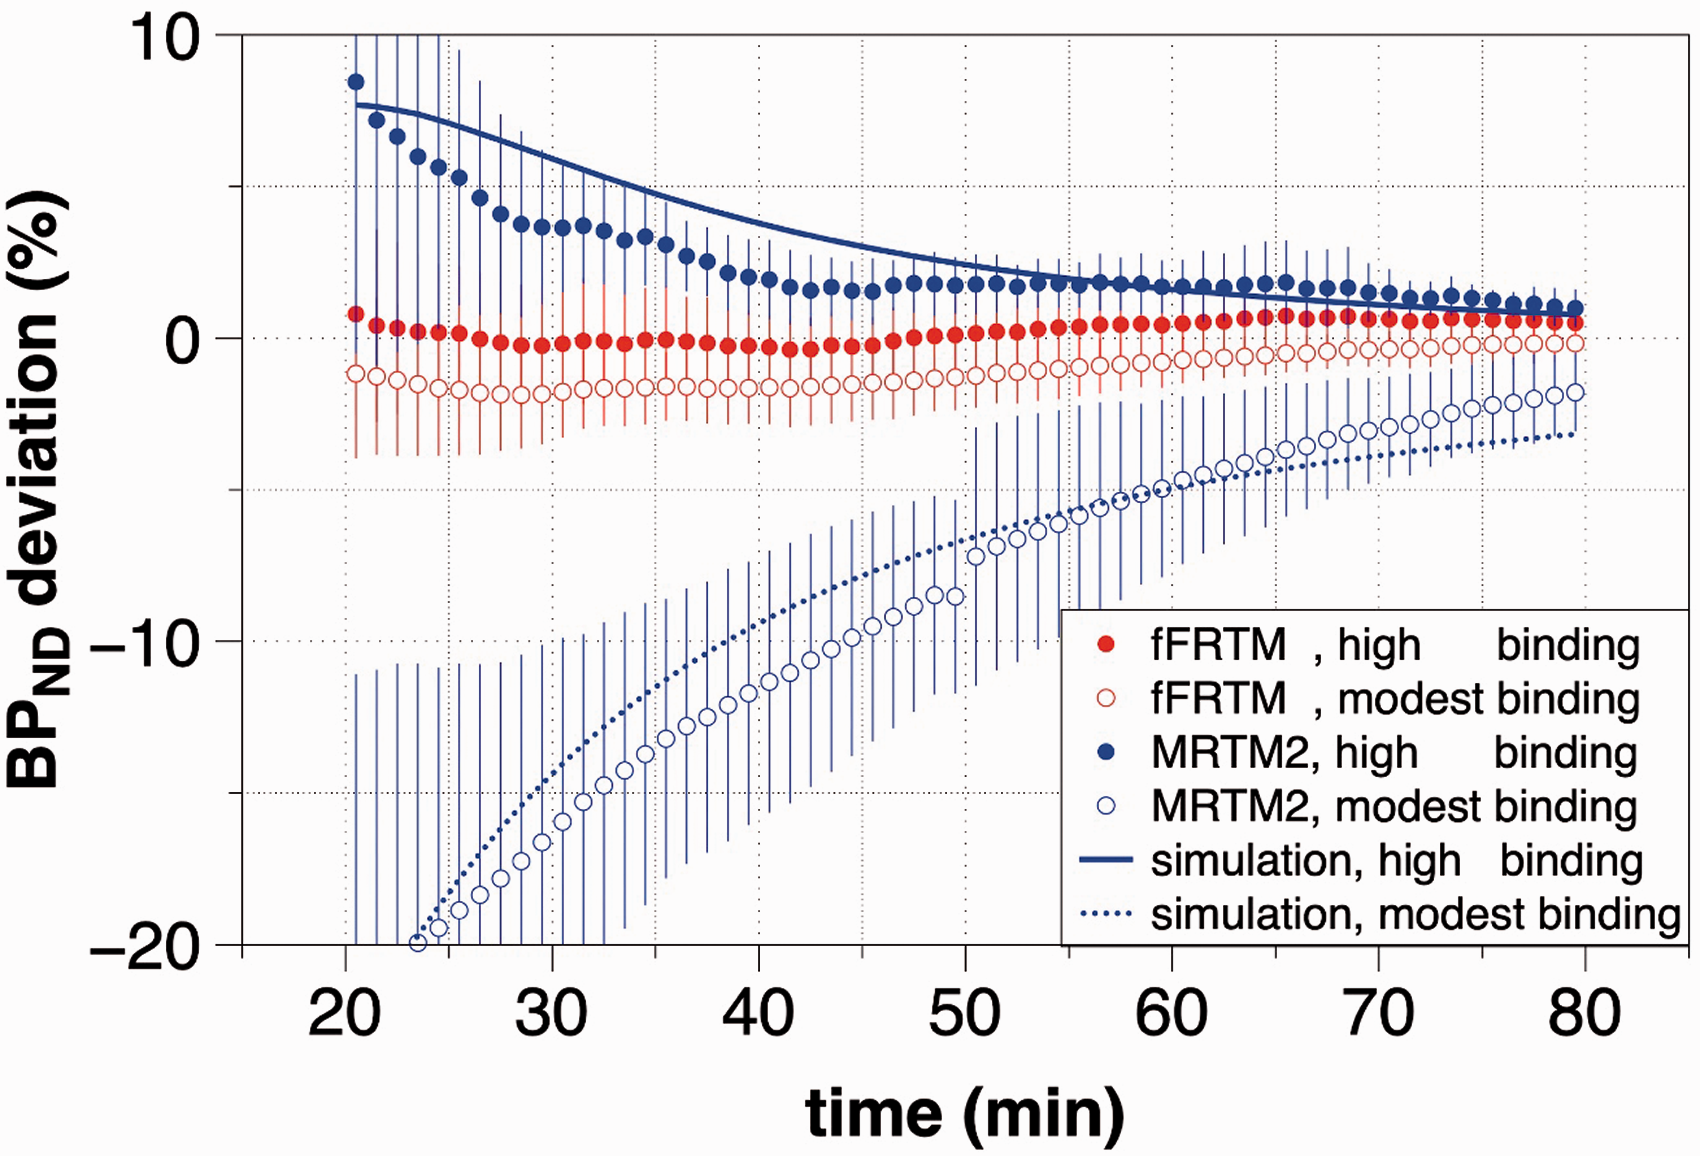
The percentage deviation (mean ± SD) of BPND relative to the value obtained by analysis of a full TAC is shown versus the maximum time used for TAC analysis. Using the proposed fFRTM method, values converged within 2% using only 20 min of data, whereas MRTM2 reaches this level of convergence after 40 min at high values of BPND and much later at lower values of BPND. Lines indicate simulations that use FRTM as a forward model informed by parameters (BPND, R1, k2′) determined from data and MRTM2 as an inverse model to analyze the simulated data. Slow convergence of the MRTM2-based method is shown to be a result of the fast-exchange approximation that produces a one-compartment analysis model.
Comparisons: fFRTM vs MRTM2
PET analysis employed 1) a forward-model (fFRTM) analysis using globally optimized values of the two rate constants, as described previously, and 2) an MRTM-based implementation using a linear model formulation
6
reduced to two baseline parameters.
5
In both models, the challenge was described using a single parameter describing a step change in binding potential that occurred at the challenge onset time. Each model fit three parameters: two parameters describing the baseline state (R1, BPND) and an additional parameter to capture a change in binding potential (ΔBPND). The MRTM method is denoted as “MRTM2 5” throughout the manuscript to emphasize that the fast-exchange approximation underlying single-compartment methods mostly affects estimation of BPND (rather than the challenge term) using within-scan designs, but the model also closely matches “LSRRM
6
”, albeit with a different form of the challenge term and two rather than three parameters to describe the pre-challenge baseline. Three comparative analyses were performed on data, using n = 10 scans for all comparisons, with all error bars reflecting standard deviation:
Simulations
Although primary indicators of model efficacy were derived from data, we also performed simulations to demonstrate that MRTM2 performance fell within expectations based upon predictions formulated from fFRTM. Specifically, we employed simulations to explain the slow rate of convergence for MRTM2-based estimates of BPND as demonstrated in Figure 3. Simulations employed FRTM as a forward model, with inputs informed by real data, and MRTM2 as an inverse model. As input to forward-model simulations, we used average data-derived values of the reference region time vector and average parameter values (k4, k2′, R1) determined by fFRTM, and we simulated data by a forward model according to equation (1). We then employed analysis of the simulated data using MRTM2 with a constant value of k2′ derived from analysis of real data using 3-parameter MRTM according to the standard method. 5
Results
Model selection
The bottom curve of Figure 1(a) (gray open circles) shows a cerebellum time vector from one session together with a local polynomial fit that forms the starting point for Euler integration. Figure 1(b) shows automatically generated regions in baboon brain that vary according to BPND, using colors matched to the temporal data of Figure 1(a). A two-dimensional contour of AIC values versus the two global time constants (Figure 1(c)) identifies the best global fit as a minimum in AIC; in this session, the best fit occurred at a point of about (1/k4 = 16 min, 1/k2′ = 1.5 min). Note that a set of highly correlated values for k4 and k2′ (blue region in Figure 1(c)) exists that produces goods fits to data, with the single-compartment instance (1/k4 = 0, SRTM) corresponding to much a much higher value of 1/k2′ (5 min) than the best-fit instance of fFRTM, as previously predicted by simulations and shown in experimental data. 15
Figure 2(a) shows the average minimum AIC project along the 1/k4 axis across sessions for fFRTM (black points) and MRTM2 (red points); each point represents the best fit versus 1/k2′ for that value of 1/k4. Consistent with the representative contour of AIC values shown in Figure 1(c), good fits were obtained at all values of 1/k4 below 25 min. A forward-model single-compartmental analysis (1/k4 = 0) produced slightly better fits than the MRTM2 method, presumably due to fact that noisy data-derived basis functions are employed in MRTM2. For each session, AIC values define likelihood distributions for model selection; Figure 2(b) shows model probabilities for all sessions. Although MRTM2 and the fFRTM produced fits that were only subtly different, in each session the best instance of fFRTM outperformed MRTM2 and the single-compartment forward model using the AIC goodness of fit criteria. Averaged across repeated sessions, values of 1/k4 and 1/k2′ were 19.9 ± 1.2 and 1.6 ± 1.0, respectively. Determination of these time constants exhibited some dependence upon the threshold and step size of BPND in selection of ROIs (see Figure 1), but the session-averaged best value of 1/k4 fell within the range 16–20 min in all cases tested.
Stability
When using a within-scan challenge, one of the most important criteria to quantify is the minimum time from the from the start of radiotracer injection to achieve acceptable convergence for the baseline value of BPND; challenges applied at earlier times sacrifice accuracy, whereas challenges applied at later times sacrifice sensitivity due to radioactive decay. Figure 3 compares the stability of BPND estimates versus time using the analyses based upon MRTM2 and fFRTM. Because bias in a single-compartment method is expected to vary systematically versus BPND, voxels were clustered into regions of moderate binding (1 < BPND <3) or high binding (BPND > 3) in the basal ganglia contralateral to the VTA implant for this test. At high and moderate values of BPND, MRTM2 analyses converged within 2% of the final value at 40 and 75 min, respectively, and the range of deviation did not drop below 5% until 65 minutes. Conversely, fFRTM analyses converged within 2% at just 20 minutes and the range of deviation never exceeded 2%. Note that below 20 minutes, both methods produce highly unstable results (not shown), consistent with the notion that the slow rate of specific binding enforces a time threshold on parameter identification using any technique. Hence, fFRTM offers a better combination of accuracy and sensitivity than the standard method.
Reproducibility
The quality of voxel-wise maps in baboon brain did not differ appreciably between MRTM2 and fFRTM methods, and test-retest reproducibility across sessions using baseline (pre-challenge) data was similar. Representative maps of baseline parameters (BPND, R1) from a single session are depicted in Figure 4(a); Supp. Figure 4 shows additional brain slices and also noisy single-session maps of ΔBPND. Figure 4(b) quantitively compares a test-retest metric of BPND reproducibility (SNR, or the inverse of percent variability) in baboon brain across repeated sessions at a voxel level. At the highest values of BPND, reproducibility for both MRTM2 and fFRTM methods was better than 10%. Across an anatomical delineation of whole putamen contralateral to the stimulated hemisphere, test-retest reproducibility for the MRTM2 and fFRTM methods was 12% and 14%, respectively (Table 1). We also computed reproducibility for the eight anatomical ROIs of Supp. Figure 3 (not shown), and the average values across regions were 12% and 14% for the MRTM2 and fFRTM methods, respectively.
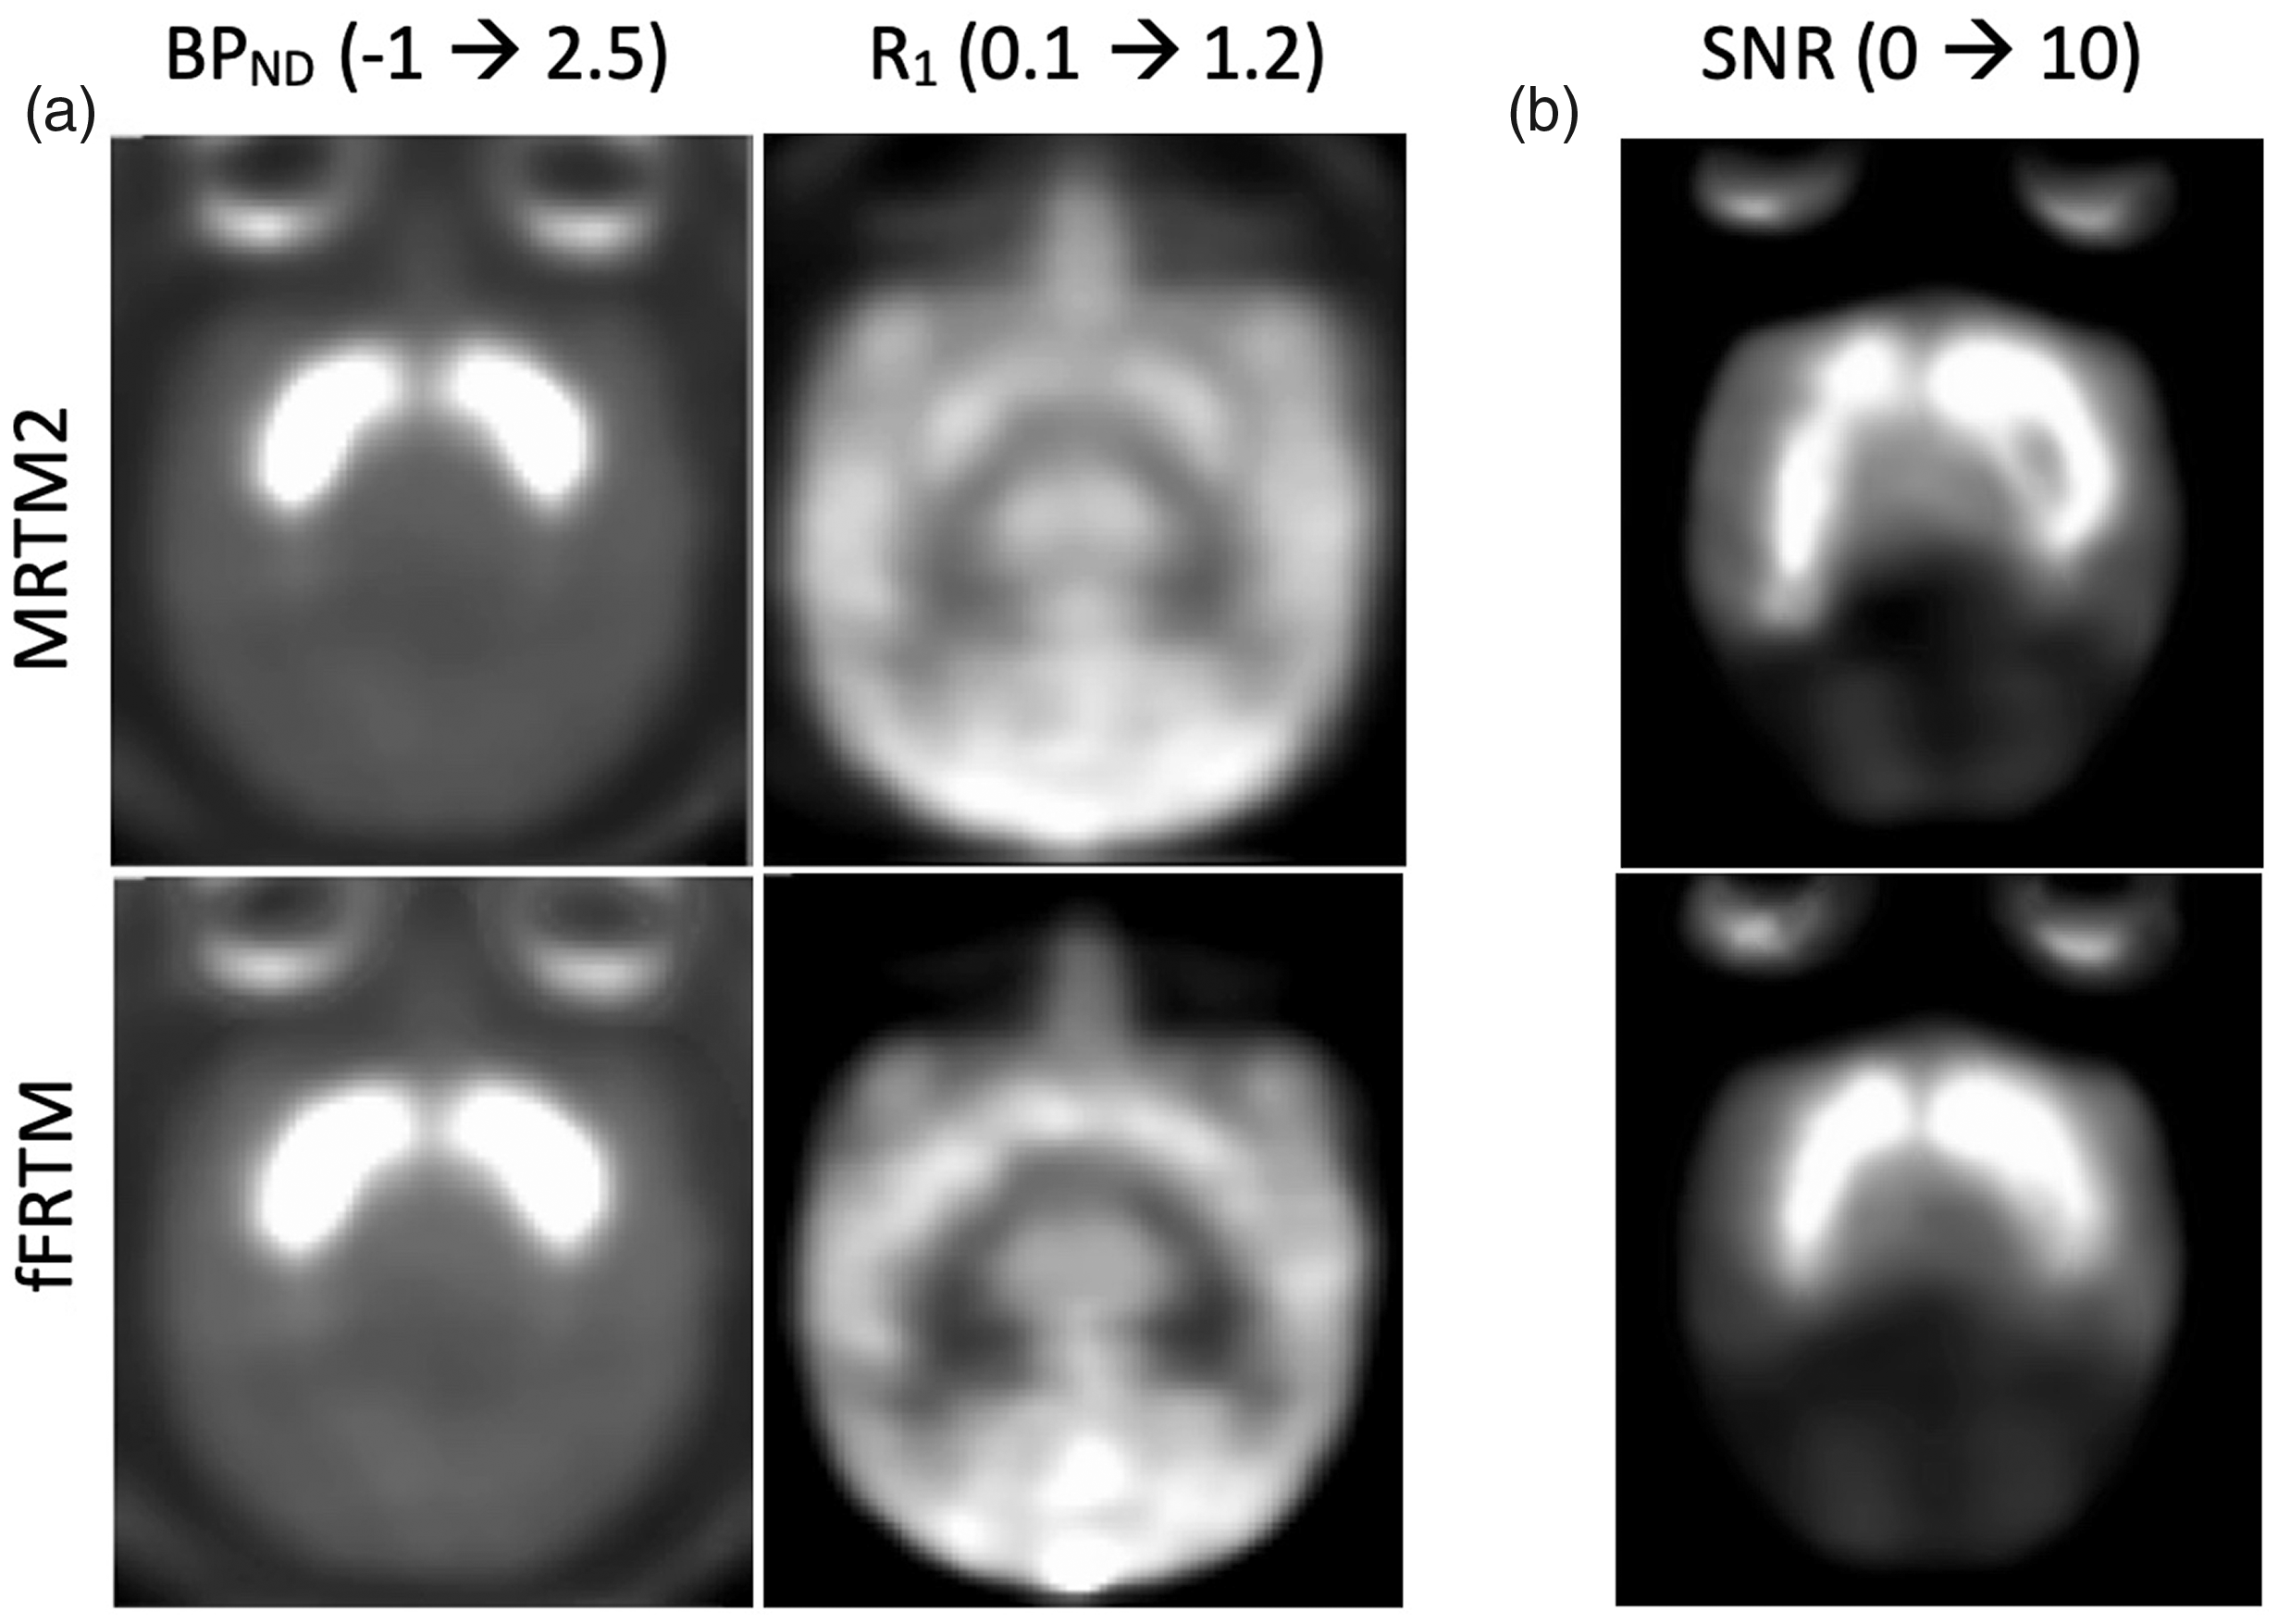
(a) Representative single-session maps of BPND (left) and R1 (right) for MRTM2 (top) and fFRTM (bottom). (b) Summary maps of the signal-to-noise ratio across session. Saturated regions (SNR > 10) exhibit a test-retest reproducibility better than 10%.
Laterality: Voxel-based analysis
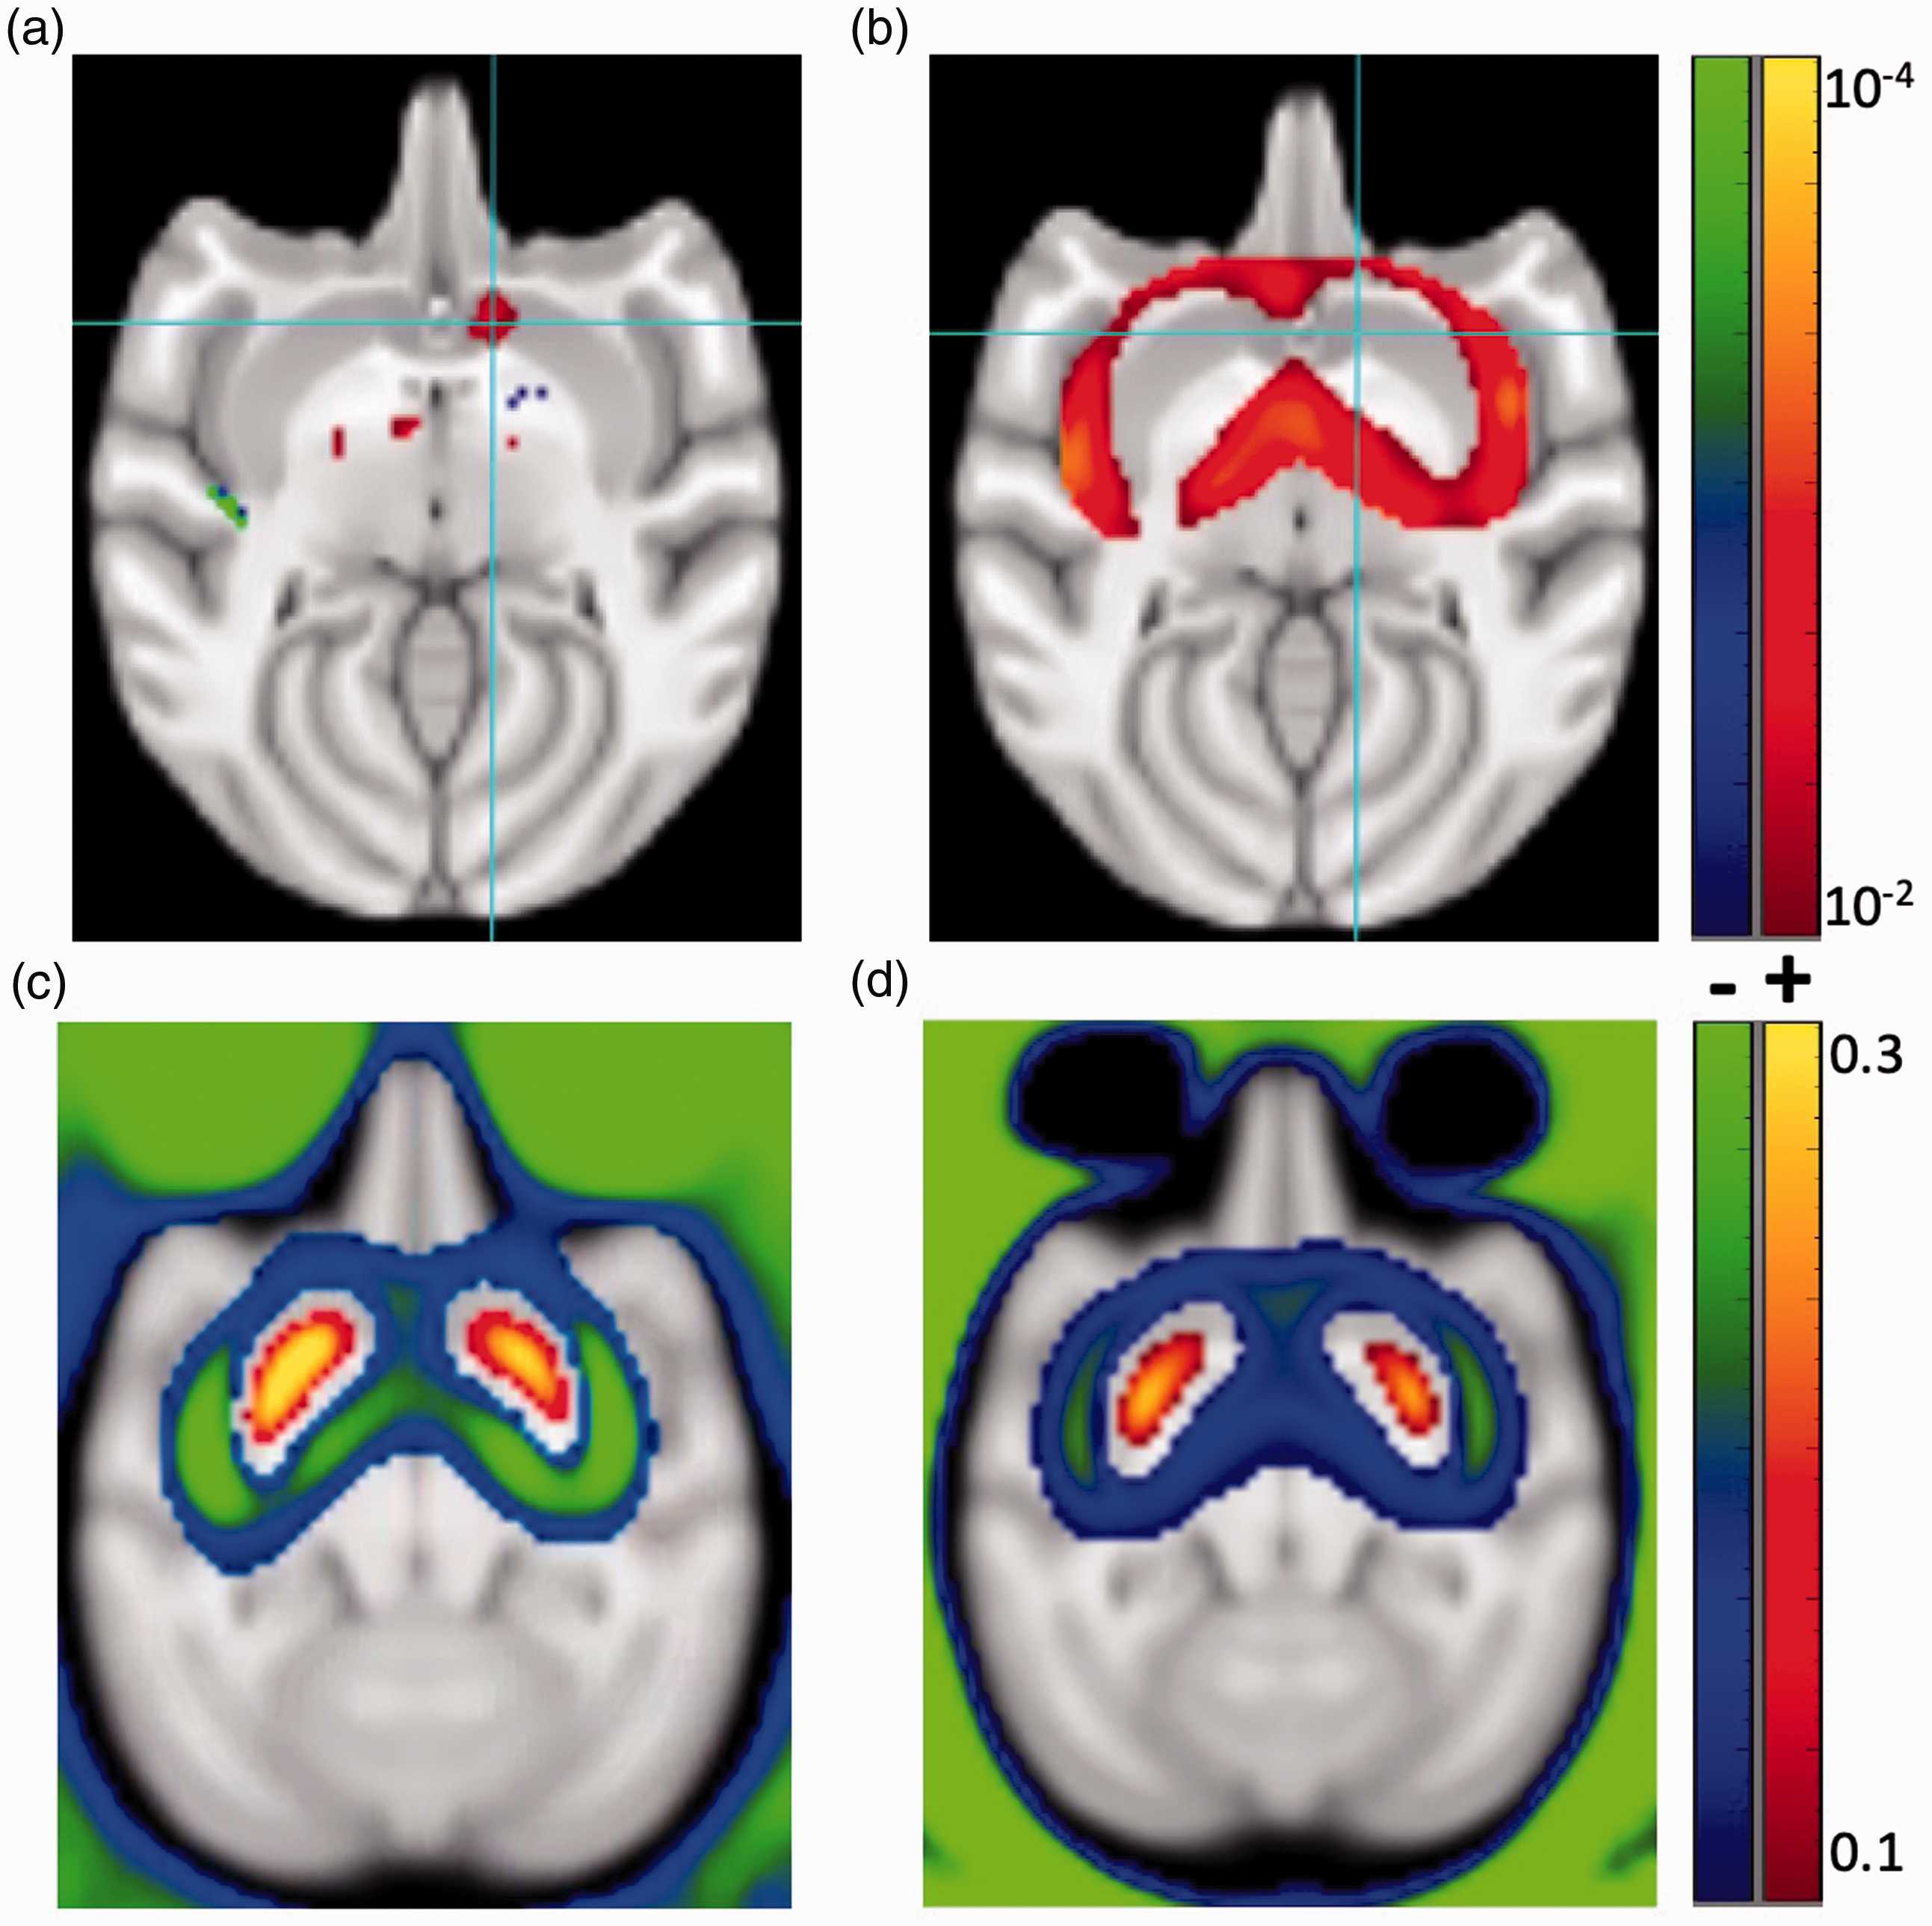
Figure 5 compares statistical maps for simultaneously acquired fMRI and [11C]raclopride data averaged across sessions using a random-effects analysis with a threshold determined from the number of independent resolution elements above the threshold BPND > 0.5. CBV-weighted changes in fMRI signal localized to ipsilateral VST and ipsilateral caudate. At a low threshold (below significance), fMRI maps showed activation near the site of stimulation (VTA) as well, and contralateral changes in fMRI signal that were an order of magnitude smaller than the predominant ipsilateral response (Supp. Figure 2). We did not observe global changes in fMRI signal or changes outside striatum and VTA.
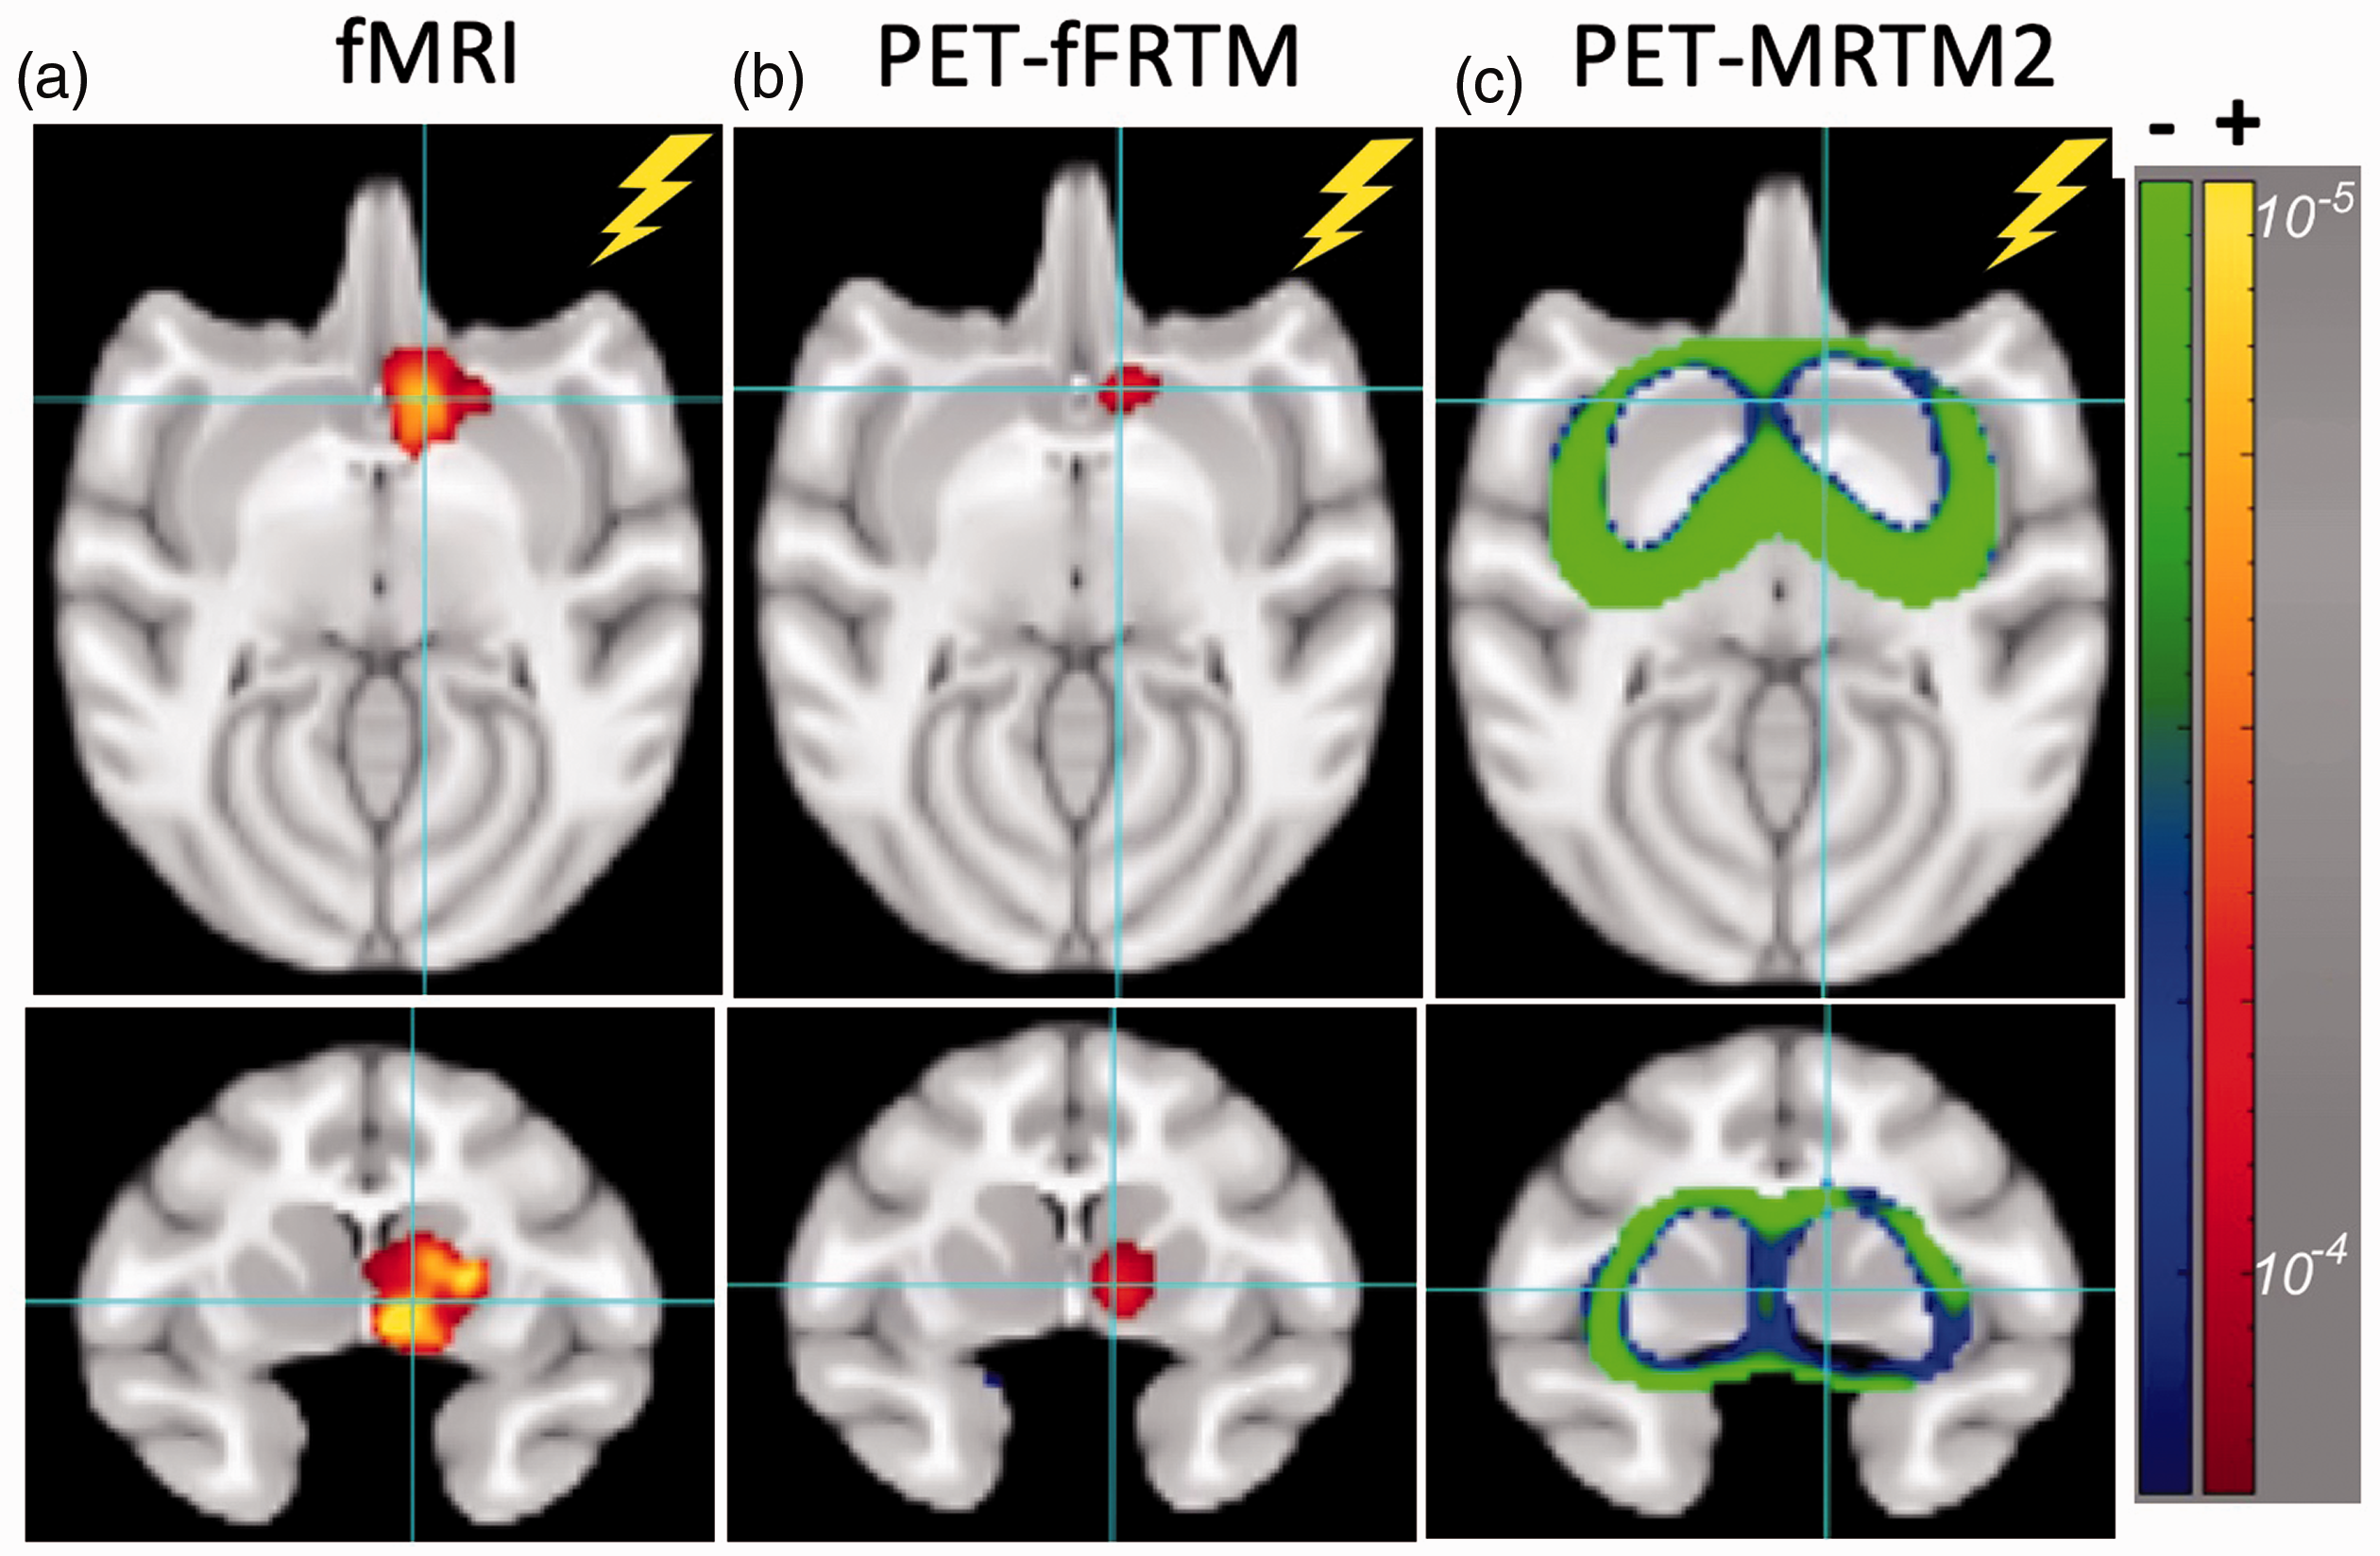
Axial and coronal views for fMRI (a), PET using analysis by fFRTM (b), and PET using analysis by MRTM2 (c) show raw p-values with a threshold corrected for multiple comparisons. The crosshair is positioned in ventral striatum at the border of nucleus accumbens in the stimulated right hemisphere. The positive scale indicates increased blood volume for fMRI and positive displacement (ΔBPND) for PET. Results represent the average across sessions using a random-effects model.
The PET response using fFRTM localized to ipsilateral VST with a single locus most closely matching nucleus accumbens but also sharing overlap with ventral portions of caudate and putamen (Figure 5(b)). Using a lower (non-significant) threshold, the fFRTM response also extended upward to ipsilateral caudate as in the fMRI data. Using MRTM2, little laterality was apparent in response to the unilateral stimulus. MRTM2 reported significant negative responses (apparent increase in BPND) in low-binding regions at the periphery of striatum (Figure 5(c)). At lower (non-significant) thresholds, the highest binding areas in the central portions of putamen and caudate exhibited bilateral positive ΔBPND.
As an additional voxel-based test on laterality and model selection, we created AIC maps using models with and without a challenge term, and we then formed the difference between the two AIC maps and tested significance across sessions; regions that are poorly fit with a single binding potential should exhibit the highest average AIC difference. In fact, the AIC difference maps (Figure 6(a) and (b)) closely mimicked the respective maps of ΔBPND (Figure 5(b) and (c)), albeit with a higher threshold required for p-values (p < 0.01). Using fFRTM, goodness of fit benefited most from inclusion of a challenge term in the ipsilateral VST area. Using MRTM2, the inclusion of a challenge term most benefited the symmetrical striatal periphery. Note that the quality of fits using fFRTM and MRTM2 appeared visually similar in individual sessions (Supp. Figure 5).
TOP: Maps of p-values associated with the difference in AIC values between models with and without a challenge term show voxels that are poorly fit without a challenge term for fFRTM (a) and MRTM2 (b). BOTTOM: A map of ΔBPND for MRTM2 (c) closely matches a map of the difference in BPND values obtained by the two analysis methods (MRTM2-fFRTM, d), consistent with the notion that ΔBPND for MRTM2 was driven primarily by errors in BPND using that method.
Given the slow rate of MRTM2 convergence for BPND, as shown in the analysis of contralateral regions in Figure 3, we tested the hypothesis that ΔBPND obtained from MRTM2 is driven by errors in BPND derived from the portion of scans prior to the challenge. If fFRTM determines BPND more accurately than MRTM2, then the MRTM2 map of ΔBPND (Figure 6(c)) should simply reflect the difference of BPND values obtained by the methods (MRTM2-fFRTM, Figure 6(d)) under the null hypothesis of no real functional change. In fact, the MRTM2 pattern of ΔBPND closely matched the difference in MRTM2 BPND with respect to the fFRTM method, consistent with the notion that MRTM2-derived displacement reflected bias in baseline BPND, and that fFRTM ameliorated much of this bias. The pattern of MRTM2 displacement also matched the previously simulated bias pattern for this method, 15 which is expected to exhibit false positive displacement in the highest binding regions and paradoxical increases in binding potential at lower values of BPND.
Laterality: ROI-based analysis
We performed an ROI-based laterality test on the PET data using fMRI results to define regions of interest. The fMRI response above the statistical threshold (Figure 5(a)) defined an ROI ipsilateral to microstimulation (iVST in Table 1), and a symmetrical ROI defined a region contralateral to the microstimulation (cVST). Using fFRTM, ispsilateral and contralateral occupancy were 5.6 ± 3.1% (p < 0.001) and 1.4 ± 4.7% (p > 0.5), respectively. Using MRMT2, both responses were significant but negative in magnitude (apparent increases in BPND). The ipsilateral-contralateral differences in occupancies were similar for MRTM2 and fFRTM, consistent with the notion that the MRTM2 analysis was sensitive to a lateralized difference with an overall negative bias, as suggested by the symmetric negative pattern in Figure 5(c).
Supp. Table 1 and 2 show changes in occupancy recorded for all eight anatomically delineated ROIs. After correcting for multiple comparisons, only ipsilateral NAc exhibited a significant change in occupancy using fFRTM (7.3 ± 3.8%). Using MRTM2, five of the eight regions reported statistically significant paradoxical drops in occupancy. Hence, only fFRTM reported a lateralized response similar to fMRI using either voxel-based or ROI-based analyses.
Simulations
If fFRTM represents a more accurate model for real data, then we should be able to approximately simulate MRTM2 deficiencies using parameter inputs derived from fFRTM analysis of data. The curves in Figure 3 show simulated predictions for MRTM2 assuming that the average rate constants derived from fFRTM (1/k2′ = 1.6 min, 1/k4 = 19.9 min) represented ground truth, whereas those employed for MRTM2 analysis (1/k2′ = 5 min, 1/k4 = 0 min) were artifacts of analysis assumptions. Other input parameters to the simulations include the average reference region time vector and the average values of BPND and R1 for the two ROIs at high and moderate binding levels in Figure 3 (BPND: 3.5, 1.7; R1: 1.3, 1.0). Simulated results (lines in Figure 3) match data remarkably well. Thus, MRTM2 results are consistent with the hypothesis that the “one-tissue” fast-exchange approximation is driving errors in BPND in these [11C]raclopride studies.
Other analysis models: MRTM and rFRTM
While this study did not perform a detailed comparison of numerous other analysis models employed in the literature, two variants of the models discussed here warrant mention. First, MRTM uses three baseline parameters, 5 as does the original description of LSRRM. 6 It is well known that the reduction from three to two baseline parameters decreases variance for bolus studies, especially for voxel-wise analyses.5,26 Because MRTM has a different bias structure from MRTM2,15 we investigated the relative merits of MRTM for analysis of our within-scan data. Even for ROI analyses, MRTM functioned poorly: the relative error on BPND using MRTM exceeded that using MRTM2 by an order of magnitude when only the first 30 minutes of data were used (Supp. Figure 6). By adding one additional parameter, MRTM becomes unstable if only a portion of the scan data is used to determine BPND. Thus, 2-parameter variants (MRTM2, fFRTM) represent far better analysis options for within-scan designs.
An inverse solution for FRTM (rFRTM 15 ) is conceptually related to fFRTM but requires inversion of noisy data-derived regressors and a very different calibration scheme (graphical invariance of k2′) to estimate k4. Applying rFRTM to our dataset, we estimated 1/k4 and 1/k′ values of 15.1 ± 2.2 and 2.3 ± 1.2 min, respectively. The value of 1/k4 differed significantly from fFRTM, whereas the value of 1/k2′ did not. An analysis of laterality and significance using fMRI-defined ROIs found ipsilateral and contralateral occupancy of 4.6 ± 6.6% and 0.2 ± 6.2%, respectively. These values did not differ significantly from fFRTM, but the variances were higher. fFRTM provided much better fits (Supp. Figure 1) and a more objective calibration scheme to define the two global rate constants required for analysis.
Discussion
Nuclear medicine remains the only method currently that can report changes in neurotransmitter levels using noninvasive tomographic imaging and nonpharmacological (tracer) doses of drugs; thus, it is imperative to develop and validate methods for assessing small focal changes in dopamine release as might be induced by behavioral tasks in health or disease or by deep brain stimulation as a treatment paradigm. This study addressed a major source of bias resulting from the “one-tissue” approximation (e.g., SRTM) as applied to studies using [11C]raclopride, while also developing an automated calibration procedure from real data and avoiding the use of additional voxel-wise parameters, which would increase parameter variances.5,26 We evaluated the model using a focal, repeatable, lateralized stimulation model accompanied by simultaneous fMRI recordings. The new analysis method reported a lateralized spatial response consistent with the fMRI focus, whereas an MRMT2-based method did not.
Within-scan challenge studies are challenging
Analysis of [11C]raclopride studies has converged upon one-compartment models (e.g., SRTM, MRTM), which produce better test-retest reproducibility than alternative methods 34 while also producing, according to simulation, a remarkable level of accuracy for BPND considering how poorly individual rate constants are replicated. The difference between FRTM and SRTM can be summarized by a single term that depends upon the derivative of the tissue concentration. 15 In the context of a one-compartment model, this “error term” is largest during the initial uptake period, and then either reverses sign (bolus studies) or becomes approximately zero (bolus plus constant infusion studies) at later points in the scan; in either case, the SRTM fast-exchange approximation imparts less error into BPND for bolus studies than for within-scan challenge paradigms that determine BPND using only an initial portion of the data. Unfortunately, state measurements separated by hours to days may not accurately capture small differences in neurotransmitter function as produced by behavioral challenges. Thus, this study addresses a need to improve modeling accuracy for studies that value the temporal benefits of within-scan challenges.
For within-scan challenges, the slow rate of convergence of BPND represents a significant problem: even in relatively high binding regions of striatum, BPND is not reproducible within 5% until 60 minutes into the scan (Figure 3), when an 8-fold loss of signal has occurred using 11C tracer. This is consistent with reports in human studies, where BPND reached stability in VST at about 60 minutes. 34 Obviously, within-scan changes in binding potentials cannot be estimated more accurately than baseline binding potentials, and so achieving time invariance in baseline BPND is paramount using a within-scan challenge. Because differences between SRTM and FRTM disappear when the tissue concentration reaches a steady state, 15 inferences about a task response are limited predominantly by the accuracy of the model describing the non-steady-state uptake period used to derive the baseline binding potential.
When fitting a time-activity curve using FRTM, the dissociation (k4) and efflux (k2’) rate are highly correlated, as illustrated by empirical data from Figure 1(c). This adds variance to estimate of these rate constants when they are determined jointly; conversely, either rate constant can be determined more accurately if the other one is fixed. High-quality fits can be obtained across a broad range of values of k4, including the case when the dissociation time constant is assumed to be zero, as in SRTM. This emphasizes the notion that good fits alone can generate “misplaced confidence” 17 in SRTM. Use of a full time-activity curve to determine BPND can ameliorate some of the problems, such that the SRTM approach creates a simple and reproducible method that is more robust against bias from the fast-exchange approximation than for within-challenge studies.
Novel animal model for PET validation
This study employed a model testbed for PET analyses that is unique in the PET literature: a repeatable lateralized focal model of dopamine release using an indwelling implant, with all imaging informed by simultaneously acquired fMRI. In the absence of a lateralized response, it’s difficult to experimentally judge whether a small PET response represents a true response or spatially dependent analysis bias, which should vary regionally and typically symmetrically versus local receptor concentrations. In this model, the site of observable fMRI activation in the VST was well removed from the electrical implant, alleviating concerns of probe-related artifacts.
VTA-EM in non-human primates, the method employed in this study, has been reported to produce a robust 2-fold increase in dopamine, while a strongly reinforcing behavioral task (juice reward) produced much smaller dopamine pulse. 23 Using imaging, VTA-EM produces robust behavioral reinforcement in awake macaques suggestive of a dopaminergic component, that was mostly confined to the ipsilateral hemisphere,19–22 and the fMRI response has been demonstrated to contain a significant dopaminergic contribution independently from PET measurements by pharmacologically blocking the fMRI response. 35 Injection of viral tracer into VTA in macaques showed primarily lateralized connections to striatum, but with some expression in contralateral dorsal striatum. 36 In our study, an increase of about 5% occupancy in ipsilateral VST supports the notion that behaviorally induced changes in dopamine will produce occupancies below 5%.
The ability to detect a robust focal response in a controlled animal model like this one is a necessary but not sufficient condition for validating the ability of PET to detect dopamine release in response to human behavioral tasks, which probably evoke smaller levels of dopamine and suffer more motion. Our results suggest caution in interpretation of SRTM-based analysis in the setting of behavioral tasks.
Potential limitations
While this forward model eliminated the one-compartment approximation of SRTM, other potential sources of bias in reference tissue models include specific binding in the reference region, non-negligible blood volume contributions, and differences in non-specific binding between reference and tissue regions. 17 By smoothing the PET data to boost SNR at the expense of resolution, we presumably exacerbated partial volume contributions from non-striatal tissue, which could have different tissue properties that affect non-specific binding. In principle, it’s possible to use MRI to match reference and target region tissue properties based upon relaxation rates, but that was not attempted in this study. A forward model is very flexible and could include many such effects but will require methods that don’t add more parameters, such as independent identification of model inputs using adjunct modalities, or the use of global or tissue-dependent constraints.
We used a global value of k4 in our analysis to minimize the number of voxel-wise parameters. For the specific case of [11C]raclopride, an antagonist with roughly equal affinities to D2 and less abundant D3 receptors, modeling the response using a single global offset rate produced good results. However, this may be less true for a radiotracer such as [11C]PHNO, which has a preferential affinity for D3 relative to D2 receptors and therefore may exhibit regional differences in k4 reflective of D2/D3 receptor ratios. Additionally, some have argued that tissue heterogeneity creates “reaction volumes” that shift rate constants relative to in vitro values and that could impart regional variability in kinetic parameters. 37
An additional limitation is that we evaluated only one method among the various implementations that employ the fast-exchange approximation of SRTM. In particular, the bias of the two-parameter linear implementation (MRTM2) differs from the three-parameter variant (MRTM) when assessing either baseline BPND or the magnitude of the challenge ΔBPND15. However, the three-parameter method exhibits far higher variance in parameter estimates, 5 even when using relatively noiseless time-activity curves generated from large regions of interest, and so MRTM2 is far more useful as a mapping method or to achieve low variance in regional analyses. While it is certainly possible to reduce MRTM to two parameters using a method that does not fix k2′ to a single value to mimic the bias structure of MRTM more accurately, no such strategies have been reported. Moreover, BPND-dependent bias would remain in any analysis model that employs the SRTM fast-exchange approximation. Note there may be modifications of SRTM, such as discounting the initial uptake period of tracer, that provide benefits to accuracy.
Conclusions
In summary, we applied a forward model approach using the full reference tissue model in conjunction with a fixed value of the dissociation rate constant (k4) to provide estimates of BPND that are similarly reproducible to MRTM2, while offering significantly earlier time-invariance of BPND and producing a spatial response generally consistent with simultaneously recorded fMRI and with mesolimbic dopaminergic projections from VTA to ventral striatum. The new method offers an important alternative approach to SRTM for use in situations which demand early convergence of BPND and high accuracy, such as within-scan challenge designs of task-induced dopamine release.
Supplemental Material
sj-pdf-1-jcb-10.1177_0271678X211065212 - Supplemental material for A reference tissue forward model for improved PET accuracy using within-scan displacement studies
Supplemental material, sj-pdf-1-jcb-10.1177_0271678X211065212 for A reference tissue forward model for improved PET accuracy using within-scan displacement studies by Joseph B Mandeville, Michael A Levine, John T Arsenault, Wim Vanduffel, Bruce R Rosen and Christin Y Sander in Journal of Cerebral Blood Flow & Metabolism
Footnotes
Funding
The author(s) disclosed receipt of the following financial support for the research, authorship, and/or publication of this article: This research was supported by grants from the National Institutes Health (R01NS112295, K99DA043629, R00DA043629, P41EB015896, S10RR022976, S10RR019933, S10RR017208); Leuven (C14/17/109); Fonds Wetenschappelijk Onderzoek-Vlaanderen (FWO-Flanders; G0B8617N, G0E0520N); and the European Union’s Horizon 2020 Framework Programme for Research and Innovation under Grant Agreement No 945539 (Human Brain Project SGA3). The authors declare no conflicts of interest.
Acknowledgements
We thank Helen Deng, Grae Arabasz, Shirley Hsu, and Regan Butterfield for their experimental support.
Declaration of conflicting interests
The author(s) declared no potential conflicts of interest with respect to the research, authorship, and/or publication of this article.
Authors’ contributions
JBM: Created analysis method, programmed software, designed studies, assisted experiments, analyzed data; MAL: Assisted simulations; JTA: Created NHP microstimulation model, designed studies, assisted experiments; WV: Created NHP microstimulation model, designed studies; BRR: Funded studies, contributed to design/direction; CYS: Conducted experiments, designed studies, analyzed data. JBM wrote the manuscript and all other authors contributed to revisions.
Supplemental material
Supplemental material for this article is available online.
References
Supplementary Material
Please find the following supplemental material available below.
For Open Access articles published under a Creative Commons License, all supplemental material carries the same license as the article it is associated with.
For non-Open Access articles published, all supplemental material carries a non-exclusive license, and permission requests for re-use of supplemental material or any part of supplemental material shall be sent directly to the copyright owner as specified in the copyright notice associated with the article.