
Abstract
Studies examined the phenotypic characteristics of glutamate-induced cell death and their relationship to calpain and caspase-3 activation. Cell viability was assessed by fluorescein diacetate and propidium iodide staining and lactate dehydrogenase release. Calpain and caspase-3 activity was inferred from signature proteolytic fragmentation of α-spectrin. Characterization of cell death phenotypes was assessed by Hoechst 33258 and DNA fragmentation assays. Exposure of septohippocampal cultures to 1.0, 2.0, and 4.0 mmol/L glutamate induced a dose-dependent cell death with an LD50 of 2.0 mmol/L glutamate after 24 hours of incubation. Glutamate treatment induced cell death in neurons and astroglia and produced morphological alterations that differed from necrotic or apoptotic changes observed after maitotoxin or staurosporine exposure, respectively. After glutamate treatment, cell nuclei were enlarged and eccentrically shaped, and aggregated chromatin appeared in a diffusely speckled pattern. Furthermore, no dose of glutamate produced evidence of internucleosomal DNA fragmentation. Incubation with varying doses of glutamate produced calpain and caspase-3 activation. Calpain inhibitor II (N-acetyl-Leu-Leu-methionyl) provided protection only with a narrow dose range, whereas carbobenzoxy-Asp-CH2-OC(O)-2, 6-dichlorobenzene (Z-D-DCB; pan-caspase inhibitor) and MK-801 (N-methyl-
Previous studies have reported that excitotoxicity is associated primarily with necrosis (Choi et al., 1987; Siman and Card, 1988). More recent studies have maintained that both necrotic and apoptotic mechanisms are activated after excessive stimulation of various glutamate receptor subtypes (Bonfoco et al., 1995). However, the precise mode of excitotoxic neuronal cell death remains controversial. Inconsistent reports of cell death phenotypes produced specifically by glutamate toxicity in vitro have no doubt contributed to this controversy. For example, a number of investigators have reported glutamate-induced apoptotic-like cell death characteristics in culture (Bonfoco et al., 1995; Cebers et al., 1997; Du et al., 1997; Kure et al., 1991). In contrast, other investigators have concluded that glutamate toxicity does not produce apoptotic cell death profiles (Ikeda et al., 1996; MacManus et al., 1997). Comparison of data from these studies is complicated by the use of different culture systems, different criteria for defining apoptotic cell death phenotypes, and different glutamate dosing regimens. Equally important, and with few exceptions (Du et al., 1997; Nath et al., 1998), the possible contribution of calpains and caspases as proteolytic mediators of necrotic and apoptotic cell death has not been characterized in models of glutamate toxicity.
Caspases, members of the cysteine protease family, are important intracellular effectors of apoptosis in various cell lines and apoptotic models (Nath et al., 1996a,
b
; Pike et al., 1998b; Zhivotovsky et al., 1997). The role of caspase-1, caspase-3, and caspase-3-like (caspase-3, −6, and −7) proteases has been the focus of numerous investigations. Although the contribution of caspase-1 to apoptosis in the central nervous system has not been well established (Nath et al., 1996a,
b
; Wang et al., 1998; Zhivotovsky et al., 1997), a number of studies have implicated caspase-3-like proteases in neuronal apoptotic cell death (Nath et al., 1996a,
b
; Pike et al., 1998b; Wang et al., 1998). In fact, some studies suggest that caspase-3-like proteases are activated only in apoptosis but not in necrosis (Wang et al., 1996b). Calpains are calcium-activated, neutral, cytosolic cysteine proteases (Nath et al., 1996b). Although investigators have historically assumed that calpain activation resulted in necrotic cell death, several recent investigations have suggested that calpains can also contribute to apoptosis (Nath et al., 1996a; Pike et al., 1998b; Squier et al., 1994). Importantly, calpain activation has been implicated in different models of apoptosis in different cell types including neurons (Nath et al., 1996a; Pike et al., 1998b; Squier et al., 1994). A recent study provided evidence of increased calpain and caspase-3 activity in rat cortical and cerebellar granule neurons challenged with excitotoxins N-methyl-
To address these inconsistencies in studies of excitotoxic cell death pathways, our laboratory has systematically characterized the phenotypic characteristics of apoptotic cell death produced by staurosporine (Pike et al., 1998b) and necrotic cell death produced by maitotoxin (Zhao et al., 1999) in primary cultures of septohippocampal neurons. We chose this culture system because the hippocampus is preferentially vulnerable to a number of acute insults including ischemia (Jenkins et al., 1989) and mechanical trauma (Lyeth et al., 1990). The present study represents the first characterization of apoptotic and necrotic cell death after glutamate toxicity in relation to activation of calpain and caspase-3 proteases. Recognizing that criteria for cell death phenotypes are subject to controversy (Portera-Cailliau et al., 1997), we incorporated a number of widely utilized morphological, biochemical, and molecular criteria to describe cell death characteristics in neurons and glia after glutamate exposure. Results of this investigation indicate that glutamate can elicit an apoptotic biochemical response not associated with apoptotic cell morphology. This result has important implications for pharmacological treatment of cell death, even in cases where apoptosis is not thought to play an important role.
MATERIALS AND METHODS
Septohippocampal cultures
Eighteen-day-old rat fetuses were removed from deeply anesthetized dams. Septi and hippocampi were dissected in a dissection buffer (Hanks' balanced salt solution, with 4.2 mmol/L bicarbonate, 1 mmol/L pyruvate, 20 mmol/L N-2-hydroxyethylpiperazine-N'-2-ethanesulfonate, 3 mg/mL bovine serum albumin, pH 7.25). After rinsing in Dulbecco's modified Eagle's medium (DMEM), tissue was dissociated by trituration through the narrow pore of a flame-constricted Pasteur pipette. Dissociated cells were resuspended in DMEM with 10% fetal calf serum and plated on 24-well poly-
For neuronally enhanced cultures, hippocampi and septi were dissected and dissociated as described above. Dissociated cells were resuspended in DMEM and plated on 24-well poly-
Pharmacological treatment of septohippocampal cells
Glutamate. Ten-day-old mixed septohippocampal cultures were challenged with 1.0, 2.0, or 4.0 mmol/L glutamate in DMEM (serum-free), and cell viability was monitored at various postinjury time points (n = 10 wells/condition). Similar glutamate concentrations have been used in mixed (Kure et al., 1991) and neuronal (Ikeda et al., 1996) studies. To assess the contribution of glia to differences in sensitivity to glutamate toxicity, neuronally enhanced septohippocampal cultures were also incubated in varying concentrations of glutamate (1 μmol/L to 2.0 mmol/L) for 24 hours (n = 3 wells/condition). Glutamate was added directly to the medium for the entire duration of experiments. Experiments were performed on day 10 in vitro as sensitivity of mixed septohippocampal cultures to glutamate does not differ between 10 and 15 days in vitro (data not shown).
N-Methyl-
Chemical inducers of apoptotic or necrotic cell death phenotypes. To provide comparisons of glutamate toxicity with classic apoptotic and necrotic profiles, cultures were treated with the general protein kinase inhibitor staurosporine or maitotoxin, a potent marine toxin that activates both voltage-sensitive and receptor-operated calcium channels. Ten-day-old septohippocampal cultures were challenged with 0.5 μmol/L staurosporine for 24 hours, a dose and duration that we have previously confirmed produce apoptotic but not necrotic neuronal cell death in this in vitro system (Pike et al., 1998b). The production of apoptotic cell death by staurosporine is associated with activation of both caspase-3 and calpain proteases, and staurosporine-induced apoptosis can be attenuated by calpain or caspase inhibitors (Pike et al., 1998b). Cultures were also treated with maitotoxin (0.1 nmol/L for 1 hour), a dose and duration that we have previously confirmed produce an exclusively necrotic-like cell death profile in neurons and glia and are associated with calpain but not caspase-3 activation (Zhao et al., 1999).
Morphological and enzymatic assessments of cell damage
Fluorescein diacetate and propidium iodide assay of cell viability. Fluorescein diacetate (FDA) and propidium iodide (PI) dyes were used to assess cell viability at various times between 1 and 72 hours after glutamate incubation. Fluorescein diacetate enters normal cells and emits a green fluorescence when it is cleaved by esterases. Once cleaved, FDA can no longer permeate cell membranes. Propidium iodide is an intravital dye that is normally excluded from cells. After injury, PI penetrates cells, binds to DNA in the nucleus, and emits a red fluorescence. This technique is commonly used to quantitate cell injury (Jones and Senft, 1985).
A stock solution of FDA was prepared by dissolving 20 mg/mL in acetone. A PI stock solution was prepared by dissolving 5 mg/mL in 1× phosphate-buffered saline (PBS) (Jones and Senft, 1985). The FDA and PI working solutions were freshly prepared by adding 10 μL of the FDA and 3 μL of PI stock to 10 mL of Dulbecco's PBS. Two hundred microliters per well of FDA/PI working solution was added directly to the cells. Cells were stained for 3 minutes at room temperature. Stained cells were examined with a fluorescence microscope equipped with epi-illumination, bandpass 450- to 490-nm exciter filter, 510-nm chromatic beam splitter, and a long-pass 520-nm barrier filter. This filter combination permitted both green and red fluorescing cells to be seen simultaneously. Cell viability can be determined because this procedure results in the nuclei of dead cells fluorescing red and the cytoplasm of living cells fluorescing green. Cell loss was calculated in 100× fields (five sequential 100× fields were counted and averaged per well) for three wells in each experiment as a percentage of total cell number.
Hoechst staining of apoptotic nuclei. After overnight fixation in 4% paraformaldehyde at 4°C, cells grown on German glass were washed three times with PBS and labeled with 1 μg/mL of the DNA dye Hoechst 33258 (bis-benzamide; Sigma) in PBS. Cells were incubated for 5 to 10 minutes at room temperature, rinsed with PBS, and mounted with crystal-mount medium (Biomeda, Foster City, CA, U.S.A.). Cells were observed and photographed on a phase and fluorescence microscope with a UV2A filter.
Determination of lactate dehydrogenase activity Lactate dehydrogenase (LDH) activity assessed cell viability (Koh and Choi, 1987) in experiments examining the effects of NMDA receptor antagonism and inhibition of calpain and caspase proteases and protein synthesis. Lactate dehydrogenase released from damaged cells was measured by standard kinetic assay for pyruvate (Boehringer Mannheim). An increase in the amount of dead or plasma membrane-damaged cells results in an increase of the LDH enzyme activity in the culture supernatant detected by colorimetric measurements. In brief, 200 μL of culture medium was removed from each well and centrifuged at 5, 000 g for 5 minutes. One hundred microliters of supernatant was transferred to each well of a 96-well flat bottom plate, and 100 μL of detection reagent was added. The plate was covered with foil and incubated on a shaker for 30 minutes at room temperature. The absorbance of samples was measured at 490 nm using Bio-Rad model 450 microplate reader (Hercules, CA, U.S.A.).
DNA fragmentation assay
DNA gel electrophoresis was performed as described previously (Gong et al., 1994). Cells were collected by centrifugation at 3, 000 g for 5 minutes, fixed in suspension in 70% cold ethanol, and stored in the fixative at −20°C for 24 to 72 hours. Cells were centrifuged at 800 g for 5 minutes, and the ethanol was thoroughly removed. Cell pellets were resuspended in 40 μL of phosphate/citrate buffer consisting of 192 parts of 0.2 mol/L Na2HPO4 and 8 parts of 0.1 mol/L citric acid (pH 7.8) at room temperature for 1 hour. After centrifugation at 1, 000 g for 5 minutes, the supernatant was transferred to new tubes and concentrated by vacuum in a SpeedVac concentrator for 15 to 30 minutes. Three microliters of 0.25% Nonidet P-40 in distilled water was added, followed by 3 μL of DNase-free RNase (1 mg/mL). After 30-minute incubation at 37°C, 3 μL of proteinase K (1 mg/mL) was added, and the extract was incubated for an additional 30 minutes at 37°C. After the incubation, 1 μL of 6x loading buffer (0.25% bromophenol blue, 0.25% xylene cyanol FF, and 30% glycerol in water) was added, the entire content of the tube was transferred to a 1.5% agarose gel, and electrophoresis was performed in 1× Tris/boric acid/ethylenediaminetetraacetate solution (0.1 mol/L Tris, 0.09 mol/L boric acid, and 1 mmol/L ethylenediaminetetraacetate, pH 8.4) at 40 V for 2 hours. The DNA was visualized and photographed under ultraviolet light after staining with 5 μg/mL ethidium bromide.
Assessment of α-spectrin degradation by calpain and caspase-3
Because the cytoskeletal protein α-spectrin contains sequence motifs preferred by both calpains and caspase-3 proteases, activation of these two protease families can be assessed concurrently by immunoblot identification of calpain and/or caspase-3 signature cleavage products. Although both calpains and caspases produce an initial fragment of nearly identical size (150 kDa), calpains further process α-spectrin into a distinctive breakdown product (BDP) of 145 kDa (Harris et al., 1988; Nath et al., 1996a, b ), whereas caspase-3 produces a unique 120-kDa BDP (Wang et al., 1998).
Sodium dodecyl sulfate polyacrylamide gel electrophoresis and immunoblotting. After each experiment, cells were harvested from five identical culture wells, collected in 15-mL centrifuge tubes, and centrifuged at 3, 000 g for 5 minutes. Medium was removed, and the cells were rinsed with 1× PBS. Cells were lysed in ice-cold homogenization buffer [20 mmol/L 1, 4-piperazinediethanesulfonate (pH 7.6), 1 mmol/L ethylenediaminetetraacetate, 2 mmol/L ethyleneglycol-bis-(β-aminoethyl ether)-N, N, N', N'-tetraacetate, 1 mmol/L dithiothreitol, 0.5 mmol/L phenylmethylsulfonyl fluoride, 50 μg/mL leupeptin, and 10 μg/mL each of 4-(2-aminoethyl)benzenesulfonyl fluoride, aprotinin, pepstatin, Nα-p-tosyl-
Antibodies and immunolabeling. Immunoblots were probed with an anti-α-spectrin monoclonal antibody (Affiniti Research Products, Mamhead, U.K.; catalog no. FG 6090, clone AA6) that detects intact α-spectrin (Mr = 240 kDa) and 150-, 145-, and 120-kDa BDPs. After incubation with primary antibody (1:4, 000) for 2 hours at room temperature, blots were incubated in peroxidase-conjugated sheep anti-mouse IgG for 1 hour (1:10, 000). Enhanced chemiluminescence reagents (ECL kit; Amersham) were used to visualize the immunolabeling on Hyperfilm (Hyperfilm ECL; Amersham, Piscataway, NJ, U.S.A.).
Hoechst 33258 staining in glial or neuronal cell types
To determine the effects of glutamate on astroglial and neuronal cell types, cultures were labeled immunocytochemically with glial fibrillary acidic protein (GFAP; for astroglia) or microtubule-associated protein-2 (MAP-2) and neuronal nuclear marker (NeuN; for neurons) and counterstained with Hoechst 33258. Microtubule-associated protein-2 labels primarily dendrites, whereas NeuN is a neuronal nuclear marker. Cultures were fixed in 4% paraformaldehyde for 1 hour at 4°C and washed and stored in 1× PBS. Cultures were permeabilized with 0.3% Triton X-100 for 30 minutes and blocked with 1% normal horse or goat serum at room temperature for 1 hour, followed by incubation with GFAP (1:1, 000) or MAP-2 and NeuN (1:1, 000) antibody overnight at 4°C. Cultures were washed in 1× PBS and incubated in horseradish peroxidase-conjugated goat anti-rabbit IgG (for GFAP) or sheep antimouse IgG (for MAP-2 and NeuN) (Cappel [Durham, NC, U.S.A.]; 1:1, 000) for 1 hour. Cultures were washed three times in 1× PBS, and diaminobenzidine (Vector, Burlingame, CA, U.S.A.) was used to visualize the reaction. After incubation in diaminobenzidine, the reaction was stopped in tap water, and cultures were counterstained with Hoechst 33258 for 5 minutes. After a final wash, cells were mounted and coverslipped with Cytoseal 280 mounting medium (EMS, Fort Washington, PA, U.S.A.). Each slide was observed and photographed in the same field using light (for immunolabeled cells) and fluorescence (for Hoechst 33258-labeled cells) microscopy. A phase contrast microscope (Axiovert 135) was used to distinguish the glial and neuronal cell layers.
Statistical analyses
Each experiment was performed three times, and data were evaluated by analysis of variance with a post hoc Tukey test. Values are given as means ± 1 SD. Differences were considered significant at P < 0.05.
RESULTS
Effects of glutamate on septohippocampal glial—neuronal co-cultures
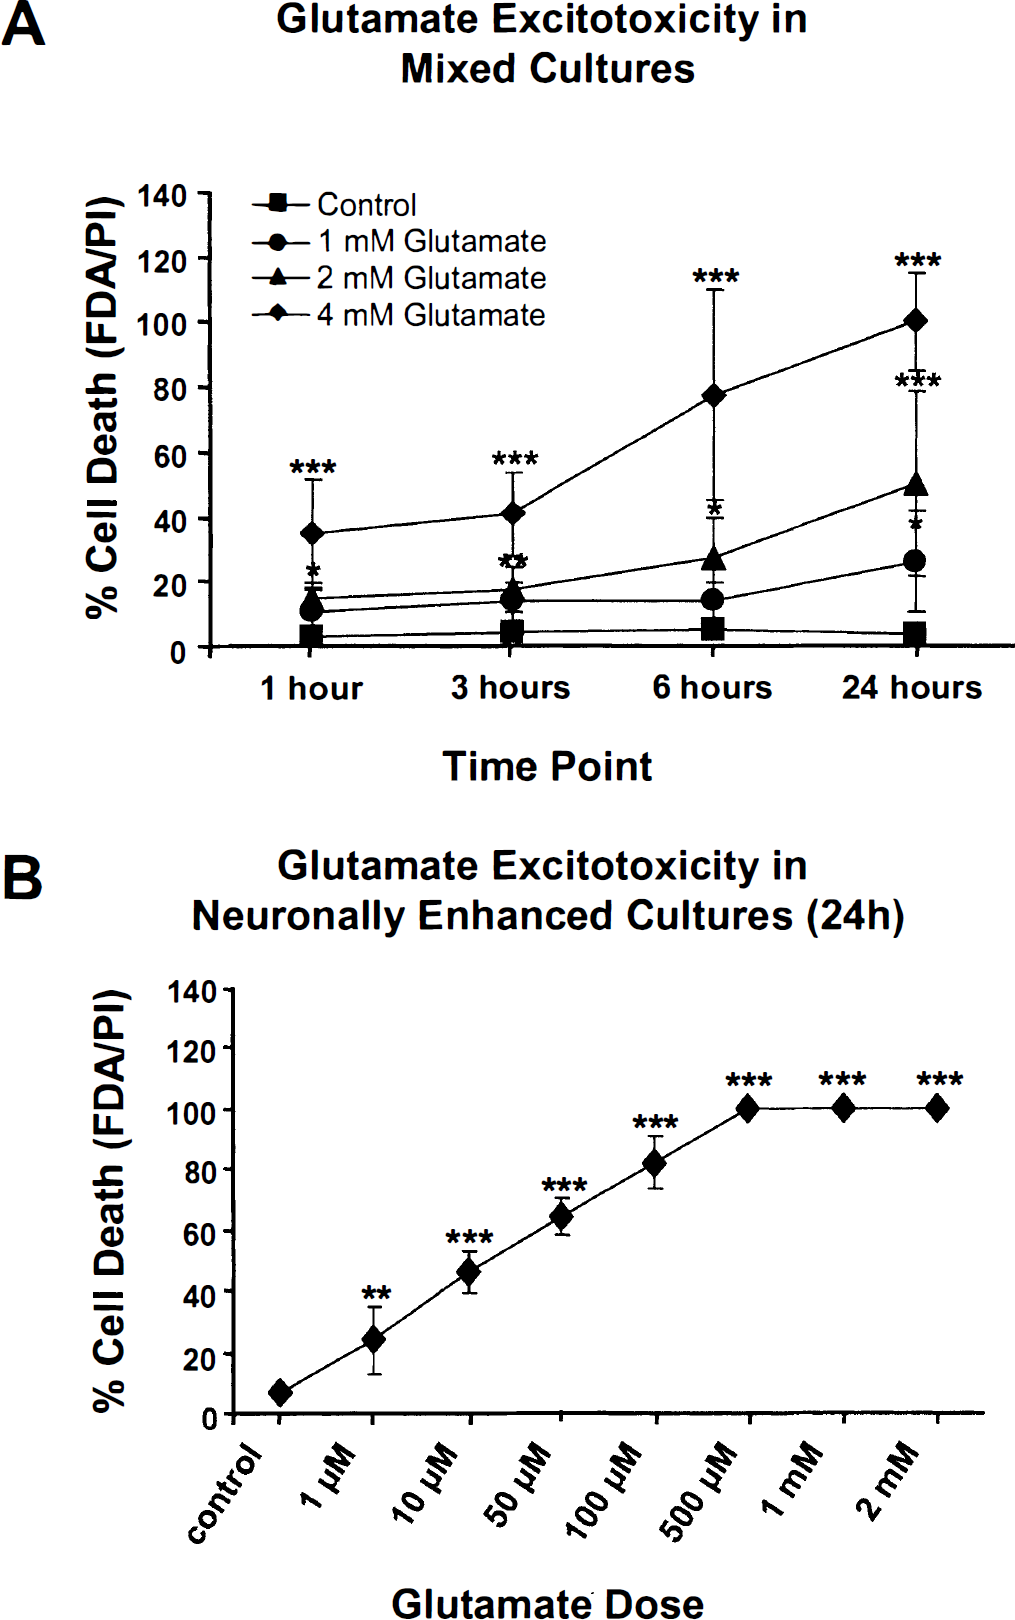
Dose- and time-dependent cell death. An initial series of experiments was conducted to determine dose-response relationships between glutamate concentrations and cell viability at various times after incubation with the excitotoxin. Propidium iodide and FDA were used to assess cell death and membrane integrity. Exposure of mixed septohippocampal cultures to 1.0, 2.0, and 4.0 mmol/L glutamate induced a dose-dependent cell death with an LD50 of 2.0 mmol/L glutamate after 24-hour incubation (Fig. 1A). The percentages of cells that stained for PI after exposure to 2.0 mmol/L glutamate were 14.6% at 1 hour, 17.5% at 3 hours, 27.1% at 6 hours, and 51.3% at 24 hours (Fig. 1A). A one-way analysis of variance performed on these data revealed a significant effect of group (F3, 18 = 13.13, P < 0.0001). Post hoc analyses showed significant increases in cell death after 1.0 mmol/L glutamate for 24 hours and at all time points using 2.0 and 4.0 mmol/L glutamate compared with control cells. Incubation with 2.0 mmol/L glutamate for 24 hours was used for most subsequent experiments, unless stated otherwise. Similar glutamate concentrations have been used to study cell death in other glial—neuronal co-culture systems (Kure et al., 1991; also see Ikeda et al., 1996). The LD50 for glutamate in neuronally enhanced cultures (∼10 μmol/L; Fig. 1B) is similar to values reported for glutamate in other neuronally enhanced cultures (Manev et al., 1991). Univariate analysis of these data also showed a significant effect of group (F7, 16 = 116, P < 0.0001), and post hoc analyses revealed significant increases in cell death at all concentrations tested.
Concentration and time course assays of glutamateinduced cell death. (
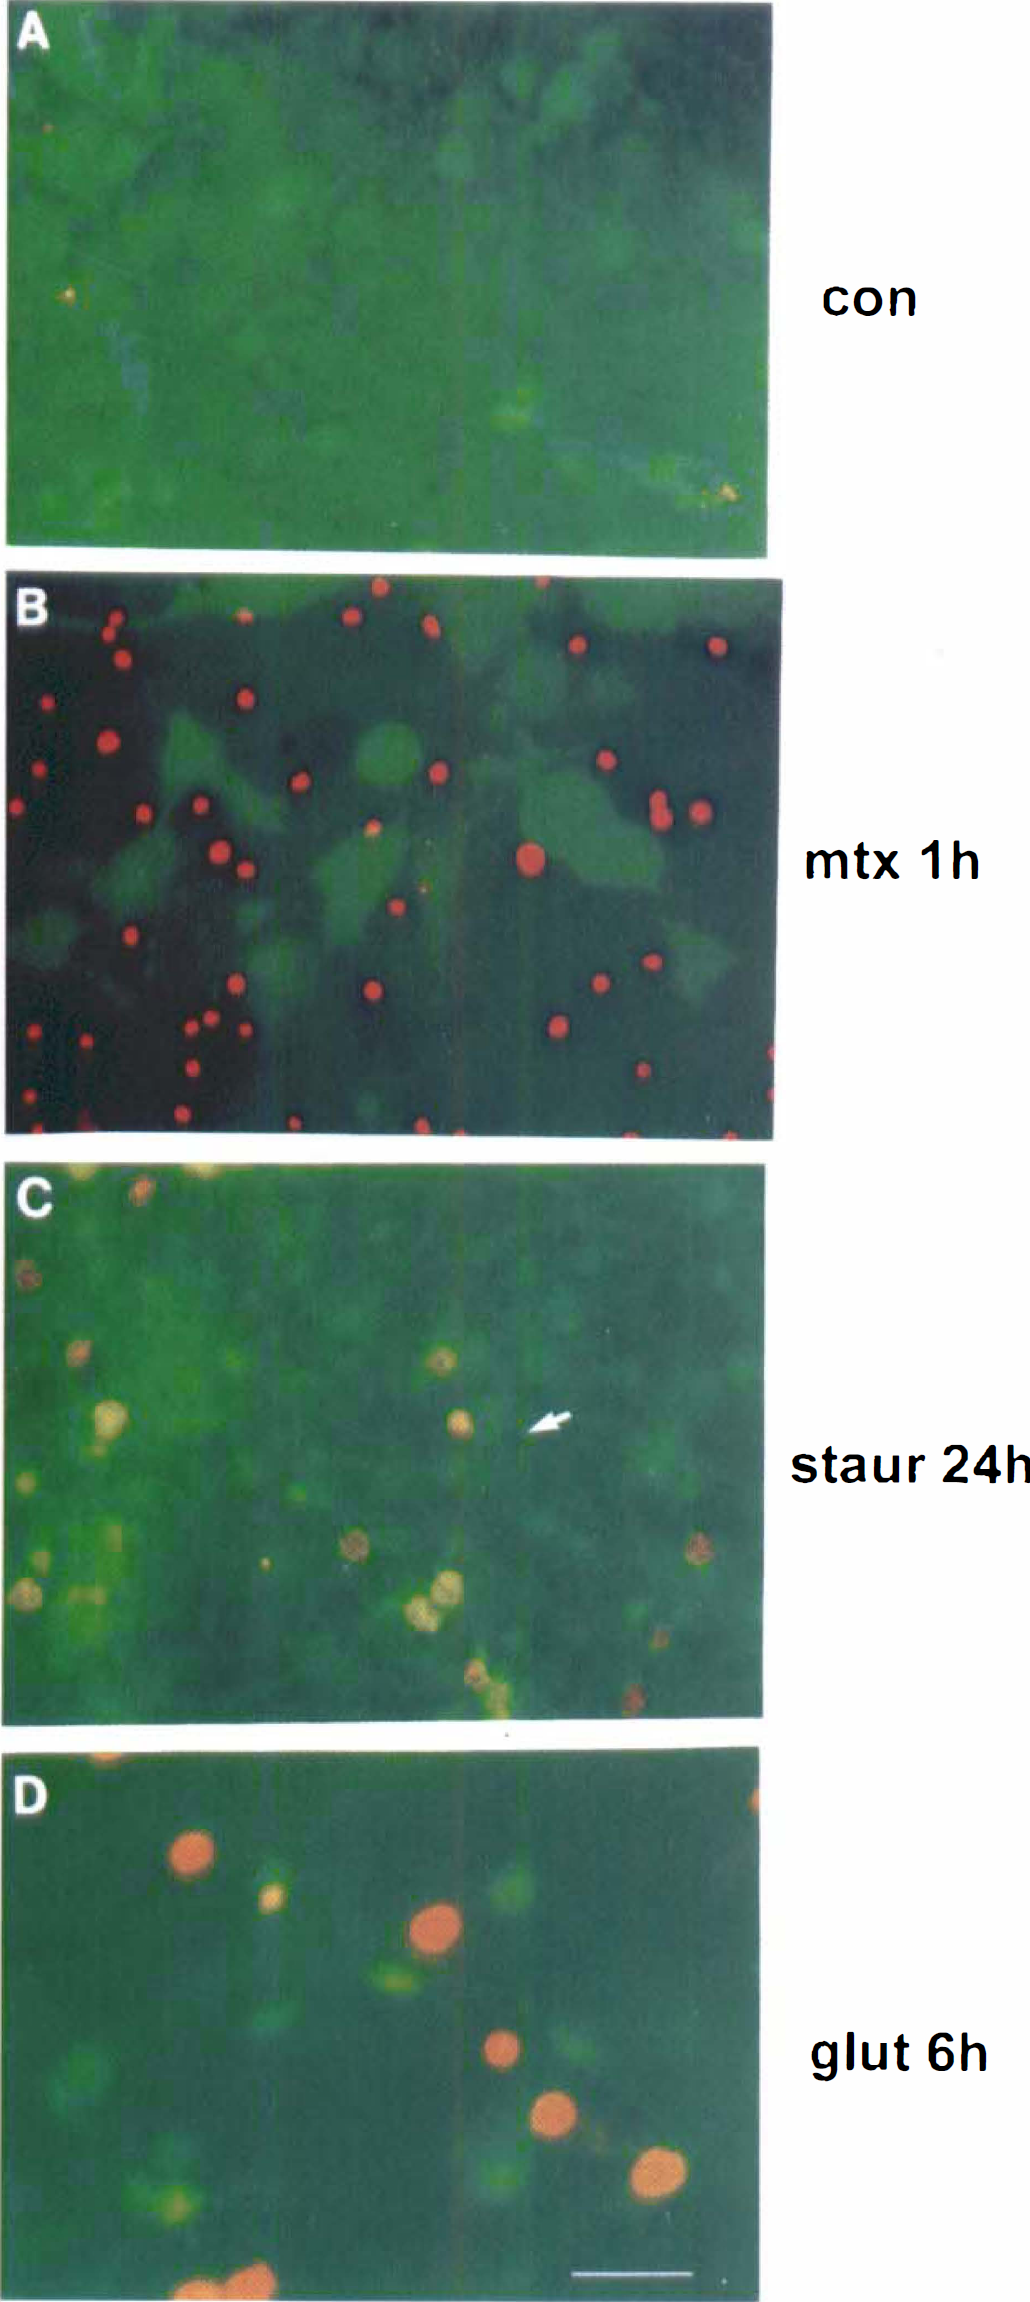
Morphological responses to glutamate challenge. Glutamate-treated septohippocampal cultures underwent morphological alterations in cell structure that were characteristic of neither apoptosis nor necrosis (Figs. 2 and 3). For example, after 6 hours of incubation with 2.0 mmol/L glutamate (Fig. 2D), PI staining detected greater nuclear swelling than observed in maitotoxin-induced necrosis (Fig. 2B) or staurosporine-induced apoptosis (Fig. 2C). In addition, there was no evidence of apoptotic membrane blebbing or necrotic enlargement of cell bodies, as seen in cells injured with staurosporine (Fig. 2C) or maitotoxin (Fig. 2B), respectively. The FDA/PI staining of uninjured control cultures showed healthy FDA-positive cell bodies and few cells stained with PI (Fig. 2A).
Fluorescein diacetate (FDA) and propidium iodide (PI) staining of septohippocampal cultures. (
Course of nuclear morphological alterations during glutamate-induced cell death detected by Hoechst 33258 staining. (
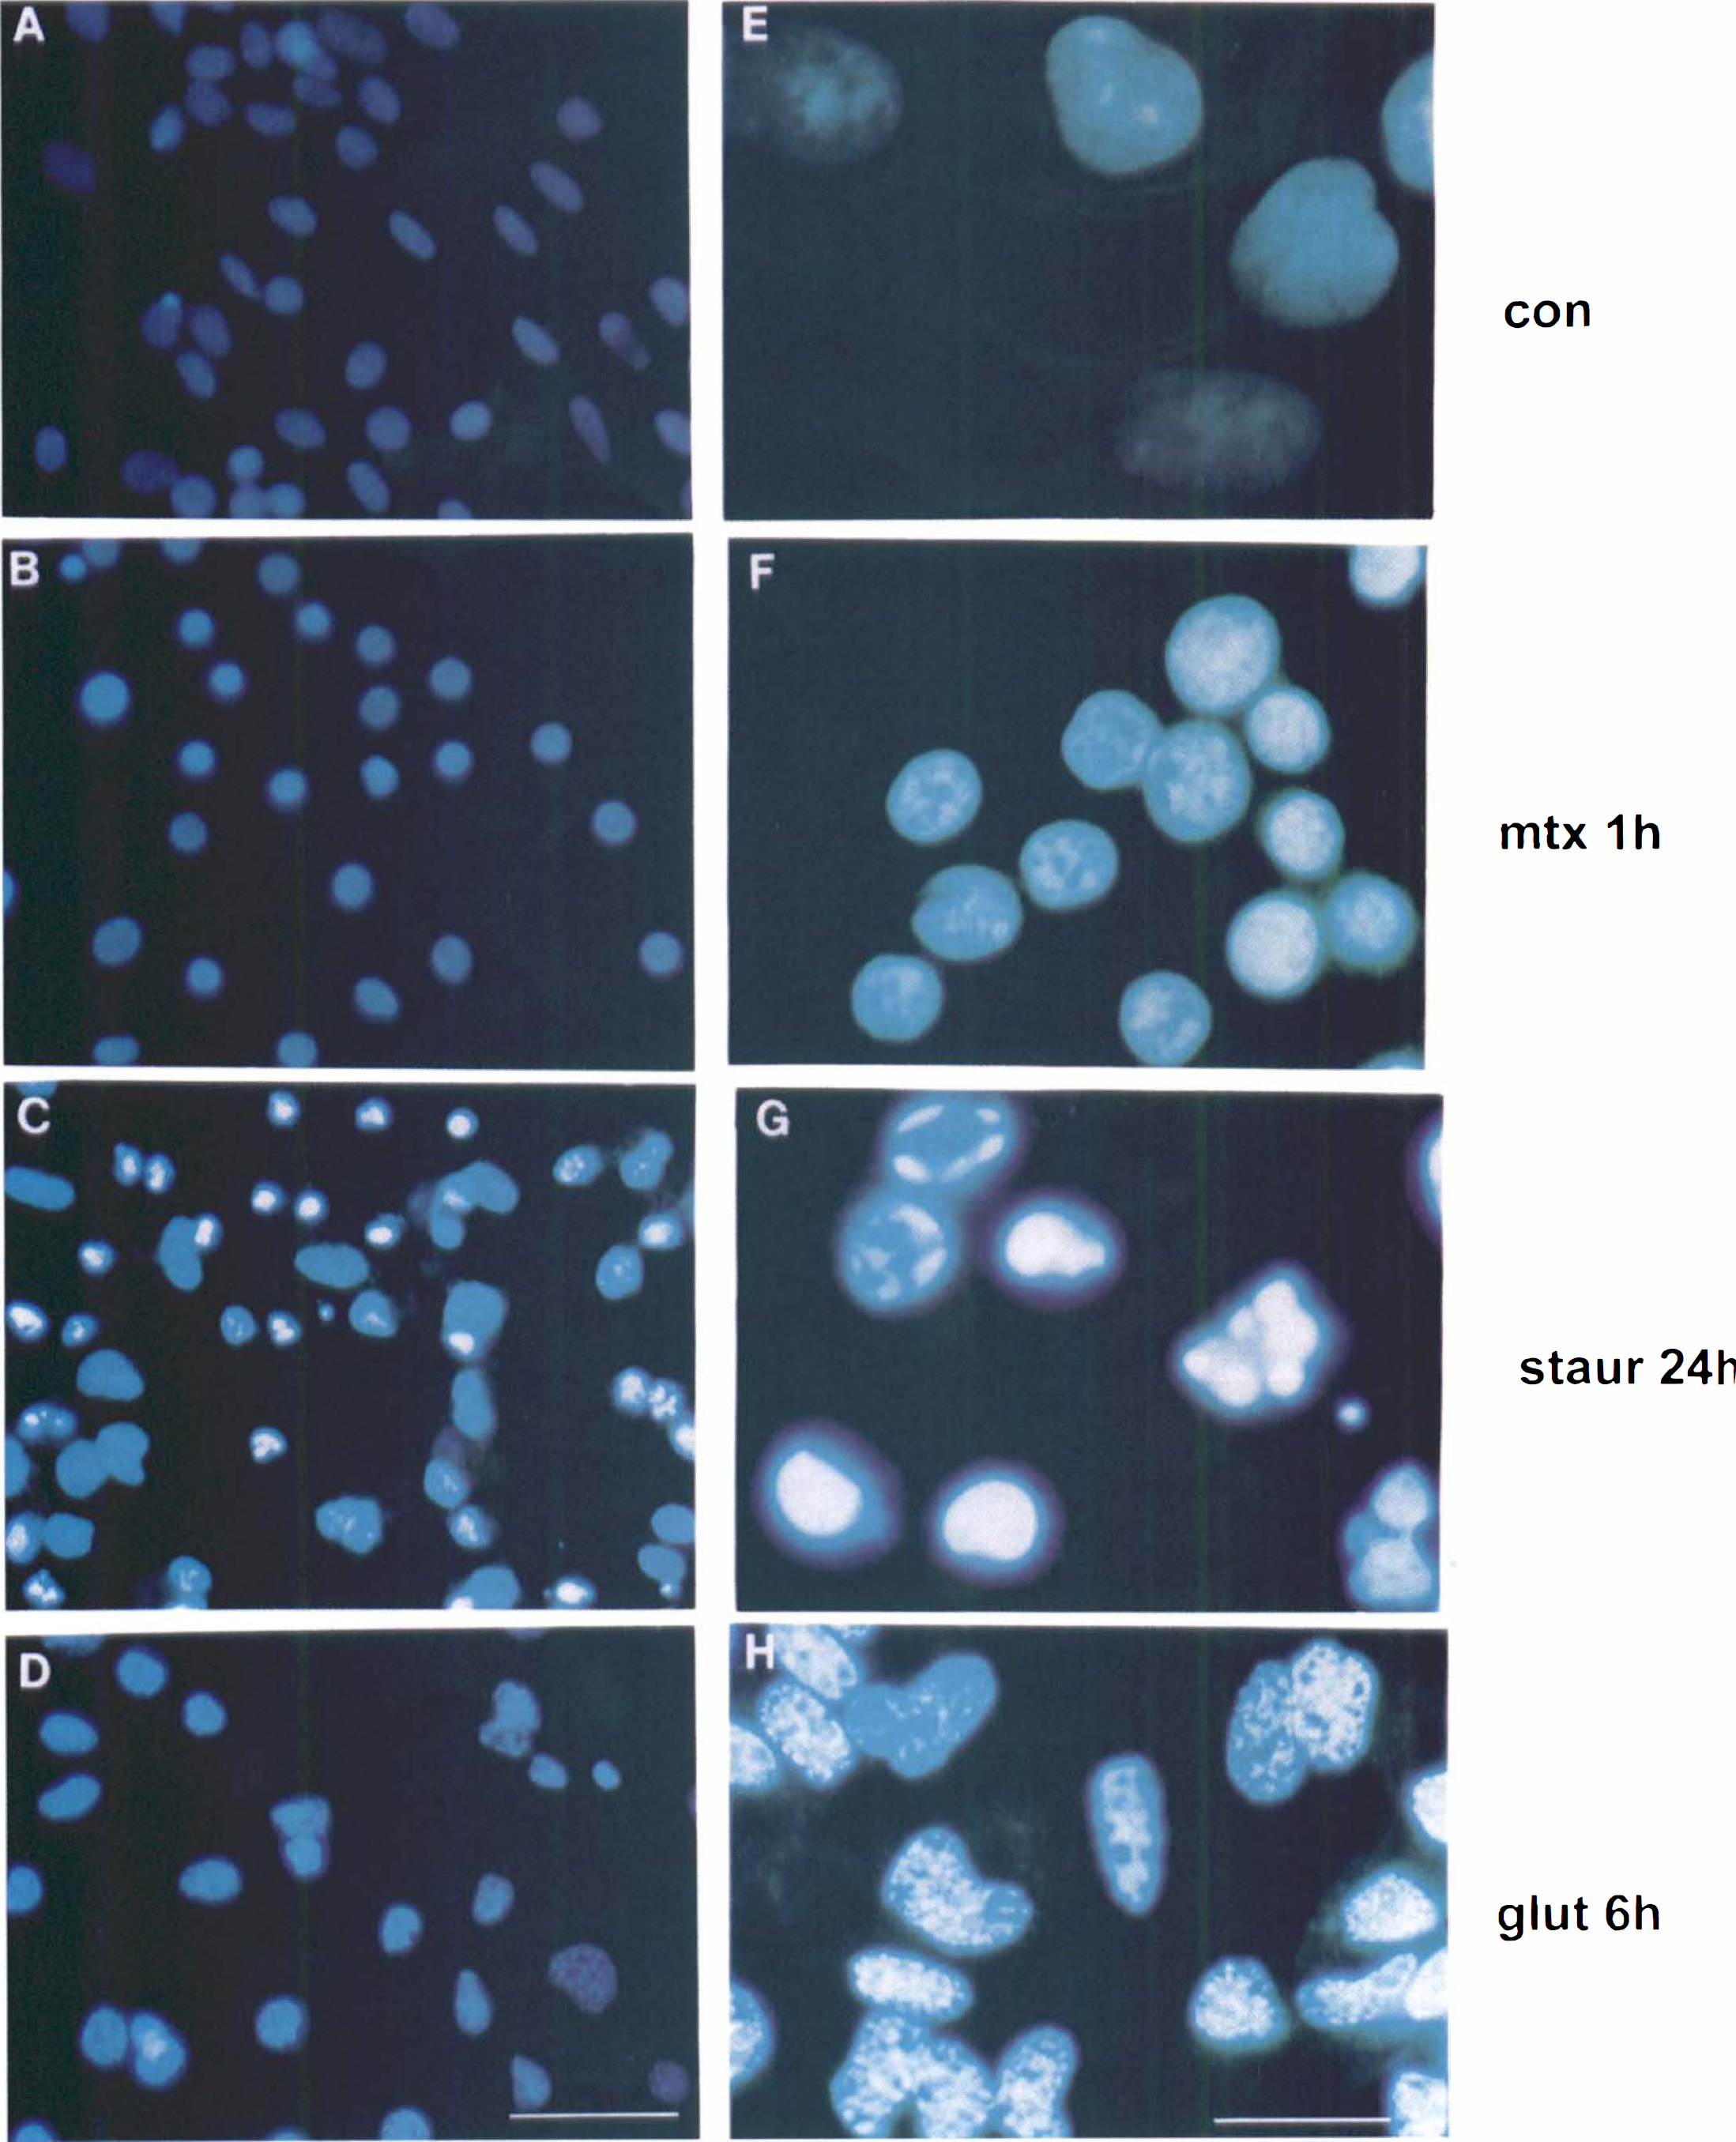
Hoechst staining of nuclear chromatin further characterized cell death characteristics of glutamate toxicity in septohippocampal cultures (Fig. 3). Treatment with maitotoxin (0.1 nmol/L) for 1 hour produced necrotic cell death (Figs. 3B and 3F) that was characterized by a pyknotic but even distribution of chromatin staining. Nuclei of maitotoxin-treated cells appeared smaller, with more condensed chromatin, yielding brighter Hoechst staining. Consistent with necrotic-like cell death, Hoechst staining did not detect chromatin marginization to the nuclear envelope, formation of apoptotic bodies, or other phenotypical evidence of apoptotic-like profiles. In contrast, treatment with staurosporine (0.5 μmol/L) for 24 hours (Figs. 3C and 3G) produced increased condensation and marginization of chromatin to the nuclear envelope as well as formation of dense apoptotic bodies. Treatment with glutamate (2.0 mmol/L) for 6 hours (Figs. 3D and 3H) produced morphological alterations that differed from the classic necrotic and apoptotic changes observed after maitotoxin or staurosporine exposure. After glutamate treatment, cell nuclei were enlarged and eccentrically shaped. In addition, chromatin was aggregated in a diffusely speckled pattern throughout the entire nucleus. Chromatin clumping along nuclear margins and evidence of apoptotic body formation were not observed in glutamate-treated cells. Additional experiments examined changes in nuclear morphology after 1 hour, 24 hours, 3 days, or 5 days of incubation with 2.0 mmol/L glutamate. Hoechst staining revealed that there were no apparent changes in nuclear morphology over this 5-day period (data not shown).
DNA fragmentation. Endonuclytic DNA fragmentation can occur independently of chromatin condensation (Lin and Chou, 1992). Thus, a DNA fragmentation assay was used to determine whether DNA alterations in septohippocampal cultures assessed by Hoechst 33258 staining were associated with endonuclease activity. No dose of glutamate tested (0.5, 1.0, 2.0, or 4.0 mmol/L) produced evidence of DNA laddering after 24 hours of incubation (Fig. 4) or for any other length of incubation tested (15 minutes to 5 days; data not shown). Treatment with maitotoxin also failed to produce DNA ladders, a profile consistent with necrotic cell death. In contrast, treatment with staurosporine produced readily detectable nucleosomal-size DNA fragments characteristic of many apoptotic model systems.
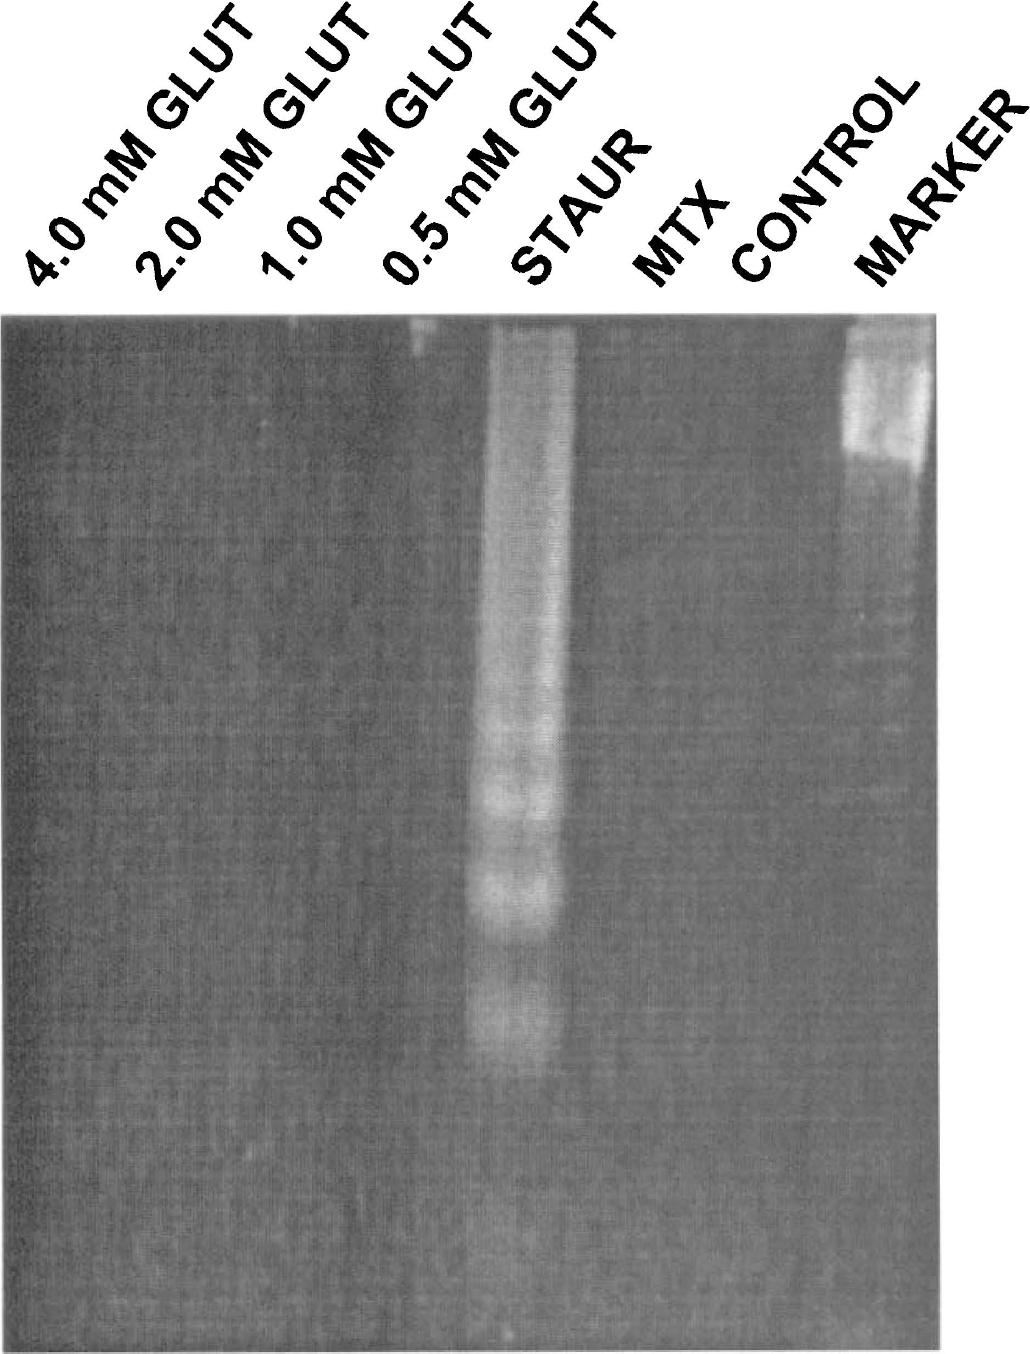
Analysis of oligonucleosomal-sized fragmentation of DNA by endonucleases following treatment with glutamate, staurosporine, or maitotoxin. No dose of glutamate tested (0.5, 1.0, 2.0, 4.0 mmol/L) produced evidence of DNA ladders after 24 hours of incubation. Treatment with maitotoxin (0.1 nmol/L for 1 hour, a dose producing necrotic-like cell death at this time point) also failed to produce DNA ladders. In contrast, treatment with staurosporine (0.5 μmol/L for 24 hours, a dose producing apoptotic-like cell death at this time point) produced readily detectable nucleosomal-sized DNA fragments.
Induction of cell death in both neurons and astroglia in septohippocampal cultures by glutamate. To identify the type of cell (that is, astroglial versus neuronal) injured by glutamate treatment, cells were stained with Hoechst 33258 and immunolabeled with anti-MAP-2 and anti-NeuN to identify neurons (Fig. 5) or anti-GFAP to identify astroglia (Fig. 6). After incubation with glutamate (2.0 mmol/L) for 24 hours (Figs. 5C and 5D), the number of NeuN-immunopositive neurons was markedly reduced as compared with control cultures (Figs. 5A and 5C). In addition, broken dendritic processes were apparent as well as loss of MAP-2 immunoreactivity (Fig. 5C). The MAP-2 immunohistochemistry also detected prominent dendritic beading after glutamate treatment (Fig. 5C). Hoechst staining in injured neurons revealed chromatin aggregation in a diffusely speckled pattern with no chromatin clumping along nuclear margins (Fig. 5D). Incubation with glutamate (2.0 mmol/L) for 24 hours resulted in glial cell death (Figs. 6C and 6D) that was associated with cell shrinkage and membrane folding. These changes ultimately resulted in complete cell detachment and loss of confluence of the glial monolayer. After injury, Hoechst staining revealed DNA aggregation in a diffusely speckled pattern (Fig. 6D) in some GFAp-positive cells (Fig. 6C). Hoechst staining in injured glia revealed a similar nuclear profile to that observed in glutamate-treated neurons (Fig. 5D vs. Fig. 6D).
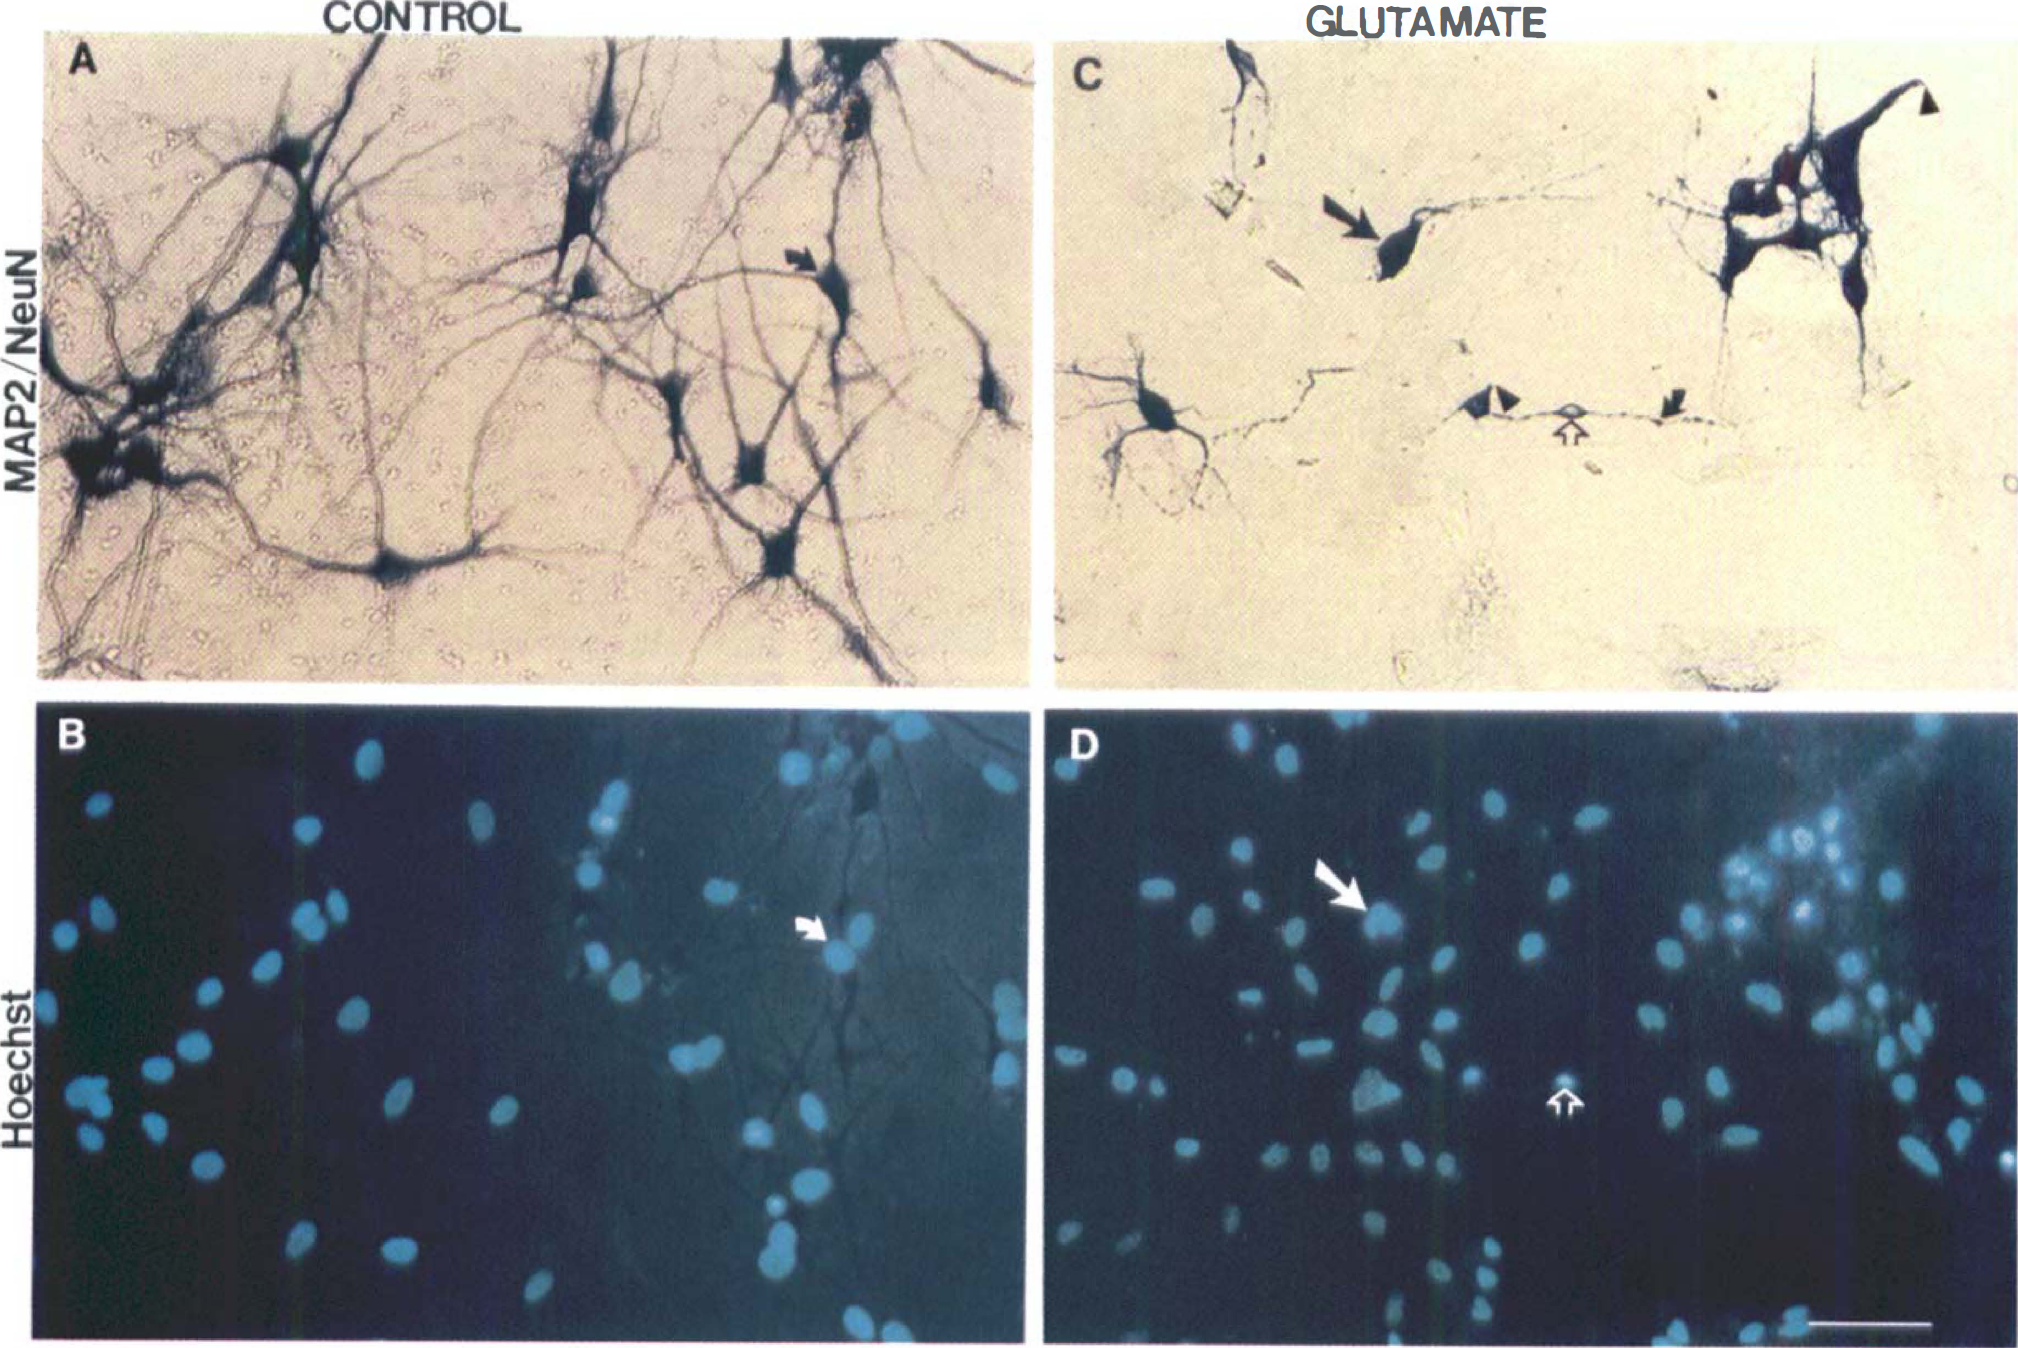
Effects of glutamate toxicity on neurons in mixed septohippocampal cultures. Neurons were stained with both microtubule-associated protein-2 (MAP-2) and neuronal nuclear marker (NeuN) (
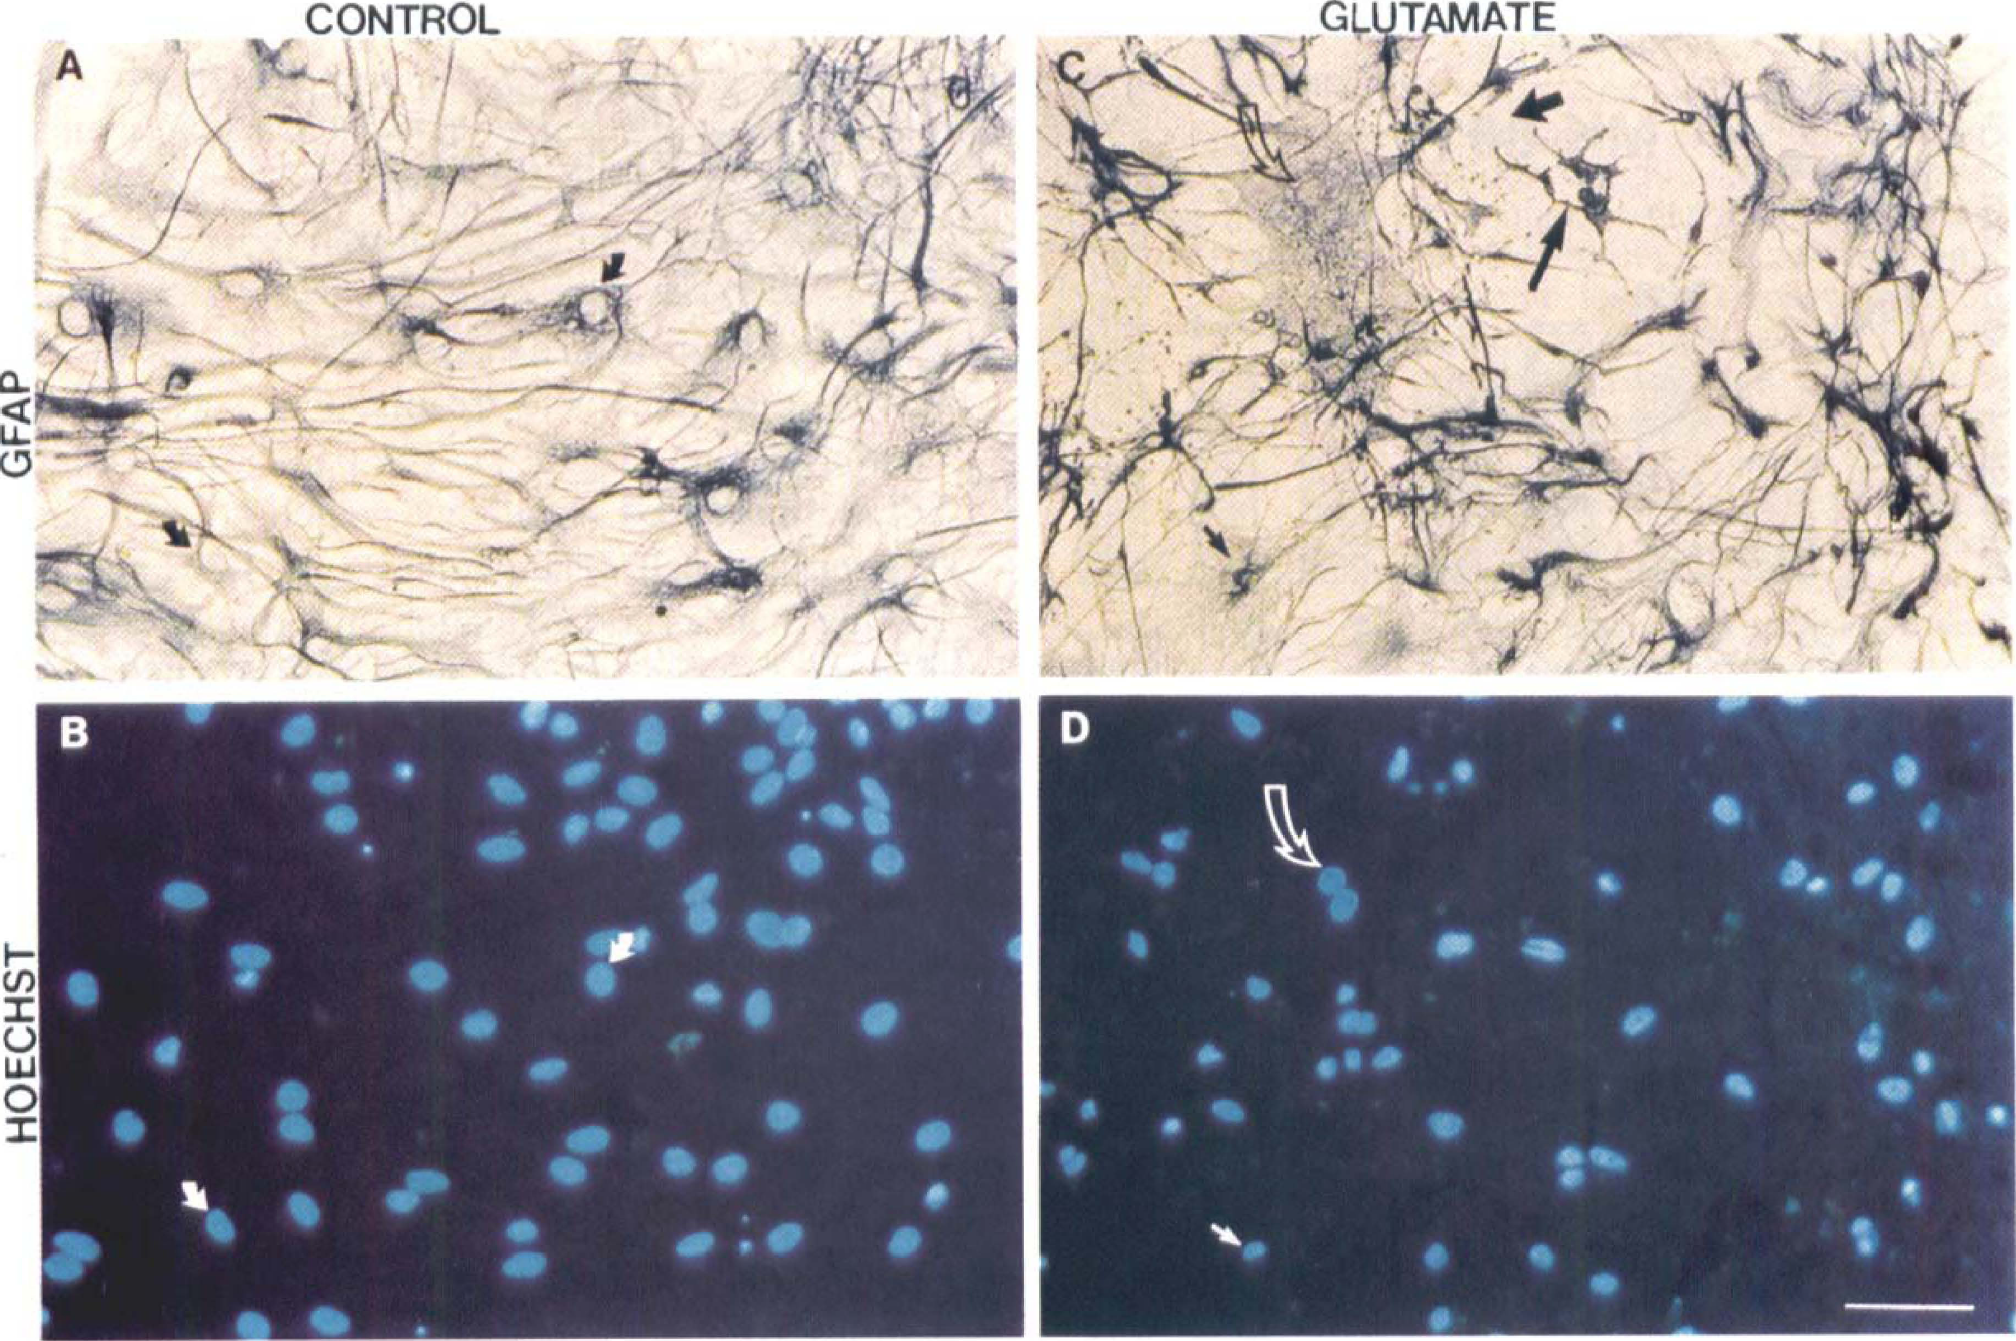
Effects of glutamate toxicity on astroglia in mixed septohippocampal cultures. Astroglia were stained with glial fibrillary acidic protein (GFAP) (
Calpain and caspase-3 proteolysis of α-spectrin
Proteolysis of α-spectrin into 150-kDa, calpain-specific 145-kDa, and caspase-3-specific 120-kDaBDPs was examined after incubation with varying doses of glutamate (1.0, 2.0, and 4.0 mmol/L) for 3, 6, or 24 hours (Fig. 7). Magnitudes of calpain and caspase-3 activation were dependent on concentrations of glutamate and durations of incubation. In general, every dose of glutamate tested produced prominent calpain activation. Lower glutamate concentrations (1.0 and 2.0 mmol/L) produced modest but sustained caspase-3 activation. The highest dose of glutamate (4.0 mmol/L) produced prominent caspase-3 activation after 6 hours of incubation.
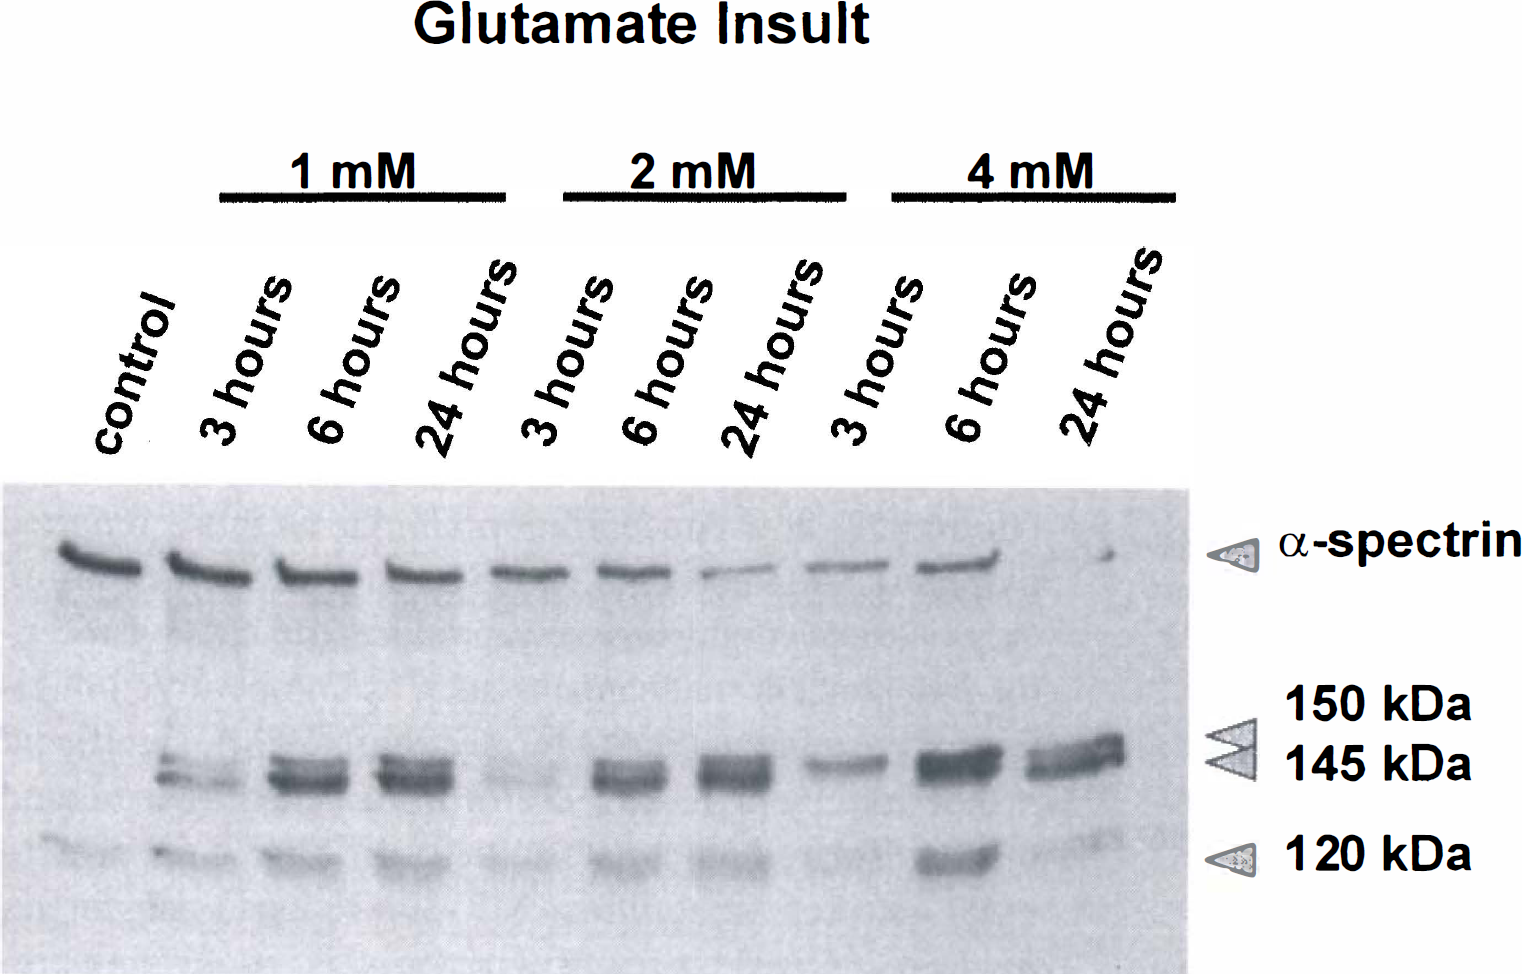
Incubation with varying doses of glutamate produced calpain and caspase-3 protease activation. Proteolysis of α-spectrin into 150-kDa, calpain-specific 145-kDa, and caspase-3-specific 120-kDa breakdown products was examined after incubation with varying doses of glutamate (1.0, 2.0, and 4.0 mmol/L) for 3, 6, and 24 hours.
Effects of N-methyl-d-aspartate receptor antagonism and inhibition of calpains, caspases, and protein synthesis on cell viability and α-spectrin proteolysis
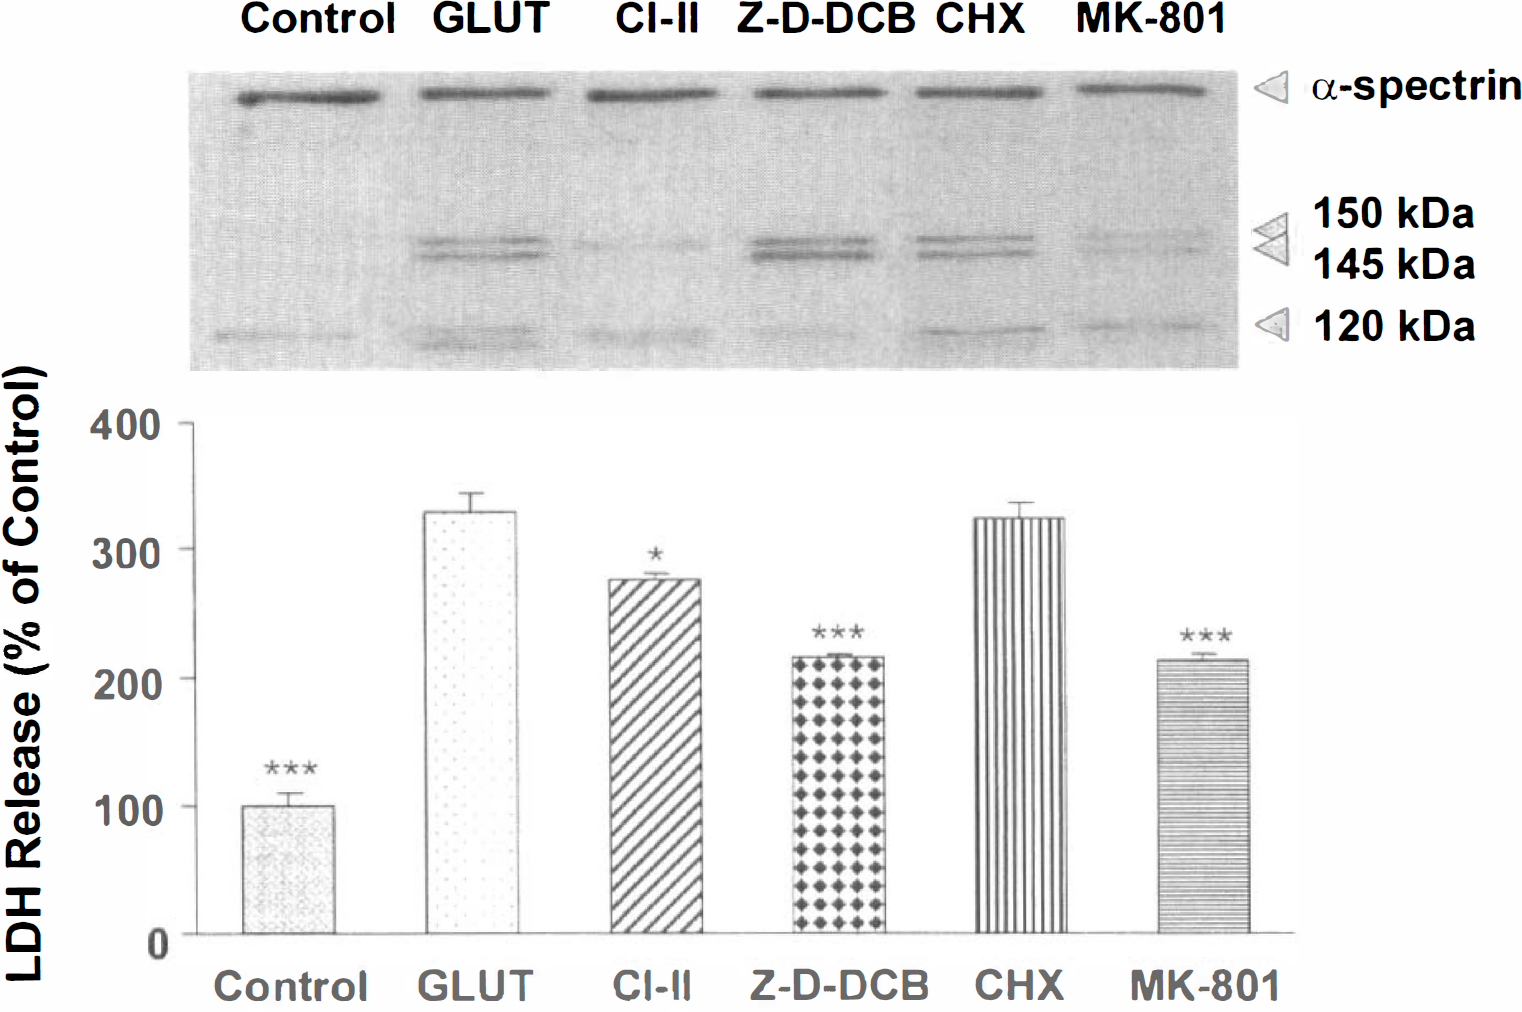
Cell viability assessments. Lactate dehydrogenase release assessed cell viability 6 hours after incubation with 2.0 mmol/L glutamate alone or in combination with varying doses of the NMDA receptor antagonist MK-801 (10 to 500 μmol/L), calpain inhibitor II (5 to 100 μmol/L), and the pan-caspase inhibitor Z-D-DCB (30 to 300 μmol/L; Fig. 8). A significant effect of group was shown by a one-way analysis of variance for MK-801 (F6, 14 = 89.05, P < 0.0001) and Z-D-DCB (F6, 14 = 82.77', P < 0.0001) but not for calpain inhibitor II (F5, 12 = 3.03, P = 0.0535). Post hoc analyses revealed significant differences in LDH release between glutamate-injured and control cells and between glutamate-injured cells and cells treated with all MK-801 doses, 25 μmol/L calpain inhibitor II, and 30 to 200 μmol/L Z-D-DCB. MK-801 provided optimal protection at 100 μmol/L concentrations, inferred by LDH release (Fig. 8A); calpain inhibitor II provided minimal protection against cell death at 25 μmol/L concentrations (Fig. 8B); and Z-D-DCB provided optimal protection at 50 to 100 μmol/L concentrations (Fig. 8C).
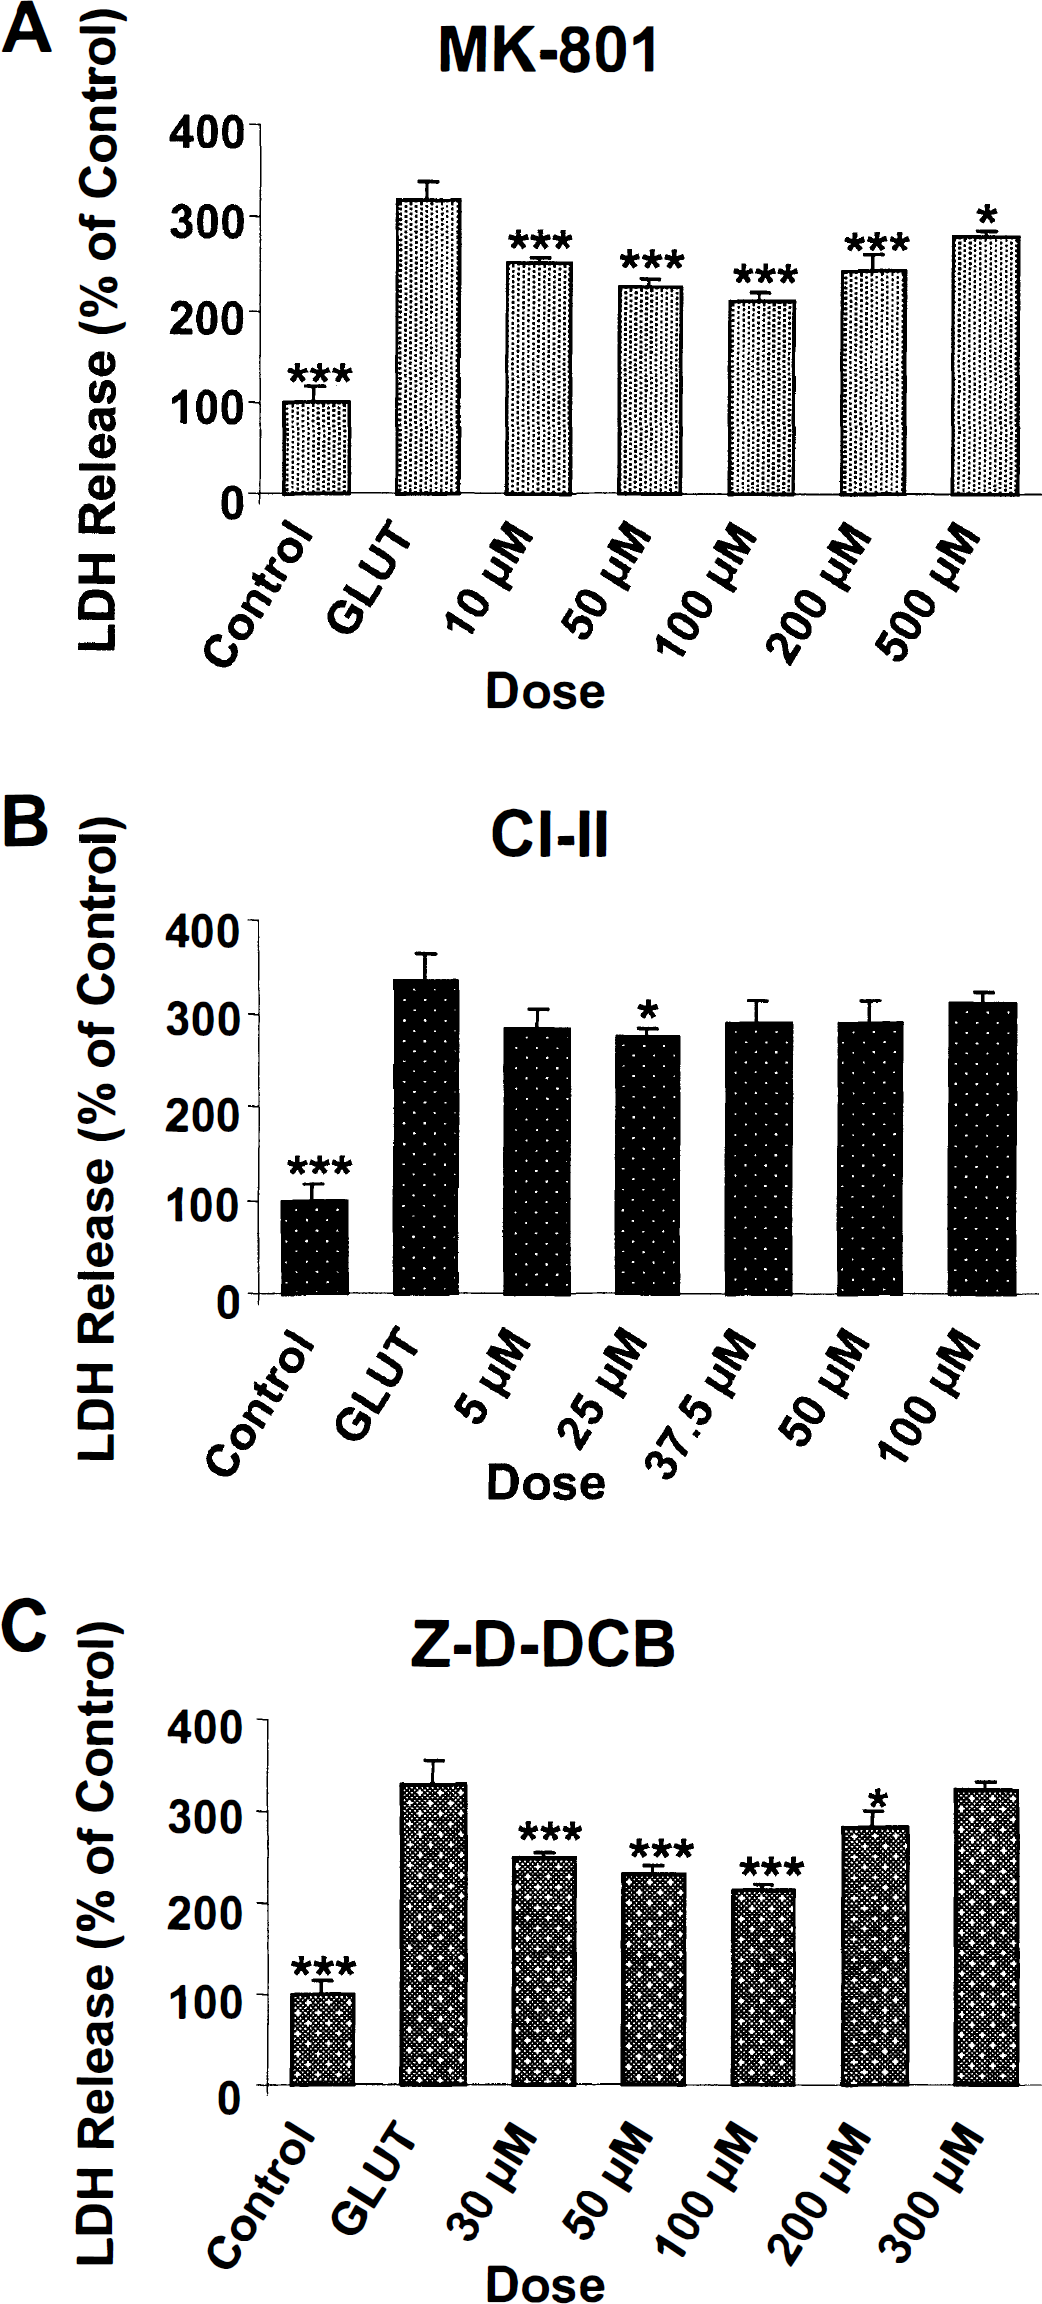
Effects of preincubation with varying doses of the N-methyl-
α-Spectrin proteolysis. Western blots examined proteolysis of α-spectrin into 150-kDa, calpain-specific 145-kDa, and caspase 3-specific 120-kDa BDPs detected after 6 hours of glutamate incubation alone (2.0 mmol/L) or in combination with optimal doses of calpain inhibitor II (25 μmol/L), MK-801 (100 μmol/L), Z-D-DCB (50 μmol/L), and cycloheximide (1 μg/ml). The effects of these drugs on α-spectrin proteolysis were compared with their effectiveness in protecting against glutamate cell death, inferred by LDH release (Fig. 9). Glutamate treatment was sometimes associated with an additional lower molecular mass band, suggesting further processing of α-spectrin not observed in control cultures. A one-way analysis of variance revealed a significant effect of group (F5, 12 = 193, P < 0.0001). Post hoc analyses showed significant differences between glutamate-injured and control cells and between glutamate-injured cells and cells treated with calpain inhibitor II, Z-D-DCB, or MK-801. Although calpain inhibitor II significantly inhibited calpain activation, inhibition only minimally reduced LDH release. The pan-caspase inhibitor Z-D-DCB significantly reduced caspase-3 activation as well as LDH release. The protein synthesis inhibitor cycloheximide failed to block calpain or caspase-3 activation or to reduce LDH release. MK-801 significantly reduced calpain activation as well as LDH release.
DISCUSSION
The present study provides the first systematic examination of cell death phenotypes associated with glutamate toxicity in primary mixed neuronal cultures. The study also provides the first concurrent assessment of potential contributions of two important families of cysteine proteases, calpains and caspases, to glutamate-induced cell death in any model system. Our data suggest that activation of caspase-3 could be an important mediator of glutamate toxicity. Activation of calcium-dependent proteases also contributes to glutamate toxicity, although calpain inhibition was not as effective at providing protection against cell death as was Z-D-DCB. However, Z-D-DCB is a pan-caspase inhibitor, and thus its more robust protection may be due to inhibition of caspases other than caspase-3. Importantly, glutamate-induced cell death did not resemble apoptotic or necrotic phenotypes produced in this same cell system by chemical inducers of apoptosis or necrosis.
Glutamate toxicity in mixed primary septohippocampal cell cultures
Dose-response analyses showed that 2.0 mmol/L glutamate produced −50% cell death in mixed neuronal-glial cultures after 24 hours of incubation. Glutamate-induced cell death in the present study was inferred by both FDA/PI staining and LDH release. In separate studies, we have confirmed that these two measures provide congruent assessments of loss of cell viability (data not shown). Researchers usually find that neuronally enhanced cultures are more sensitive to glutamate toxicity than mixed neuronal-glial cultures (Adamec et al., 1998; Manev et al., 1991), although some investigations have used millimolar concentrations to study glutamate excitotoxicity in neurons (Ikeda et al., 1996). Higher concentrations of glutamate required in mixed culture systems are largely attributable to the formation of a confluent monolayer of astrocytes on which the neurons grow. Astrocytes act as glutamate sinks, aminating this neurotransmitter to form glutamine (Murphy and Horrocks, 1994). Investigators often report that astrocytes can protect neurons from glutamate excitotoxicity (Sass et al., 1993). We confirmed the contribution of astrocytes to reduced glutamate toxicity in our culture system by demonstrating that neuronally enhanced septohippocampal cultures have dramatically increased sensitivity to glutamate toxicity (Fig. 1B).
Major glutamate receptors studied to date are expressed in hippocampal neurons within the first 10 days in culture, with the exception of metabotropic receptors, which constitute < 1% of mature neurons (Craig et al., 1993). This observation is consistent with experiments in our laboratory showing that sensitivity of mixed septohippocampal cultures to glutamate excitotoxicity did not differ between 10 and 15 days in vitro (data not shown). However, full maturation and precise localization of glutamate receptor subtypes at synapses can evolve over >15 days (Craig et al., 1993). Future studies could more systematically examine relationships between the development of glutamate synapses in the hippocampus and mechanisms of glutamate toxicity.
In the present study, glutamate toxicity was observed both in neurons and in glia. Although investigations have assessed glutamate toxicity in neuronally enhanced (Adamec et al., 1998; Ikeda et al., 1996; Manev et al., 1991) or astrocytic (Manev et al., 1991) cultures separately, to our knowledge, no studies have compared the morphopathological changes after glutamate toxicity in neuronal and glial mixed cultures. There are reports of excitotoxic glial injury in vivo (Bolton and Perry, 1998; Matyja, 1986). However, other in vivo (Portera-Cailliau et al., 1995) and hippocampal slice (Siman and Card, 1988) studies failed to detect glial injury.
Proteolytic regulation of glutamate-induced cell death
Calpains and caspase-3 process the cytoskeletal protein α-spectrin (280 kDa) into distinctive proteolytic fragments of 145 kDa by calpains (Harris et al., 1988; Nath et al., 1996a, b ) and 120 kDa by caspase-3 (Wang et al., 1998). Whereas the specificity of the 145-kDa fragment for calpain is well accepted, there has been some controversy regarding the specificity of caspase-3-specific BDPs. However, the specificity of the caspase-3-generated 120-kDa α-spectrin product is well characterized. Recently, Wang and colleagues (1998) reported that when cell lysates were digested for 1 hour with recombinant caspase-1, −2, −3, −4, −6, or −7, only caspase-3 produced accumulation of the 120 kDa α-spectrin fragment. Moreover, our laboratory and others have successfully used this technique to detect independent and/or concurrent calpain/caspase-3 activation in cell cultures (Nath et al., 1996a, b , 1998; Pike et al., 1998b; Wang et al., 1998) and in vivo after traumatic brain injury (Pike et al., 1998a). In addition, the caspase-3-generated 120-kDa α-spectrin fragment has been shown to be an identifying marker of apoptotic cell death in a number of cell lines and cell culture systems (Martin et al., 1995; Nath et al., 1996b, 1998; Pike et al., 1998b; Wang et al., 1998). In the present study, all three concentrations of glutamate produced robust calpain-mediated processing of α-spectrin that was especially 560 apparent 6 hours after injury and sustained for at least 24 hours. Caspase-3 activation was less pronounced and showed some differences associated with glutamate concentrations. Other investigators have reported calpain activation produced by glutamate in hippocampal (Adamec et al., 1998) and cerebellar (Manev et al., 1991) culture systems, and increased caspase-3 activation has been observed after glutamate treatment in cerebellar granule neurons (Du et al., 1997). The pan-caspase inhibitor Z-D-DCB produced significant reduction in caspase-3 activation and cell death, inferred by LDH release, suggesting that caspase activation importantly contributes to glutamate-mediated cell death. As Z-D-DCB is not specific for caspase-3, some protection may be attributable to inhibition of other caspases such as caspase-1. However, calpain inhibitor II, at concentrations that inhibited calpain activation, provided less robust protection against glutamate-induced cell death. Other investigators have reported that calpain inhibition does not protect against glutamate-induced cell death either in cultured hippocampal neurons (Adamec et al., 1998) or in cerebellar granule cells (Manev et al., 1991). However, other in vitro studies have reported protective effects of calpain inhibitors on excitotoxic cell death of cerebellar neurons employing a ligand of non-NMDA receptors (Wang et al., 1996a), in contrast to exogenous glutamate treatment, which was employed in the present study. The relatively modest levels of protection by calpain inhibition against excitotoxic cell death in vitro are surprising in view of a considerable body of evidence showing significant protective effects of calpain inhibitors in in vivo models of cerebral ischemia and traumatic brain injury (Kampfl et al., 1997; Posmantur et al., 1997; Wang and Yuen, 1997). It is possible that calpain inhibition provides suboptimal protection because pathological activation of calpain occurs downstream of other events that could contribute to glutamate-induced cell death, including activation of other calcium-dependent enzymes (for example, lipases and phosphatases) (Homayoun et al., 1997). There may also be important differences in pathogenic stimuli in complex in vivo insults versus glutamate toxicity in vitro that could significantly influence cell death mechanisms in ways that are currently poorly understood.
MK-801 produced significant, although incomplete, reductions in LDH release resulting from glutamate excitotoxicity at a concentration similar to those reported by others (Adamec et al., 1998). As prolonged exposure to glutamate might possibly produce toxicity by receptor-independent mechanisms such as competitive inhibition of cysteine uptake (Murphy et al., 1990), significant protection by MK-801 confirms a receptor-mediated mechanism for glutamate toxicity in hippocampal neuronal cultures. In addition, MK-801 reduced calpain activation, inferred by spectrin proteolysis, confirming previous reports that activation of NMDA receptors is necessary for calpain activation (Adamec et al., 1998).
Characterization of cell death phenotypes in nervous system
Although phenotypic characterization of cell death may remain a useful adjunct strategy, ultimately cell death mechanisms must be defined by biochemical and molecular mechanisms. Activation of these biochemical and molecular mechanisms may depend on cell death signal and cell type, and different mechanisms may be activated separately or concurrently. Future studies should consider the possibility of heterogeneity in cell death mechanisms and associated cell death phenotypes.