
Abstract
In functional neuroimaging studies, the hemodynamic response to functional activation is used as a surrogate marker for neuronal activity, typically in response to task paradigms that use periodic stimuli. With use of a model system of electrical forepaw stimulation in rats (n = 14) with laser-Doppler (LD) monitoring of cerebral blood flow (CBF) changes in the somatosensory cortex, the effects of variations in the interstimulus interval (ISI) on the hemodynamic response to periodic stimuli were examined. A characteristic peak flow response was seen for 4-second stimuli and a peak and plateau response were seen for all 8-second stimuli regardless of ISI. However, both the amplitude of the LDCBF response and the integrated response were significantly reduced for shorter ISIs, whereas the baseline flow was not altered. Somatosensory evoked potential responses were also recorded in some rats (n = 8) and remained unchanged for the various ISIs for a particular stimulus duration. These results suggest that the decrease in the LDCBF responses observed with shorter ISIs likely represents a refractoriness of the hemodynamic response and not neuronal function. These results may have important implications for the optimization and interpretation of functional activation paradigms that use periodic stimuli.
Periodic stimulation is typically employed in functional activation studies for the purposes of signal averaging. Although most functional neuroimaging studies utilize stimulus-induced changes in cerebral blood flow (CBF) or related hemodynamic parameters as a surrogate marker for neuronal function, the effects of the interstimulus interval (ISI) on this hemodynamic response, termed activation-flow coupling (AFC), are only beginning to be investigated. A thorough understanding of the hemodynamic consequences of stimulus timing is necessary for the optimization of stimulus paradigms and for the interpretation of changes in the measured AFC response. In addition, detection of the task activation in event-related functional imaging studies depends critically on an accurate model of the expected AFC response.
Several studies have investigated the effect of variations of the length of the ISI on AFC in humans, using both near-infrared spectroscopy (Obrig et al., 1997) and blood oxygenation level-dependent functional magnetic resonance imaging (BOLD-fMRI) (Buckner et al., 1998; Dale and Buckner, 1997). Near-infrared spectroscopy experiments using finger tapping have shown that the magnitude of the changes in oxygenated and deoxygenated hemoglobin varies with ISI, with the maximal change in hemoglobin occurring at an ISI of 30 seconds (Obrig et al., 1997). Other human studies using fMRI have shown that the BOLD-fMRI signal in the occipital cortex constitutes a linear superposition of overlapping BOLD responses across closely spaced fMRI trials (Dale and Buckner, 1997). These experiments have also demonstrated that activation images from randomly presented visual stimulus trial types can be temporally resolved with ISIs as short as 2 or 5 seconds if selective averaging is used (Buckner et al., 1998; Dale and Buckner, 1997). However, these studies have focused primarily on the temporal resolution of the signal changes with different ISIs. More recently, a BOLD-fMRI study by Pollmann et al. (1998) and an optical imaging study by Cannestra et al. (1998) have examined the effect of variations in the ISI on the amplitude of the hemodynamic response. Both studies showed that as the ISI between stimuli was decreased, there was a significant reduction in signal amplitude (Cannestra et al., 1998; Pollmann et al., 1998).
The AFC can be reliably investigated in animal model systems. Laser-Doppler (LD) flowmetry, which has excellent temporal resolution and can be performed through a thinned skull (Lindauer et al., 1993; Villringer and Dirnagl, 1995), has been previously used to study changes in the AFC response that occur due to whisker (Lindauer et al., 1993), sciatic nerve (Ngai et al., 1995), and forepaw (Ances et al., 1998; Detre et al., 1998) stimulation in rats under α-chloralose anesthesia (Ueki et al., 1988). These studies mostly have used relatively long stimuli and long ISIs (>24 seconds) and have not investigated the effects of ISI on the AFC response.
In this current study, we characterized the changes in the AFC responses in the somatosensory cortex of α-chloralose-anesthetized rats subjected to forepaw stimulation of different durations and different ISIs. Somatosensory evoked potentials (SEPs), employing identical stimulus conditions, were also collected to assess neuronal responses for comparison with changes in flow.
MATERIALS AND METHODS
Surgical preparation
Adult male Sprague-Dawley rats (300-380 g; n = 16) obtained from Charles River (Wilmington, MA, U.S.A.) were initially anesthetized with 1 to 2% halothane in 70% N20/30% O2 by facemask. The tail artery was cannulated with a polyethylene catheter (PE-50) for measurement of arterial blood pressure and arterial blood gases. Rats were tracheotomized, mechanically ventilated, and maintained on 1% halothane in 70% N20/30% O2. The rat head was then secured into a stereotaxic frame, and a midline scalp incision was made with the scalp retracted from the frontoparietal cortex. A 3- × 3-mm-wide square area overlying the forepaw portion of the somatosensory cortex was thinned using a saline-cooled dental drill until only a thin translucent cranial plate remained. Halothane was discontinued after surgery and for at least 45 minutes prior to data acquisition. After surgery and during all stimulation studies, anesthesia was maintained using 60 mg/kg α-chloralose dissolved in saline and given intraperitoneally, followed by hourly supplemental intraperitoneal doses of 30 mg/kg dissolved in saline (Bonvento et al., 1994). Body temperature was monitored with a rectal probe and maintained at 37.0 ± 0.5°C using a heating pad. Arterial blood pressure was monitored continuously with arterial blood gases taken approximately every 45 minutes. Ventilation parameters were adjusted to maintain PaCO2 between 30 and 38 mm Hg.
Forepaw stimulation
Electrical forepaw stimulation was performed using two subdermal needle electrodes inserted into the dorsal forepaw. A function generator (Global Specialties, New Haven, CT, U.S.A.) was used to control the stimulus frequency with frequency fixed at 5 Hz; the stimulus amplitude was maintained at 1.0 mA using a constant-current dense stimulus isolation device (World Precision Instruments A-36V, San Diego, CA, U.S.A.). A micromanipulator on a stereotactic coordinate system (Stoelting, Wood Dale, IL, U.S.A.) was used to place the LD probe normal to the thinned skull. The LD probe (Vasamedics, St. Paul, MN, U.S.A.) was positioned 5 mm lateral to bregma (Ances et al., 1998). All LD measurements were recorded with a time constant of 0.5 second.
Data acquisition
Signal averaging of LD data was accomplished as previously described (Detre et al., 1998). Measurements of signal-averaged LDCBF were made for repetitive periodic stimulation (4 seconds every 8, 12, 16, 24, or 36 seconds and 8 seconds every 16, 24, or 36 seconds). A single iteration was composed of either 80, 120, 160, 240, or 360 data points acquired at 10 Hz, with a single trial consisting of 10 of these signal-averaged iterations. A minimum of two LD trials was performed for each stimulus condition for each rat. The arterial blood pressure tracing was also recorded at all times to ensure that changes in local CBF were not the result of systemic blood pressure changes (Detre et al., 1998).
Somatosensory evoked potentials
Somatosensory evoked responses were recorded from the somatosensory cortex of rats (n = 8). The SEP measurements were interleaved with LD measurements. In all experiments, SEPs were recorded with stainless-steel screws inserted into the skull and secured with dental cement. One electrode was placed behind the thinned skull, and a reference electrode was placed frontally near the midline suture.
Evoked potentials were amplified using a Grass polygraph electroencephalographic amplifier (model 7D; Grass Instruments, Boston, MA, U.S.A.) with band-pass frequencies of 10 Hz to 3 kHz and were averaged using a Labview virtual instrument. Stimulus conditions were identical to those used for LD measurements, except that a stimulus frequency of 4.7 Hz was used instead of 5 Hz to avoid 60-Hz interference. Data were acquired at 20 kHz starting 10 milliseconds before the forepaw stimulus and continued for 60 milliseconds. The stimulus trigger was recorded in a separate channel, and a peak detection algorithm for this channel was used to temporally align data for signal averaging. A single trial consisted of 200 averages with at least two trials performed for each rat for each stimulus and ISI duration.
Data analysis
Signal-averaged LD data were saved as raw voltages and converted to percent changes from baseline by dividing the corrected flow by the average baseline flow value obtained before application of the stimulus. For shorter ISIs (4-second stimulus every 8 seconds and 12- and 8-second stimuli every 16 seconds), the corrected flow was divided by the average baseline flow value of the first 40 or 80 data points obtained before the application of the first stimulus. Results from two rats were discarded due to the absence of a reproducible AFC response or death during the stimulation studies. In the remaining rats, data were averaged from trials with identical stimulus parameters and ISI durations for each rat. Data from multiple rats with the same experimental stimulation protocols were collated, and an overall average for all rats was determined along with intersubject standard deviations. The delay to response (DR), delay to peak (DP), half-width at half-maximum (HWHM), peak height (PH), and the integrated response were determined for LDCBF results for each stimulus parameter and ISI length. The DR was defined as the first point in the series of sustained values that exceeded 2 SD above the average prestimulus baseline. The PH was calculated by averaging 1 second of data surrounding the group average peak. This procedure allowed for averaging across identical time points in all rats and avoided errors in peak picking due to noise within individual rat data. The integrated response was determined for each rat by summing each point composing the peak in signal-averaged responses. Raw voltage data were also analyzed for changes in the PH and baseline values across iterations without signal averaging or baseline correction. For these studies, the PH of each iteration was determined by averaging 1 second of data surrounding the determined PH for each ISI for each rat. The baseline value of each iteration was determined by averaging 1 second of data surrounding the baseline period of each ISI for each rat.
All digitized SEP data were averaged from multiple trials with identical stimulus parameters and ISIs within each rat. The latency to the P1, N1, and P2 as well as the N1-P2 amplitude were determined for some rats (n = 8). The P1 latency was defined as the time interval between stimulation and the first positive peak wave appearance. The N1 latency was defined as the time interval between stimulation and the first negative peak wave appearance. The P2 latency was defined as the time interval between stimulation and the second positive peak wave appearance.
Statistical analysis
All data are expressed as means ± SD. A one-way analysis of variance with repeated measures was performed on DR, DP, HWHM, and PH values obtained for the different ISIs (Sigma Stat; SPSS, Chicago, IL, U.S.A.). Subsequent analysis was performed using the Tukey test when a significant difference was found. Differences were considered to be significant at the P < 0.05 level.
RESULTS
Physiologic variables
Physiologic parameters for this study were as follows: mean arterial pressure = 115 ± 5 mm Hg; pH = 7.39 ± 0.02; PaCO2 = 32.6 ± 2.1 mm Hg; PaO2 = 112 ± 4 mm Hg (mean ± SD, n = 14). No significant changes in physiological variables were detected during different ISIs.
Effects of different interstimulus intervals on magnitude of activation-flow coupling and integrated response
Signal-averaged LD responses through a thinned skull due to forepaw stimulation were reproducible across all rats. A characteristic peak AFC response was seen for all 4-second stimuli regardless of the ISI. However, the magnitude of the AFC response varied significantly as a function of the ISI, with a significant reduction in the magnitude of the stimulus-induced AFC response occurring as the ISI decreased below 12 seconds (Fig. 1A). For all 8-second stimuli, the shape of the AFC responses consisted of an initial peak response followed by a plateau phase that persisted for the length of the stimulus. As the ISI decreased below 16 seconds, there was also a significant reduction in the magnitude of the stimulus-induced AFC response (Fig. 1B).
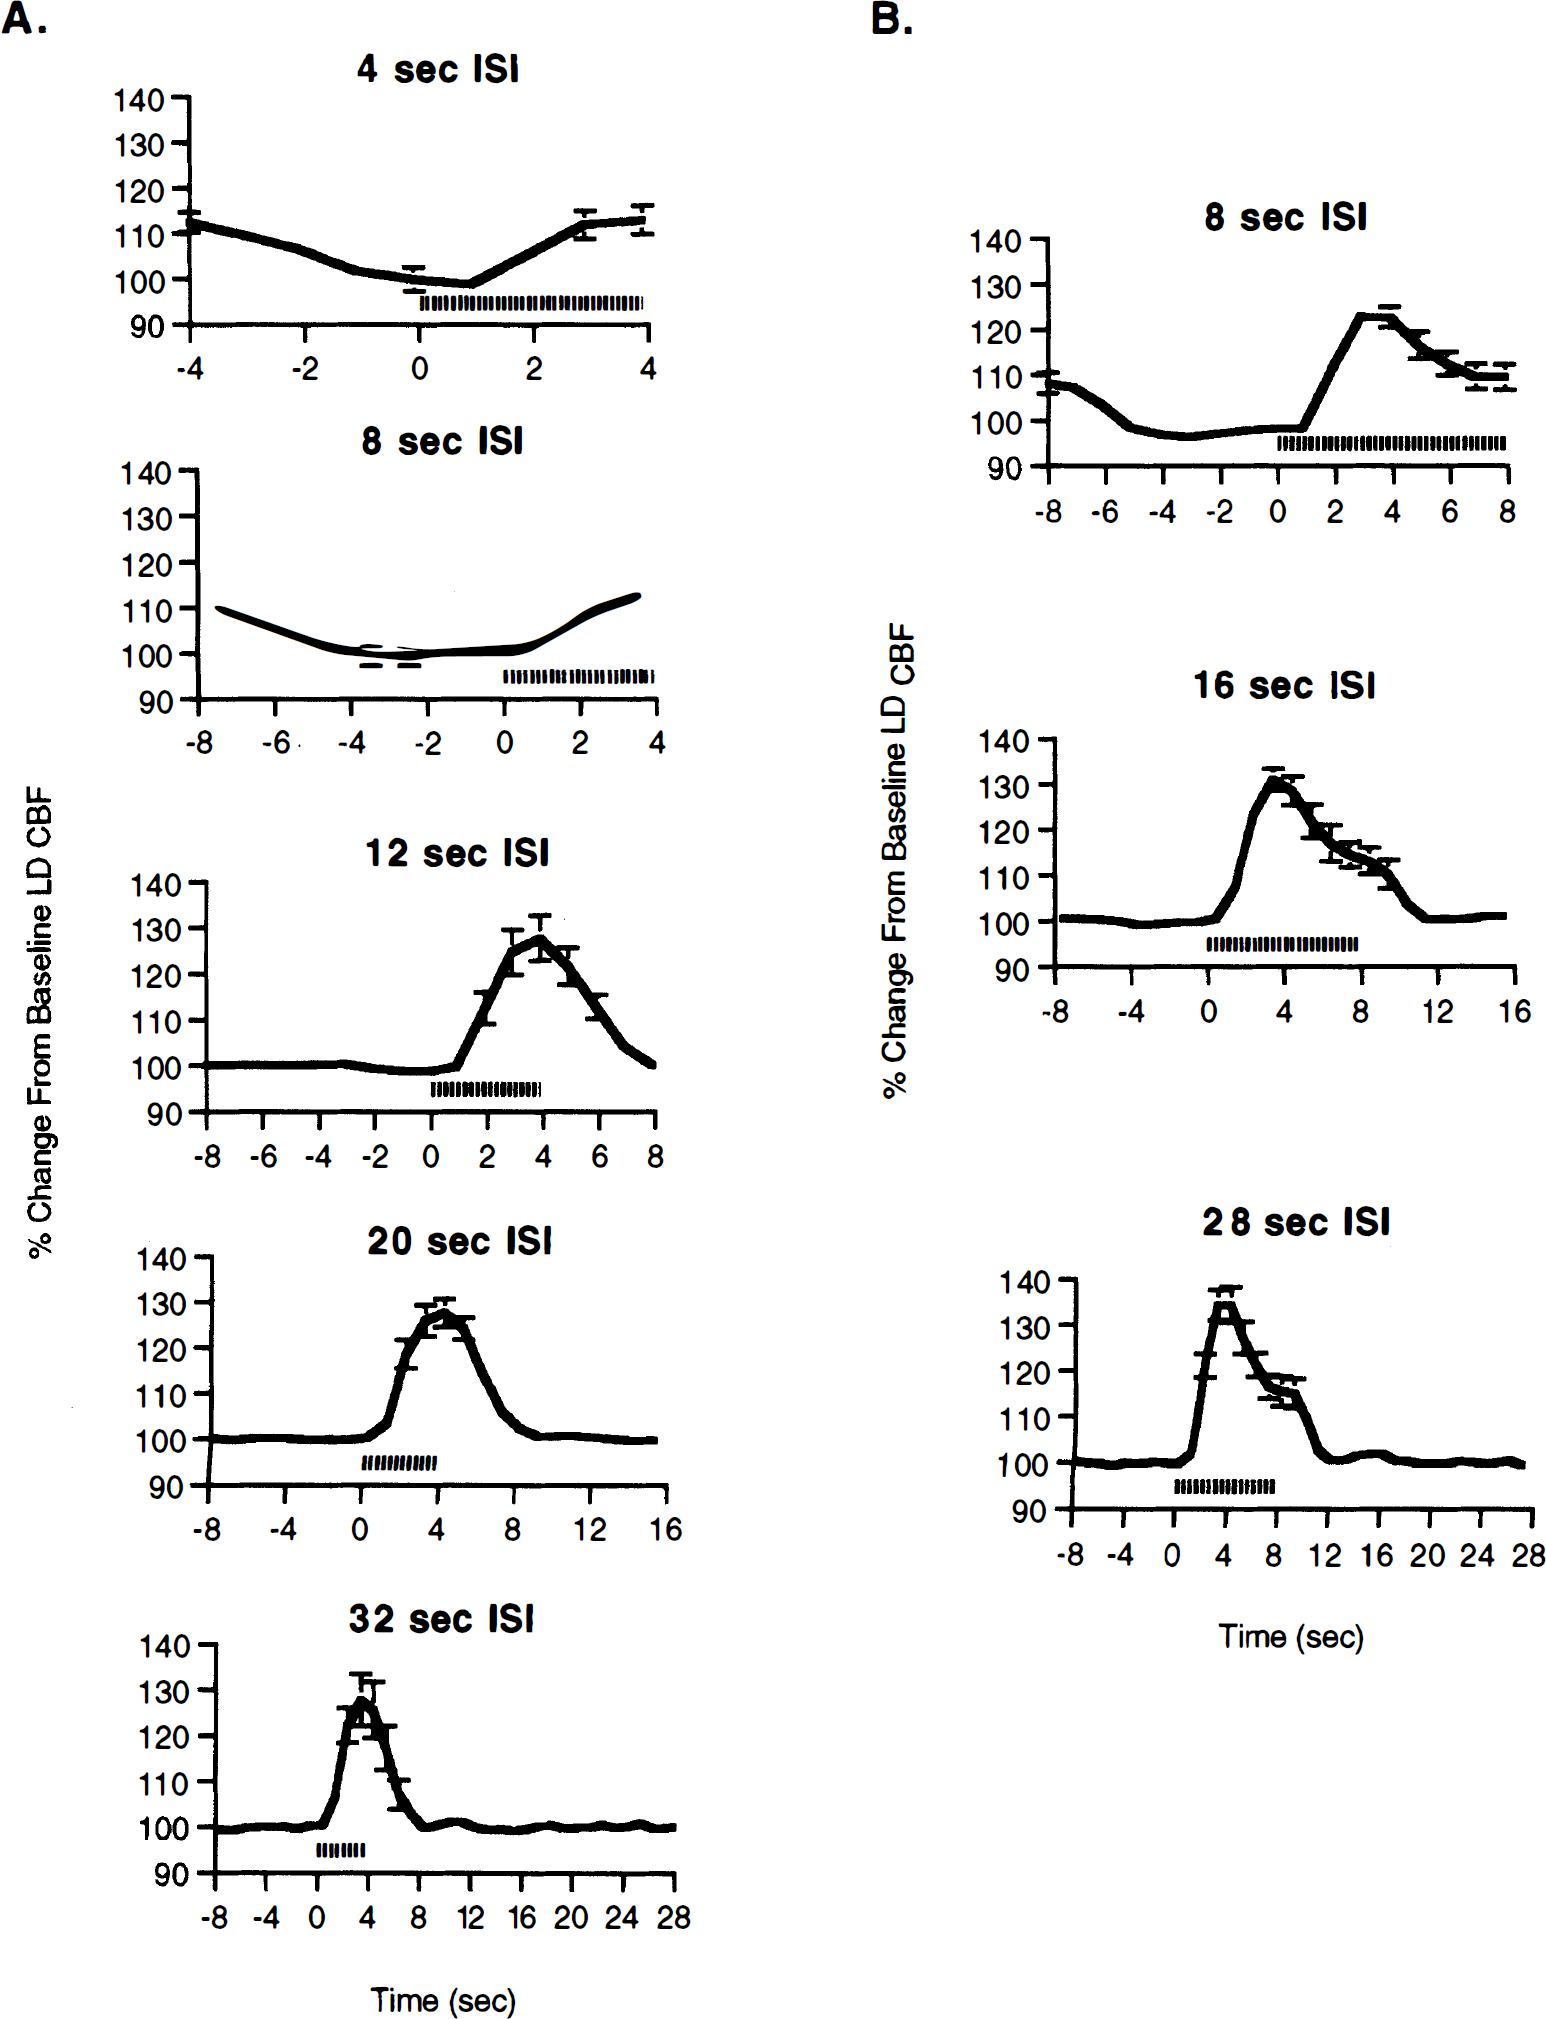
Activation-flow coupling (AFC) responses for various interstimulus intervals (ISIs) for both 4-second
Figure 2 shows the effects of different ISIs on the integrated flow responses to forepaw stimuli. For shorter ISIs, regardless of the stimulus duration, the integrated responses were significantly reduced compared with the responses to longer ISIs. The integrated response was significantly reduced for shorter ISIs of 4 and 8 seconds compared with longer ISIs of 12, 20, and 32 seconds (P < 0.001) (Fig. 2A). A reduction in the integrated response with shorter ISI (8 seconds) was also seen for 8-second stimuli, as the integrated response for the shortest ISI (8 seconds) was significantly attenuated compared with longer ISIs of 16 and 28 seconds (P < 0.001) (Fig. 2B).
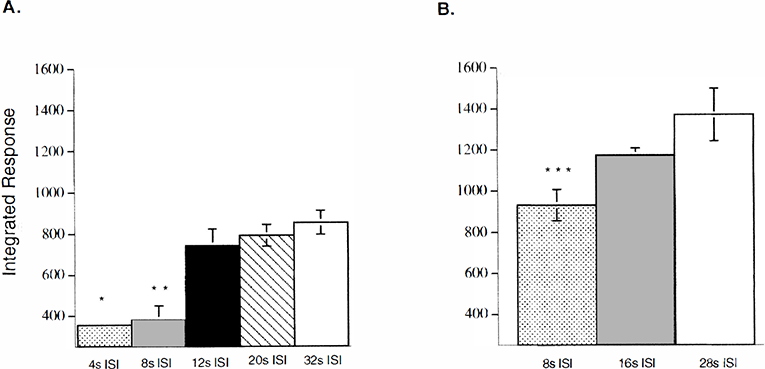
Bar graphs show the integrated responses for the various interstimulus intervals (ISIs) for the 4-second
Influence of interstimulus interval variations on activation-flow coupling response parameters
Figure 3 shows the DR as a function of the ISI for both 4- and 8-second stimuli. For 4-second stimuli, the DR was significantly increased not only for 4- and 8-second ISIs but also for 12-second ISIs compared with longer ISIs of 20 and 32 seconds (P < 0.05). For 8-second stimuli, the DR was significantly prolonged for the shortest ISI (8 seconds) compared with longer ISI lengths of 16 and 28 seconds (P < 0.05).
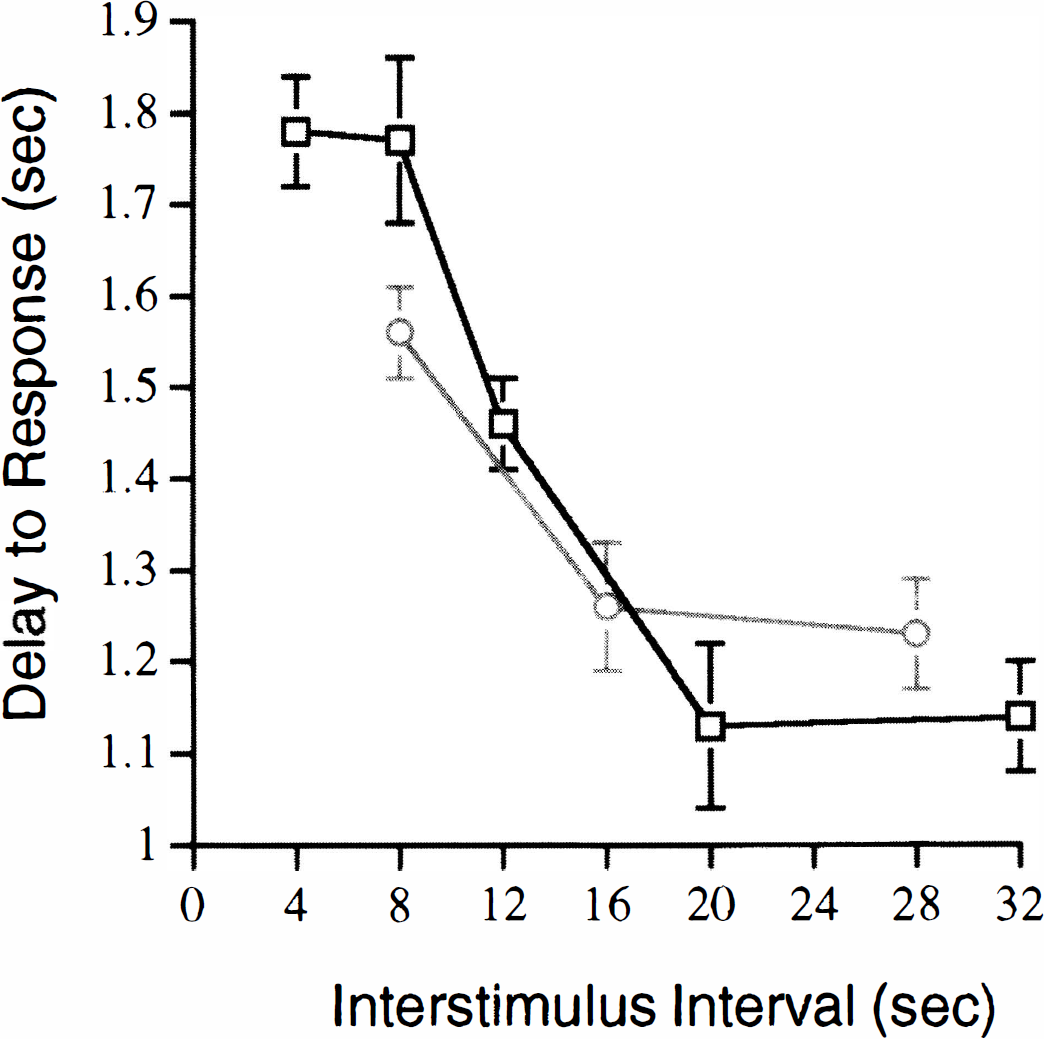
Delay to response (DR) for different interstimulus intervals (ISIs) for both 4- and 8-second stimuli. (Squares), 4-second stimuli; (circles), 8-second stimuli. Error bars indicate SD (n = 14 rats).
The PH, DP, and HWHM values were also determined for all 4- and 8-second stimuli for the different ISIs and are presented in Table 1. For 4-second stimuli, the PH was significantly reduced (P < 0.05) at shorter ISIs of 4 and 8 seconds compared with ISIs of 12, 20, and 32 seconds. Similar results were seen for 8-second stimuli, with the shortest ISI (8 seconds) leading to a significant reduction (P < 0.05) in the PH compared with longer ISIs of 16 and 28 seconds. The PH values for the longer ISIs (16, 20, 28, and 32 seconds) were not significantly different for either of the stimulus durations.
Response parameters for different ISIs caused by forepaw stimulation
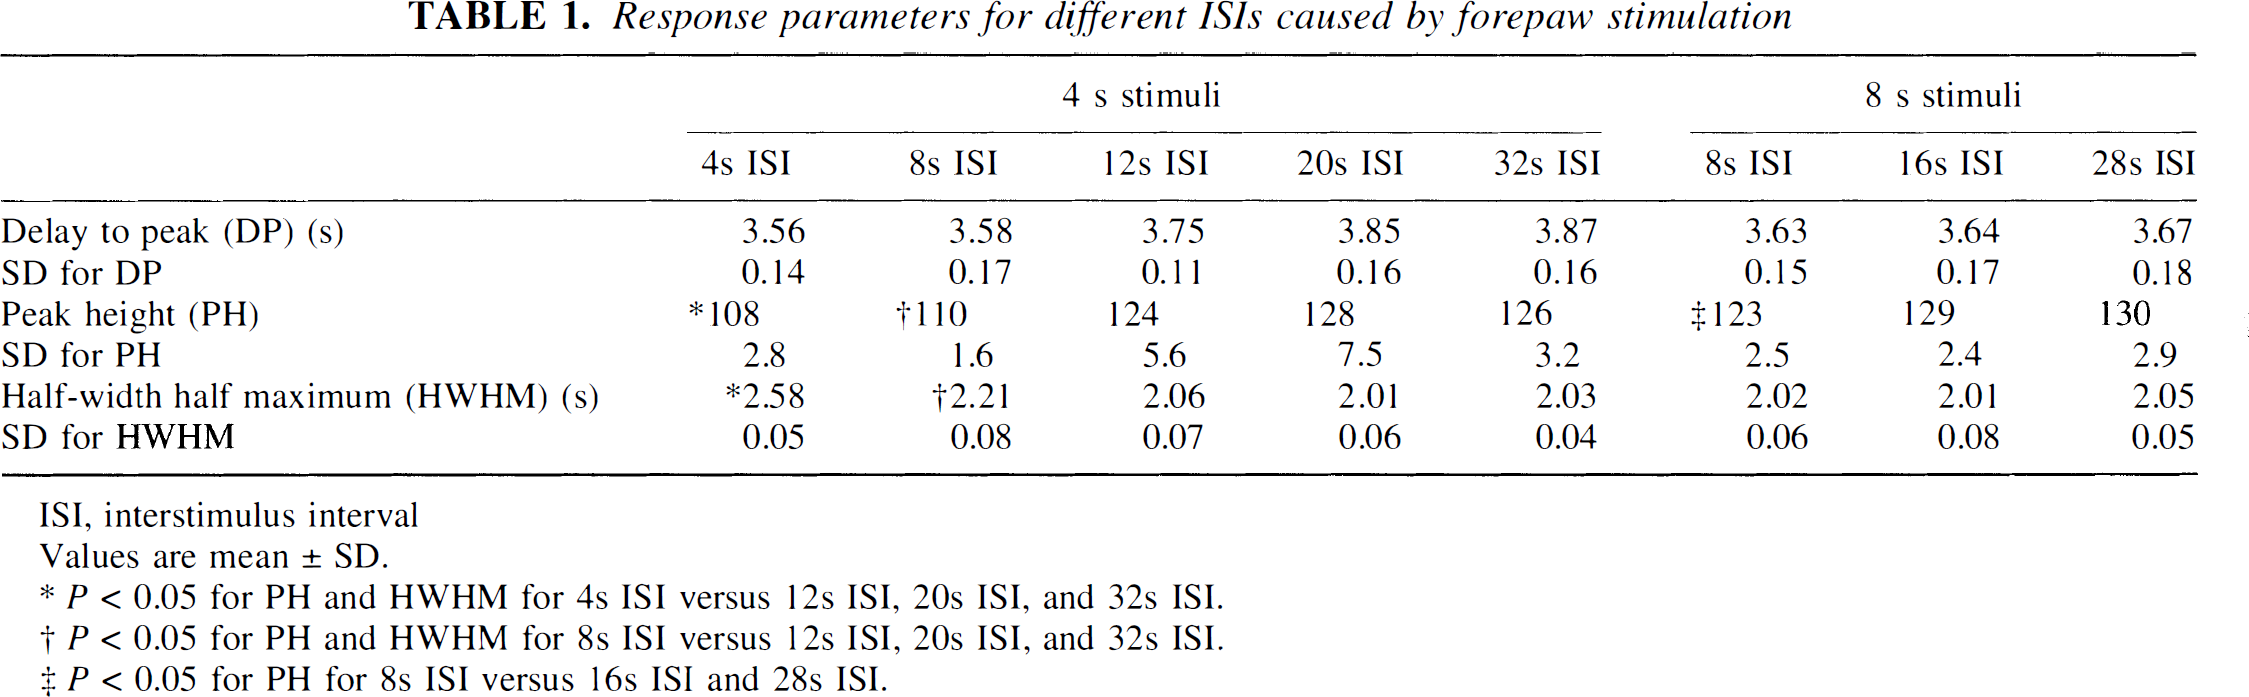
ISI, interstimulus interval
Values are mean ± SD.
P < 0.05 for PH and HWHM for 4s ISI versus 12s ISI, 20s ISI, and 32s ISI.
P < 0.05 for PH and HWHM for 8s ISI versus 12s ISI, 20s ISI, and 32s ISI.
P < 0.05 for PH for 8s ISI versus 16s ISI and 28s ISI.
The DP was not significantly affected by variations in ISIs for all 4-second stimuli. The DP was similarly unaffected for all 8-second stimuli regardless of the ISI length. The HWHM for 4-second stimuli was significantly prolonged for 4- and 8-second ISIs compared with longer ISIs of 12, 20, and 32 seconds (P < 0.05). For all 8-second stimuli, the HWHMs were similar regardless of the ISI.
Evoked potential measurements for different interstimulus intervals
Evoked potentials were reliably recorded from the same hemisphere in which flow was measured by LD (n = 8). Typical averaged SEP responses from a single rat for four-second stimuli with different ISIs are shown in Fig. 4. These SEP responses are the average of two trials, with each trial consisting of 200 signal-averaged responses. The typical SEP response for 4-second stimuli consisted of an initial sharp positive wave (P1) at ∼10 milliseconds after stimulus followed by a negative (N1) wave at ∼13 milliseconds after stimulus. A second positive peak was seen ∼17 milliseconds after the stimulus with the N1-P2 amplitude around 180 mV. For some rats, a second negative wave (N2) was also present. The SEP did not change for 4-second stimuli regardless of the ISI. The SEP responses for all 8-second stimuli were morphologically similar to those seen for 4-second stimuli and did not change with different ISIs (data not shown). However, there was a trend toward a decrease in the N1-P2 amplitude for 8-second stimuli compared with 4-second stimuli regardless of the ISI (Table 2), which may reflect neuronal adaptation with longer stimulus durations.
SEP values for different ISIs
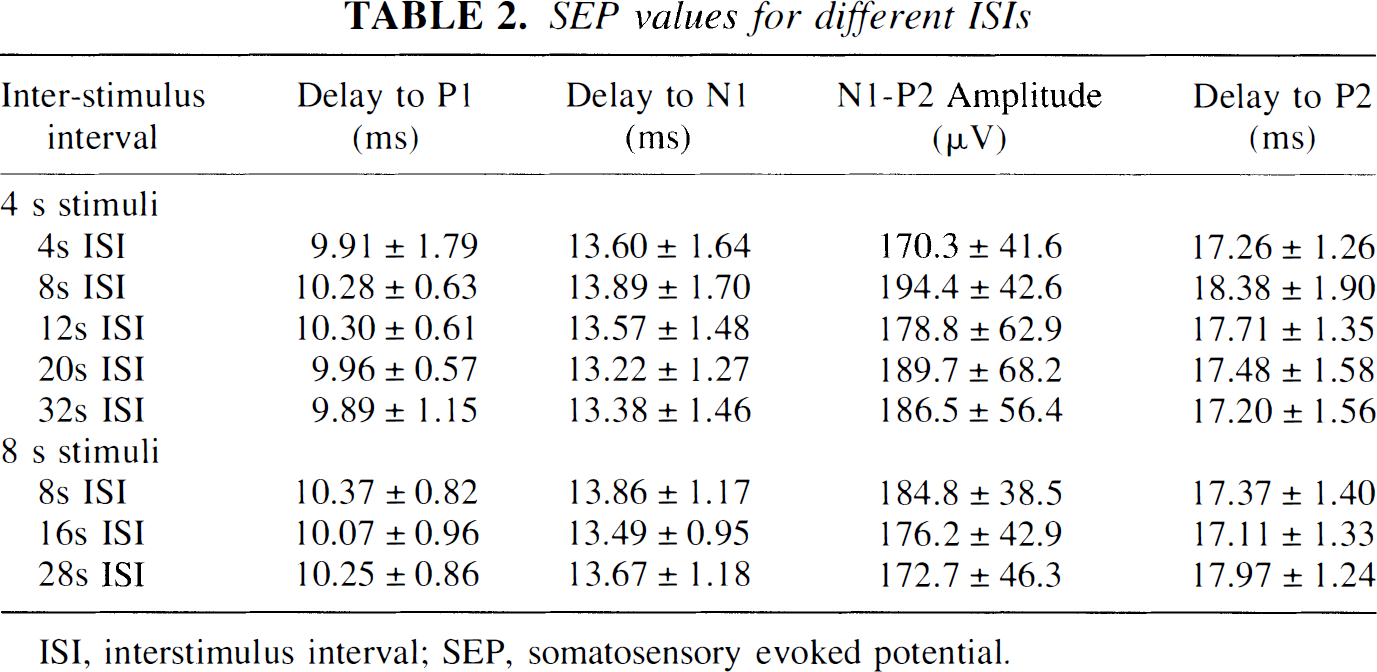
ISI, interstimulus interval; SEP, somatosensory evoked potential.
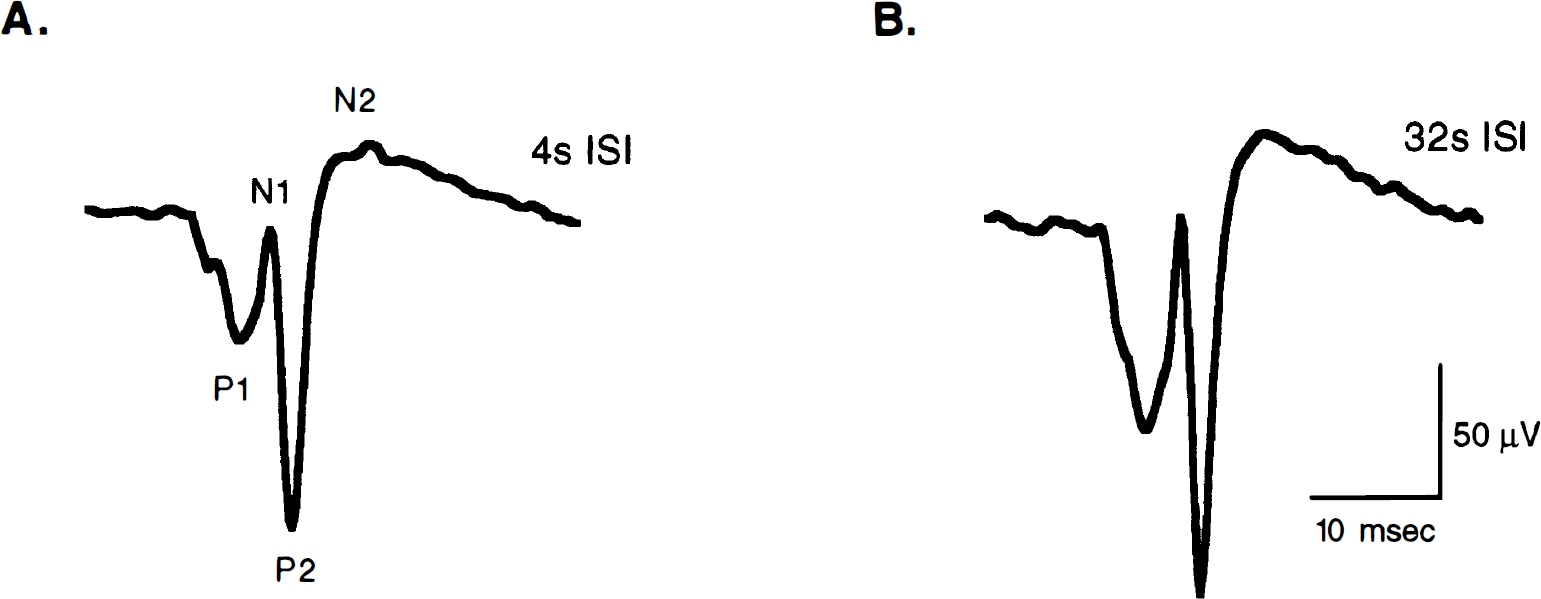
Somatosensory evoked potential (SEP) tracings from a single characteristic rat for 4-second stimuli for 4-second
Changes in peak height and baseline across iterations
To further assess the basis of the observed reduction in the AFC responses with shorter ISIs, the PH and baseline were determined across iterations contributing to the signal-averaged data for all rats (n = 14) (Fig. 5). These unaveraged data show large standard deviations, underscoring the importance of signal averaging for obtaining reproducible responses (Detre et al., 1998). However, the baseline flow appeared unaltered despite the reduction in the AFC response (Figs. 5A and 5B). In contrast, an initial decrement was detected in the PH after the first stimulus for most ISIs, regardless of the stimulus duration (Figs. 5C and 5D). For longer ISIs, the PH rapidly returned to the PH value seen with the first iteration. However, for shorter ISIs (8-second ISI for 4-second stimuli and 8-second ISI for 8-second stimuli), the PH remained reduced for several iterations before approaching the PH seen with the first iteration.
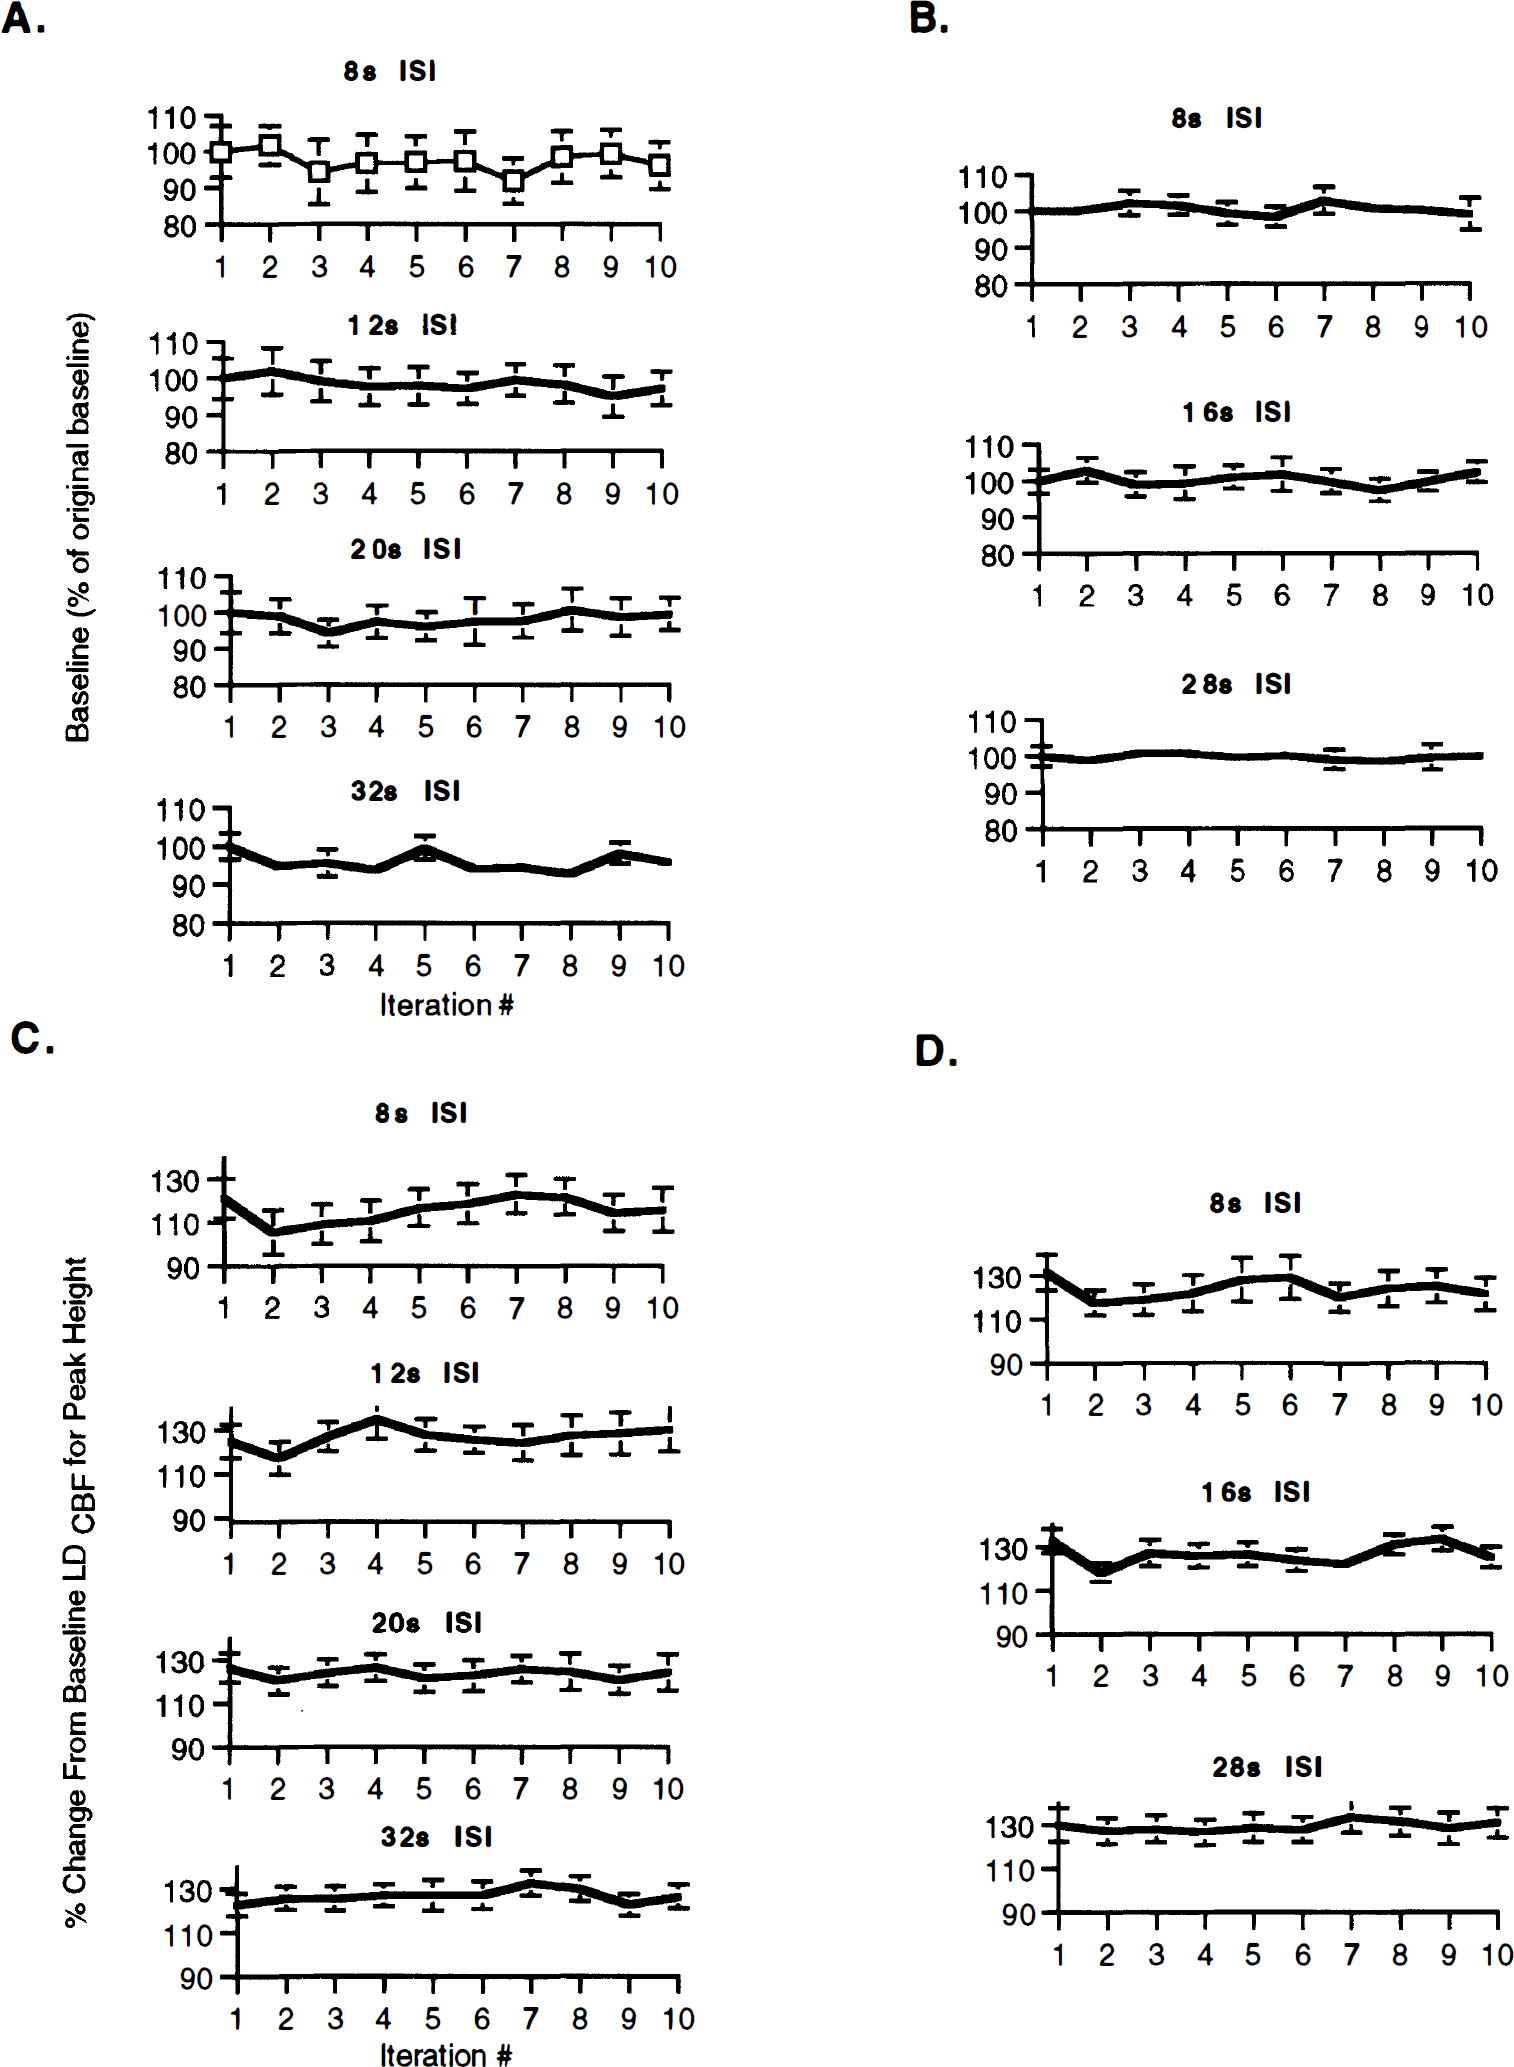
Changes in the baseline and peak height (PH) values across iterations for various interstimulus intervals (ISIs) for both 4- and 8-second stimuli: baseline
DISCUSSION
The major finding in this article is that various parameters of the signal-averaged flow responses to evenly spaced periodic stimuli are affected by the ISI. Both PH and area under the curve are significantly attenuated for shorter ISIs of 4 and 8 seconds. Further, even though the AFC responses and integrated responses of the AFC response for a 12-second ISI are similar to those obtained for longer ISIs (20- and 32-second ISI), the DR is significantly prolonged at this ISI (Fig. 3). These results are in agreement with those seen by Pollmann et al. (1998) and Cannestra et al. (1998), who have demonstrated by fMRI and optical imaging, respectively, that the amplitude of the flow response significantly decreased as the ISI was reduced.
To determine if the observed reduction in AFC responses and the integrated responses with shorter ISIs was due to refractoriness of the hemodynamic or the neuronal response, we measured SEPs, which are the electrical activities of the brain related to stimulation of a sensory pathway (Martin, 1991). The shape, peak latencies, and amplitude of the SEPs were similar to those seen by other investigators who have measured SEPs using forepaw stimulation (Leniger-Follert and Hossmann, 1979; Lindauer et al., 1996; Narayan et al., 1995; Narayan et al., 1994; Ueki et al., 1988) or other forms of sensory stimulation such as whisker stimulation (Di and Barth, 1991; Ngai et al., 1988; Ngai et al., 1995). In the present study, the SEPs for a particular stimulus duration did not change across various ISIs (Fig. 4; Table 2). Based on the absence of changes in the SEP amplitudes and latencies for a particular stimulus duration with variations in the ISI, we conclude that the decreases in the magnitude of the AFC response and the integrated response seen for shorter ISIs are most likely due to a “refractoriness” in the hemodynamic response rather than neuronal function. However, examination of the vascular response in isolation could not be accomplished using the current stimulation paradigm.
To determine if the observed effects of shortened ISIs on the hemodynamic response were due to an increase in baseline flow or a reduction in the peak responses across iterations, we also examined unaveraged data from single trials. Whereas the baseline flow did not change across iterations, there was an initial decrement in the PH after the first iteration for most ISIs. The magnitude of this dip was inversely proportional to the length of the ISI, with shorter ISIs having a larger decrement than longer ISIs that had smaller reductions in the PH. For long ISIs, the PH quickly returned to the initial value within one iteration. In contrast, for shorter ISIs, the PH remained depressed across a number of iterations before returning to a value similar to the PH seen for the initial iteration. Thus, this initial reduction in the magnitude of the AFC response may depend on recent activity (Cannestra et al., 1998), with the extent of the reduction in the AFC response for short ISIs depending on the total duration of the stimulation.
Our results suggest that the entire hemodynamic response to a brief stimulus is 13 to 15 seconds. These findings may have important implications for the design of single-trial or event-related neuroimaging experiments. In the case of an event-related design that has only a single trial type presented at a regular interval, the results from our animal model suggest that the greatest magnitude of the flow response occurs with an ISI of at least 13 to 15 seconds. If trials are spaced more closely together, the hemodynamic response from one trial will overlap with the response from the adjacent trial and may be influenced by previous activity. Our results are consistent with fMRI studies by Aguirre et al. (1998), which have shown that although a considerable degree of variability exists in the BOLD hemodynamic response within humans, the entire response occurs in ∼16 seconds.
In conclusion, we demonstrate a refractoriness of the hemodynamic response and not the neuronal response. These data also suggest that the entire time course of the hemodynamic response is ∼13 to 15 seconds in length. For activation studies using periodic stimuli, the ISI has a significant effect on the shape and the amplitude of the AFC response, which must be considered in the design and analysis of functional activation studies.
Footnotes
Abbreviations used
Acknowledgements
The authors thank Dr. Terry Patterson for helpful technical assistance.