
Abstract
The pial and penetrating arteries have a crucial role in regulating cerebral blood flow (CBF) to meet neural demand in the cortex. Here, we examined the longitudinal effects of chronic hypoxia on the arterial diameter responses to single whisker stimulation in the awake mouse cortex, where activity-induced responses of CBF were gradually attenuated. The vasodilation responses to whisker stimulation under prehypoxia normal conditions were 8.1% and 12% relative to their baselines in the pial arteries and penetrating arterioles, respectively. After 3 weeks of hypoxia, however, these responses were significantly reduced to 5.5% and 4.1%, respectively. The CBF response, measured using laser-Doppler flowmetry (LDF), induced by the same whisker stimulation was also attenuated (14% to 2.6%). A close linear correlation was found for the responses between the penetrating arteriolar diameter and LDF, and their temporal dynamics. After 3 weeks of chronic hypoxia, the initiation of vasodilation in the penetrating arterioles was significantly extended, but the pial artery responses remained unchanged. These results show that vasodilation of the penetrating arterioles followed the pial artery responses, which are not explainable in terms of proximal integration signaling. The findings therefore indicate an additional mechanism for triggering pial artery dilation in the neurovascular coupling.
Keywords
INTRODUCTION
The cerebral vasculature on the cortical surface forms artery-artery anastomoses, 1 maintaining a well-balanced blood supply to the column-like parenchymal neural modules. In contrast, the penetrating arteriole forms a ‘terminal arteriole’ that feeds a single vascular territory. 2 Classically, the pial artery has been observed to have a dominant role in regulating cerebral blood flow (CBF) to meet the parenchymal neural demand. 3 However, it has become clear that the parenchymal arterioles receive innervation from perivascular nerve fibers that extend from the pial to the parenchymal vasculature, 4 and that the pial and penetrating arterial tone can be regulated through extrinsic and intrinsic innervations, respectively. 5 , 6 The general consensus is therefore that both the pial artery and the penetrating arterioles regulate the CBF evoked through neural activation in a coordinated manner.
Because autoregulatory and hypercapnia perturbation provoke arterial dilation at a different site, depending on the size of the vessels, 7 the dual control theory for the regulation of CBF was proposed. 7 However, metabolic needs driven by parenchymal neural activity arise apart from the control site of CBF (i.e., upstream arteries). Considering this spatial mismatch between the sites of neural demand and the vascular control, Itoh and Suzuki 8 modified the dual control theory into the proximal integration model, 8 in which vasoactive signals are transmitted to the proximal arteries via (1) intravascular components, (2) perivascular cells, and (3) intrinsic/extrinsic neural pathways. In accordance with this model, a faster response to neural activation was reported for the penetrating arterioles than the upstream pial arteries. 9
In our previous study, we found that the activity-induced responses of the CBF, as measured with laser-Doppler flowmetry (LDF), were gradually attenuated with exposure to chronic hypoxia in the awake mouse cortex. 10 The finding indicates that chronic hypoxia causes adaptive changes in the neurovascular coupling mechanisms. Although LDF is a well-established tool that has advantages in monitoring dynamic changes of CBF continuously and noninvasively (for reviews 11 ), it lacks the spatial resolution to resolve the individual vessel responses. Thus, the underlying mechanism that causes hypoxia-induced adaptation of the CBF responses remains unclear.
The present study aimed to characterize the time-dependent changes in the activity-induced vasodilation in both pial artery and penetrating arterioles, which are the primary sites that regulate the parenchymal CBF, during exposure to chronic hypoxia. To this end, diameter changes in response to neural activation were directly measured using laser scanning fluorescence microscopy in the cortex of awake mice repeatedly during prehypoxia normal conditions to chronic hypoxia adaptations. To focus on the longitudinal changes of the single vessel behaviors, the most active artery feeding to the evoked cortex responding to a single whisker deflection was first identified with an intrinsic optical imaging technique. Then, vasodilation responses of the pial artery and penetrating arteriole were measured, as described previously. 12 To determine the longitudinal changes of the activity-induced responses up to 3 weeks of hypoxia exposure, the follow-up imaging experiments were weekly conducted with the identical protocols in the single animals. Additionally, CBF responses to the same whisker deflection were assessed with a small fiber LDF over the cortical regions where the vessel diameter response was measured to determine the temporal relationship between the attenuation of the parenchymal CBF responses and the vasodilation responses.
MATERIALS AND METHODS
Animal Preparation
The animal use and experimental protocols were approved through the Institutional Animal Care and Use Committee of the National Institute of Radiological Sciences (NIRS; Chiba, Japan), and all experiments were conducted in accordance with the ARRIVE following the institutional guidelines set for animal experiments by the NIRS. Six male adult STOCK Tg [Tie2-GFP] 287Sato/J mice (8 to 10 months, 20 to 30 g), expressing green fluorescent protein (GFP) in the vascular endothelium, 13 were anesthetized with isoflurane (3% to 5% for induction and 2% for surgery). A closed cranial window (3 to 4mm in diameter) was attached over the left somatosensory cortex, centered at 1.8mm caudal and 2.5mm lateral from the bregma, according to ‘Seylaz-Tomita method’. 14 This cranial window allowed for stable and reproducible longitudinal imaging of the cortical microvessels, 14 , 15 and also stable vasodilation responses to neural activation were previously reported for the awake mouse cortex implanted with this cranial window. 12 After the completion of the surgery, the animals were housed in a normal cage with free access to food and water.
Protocols
The experiments were initiated at least 1 week after surgery. First, intrinsic optical imaging was performed, to identify a region of the activated somatosensory barrel cortex that was induced by the mechanical deflection of a single whisker, before chronic hypoxia exposure was initiated (see Figure 1A). Second, a normoxia (prehypoxia) control experiment was conducted (day 0). The pial arterial and penetrating arteriolar responses to the identical single whisker stimulation were evaluated through confocal (Figure 1B) and two-photon laser scanning microscopy (Figure 1C), respectively. Third, the CBF response to the same whisker stimulation was measured with LDF. Although the LDF and vascular diameters were not concurrently measured in the present study, reproducible responses to whisker stimulation were previously validated in the experimental protocols (<3 hours) with awake mice. 16 Another concern is that the animals subjected to repeated experimental tasks may learn to the experiments. However, our preliminary results of the repeated longitudinal experiments with the identical protocols under normoxia conditions showed that there were no detectable effects on the vasodilation responses (Supplementary Figure S1). Thus, the potential confounding effects of the adaptation to the experimental conditions can be ruled out. During the imaging and LDF measurements, the animals breathed normal room air. We also ensured that there were no detectable differences in the stimulus-induced responses between the animals breathing 8% O2 or room air (i.e., 21% O2) in the animals adapted to chronic hypoxia (Supplementary Figure S2).
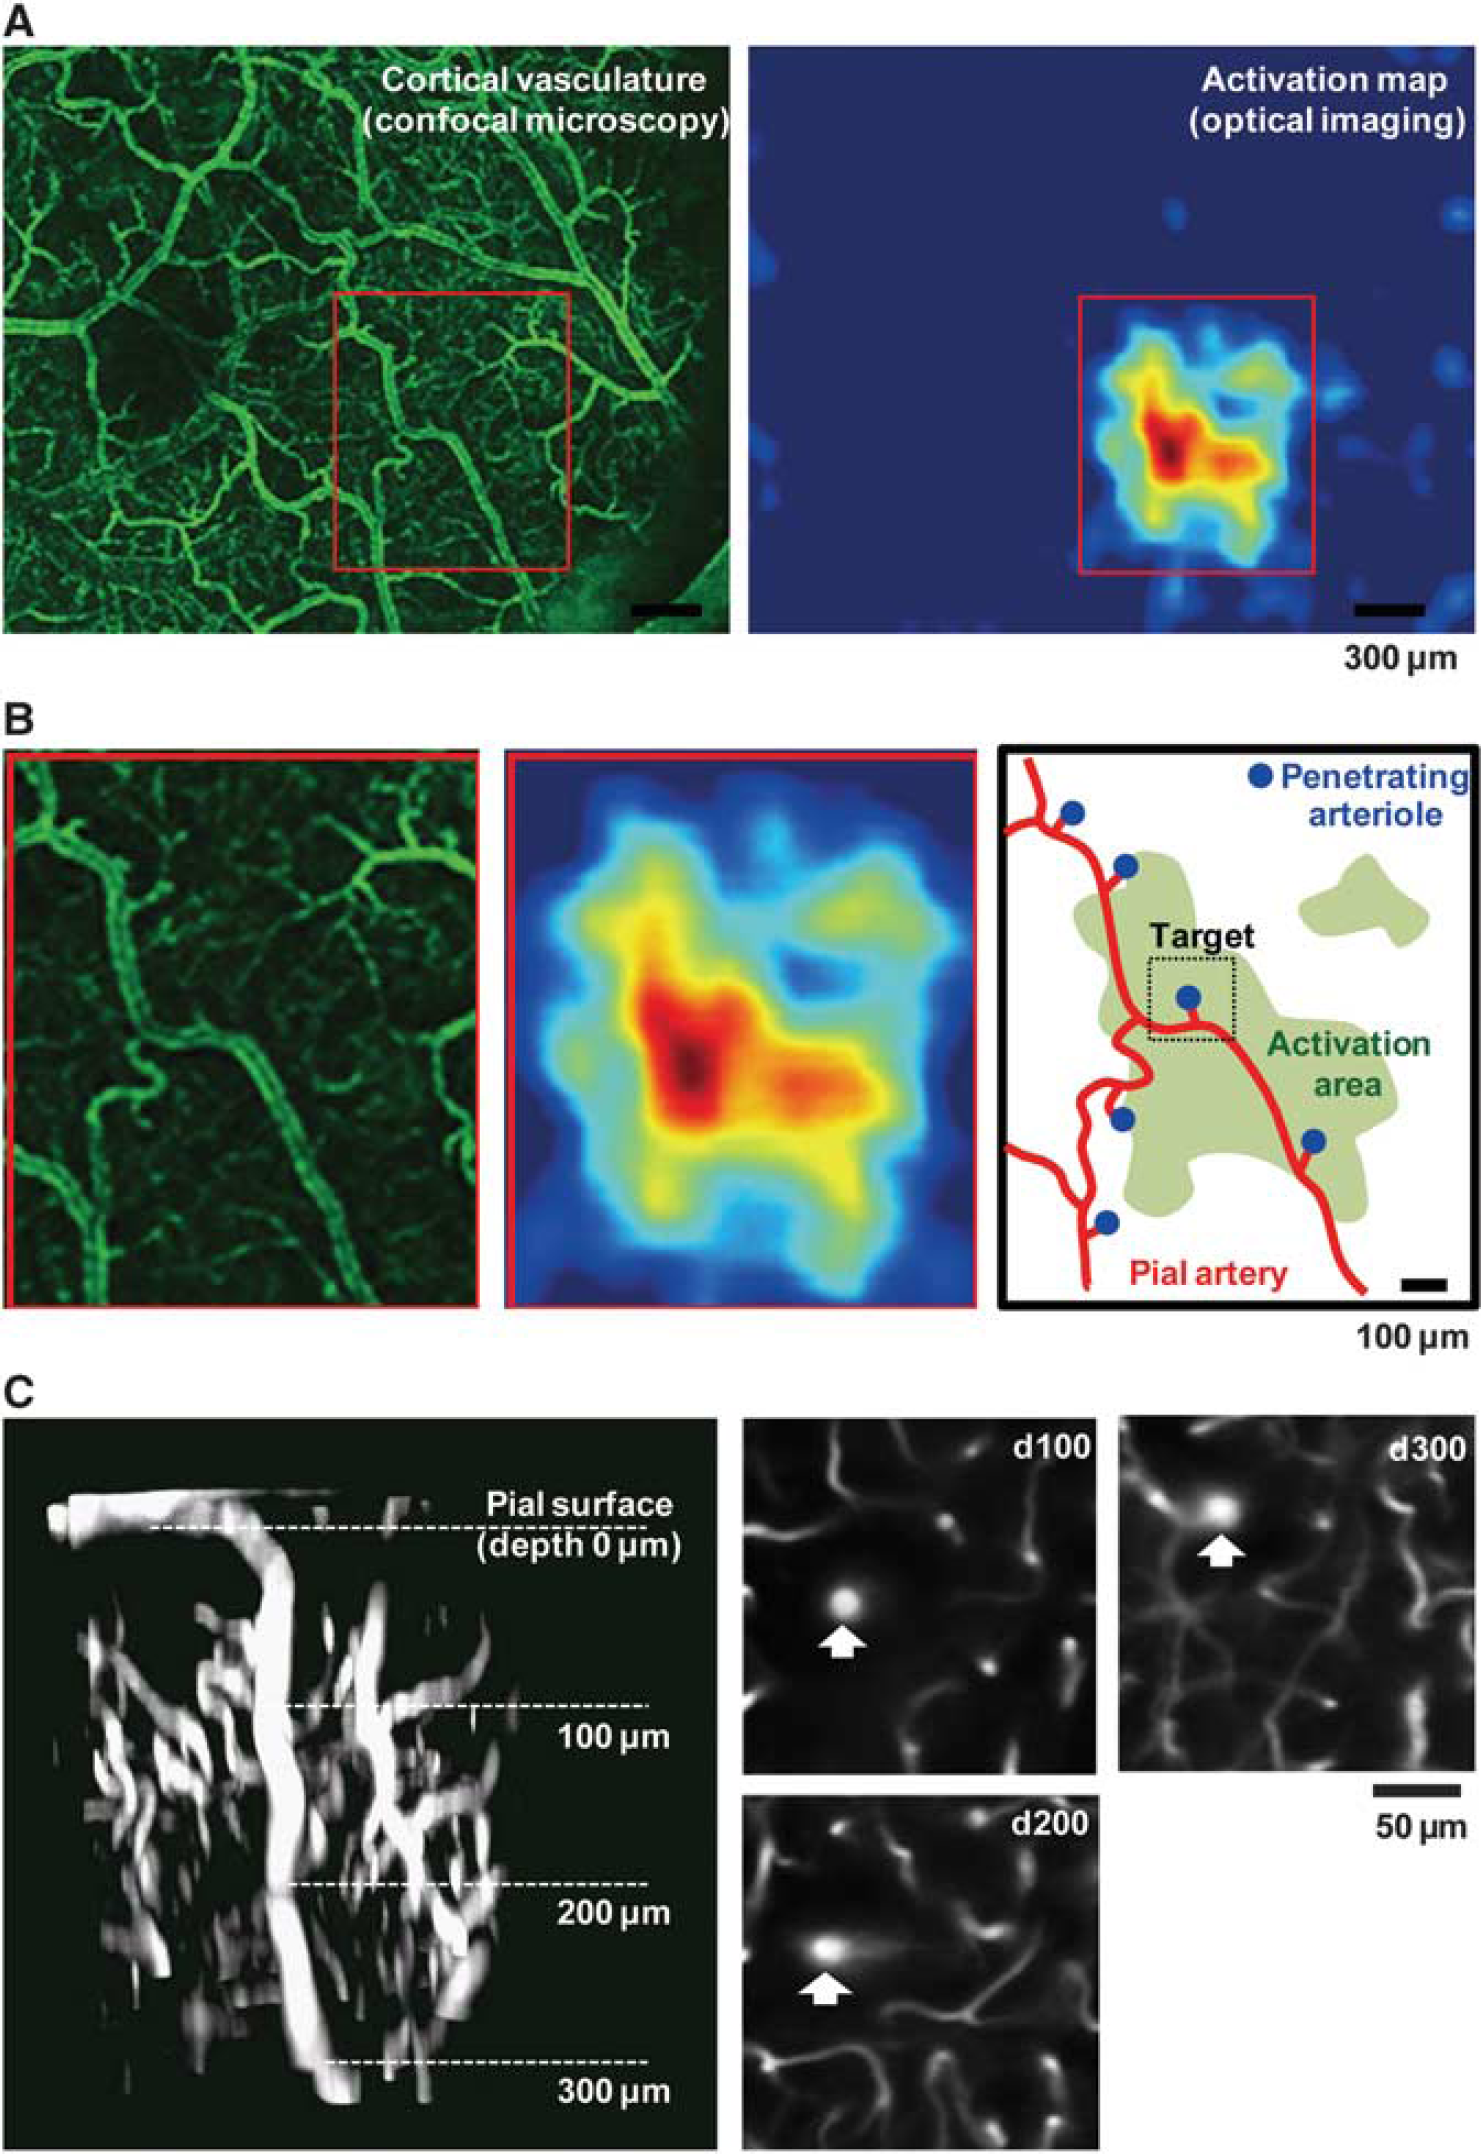
Vasculature imaging and activation map in the somatosensory barrel cortex of awake mice during prehypoxia.
After the LDF measurements were completed, the animals were placed into a hypoxic chamber, and the series of imaging and LDF experiments were conducted weekly. Immediately after the induction of hypoxia (<6 hours), the expression of hypoxia-inducible factor-1α increased 10- fold, but returned to the normal baseline levels during the 3 weeks of exposure to hypoxia. 17 This observation indicates that hypoxia-induced adaptation was completed within 3 weeks of exposure. Thus, the present study focused on this time period (3 weeks of hypoxia) where the hypoxia-induced adaptations would take place.
Chronic Hypoxia
The animals were housed in a custom-made hypoxic chamber (140mm ×200mm ×70 mm), in which the oxygen concentration was adjusted to 8% to 9% under atmospheric pressure through the continuous infusion (0.5 to 0.8 L/min) of a moistening mixture of oxygen and nitrogen, using a gas mixture device (Kofloc GB-2C, Kojima Instrument Inc., Kyoto, Japan), as described previously. 18 On the first day of the hypoxia exposure, the animals were placed into a chamber where the oxygen concentration was gradually lowered from 21% (that of room air) to the target concentration (∼3 hours). The oxygen concentration in the chamber was monitored with an oxygen sensor (OC-6B equipped with OPA-5000E, Komyo Rikagaku Kogyo K.K., Kawasaki, Japan). For the entire period of the hypoxia exposure, the animals were allowed free access to food and water while maintaining the hypoxia states except during the weekly cleaning of the chamber and during the imaging and LDF experiments.
Whisker Stimulation
To reproduce the same stimulation protocol on the different experiment days, the same single whisker was stimulated using a metal tube, constructed from a 23-G needle (0.65mm outer diameter, 0.40mm inner diameter, and 30mm length). At the beginning of each experiment, an entire length of the selected whisker was inserted into the tube. Then, mechanical deflection of the tube was achieved with a 1.2-mm deflection amplitude at a rate of 10 Hz for 5 seconds, using a solenoidal coil and a pulse generator (50ms rectangular pulse, Master 8, A.M.P.I, Jerusalem, Israel).
Optical Mapping
The head of the animal was fixed onto a custom-made fixation device, while the animals were allowed free movement on an air float ball, maintaining awake conditions.16 The cortex was illuminated with a 570/10nm excitation light, and a cortical image was acquired using a CCD camera (580 ×772 pixels) at a rate of 30 Hz. The whisker stimulation (10 Hz for 5 seconds) was repeated 20 times with an onset-to-onset interval of 30 seconds. The images were averaged off-line across all stimulus trials, and the stimulation-induced changes in the reflection intensity were calculated with respect to the prestimulus baseline (an average of 5 seconds prestimulation images). The activation areas were determined from the mean intensity changes over 5 seconds stimulation periods, and the activation map was superimposed to the image of the cortical surface vasculature captured using a CCD camera or confocal laser scanning microscopy, to identify the most activated pial artery and penetrating arteriole by the whisker stimulation (Figures 1A and 1B).
Vascular Diameter Measurements
The animal was placed on the stage of the microscope, where the head of the animal was fixed with free movement on the air float ball, as described previously. 12 , 16 First, the vascular geometry on the cortical surface and the changes in the diameter of the pial artery (see Supplementary Movie 1) were measured using confocal laser scanning microscopy (TCS-SP5 MP, Leica Microsystems GmbH, Wetzlar, Germany) through either a ×5 or a ×20 objective lens. The excitation laser was 488 nm, and the band-pass filter for the emission signal was 525/50nm (GFP). Then, the animal was injected (8 μL/g body weight, intraperitoneally) with sulforhodamine 101 (SR101; 10 mmol/L in saline, MP Biomedicals, Irvine, CA, USA) to fluorescently label the blood plasma. 15 The excitation laser was switched to a two-photon laser (900 nm, MaiTai HB, Spectra-Physics, Santa Clara, CA, USA) with a ×20 objective lens, and the band-pass filter for the emission signal was 610/75nm (SR101). The diameter of the penetrating arteriole was measured at three depths along with a target penetrating arteriole over 50 to 300 μm depths (see Supplementary Movie 2). Due to a limited time period for the retention of intravascular fluorescent dyes after injection (<2 hours after injection), 15 the pial artery and the penetrating arterioles were measured separately, based on GFP and SR101 signal contrasts, respectively. Namely, the diameter of the pial artery was measured as the outer diameter of the GFP-labeled endothelial cells, whereas the diameter of the penetrating arteriole was the inner diameter of the SR101-containing vessels. Because the thickness of the endothelial cell layer was comparable to the size of a single pixel (i.e., 0.5 μm per pixel), systematic biases due to different methodologies for measuring the outer and inner diameters were estimated to be B1 μm in our experimental conditions (Supplementary Figure S3).
The temporal dynamics of the diameter responses were measured at a rate of 0.15 second per frame (1,024 pixel × 512 pixel) for 20 seconds (5-second prestimulus, 5-second stimulus, and 10-second poststimulus). The in-plane pixel resolution was 0.45 and 0.50 μm for pial and parenchymal vasculature imaging, respectively. A total of 16 stimulation trials were repeated at each location with an onset-to-onset interval of 30 seconds. Depth scanning of the three-dimensional vascular networks at the measured location was also performed for future reference with a step size of 5 μm during resting states (without stimulation) (Figure 1C).
Laser-Doppler Flowmetry
The small fiber type of LDF probes (0.25mm diameter for both transmission and receiver fibers with a center distance of 0.25 mm; EGFine, Omega Wave Inc., Tokyo, Japan) were placed in the vicinity of the measured vessels on the cranial window, avoiding the visible large pial vessels. By using confocal laser scanning microscopy with two detectors (set for GFP and a 780-nm band pass), a reflection of the eliminated light (780 nm) from the LDF transmission fiber was simultaneously monitored with GFP-expressed vasculature on the illuminated cortical surface, to maintain the location of the LDF recording with respect to the measured arteries and optical imaging map over different experiment days (see Figure 4A). The CBF responses to whisker stimulation (10 Hz for 5 seconds) over 20 to 30 trials were evaluated with LDF (FLO-C1, Omega Wave Inc.), with a time constant of 0.1 second, and the data were continuously stored using a polygraph data acquisition system (MP150, BioPac Systems, Inc., Goleta, CA, USA) at a rate of 100 Hz.
Analysis
The timeseries vascular images were averaged over all the trials to improve the signal-to-noise ratio. For the pial arteries, 3 to 5 regions of interest were placed in the vicinity of the branch to the most activated penetrating arteriole in each subject. For the penetrating arterioles, one or two active arterioles were identified, and the crosssection diameters of the same vessel were measured at each of three depths (50 to 100 μm, 101 to 200 μm, and 201 to 300 μm from the cortical surface) in each subject (Figure 1C). The baseline diameter was calculated as the mean diameter over the 5-second prestimulus period, and the stimulus-evoked vasodilation diameter was calculated as the difference between that baseline diameter and the mean diameter during the period between 1 and 6 seconds after the onset of the stimulation. The increase in the diameter over baseline was calculated by dividing the vasodilation diameter by its baseline diameter in each experiment. The onset time of the vasodilation was the earliest time point that surpassed the mean of the baseline diameters plus 3 times the standard deviation. For this particular analysis, a moving average (consecutive 10 time points) for each time series of data was calculated to improve the signal-to-noise ratio. These image analyses were semiautomatically conducted using a custom-written MATLAB code. 12
For the LDF measurement, a mean time course was obtained by averaging the LDF signals among all trials and normalized with their baseline values (the mean for the 5-second prestimulus periods), except for the trials where the animal exercised extensively during stimulation. 16 The evoked response was a mean of the normalized LDF signal changes, averaged for the period from 1 to 6 seconds after the onset of the stimulation.
The data are represented as the mean±standard deviation (the number of animals tested), unless otherwise specified. The statistical significance (P<0.05) was examined with Dunnett's test for multiple comparisons versus a control (prehypoxia) state across the group of animals, or Student's paired t-test to compare baseline and activity-induced responses or pial and penetrating artery responses. After averaging all trial data in each animal, the mean error (standard deviation) of the baseline diameter was 0.1 to 0.3 μm, irrespective of the vessel type, and thus we set the standardized effect size as 1.8 (i.e., a single pixel resolution). Accordingly, six samples were estimated as a required sample size for vessel diameter comparisons.
RESULTS
The mean baseline diameter under prehypoxia control conditions was 34±8 μm and 17±5 μm for the pial arteries and penetrating arterioles, respectively, and the diameters 39±6 μm and 20±3 μm, respectively, after 3 weeks of hypoxia (Figure 2A; Supplementary Figure S4). Statistically significant differences were not detected in the baseline diameters (P>0.05, Dunnett's test) over the period from prehypoxia to 3 weeks of hypoxia (1.11±0.09, 1.18±0.06, and 1.19±0.07-fold for the pial arteries; and 1.11±0.09, 1.15±0.13, and 1.20±0.07-fold for the penetrating arterioles; at 1, 2, and 3 weeks of hypoxia, relative to prehypoxia, respectively) (Figure 2B). In addition, no detectable dependences on the measured depths over depths of 50 to 300 μm from the cortical surface were observed for the baseline diameter changes of the penetrating arterioles (Supplementary Figure S5).
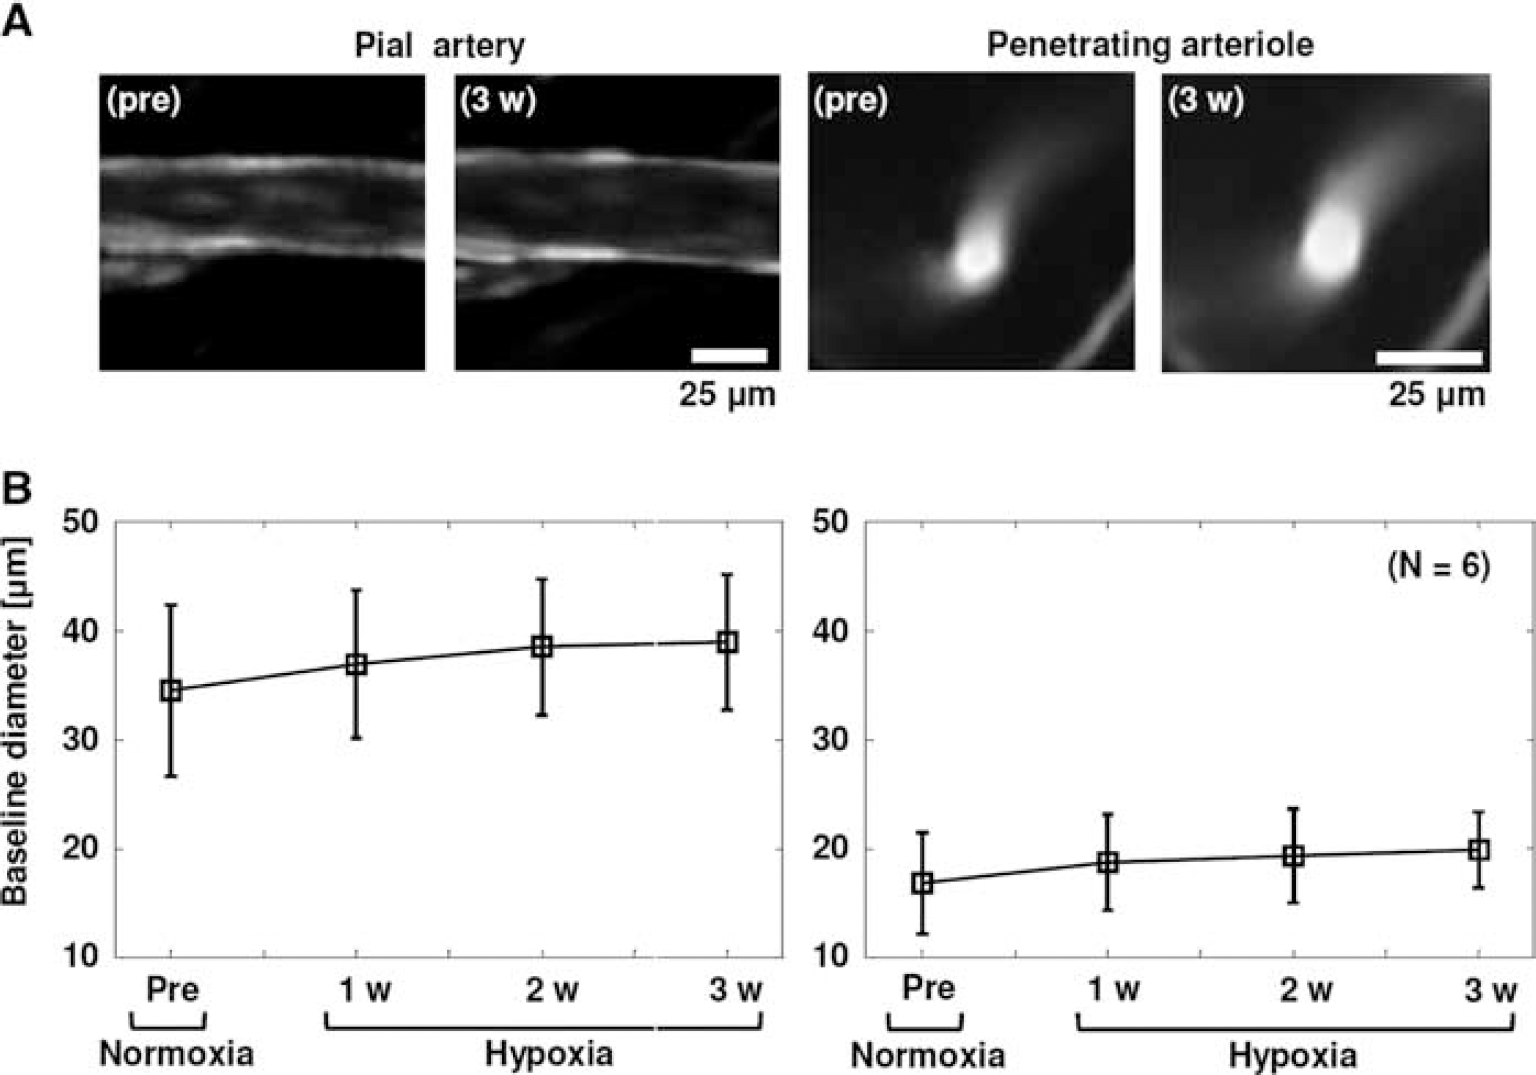
Prestimulus baseline diameters of the pial arteries and penetrating arterioles during hypoxia adaptation.
Under prehypoxia control conditions, whisker stimulation evoked significant vasodilation of both the pial arteries and the penetrating arterioles (2.7±0.4 μm and 2.1±0.8 μm, respectively; Figure 3A), which are in good agreement with our previous results. 12 With increasing hypoxia exposure, the activity-induced vasodilation gradually declined in both the pial arteries (2.6±0.8 μm, 2.6±0.9 μm, and 1.9±0.4 μm after 1, 2, and 3 weeks of hypoxia, respectively; Figure 3B) and the penetrating arterioles (1.5±0.5 μm, 0.9±0.4 μm, and 0.8±0.5 μm after 1, 2, and 3 weeks of hypoxia, respectively; Figure 3B). Interestingly, the penetrating arterioles showed drastic changes in the evoked vasodilation over baseline (12±3%, 8.2±2.9%, 4.8±2.3%, and 4.1±2.4% at prehypoxia and after 1, 2, and 3 weeks of hypoxia, respectively), compared with the hypoxia-dependent attenuation of the pial artery dilation over baseline (8.1±1.3%, 7.2±1.6%, 6.6±1.6%, and 5.0±1.7% at prehypoxia and after 1, 2, and 3 weeks of hypoxia, respectively). The results were also consistent across the measured depths of 50 to 300 μm from the cortical surface (Supplementary Figure S5). Consequently, statistical significance (versus prehypoxia, Dunnett's test) was detected only after 3 weeks of hypoxia for the pial artery responses (P=0.007; Figure 3C), but all responses after 1, 2, and 3 weeks of hypoxia for the penetrating arterioles (P=0.043, 0.0004, and 0.0001, respectively; Figure 3C). Note that no detectable vasodilation of the parenchymal capillaries at depths of 50 to 300 μm from the cortical surface was consistently observed during the 5-second whisker stimulation (P>0.05, versus baseline, paired t-test) in our experimental conditions (Supplementary Figure S6).
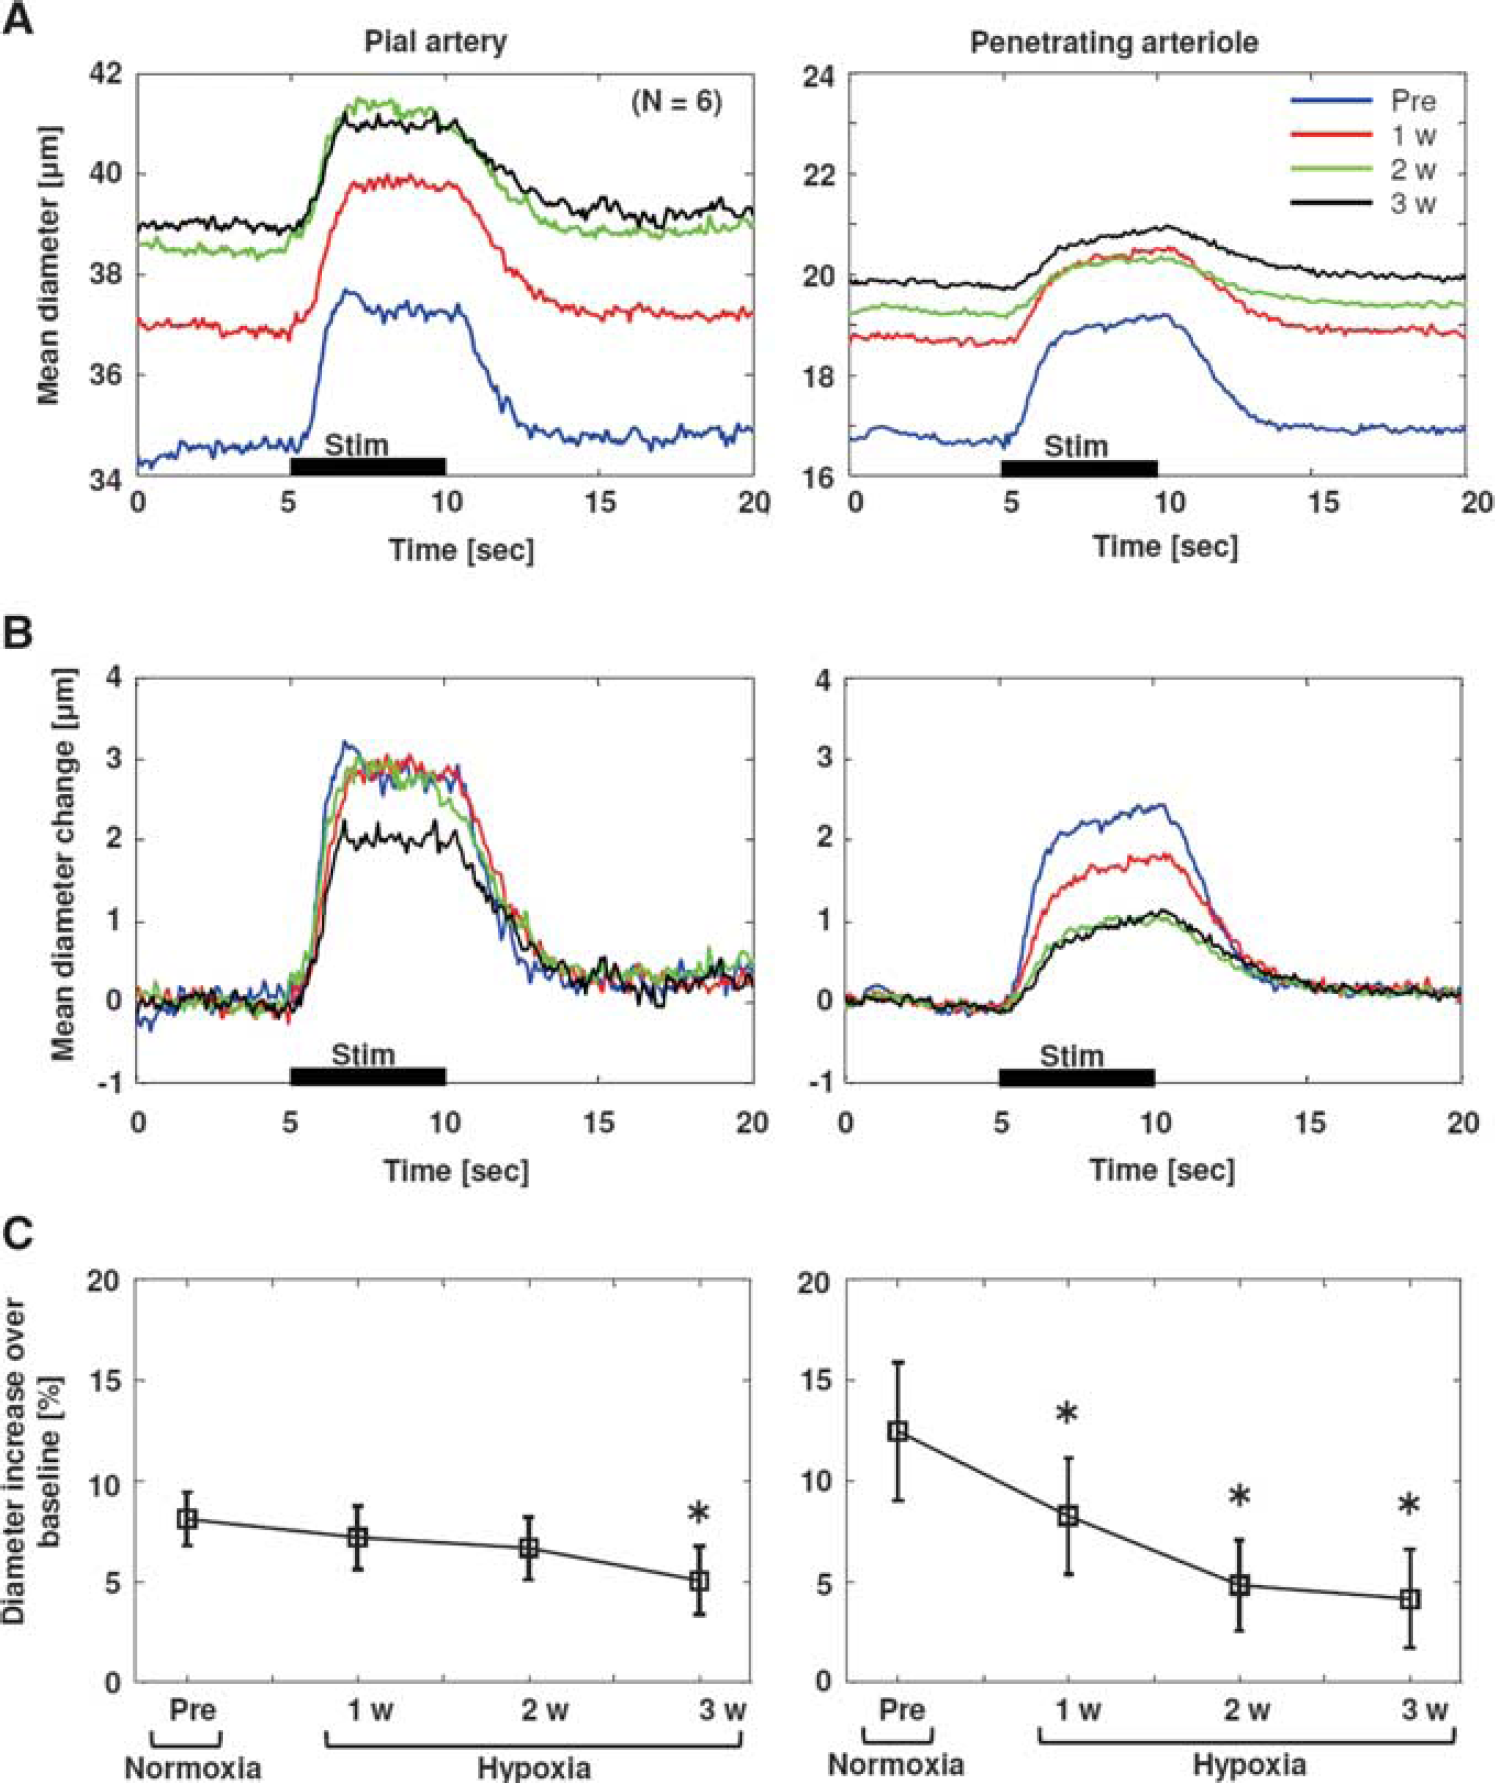
Stimulation-induced dynamic changes in pial artery and penetrating arteriole diameters.
The LDF response to whisker stimulation was also attenuated as the duration of hypoxia exposure increased (14±5%, 6.8±3.6%, 4.9±1.2%, and 2.6±2.0% at prehypoxia and 1, 2, and 3 weeks of hypoxia, respectively; Figure 4B). There were statistically significant differences (versus prehypoxia, Dunnett's test) in the all responses after 1, 2, and 3 weeks of hypoxia (P=0.0029, 0.0003, and 0.0001, respectively; Figure 4C). These results are consistent with our previous report that showed the hypoxia-dependent attenuation of the LDF responses to air-puff whisker stimulation measured in awake mouse cortex. 10
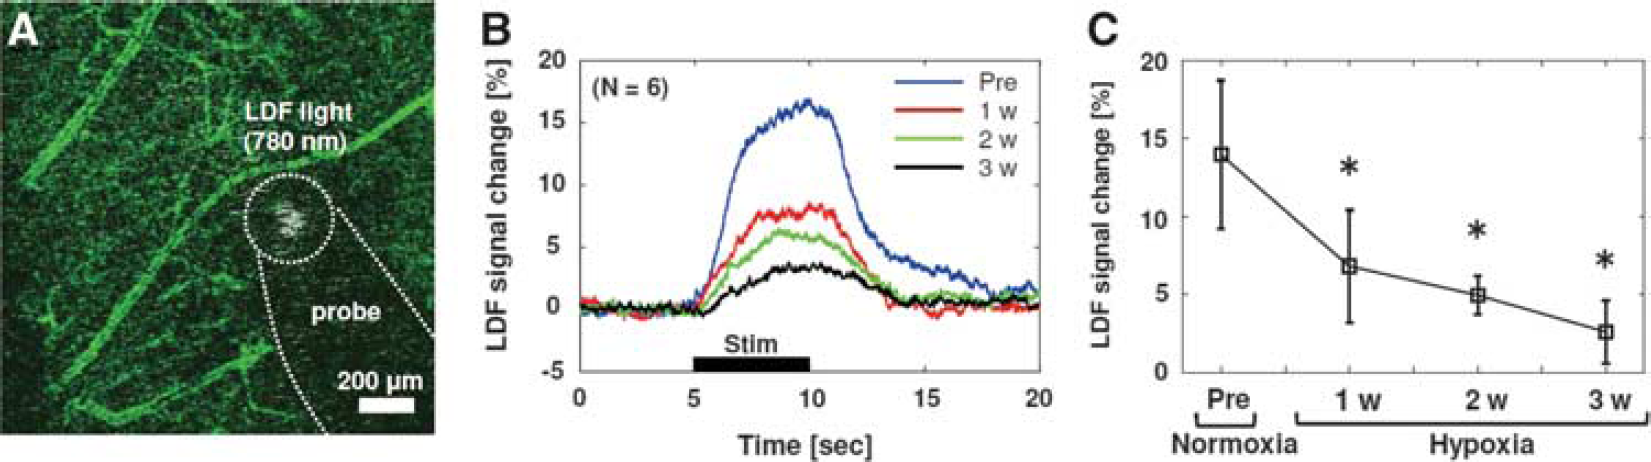
Stimulation-induced responses of cerebral blood flow (CBF) measured with laser-Doppler flowmetry (LDF).
Contrary to our expectations, no significant correlation was observed for the diameter changes between the pial arteries and penetrating arterioles over the all responses measured from pre-to 3 weeks of hypoxia (R=0.39, P=0.058; Figure 5A). However, a comparison between the LDF and vasodilation responses showed a higher correlation for the responses of the LDF and the penetrating arterioles (R=0.90, P=3.4×10⁻⁹) than for those of the LDF and pial arteries (R=0.50, P=0.012; Figure 5A). Furthermore, a synchronous change was observed in the temporal dynamics of the LDF and the diameter responses of the penetrating arterioles, which differed from the temporal relationships between the LDF and pial artery responses and between the pial and penetrating artery responses (Figures 5B and 5C). After adapting to chronic hypoxia, the pial arteries exhibited a faster response compared with both the LDF and penetrating arterioles (Figure 5C).
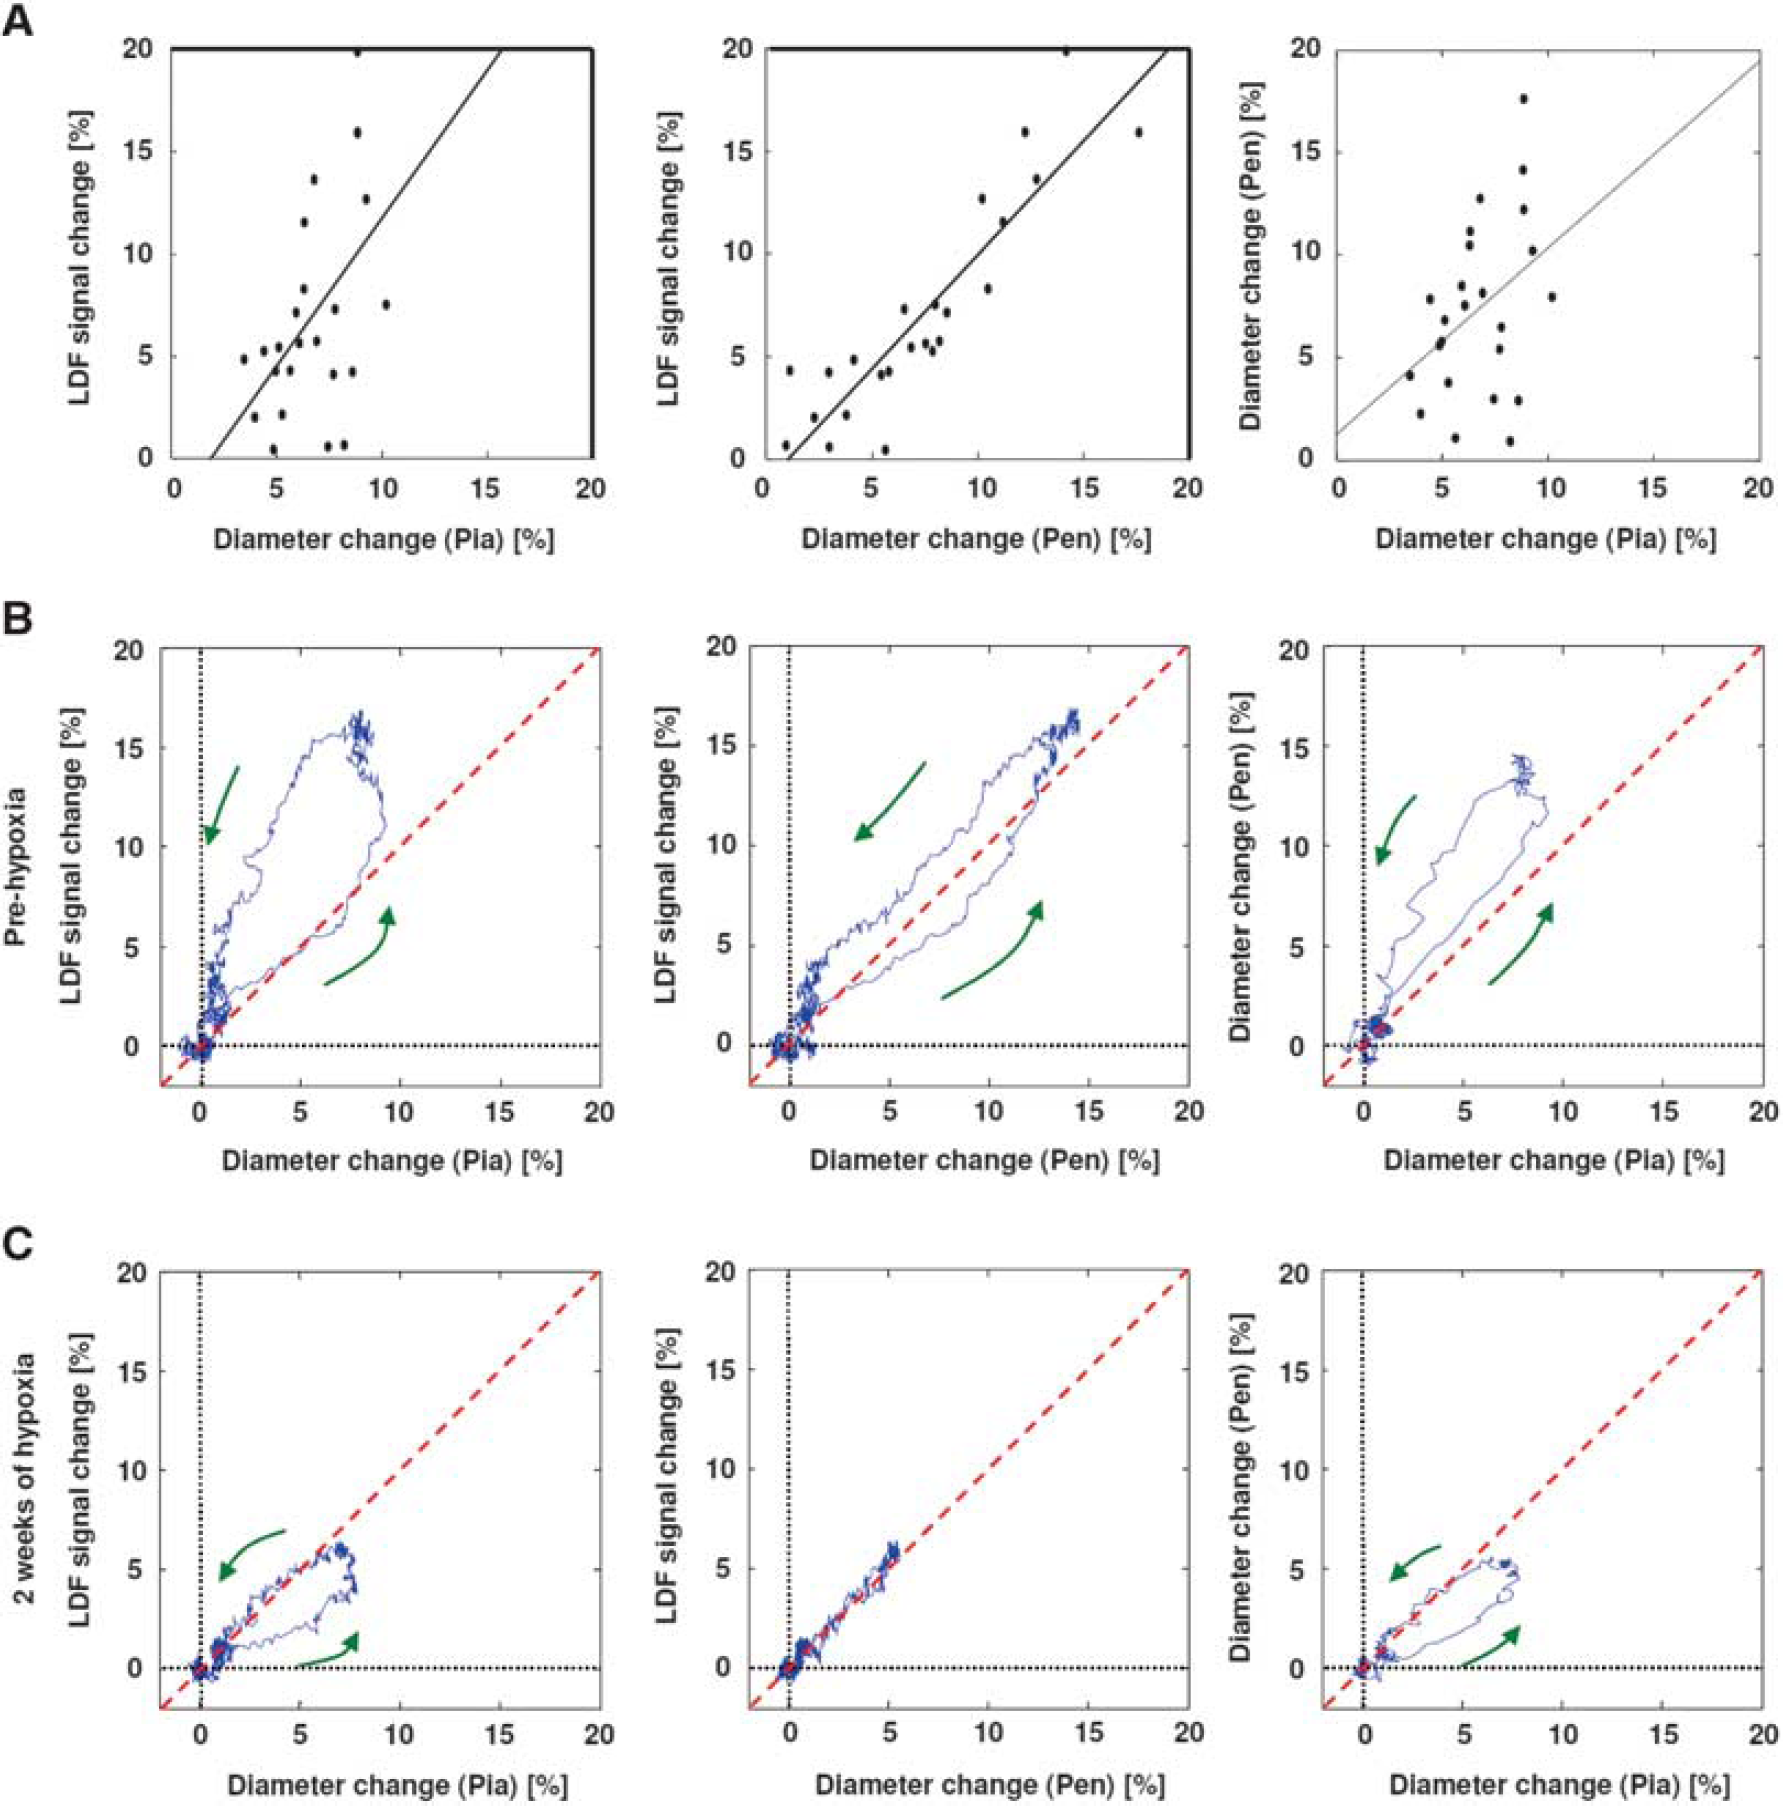
Comparison of pial artery, penetrating arteriole, and laser-Doppler flowmetry (LDF) responses.
This dissociation of the temporal dynamics results from a shift of the time course of the penetrating arteriolar diameter responses (Figures 6A and 6B). The onset time for the penetrating arterioles monotonically increased as the duration of hypoxia exposure increased (1.1±0.4 seconds, 1.2±0.3 seconds, 1.5±0.4 seconds, and 1.8±0.4 seconds for pre-, 1, 2, and 3 weeks of hypoxia, respectively), whereas the temporal dynamics of the pial artery response remained unchanged (1.0±0.5 seconds, 1.1±0.5 seconds, 0.8±0.4 seconds, and 1.1±0.4 seconds for the onset time, respectively). The statistically significant differences between the pial artery and penetrating arteriole responses (paired Student's t-test) were observed for the onset times after 2 and 3 weeks of hypoxia (P=0.048 and 0.017, respectively; Figure 6C). Within each vessel group, the statistical significance (versus pre-hypoxia, Dunnett's test) was detected after 3 weeks of hypoxia for the penetrating arterioles (P=0.014; Figure 6C) but not for all of the pial artery responses (P>0.05; Figure 6C). Additionally, the onset time grouped for respective depths (50 to 100 μm, d100; 101 to 200 μm, d200; and 201 to 300 μm, d300) was also compared, revealing no detectable differences across the depths of 50 to 300 μm from the cortical surface (Figure 6D).
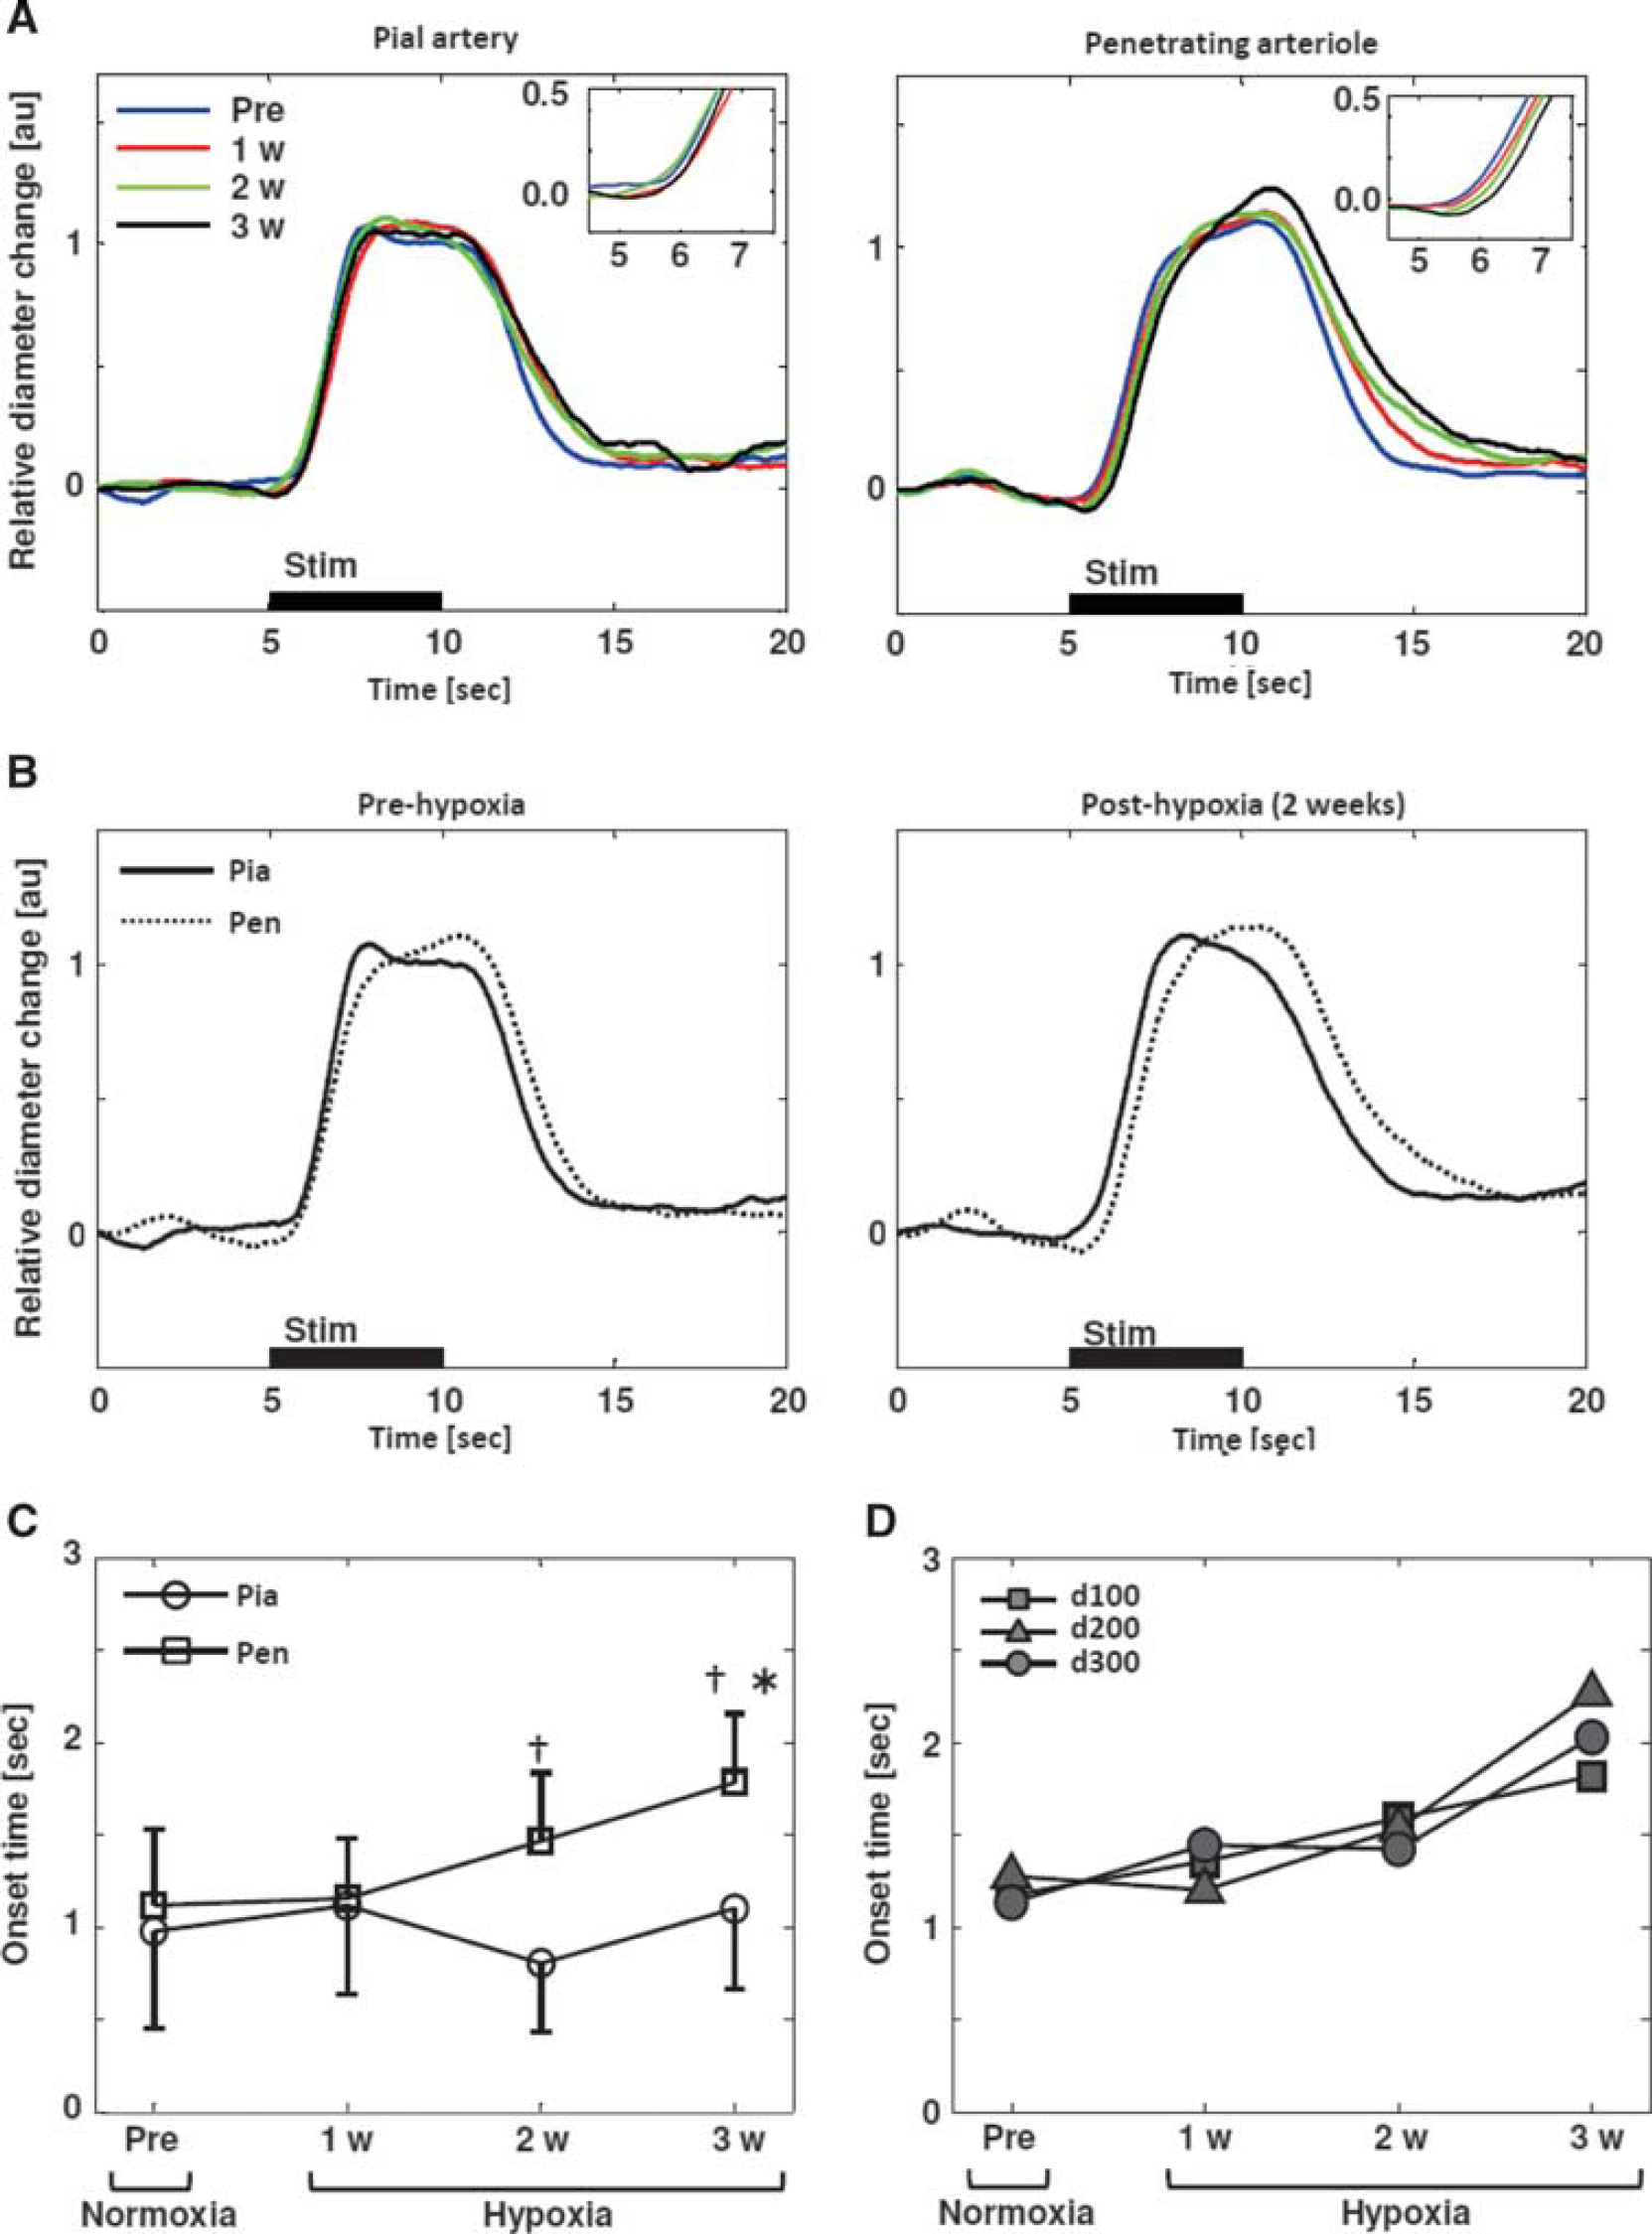
Temporal dynamics in changes of diameters between the pial artery and the penetrating arteriole.
DISCUSSION
Arterial Diameter Changes and their Correlations to Laser-Doppler Flowmetry Signals
It has been shown that the relative changes in the LDF signals are well correlated with the parenchymal CBF evaluated with several gold standard techniques, such as the hydrogen clearance, 19 [14C]iodoantipyrine, 20 and arterial spin labeling magnetic resonance imaging 21 techniques. These studies indicate that LDF reliably reflects changes in the parenchymal CBF. A significant correspondence was also observed for LDF and the pial arterial responses to systemic perturbation 22 and somatosensory stimulation. 23 However, changes in the LDF signals did not always correspond to changes in the pial arterial diameters, such as for the topical application of vasoactive agents 24 and sympathetic nerve stimulation. 25 The latter indicates additional mechanisms in controlling CBF at the downstream parenchymal vasculature (i.e., post-arteriole vessels 26 ), depending on an induction of perturbation. In the present study, we showed a better correlation in the response magnitude and temporal dynamics between the penetrating arteriolar diameter and the LDF responses to neural activation, rather than the pial artery and LDF (Figure 5). This finding indicates that the penetrating arterioles have a dominant role in coordinating parenchymal CBF induced through neural activation, and therefore that the hypoxia-dependent attenuation of the CBF response to neural activation is explained by the selective attenuation of the penetrating arteriole dilation.
The dissociated responses of pial and penetrating arteries were previously indicated in the rabbit cortex through the injection of strychnine (glycine antagonist). 27 However, the role of the penetrating arteriole in the regulation of parenchymal CBF was underestimated due to a limited available perivascular space for its dilation. 3 In contrast to this view, a direct comparison of the penetrating arterioles with upstream pial arteries revealed that their diameter changes in response to neural activation are not always correlated with each other, such as in adaptation to chronic hypoxia (Figure 5) or in the event of cortical spreading depression. 28 These studies indicate that the pial and penetrating arteries similarly respond when systemic perturbation was provoked, which produce a good correspondence of the LDF to pial arterial diameter changes. 22 , 23 , 29 Conversely, locally evoked perturbation might produce dissociated responses in those arteries, leading to a dissociation of the LDF and changes in the diameter of the pial arteries. 24 , 30
Potential Mechanisms for Pial and Penetrating Artery Responses to Neural Activation
An activity-dependent reduction in the downstream vascular resistance may increase the flow velocity at the upstream arteries, leading to a shear stress-dependent dilation of the pial arteries, i.e., a flow-mediated vasodilation mechanism. 31 In the present study, however, after adaptation to hypoxia, a consistent vasodilation of the pial arteries was observed, irrespective of the downstream changes (Figures 3A and 6A). This finding indicates a minimal contribution from the flow-mediated vasodilation pathway to evoke pial artery dilation. In the isolated cerebral penetrating arteries, a rapid conduction of vasomotion was observed at the remote site (∼1 mm) relative to the stimulated site after local application of potassium ions, indicating the intravascular signaling. 32 In the present study, the response of the pial artery did not always follow that of the penetrating arterioles (Figure 5). This observation further indicates a minor contribution of intravascular signaling in pial artery dilation. Astrocytic gap junctions convey a vasoactive signal to upstream pial arteries in both evoked seizure and sciatic nerve stimulation. 33 Whether the speed of this signal transduction mechanism to the upstream arteries is consistent with temporal dynamics of the pial artery responses observed in the present study remains unclear. This dynamic property should be tested in future studies.
Neurogenic regulation (e.g., extrinsic or intrinsic innervation) might dictate the parallel responses of the pial artery and penetrating arteriole to evoke vasodilation. 5 However, neither extrinsic innervation pathways nor diffuse signaling to the pial surface, induced through neural activation, significantly contribute to the pial artery vasodilation. 34 , 35 Considering these findings, we speculate that the localized pial artery responses observed at the activated hot spot (see Figure 1) represent an intrinsic property of the active parenchymal tissue. 1 Although it has been suggested that the intrinsic innervation involved in the local neural circuits is not linked to the pial arteries, 5 this view could be reconsidered. In conclusion, this study revealed dissociated dynamic responses of the pial and penetrating arterial diameters that are not explainable in terms of the current proximal integration model. 8 Thus, further studies are needed to specifically activate/inhibit the pial or penetrating artery responses such as using pharmacological and/or optogenetic manipulations.
Hypoxia Adaptations
After 3 weeks of chronic hypoxia, we observed a 1.2±0.1-fold increase in the capillary diameters (Supplementary Figure S6), whereas no significant changes (P>0.05, versus 0 week, Dunnett's test) were ensured for the baseline diameters of capillary under 3- week normoxia control conditions; 4.2±0.9 μm, 4.3±0.8 μm, 4.4±0.7 μm, and 4.4±0.8 μm at 0, 1, 2, and 3 weeks, respectively (n=29 vessels, N=2 animals). The hypoxia-dependent increases in the baseline capillary diameters are in good agreement with previously published electromicroscopy data that showed moderate hypoxia causes a significant dilation of the parenchymal capillaries while maintaining a thickness of the endothelial cell wall and basement membrane. 36 In addition, chronic hypoxia causes an increased hematocrit level in the systemic blood circulation of the animals (34.6%, 50.0%, 55.7%, and 68.3% at pre-, 1, 2, and 4 weeks of 8% to 9% O2 hypoxia 10 ) and a reduction in the blood velocities in cerebral circulation. The average blood velocity in the pial vasculature, measured with a dilution method using intravenous injection of fluorescent dye, 37 was 4.2±1.0 mm/s and 1.8±0.6 mm/s at pial arteries (20 to 30 μm in diameter) and veins (25 to 35 μm in diameter) under prehypoxia normal condition, respectively (n=3 animals). After 2 weeks of 8% to 9% O2 hypoxia, these velocities decreased to 3.0±0.4 mm/s and 1.2±0.3 mm/s, respectively. In accordance with these reduction in the blood velocities, the transit time from pial artery to vein (inversely reflects parenchymal blood flow) was 1.3-fold extended (0.6±0.3 second to 0.9±0.5 second for prehypoxia to 2 weeks of hypoxia; n=3 animals). These adaptive changes in the cortical microcirculation and blood composition may also contribute to the selective attenuation of the penetrating arteriole dilation provoked during hypoxia adaptation.
Potential Mechanisms in Attenuating the Dilatory Responses of the Penetrating Arteriole
It has been previously shown that neither population neural activity nor the vascular response to hypercapnic inhalation is attenuated during the hypoxia adaptation. 10 The preserved vasodilation responses to hypercapnia were also observed in the current study (n=2; Supplementary Figure S7). Considering these observations, we speculate that chronic hypoxia directly acts on the pathways of neurovascular signaling. A potential source for the attenuation of the activity-induced vasodilation is an attenuated release of the inducible vasoactive mediators (such as nitric oxide (NO), adenosine, and prostaglandins). A reduction in the periarterial oxygen tension increases the NO concentration in the vascular wall, leading to dilation of the cortical arteries. 38 The NO increase and vasodilation were suppressed through a selective inhibitor of neuronal NO synthase. 38 Thus, increased constitutive NO production under hypoxia might reduce the stimulation-evoked release of neuronal NO. Adenosine is also involved in the mechanisms of transient CBF increase in response to a short episode of hypoxia and neurovascular coupling. 39 , 40 In this case, the extracellular adenosine level should decrease with hypoxia adaptation, as activity-induced vasodilation was attenuated over prolonged periods of hypoxia. Brain glucose metabolism and the transfer of glucose to brain cells were also facilitated under chronic hypoxia, leading to elevated lactate concentrations. 41 Because lactate inhibits prostaglandin transport in astrocytes, 39 the increased concentration of extracellular lactate might potentiate the vasodilation response to neural activation via prostaglandin pathways. 42 However, this scenario contrasts with the results obtained in the present study. The underlying mechanisms that attenuate the dilatory responses of the penetrating arterioles after hypoxia adaptation are currently under investigation.
CONCLUSIONS
Chronic exposure to hypoxia attenuates the vasodilation responses of cortical arteries induced through neural activation, leading to an hypoxia-dependent attenuation of evoked CBF. With an increase in hypoxia exposure, vasodilation responses of the penetrating arterioles delayed behind the pial artery dilation, which may indicate that an additional mechanism to proximal integration signaling triggers the vasodilation of pial artery induced by neural activation.
Footnotes
References
Supplementary Material
Please find the following supplemental material available below.
For Open Access articles published under a Creative Commons License, all supplemental material carries the same license as the article it is associated with.
For non-Open Access articles published, all supplemental material carries a non-exclusive license, and permission requests for re-use of supplemental material or any part of supplemental material shall be sent directly to the copyright owner as specified in the copyright notice associated with the article.