
Abstract
We describe the tracer kinetic analysis of [C-11]-labeled alpha-methyl-tryptophan (AMT), an analogue of tryptophan, which has been developed as a tracer for serotonin synthesis using positron emission tomography (PET) in human brain. Dynamic PET data were acquired from young healthy volunteers (n = 10) as a series of 22 scans covering a total of 60 minutes and analyzed by means of a three-compartment, four-parameter model. In addition, functional images of the K-complex were created using the Patlak-plot approach. The application of a three-compartment model resulted in low identifiability of individual k-values, especially that of k3. Model identifiability analysis using a singular value decomposition of the final sensitivity matrix showed parameter identifiability to increase by 50% when the Patlak-plot approach was used. K-complex values derived by the Patlak-plot approach overestimated the compartmental values by 10 to 20%, because of the violation of the dynamic equilibrium assumption. However, this bias was fairly constant in all structures of the brain. The rank order of K-complex values from different brain regions corresponded well to the regional concentrations of serotonin in human brain (P < 0.0001). These results indicate that the Patlak-plot method can be readily applied to [C-11]AMT data in order to create functional images of the K-complex, reflecting serotonin synthesis rate, within an acceptable error margin.
Keywords
In vivo imaging using probes aimed at investigating serotonergic function has been an area of great interest, especially because there is evidence that abnormalities of serotonergic neurotransmission are associated with a number of neurological and psychiatric disorders including autism, migraine, sleep disorders, depression, movement disorders, and epilepsy (for review see Roth, 1994). Early attempts to study serotonergic function using radioactive-labeled tryptophan suffered from methodological problems involving the necessity of chemical separation of metabolites in the blood pool and removal of the part of the tracer incorporated into proteins (Lin et al., 1966; Costa and Neff, 1970; Neff et al., 1971; Lane et al., 1977; Tracqui et al., 1983). Another problem with the use of labeled tryptophan as a tracer is the very fast removal of 5HIAA from the brain, which is the terminal metabolite of the neurotransmitter serotonin.
To overcome these problems, an analogue of tryptophan, [C-11]alpha-methyl-L-tryptophan ([C-11]AMT) has been developed as a tracer for serotonin synthesis with positron emission tomography (PET) by Diksic et al. (1990). This analogue has been shown to possess better metabolic characteristics than the natural substrate for tracer modeling. After the administration of labeled or unlabeled AMT in rats, the synthesis of alpha-methyl-serotonin (AMS) in brain has been shown by high-pressure liquid chromatography (Missala and Sourkes, 1988; Diksic et al., 1990). [H-3]AMS synthesized in brain was localized in serotonergic neurons by combined autoradiography and tryptophan hydroxylase immunocytochemistry at the electron microscopic level (Cohen et al., 1995) proving the specificity of the tracer for serotonergic nerve terminals. Furthermore, [H-3]AMS present in nerve terminals could be released by K+-induced depolarization, suggesting that this tracer is stored with the releasable pool of serotonin (Cohen et al., 1995). Because AMS, unlike serotonin, is not a substrate for the degradative enzyme monoamine oxidase (Missala and Sourkes, 1988), AMS accumulates in serotonergic nerve terminals in proportion to the synthesis rate of serotonin. In addition, AMT, unlike tryptophan, is not incorporated into proteins, nor are metabolites released into the blood pool (Madras and Sourkes, 1965; Diksic et al., 1990). These properties of AMT make it an excellent tracer substance for the measurement of serotonin synthesis rate in vivo.
The purpose of the present study was to evaluate the feasibility of [C-11]AMT for the measurement of regional serotonin synthesis rate in human brain using dynamic PET scanning and tracer kinetic modeling. The kinetic analysis using a three-compartment model configuration as well as the Patlak-plot approach is presented here. The implementation of the Patlak-plot approach yields a more stable estimate of the synthesis rate parameter and allows creation of parametric functional images. The overall identifiability of the synthesis rate parameter for both models is reported for initial clinical applications in control subjects.
THEORY
It was shown in animal studies (Diksic et al., 1990, 1991; Nagahiro et al., 1990) that the tracer [C-11]AMT can be described by a three-compartment model using first-order rate constants (schematically represented in Fig. 1). The inflow rate constant K1 and the outflow rate constant k2 both describe the exchange of [C-11]AMT between vascular space and the cell cytoplasm (transport across the blood-brain barrier, the interstitial space and the cell membrane). Once present in the cell cytoplasm, [C-11]AMT is converted to [C-11]AMS (Cm) by means of an irreversible, two-step enzymatic process characterized by the rate constant k3. It is generally accepted that the rate-limiting step of this process is the hydroxylation of [C-11]AMT to [C-11]alpha-methyl-5-hydroxytryptophan that is mediated by an enzyme only found in serotonergic neurons.
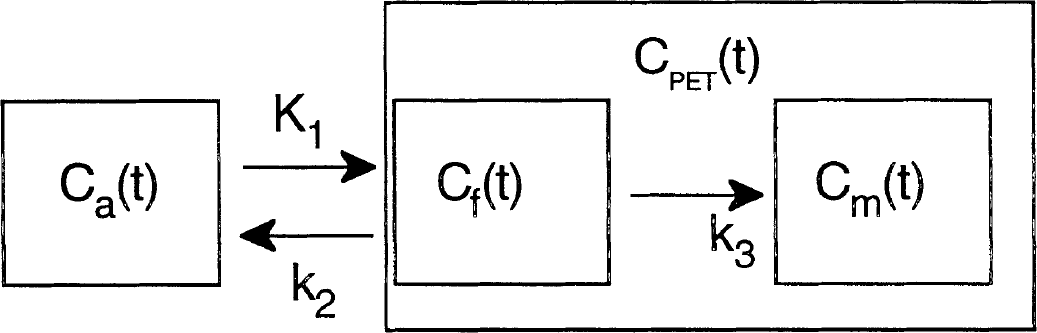
Tracer kinetic model for [C-11]alpha-methyl-tryptophan ([C-11]AMT). The inflow rate constant K1 and the outflow rate constant k2 both describe the exchange of [C-11]AMT between vascular space (Ca) and the cell cytoplasm (Cf). Once present in the cytoplasm, [C-11]AMT is converted to [C-11]alpha-methyl-serotonin (Cm) by means of an irreversible, two-step enzymatic process that is characterized by the rate constant k3. The PET tissue signal is denoted as CPET and represents a combination of both the Cf, and Cm signals. K1, inflow rate constant; k2, outflow rate constant; Ca, vascular space; Cf, cell cytoplasm; Cm, [C-11]alpha-methyl-serotonin; CPET, PET tissue signal.
The solution for the set of differential equations describing this three-compartment model was previously reported by numerous investigators (e.g. Sokoloff et al., 1977; Huang et al., 1980). Furthermore, it was shown that a combination of these rate constants (the term [K1k3/(k2 + k3] also called the K-complex) is directly proportional to the total amount of tracer entering the third “metabolic” compartment.

The scale-factor in the above equation is equal to the quotient of blood plasma tryptophan concentration available to be transported into brain tissue and the “lumped constant”. The lumped constant accounts for the difference between serotonin synthesis rate and [C-11]AMS synthesis rate. As this difference is considered to be invariant between subjects of a given species (Diksic et al., 1990; Schmall et al., 1995; Shoaf and Schmall; 1996), the lumped constant represents a true constant.
Tryptophan hydroxylase in brain is not saturated with its substrate (tryptophan) under normal conditions (Eccleston et al., 1965; Friedman et al., 1972), and therefore, alterations in the plasma tryptophan available for transport across the blood brain barrier can alter the synthesis of brain serotonin (Ternaux et al., 1976). Transport of tryptophan across the blood-brain barrier is affected by competition with other large neutral amino acids which compete with tryptophan for transport across the blood-brain barrier (Fernstrom et al., 1973; Bloxam et al., 1980) and by the binding of tryptophan to albumin (Knott and Curzon, 1972; Gessa and Tagliamonte, 1974; Bloxam and Curzon, 1978). The importance of the role of free versus total plasma tryptophan in the transport of tryptophan across the blood- brain barrier are highly contested issues in the literature. Whereas Diksic et al. have strongly argued that the free tryptophan concentration is the best estimate for plasma tryptophan available for transport into the brain (Takada et al., 1992; Takada et al., 1993), there is evidence that a portion of tryptophan bound to albumin is “stripped” from albumin as the blood circulates through the brain (Yuwiler et al., 1977; Pardridge, 1979; Pardridge and Fierer, 1990). In practice, it is difficult to measure precisely all interdependent variables determining the fraction of plasma tryptophan available for extraction by the brain tissue. We therefore used a standardized protocol that minimizes any differences between the subjects with respect to the total and the free plasma tryptophan. This protocol consisted of fasting all subjects for 12 hours before the PET scan and performing all studies at the same time of the day (between 2 and 4 PM). In fact, there was remarkably little variability in the total plasma tryptophan values measured for the 10 subjects (28 to 37 μmol/L). Under these standardized conditions, the K-complex is the main predictor of serotonin synthesis rate, because independent of the choice of either the free or total plasma tryptophan level, the scale factor is a common scaling factor for all regions. Therefore, K-complex values were considered as indicative of the serotonin synthesis rate.
Because PET measurements represent integrals of radioactivity concentration during the duration of the scan and not instantaneous concentrations, the model equation must be integrated over the appropriate time intervals. The individual rate constants K1 – k3 can then be estimated by fitting the following equation to the regional time-activity curves:
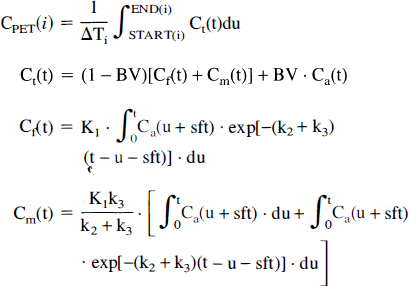
CPET(i) is the measured concentration obtained by the PET scanner over the i-th time frame with a duration of ΔTi = (END(i)-START(i)). It is fitted to the averaged (over ΔTi) tissue concentration predicted by the model (Ct). K1 represents tracer delivery (flow) times extraction of tracer into serotonergic neurons and therefore carries the dimension [mL/g/min]; k2 and k3 are true rate constants (1/min) that characterize the portion of the free precursor pool being replaced per time unit; finally Ca(ti) represents the arterial blood pool concentration. The times START(i) and END(i) mark the start and end of the i-th data acquisition period. Furthermore, the vascular contribution in the studied brain region is considered by the blood volume (BV) parameter and is given as (mL blood/mL imaging volume). The factor (1-BV) accounts for this contribution and corrects for the partial volume effect caused by the spillover. Finally, the shift parameter sft (s) is necessary to account for the time-difference between the time when activity reaches the brain and the point in time when activity reaches the sampling site.
The identifiability of individual rate constants can be assessed for different model configurations based on the condition number (CN) of the model using a singular value decomposition of the final sensitivity matrix (Belsley et al., 1982; see also Appendix). Furthermore, in order to assess the statistical significance of the third compartment (Cm), time-activity curves were analyzed using only a two-compartment model (k3 = 0). Conceptually, this model neglects the irreversible trapping of [C-11]AMS and should therefore poorly describe the data. For statistical comparison of the two models, an F-test was used to determine the significance of the k3 parameter for the overall fit.
Finally, given an irreversible third compartment, the K-complex can be determined using a linear approach first described by Patlak et al. (1983). After reaching a dynamic equilibrium (t > t*), the K-complex equals to the slope of a linear function:
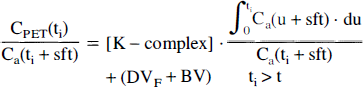
The time t* denotes the time after which the amount of tracer in all reversible compartments is in steady-state with the blood pool; consequently, DVF is the steady-state distribution volume of all reversible compartments. Because this equation is only applicable for the time-period when the system is in dynamic equilibrium, we can assume that, for times t > t*, the tissue activity is a slow changing function that can be well approximated by linear segments. In that case, the measured PET values can be regarded as instantaneous concentrations taken at midscan times ti. The parameter BV again represents the blood volume in the tissue region such that BV Ca(ti) is the exchangeable amount of tracer with the blood pool and sft is the time-shift parameter. The Patlak-plot approach was selected using regional tissue time-activity curves as well as on a pixel-by-pixel basis with the objective to create parametric functional images of the K-complex.
MATERIALS AND METHODS
Subjects
Our study population consisted of 10 young healthy volunteers, 18 to 37 years of age (25 ± 3 years; mean ± SD). All subjects were recruited by advertisement and underwent a screening interview to obtain a population with no history of mental or neurological disorders and were taking no centrally active pharmacological agents. Studies were performed in compliance with the regulations of the Wayne State University Human Investigation and Radiation Drug Research Committees, and informed consent was obtained before all studies.
Positron Emission Tomography
[C-11]AMT was produced by a modification of the method described by Chaly et al. (1988) using a synthesis module designed and built in-house as previously described (Chakraborty et al., 1996). Dynamic PET measurements were performed using the SIEMENS/CTI PET-scanner EXACT HR (Hoffman Estates, IL, U.S.A.), which allows simultaneous acquisition of 47 contiguous transaxial images with a slice thickness of 3.125 mm. The reconstructed image resolution obtained in the study was 7.5 ± 0.38 mm at full-width at half maximum in-plane and 7.0 ± 0.49 mm full-width at half maximum in axial direction (reconstruction parameters: Hanning filter with 1.26 cycles/cm cutoff frequency).
A dose of 0.4 mCi/kg of [C-11]AMT was administered as a slow bolus over 2 minutes via a peripheral intravenous line. At onset of study, dynamic scan acquisition was initiated with varying frame duration (8 × 15 s/3 × 60 s/11 × 300 s). The total scanning time was 60 minutes. Blood samples were withdrawn via a radial artery catheter every 10 seconds in the first 2 minutes and then at progressively longer intervals for the remainder of the study. The blood samples were centrifuged, and plasma was removed and counted in an NaI gamma well counter (Cobra II, Packard Instruments, Meriden, CT, U.S.A.) cross-calibrated to the PET scanner to obtain plasma [C-11]AMT concentrations in units of mCi/mL. Plasma tryptophan concentrations (at 0, 10, 30, and 60 minutes) were measured by high-pressure liquid chromatography as described by Krstulovic et al. (1979). Repeated measurements of plasma tryptophan for each subject showed a constant value for plasma tryptophan for the duration of the study and showed little variability among subjects (range 28 to 38 mmol/L, mean 32.4 mmol/L ± 4.2 SD, n = 10).
Calculated attenuation correction was performed on all images using the SIEMENS/CTI reconstruction software. The outline of the head was derived directly from the raw data by threshold fits to the sinograms according to the Karolinska technique (Bergström et al., 1982).
Because of the relatively long scan duration, radioactive fiducial markers were used to detect patient motion occuring throughout the study. Three molecular sieve beads (ca 2mm diameter) were placed on the patients scalp before the study. One bead was placed on the forehead, the other two beads were placed behind the ears. Approximately 0.25 μCi per mCi injected was pipetted onto each bead.
Data processing and analysis
In order to allow efficient analysis of PET image data, a software package written in IDL version 4.0.1 (RSI, Boulder, CO. U.S.A.) was developed in-house. This IDL software package is running under Sun OS 4.1.3/Openwindows 3.0 using a network of 6 SUN SPARC IPX/SPARC 5 workstations (SUN Microsystems Inc., Mountain View, CA, U.S.A.). The software environment allows the motion correction of the dynamic frame sequence, nonlinear estimation of rate constants as well as creation of parametric functional images representing serotonin synthesis rate.
Motion-correction.
The first step in the data analysis consisted of a correction for patient motion during the dynamic sequence. Initially, the user selects an arbitrary time frame that is then used as the base frame for all further reorientation steps. The user then selects those planes in the base frame in which the fiducial markers are most visible and marks each of the three markers with the cursor. Beginning from these marked points, the program performs a 10 × 10 pixel neighborhood search in four adjacent planes (two higher and two lower planes) in all time frames other than the base frame. This results in the localization of all three fiducial markers in all time frames of the dynamic study and defines one plane equation for each time frame. Subsequently, all time frames other than the base frame are resliced in order to correspond with the initial base frame. This method corrects for the three translational and rotational degrees of freedom, and realigns image sets to within 1 mm and 1°, respectively (Koeppe et al., 1991).
Regions of interest.
Brain regions of interest (ROI) were drawn by one experienced observer on PET images calibrated to μCi/mL. Regions of interest were drawn on a summed image representing retention of [C-11]AMT from 30 to 55 minutes in all planes showing the specified structure. An average of 650 ROI were drawn per subject in 47 image planes. Regions of interest were drawn for whole brain, frontal cortex, thalamus, caudate nucleus, cerebellar cortex, putamen, anterior cingulate gyrus, posterior cingulate gyrus, hippocampus, rectal gyrus of the inferior frontal lobe, transverse temporal gyrus, middle temporal gyrus, parietal cortex, and occipital cortex. These regions were subsequently copied to all time-frames of the dynamic sequence to obtain regional time-activity curves or to parametric images of the K-complex. The average concentration for individual structures was determined as a weighted average over all planes. The three-compartment fit was performed using ROI for whole brain, frontal cortex, thalamus, caudate nucleus, and cerebellar cortex.
Nonlinear estimation procedure.
Individual rate constants were estimated using a standard Marquardt-Levenberg least-squares algorithm written in FORTRAN and called by the IDL software package. For analysis of parameter identifiability, the structure of the linearized model in the neighborhood of the computed solution was used. A singular value decomposition of the parameter sensitivity matrix was computed yielding the condition number of the model (Lawson and Hanson, 1974). The condition number was previously shown to characterize the identifiability of each parameter in a given model configuration (see Appendix). Initially, the most complex model configuration was used for the whole brain region, fitting for parameters K1 – k3, BV and the time-shift sft (5-parameter fit). Subsequently, all smaller regions were fitted with a three-compartment, four-parameter model, fitting only for K1 – k3 and BV, while using the previously determined value for the time-shift. Thus, each subject had a single estimate of the time-shift, while each region had a separate estimate of the BV.
Statistical comparison of a two- and three-compartment model.
Compartmental analysis was repeated using equation 2 with k3 set to zero describing a two-compartment model. In order to test the adequacy of the two models, the F-statistic was computed from
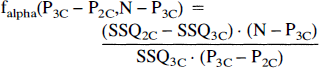
where SSQ2C and SSQ3C refer to the residual sum of squares from the two models. P2C and P3C are the number of parameters in the alternative configurations and N is the number of data points (22 in this work). The value obtained for the F-statistic was compared with the appropriate entry in a F-table f0.05(1,17) and if it exceeded this value, we rejected the hypothesis that both models have the same variance and the model with the lower sum of squares was chosen to represent the data adequately.
Determination of the dynamic equilibrium phase.
In order to approximate the time-point when dynamic equilibrium is reached (and thus the Patlak-plot approach becomes valid), we used individual rate constants to estimate the half-life of the free precursor pool according to the expression natural logarithm of 2/((k2 + k3). It was then assumed that after five half-lives, changes of the free precursor pool can be neglected and dynamic equilibrium is reached. Furthermore, in order to analyze the source of error caused by applying the Patlak-plot approach to time-points that have not reached dynamic equilibrium, simulation studies were performed. Simulated noise-free PET time-activity curves were calculated from the model equation 2 using the arterial input function shown in Fig. 2. The parameters K1 – k3 were varied according to the mean values obtained from the five regions in Table 1 and a BV contribution of 3% was assumed. Bias in K-complex estimates was then computed for different time-intervals of the linear regression in the Patlak-plot. Bias (%) was defined as
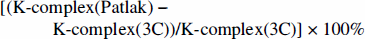
Comparison of tracer kinetics identifiability analysis derived from a three-compartment versus a two-compartment model applied to [C-11]alpha-methyl-tryptophan data in 10 healthy subjects
NS, not significant at the 95% level; T1/2 = In2/(k2 + k3) given in minutes; %COV, percent coefficient of variation (100 × SD/mean); CN, condition number (see Appendix): F. F-statistic (see equation 4); K1 is given in mL/g/min; k2 and k3 are given in 1/min; BV. percentage of blood volume in the tissue region (% mL blood/mL imaging volume); WB, whole brain region; Front cort., frontal cortex; caud nucl., caudate nucleus; cereb cort., cerebellar cortex.
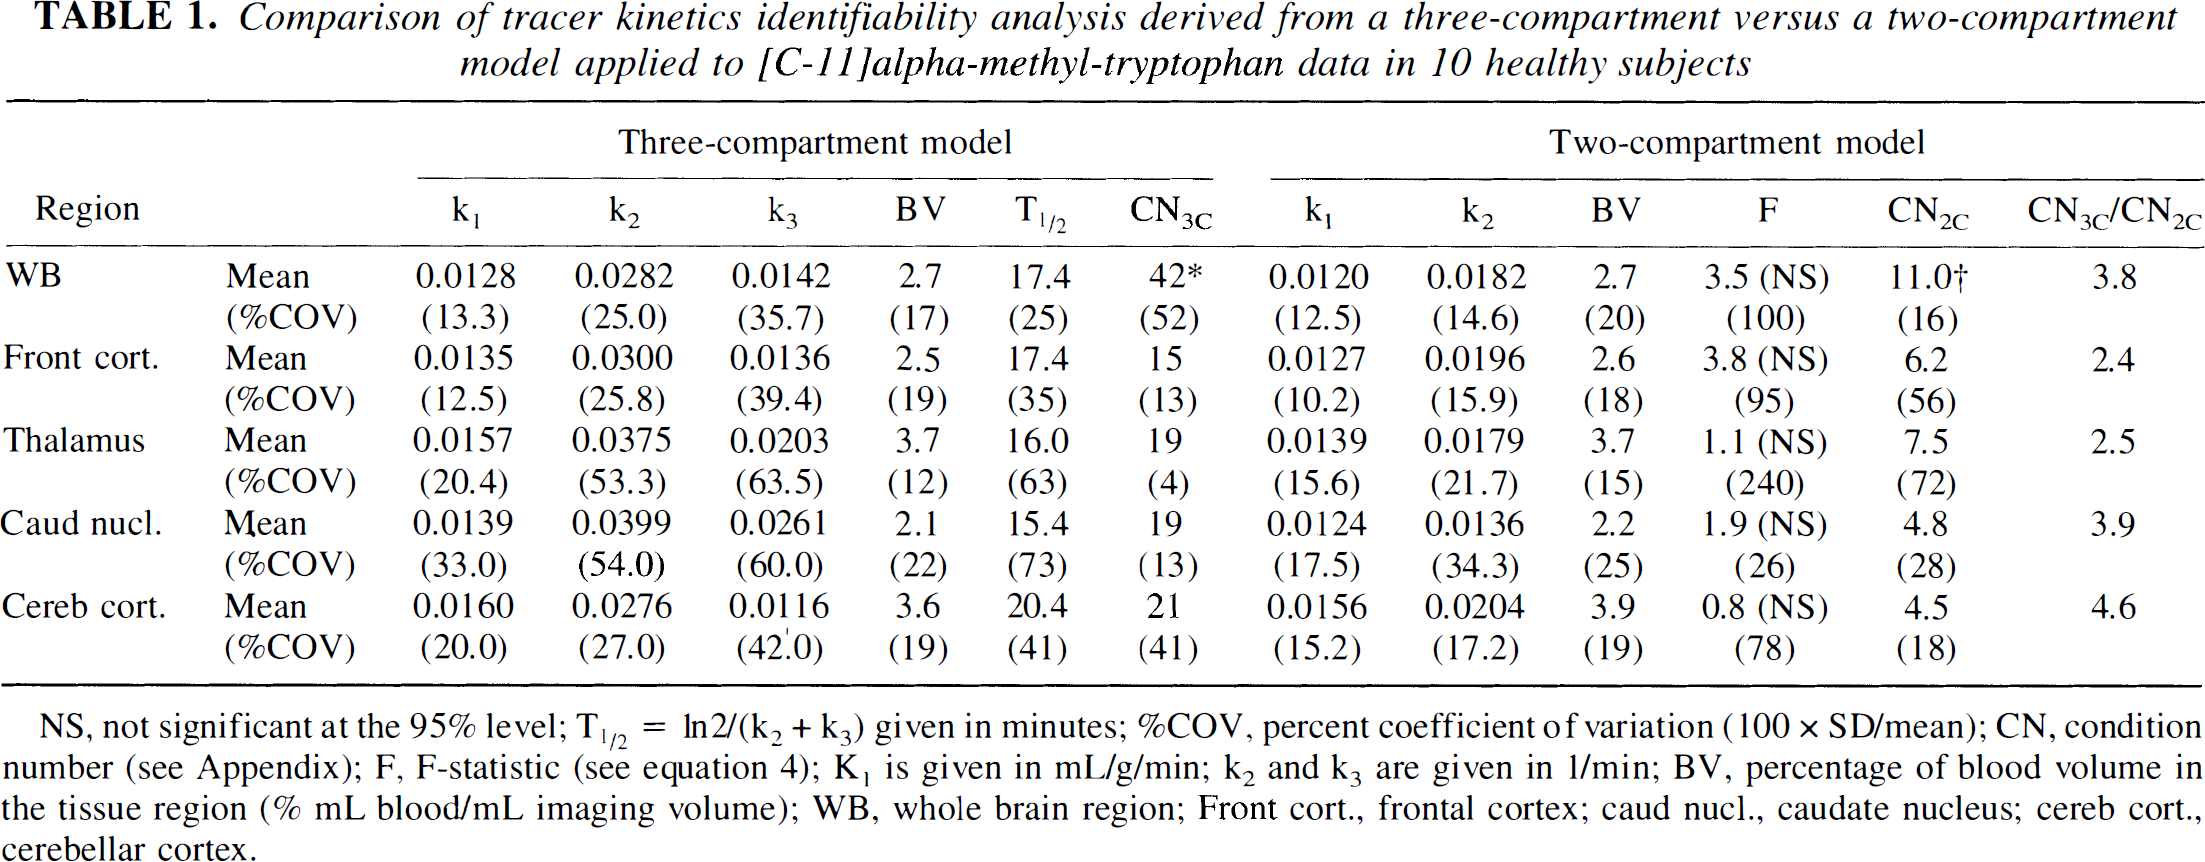
Arterial plasma and whole brain tissue concentration-time course of [C-11]AMT (corrected for radioactive decay) in a young healthy control subject. The whole brain uptake was low with less than 2% of the injected dose present in the brain after 60 minutes. Inset: Individual regional time-activity curves shown on expanded scale.
Parametric images.
In order to obtain a parametric image of the K-complex, the Patlak-plot approach was used on a pixel-by-pixel basis. All frames were used that started from 20 minutes after injection until the end of the study. An average constant time-shift of 12 seconds was applied to the arterial blood input function to account for the time-difference between the time-point when activity reaches the brain and the point in time when activity reaches the sampling site. The approach produced a functional static image (47 planes) of the K-complex. Subsequently, all previously defined ROI were copied to this image and a weighted average for each defined structure was obtained.
Statistical analysis.
The Friedman test (Siegel and Castellan, 1988) was performed to determine whether there were significant differences among the ROI in average rank of K-complex values. The same analysis was used to determine Kendall's coefficient of concordance which indicates the degree of agreement among the subjects on the rank order of K-complex values. Further analyses were performed to evaluate the extent to which the rankings of K-complex values across ROI were consistent with the rank order of regional serotonin content in human brain from the literature (Costa and Aprison, 1958; Cochran et al., 1976; Mackay et al., 1978; Bucht et al., 1981). Because the regions could only be partially ordered based on the literature, an adaptation of the Jonckheere test (Jonckheere, 1954) was performed using the Ager-Brent partial order statistic (Ager and Brent, 1978). The K-complex values for the brainstem and the pineal body were excluded from this analysis because K-complex values for these structures clearly underestimate serotonin synthesis caused by partial volume effects.
RESULTS
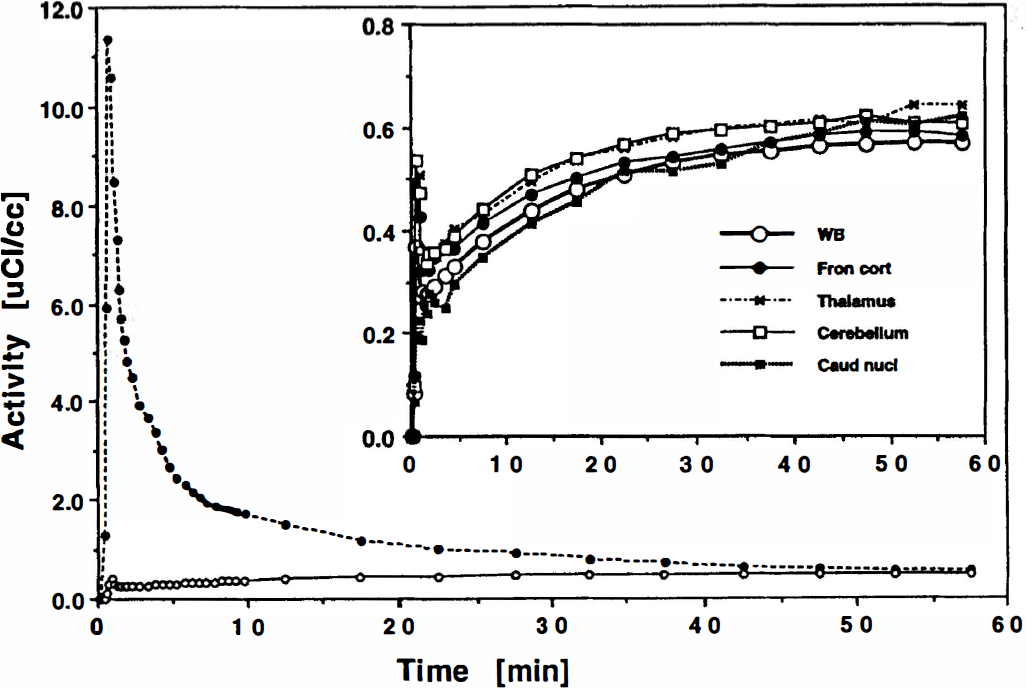
A representative set of PET images obtained from one subject is shown in Fig. 3. The figure shows summed images from 30 to 55 minutes after tracer injection at two different planes of the brain and reveals widespread distribution of the tracer activity throughout the brain gray matter. Also shown in Fig. 3 are parametric images of the K-complex at corresponding planes. Regional values of the K-complex obtained by applying ROI to the parametric images resulted in stable measurements of the K-complex, even for small brain structures. Fig. 2 shows the decay-corrected time-activity curves obtained from different regions of the brain as well as the whole brain time-activity curve for size comparison together with the arterial blood curve. The [C-11]AMT concentration in brain approaches the concentration in blood by about 45 minutes after tracer injection, after which it remains approximately constant. It can be seen that only a small fraction of [C-11]AMT is retained in the tissue because of the very low single-pass extraction fraction (about 2%). The low uptake of [C-11]AMT and the low ratio of tissue to blood result in relatively noisy raw counts and parametric images compared with other commonly used PET tracers.
[C-11]alpha-methyl-tryptophan distribution in healthy adult brain. The top row shows transaxial images at two levels generated by summing data obtained between 30 and 55 minutes after tracer injection and shows widespread distribution of the tracer throughout brain gray matter. The shaded bar indicates activity concentration in units of μCi/mL. The bottom row shows parametric images of the K-complex at corresponding brain levels. The shaded bar indicates activity concentration in units of mL/g/min.
Table 1 shows the results of fits to time-activity curves being analyzed using the full three-compartment model configuration according to equation 2. The entire 60-minute data sequence was used in these fits. The table values give the mean and percent coefficient of variation (100 × SD/mean) of individual rate constants and the CN for the three-compartment model configuration, for the two-compartment model configuration (k3 = 0), and the F-statistic between both models according to equation 4. As the CN is a measure of parameter identifiability (see Appendix), the table indicates that parameter identifiability increases approximately three-fold when k3 is set to zero (CN3C/CN2C). Furthermore, the F-value for a 95% confidence interval with f0.05(1,17) degrees of freedom is 4.45. Comparing this value to the computed values of F in Table 1 (3.8 to 0.8) shows that, based strictly on the magnitude of the residuals, a three-compartment model configuration does not describe the data significantly better than a two-compartment model configuration. However, visual examination of residuals clearly indicated that they were not randomly distributed around zero but showed sections that were all positive, then negative, positive, and negative. These “runs” in the residuals were not seen in the results obtained from the three-compartment model.
The coefficient of variation for K1 was in the range between 10 to 30% and was higher for k2 (25 to 55%) and highest for k3 (35 to 65%). In fact, a large portion of the variance causing the high CN of the three-compartment model configuration was associated with the correlation between k2 and k3. This high correlation resulted in unstable parameter estimation in smaller regions, resulting in occasionally negative values of the K-complex. Conversely, all regions analyzed using the Patlak-plot approach had a positive K-complex.
The half-life of the free precursor pool T1/2 in Table 1 was computed from the individual rate constants according to the formula natural logarithm of 2/(k2 + k3) and was determined in a close range between 15.4 to 20.4 minutes. Assuming that after five half-lives the concentration of the precursor pool parallels the concentration of blood plasma tryptophan, dynamic equilibrium in most brain structures can be expected after approximately 80 minutes after tracer injection.
Fig. 4 shows the bias in K-complex estimates obtained by applying the Patlak-plot approach to the simulated time-activity curves using the average rate constants reported in Table 1. The start of the linear regression was first chosen at times 20, 30, and 40 minutes after injection and the linear regression was performed up to 60 minutes after injection. In a second pass, starting times were chosen as 60, 80 and 100 minutes and the linear regression was performed up to 150 minutes. The result of the simulation shows that dynamic equilibrium is not completely reached in the early parts of the study, therefore the slope (K-complex) of the Patlak-plot is overestimated compared with its value at equilibrium. Finally, the K-complex estimates approached the correct values close to the predicted equilibrium time-point of (5 × T½).
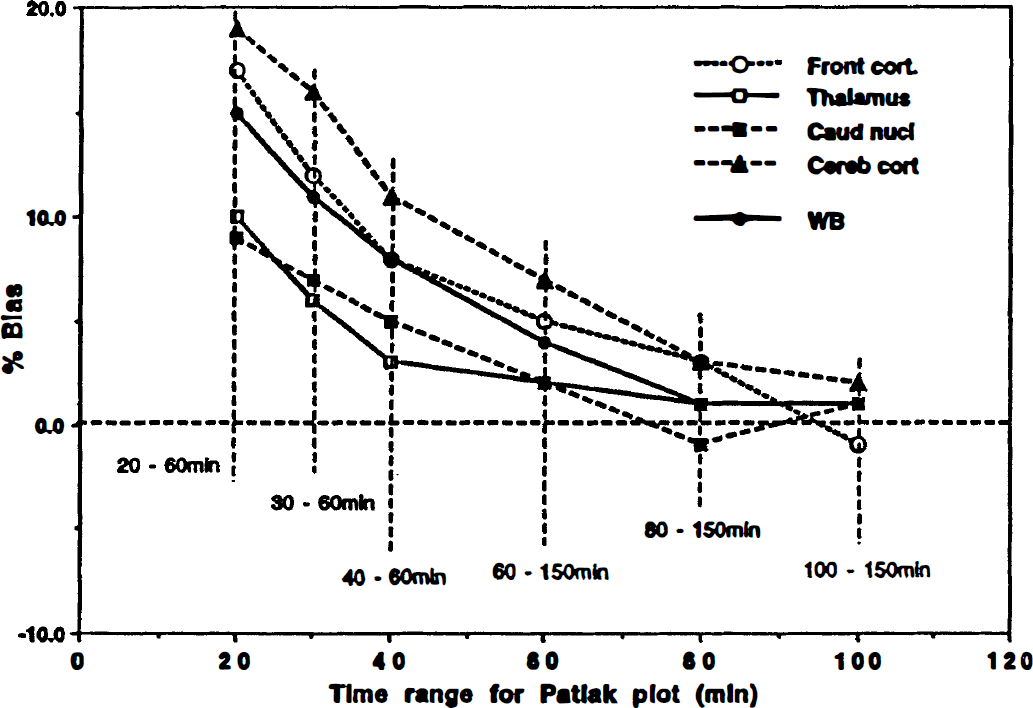
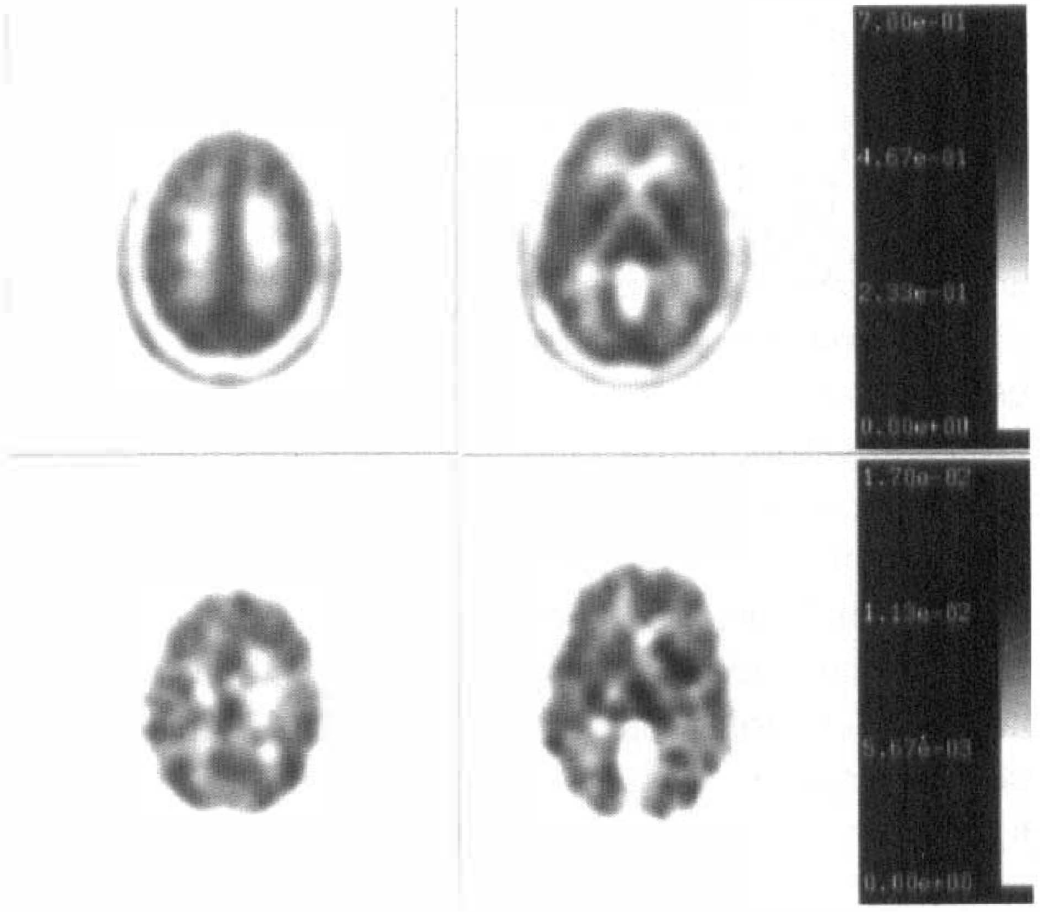
Bias in K-complex estimates obtained from simulated time-activity curves between the Patlak-plot approach and the three-compartment model fit for different regions of the brain. The time range of the linear regression in the Patlak-plot was varied between 20 and 150 minutes. The bias was defined as [(K-complex(Patlak) – K-complex (3C))/K-complex(3C)] × 100%.
A comparison of K-complex estimates derived using the three-compartment model configuration versus values obtained by the Patlak-plot approach is shown in Table 2. K-complex values derived by the Patlak-plot approach (linear regression 20 to 60 minutes) overestimate the “real” values by 10 to 20%. However, the CN of the nonlinear fitting procedure is found to be more than twice that of the Patlak-plot approach (CN3C/CNP, Table 2). Finally, Fig. 5 displays the correlation between K-complex values obtained from the normal subjects for all studied ROI (5 regions in 10 patients) using both analysis procedures. There is a good agreement between both methods with an expected bias in the range of 10 to 20% for the Patlak-plot-derived values.
Bias in K-complex estimates derived from the Patlak-plot approach relative to estimates from a three-compartment model obtained from different regions of the brain in 10 healthy subjects
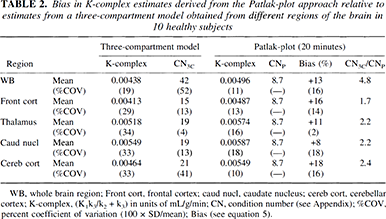
WB, whole brain region; Front cort, frontal cortex; caud nucl, caudate nucleus; cereb cort, cerebellar cortex; K-complex, (K1k3/k2 k3) in units of mL/g/min; CN, condition number (see Appendix); %COV, percent coefficient of variation (100 × SD/mean); Bias (see equation 5).
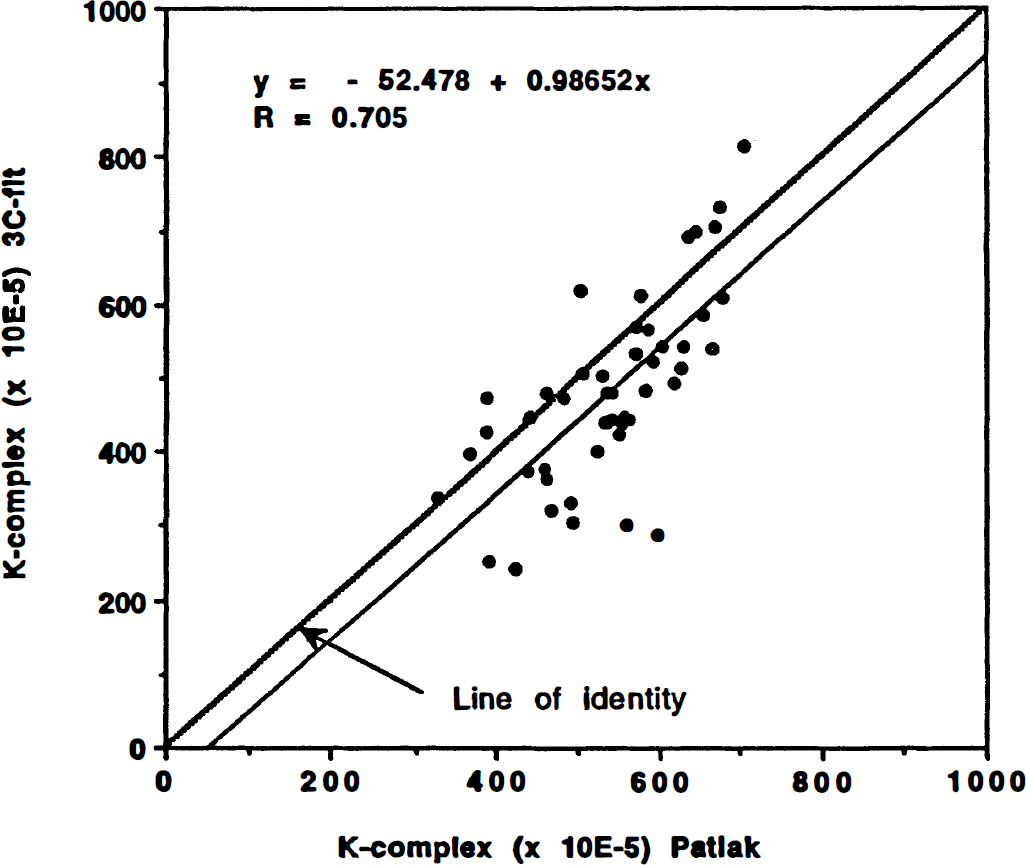
Correlation between K-complex estimates obtained from the normal subjects for all 50 studied regions of interest (5 regions in 10 patients) using both the Patlak-plot and the three-compartment fit procedures. There is a good agreement between both methods with an expected bias in the range of 10 to 20% for the Patlak-plot-derived values.
The rank order of K-complex values corresponded well to the distribution of serotonin content in human brain, with highest values being measured in putamen, caudate and thalamus, and the lowest values were determined in the lateral occipital cortex, parietal cortex and frontal cortex. Using Friedman's test the rank order of regional K-complex values proved to be highly significant (Chi2 = 127.4, dof = 19, p < 0.0001). Furthermore, using Kendall's coefficient of concordance, the average rank order correlation between pairs of subjects over the ROI was 0.634 (P < 0.0001). In addition, using the Ager-Brent statistics, we found highly significant agreement (P < 0.0001) between the rank order of the K-complex and the a priori partial ordering of ROI based on regional serotonin content in human brain from the literature (see Methods for references).
DISCUSSION
Positron emission tomography using radiolabeled neuroreceptor ligands and neurotransmitter precursors are currently routinely used in the in vivo assessment of neurotransmitter function in the healthy and diseased human brain. However, the interpretation of the data generated by many radioligands requires a detailed evaluation of the model characteristics in order to extract reliable information. If a model configuration is overly complex, the variances in the parameter estimates may be prohibitively high and the reliability of the information obtained would be poor. Thus, we present in this article an identifiability analysis of the in vivo kinetics of the tracer [C-11]AMT, analyzed using both a three-compartment model fit and a Patlak-plot approach. Our study shows that the K-complex values obtained represent an excellent index of regional serotonin synthesis rates in human brain, based on comparison with brain serotonin content derived from the literature.
Whole-brain average values of K1 the 10 healthy subjects ranged from 0.012 to 0.016 mL/g/min, with a mean value of 0.014 mL/g/min. Assuming normal CBF rates of 0.7 mL/g/min, single-pass extraction is only 2% (K1 = flow × extraction). The low single-pass extraction, which is only about one third of that of [C-11]flumazenil and only about one tenth of that of [F-18]DG, results in relatively poor image quality. The coefficient of variation for mean whole brain K1 of 13.3% is typical of many PET studies and is comparable to intersubject variability reported for either glucose metabolism or blood flow studies (Huang et al., 1981; Lammertsma et al., 1987; Duara et al., 1987; Raichle et al., 1983).
The coefficient of variation for parameters k2 and k3 was between 25 to 65% and was highest for the parameter k3 in each individual structure. The poor identifiability of k2 and k3 is most likely the consequence of the long half-life of the free precursor pool in comparison to the time-span available for data acquisition. The half-life of the free precursor pool, obtained from individual rate constants, was found in the range of 15.4 to 20.4 minutes. This is about four times longer than in the [F-18]DG model (which is about 4 to 5 minutes) (Huang et al., 1980). It is commonly assumed that the dynamic equilibrium is reached after five half-lives of the free precursor pool. In the case of [F-18]DG, this phase is reached after approximately 25 minutes. Given the longer half-life of the precursor pool for [C-11]AMT, dynamic equilibrium can be expected after approximately 80 minutes. Data acquired during this equilibrium phase is most important for a good delineation of the shape parameters k2 and k3. However, because of the low uptake of tryptophan into brain tissue and the short half-life of [C-11] (20 minutes), the length of the acquisition period is limited. It is not feasible to acquire data beyond approximately 60 minutes after tracer injection. After this time, the quality of PET images is highly compromised by the low-count statistics. In addition, by this time the necessary decay-correction magnifies the statistical noise by a factor in the order of 10. Therefore, only dynamic data up to approximately 60 minutes are available with acceptable statistics. Given the limitation to which the shape parameters can be determined, the application of a full three-compartment model fit to [C-11]AMT data is problematic, especially in smaller regions of the brain. As all individual k-values are close to 0 and because of the nature of the ill-conditioned problem, values occasionally become negative, rendering the resulting K-complex useless.
To estimate values of individual rate constants, the data points are fitted to the model equation yielding the parameter solution vector. It is known that in case of an ill-conditioned problem the obtained solution is unsatisfactory, as the solution vector is largely influenced by computational conditions like the chosen minimization algorithm, the termination criterion of the fit, starting values for the parameters and the noise level of the data. The parameters are identifiable if the solution vector remains unchanged under various computational conditions. To determine the extent of identifiability of a model with respect to the measured data, methods analyzing the structure of the covariance matrix have been used (Mazoyer et al., 1986; Jovkar et al., 1989). Our approach (see Appendix) is similar to these methods with the advantage that condition numbers of different models applied to the same data can be compared after scaling the columns of the sensitivity matrix to unity. The method is based on a singular value decomposition of the final sensitivity matrix in order to estimate the quotient of the highest and the lowest singular value (representing the condition number of the model). Conceptually, this value indicates how much the solution-indifference region in parameter space deviates from a hyper-sphere. The larger the condition number, the more the solution-indifference region resembles a hyper-paraboloid elongated in the direction of the smallest singular value. As all solution vectors are accepted within this region, very different solution vectors may be obtained using the same data-set dependent on the above mentioned computational parameters.
The result of our identifiability analysis showed that parameter identifiability is, in general, unacceptably low for a three-compartment model configuration. In fact, the application of a two-compartment model with k3 set to zero proved to describe the data adequately. Based on the magnitude of residuals obtained from the fits, the two-compartment model could not be rejected even in large regions (Table 1), although visual examination of residuals revealed a distinct bias that was not seen when the three-compartment model fit was applied, indicating the conceptual correctness of the three-compartment fit. The low identifiability of the full three-compartment model fit suggests the application of the Patlak-plot approach, a computational method able to stabilize an ill-conditioned three-compartment model (Patlak et al., 1983). According to this method, after the compartmental system has reached steady-state, the tissue volume of distribution is a linear function of the “blood-time”
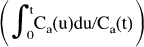
(see equation 3) and the K-complex can be computed as the slope of this linear function. The advantage of this approach is the transformation of a nonlinear problem into a linear one in which the slope can be computed analytically. It also allows the creation of parametric images of the K-complex which is advantageous in clinical practice. The drawback of this method is that individual rate constants can no longer be obtained. In addition, this approach is based on the assumption that dynamic equilibrium is reached, i.e. that the activity in the free precursor pool parallels that of the blood pool.
For reason discussed above, it is not possible to wait with [C-11]AMT data acquisition until dynamic equilibrium is reached (>80 min). The Patlak-plot approach has to be applied much earlier, thus violating the basic assumption of dynamic equilibrium. It is therefore necessary to estimate the bias this approach introduces into the K-complex estimation. Furthermore, it is necessary to identify how stable this bias is for different regions of the brain. The performed simulation studies showed a fairly constant bias in the range between 8 to 18% when the linear regression in the Patlak-plot was performed between 20 to 60 minutes. Although this bias decreased to 4 to 12% when the Patlak-plot approach was applied to the last 20 minutes of the simulated data set (40 to 60 minutes), parametric images of the K-complex obtained from patient data showed a decreased contrast between structures in comparison to the 20- to 60-minute regression span. The smaller data set and the higher noise level at the end of the acquisition period might be contributing factors to this result. This result indicates that applying the Patlak-plot method between 20 to 60 minutes might be a good compromise between stability, bias, and contrast when creating parametric functional images of K-complex estimates for [C-11]AMT.
Detailed analysis of K-complex values derived from parametric images showed that the rank order of regional K-complex values are consistent with the rank order of serotonin content in human brain. Whereas the highest concentrations of serotonin is known to be localized to serotonergic bodies in the brainstem nuclei, the brainstem was not among the regions with the highest K-complex values. However, this finding is not unexpected because of the limits of the spatial resolution of PET imaging compared to the small size of the nuclei located near the midline of the brainstem (Tork, 1990) resulting in loss of activity in the reconstructed image because of partial volume effects (Hoffman et al., 1979). The rank order of K-complex values for the remaining brain regions showed a statistically significant correlation with the rank order of serotonin content in human brain. The highest values for serotonin synthesis were found in putamen, caudate and thalamus, and the lowest values were determined in the lateral occipital cortex, parietal cortex and frontal cortex.
Whereas the rank order of K-complex values shows highly significant agreement with serotonin content in human brain, the magnitude of the differences between regions is smaller than the differences in serotonin content, as well as serotonin terminal density measured with serotonin transporter ligands. The smaller differences found between regional values of the K-complex as compared with these measures is mainly attributable to the components that constitute the K-complex. The K-complex is a macroparameter consisting of individual rate constants in the form K-complex = K1x[k3/(k2 + k3)]. The rate constant k3 represents the irreversible conversion of [C-11]AMT to [C-11]AM-5HT and can be assumed as directly related to the serotonin content or serotonin terminal densities in tissue. However, the overall synthesis rate is not only dependent on k3, but takes also into account the transport of tryptophan and [C-11]AMT across the blood-brain barrier. In our study, the average k2 value derived from all 10 subjects for a whole brain region was 0.0282 min−1 and was 0.0142 min−1 for k3. Using these values, the factor k3/(k2 + k3)] is 0.34 and increases only to 0.50 (47% increase) when k3 is increased two-fold (k3 = 0.0284, k2 constant). Thus, a two-fold increase in k3 results only in a 47% increase in the factor k3/(k2 + k3)] causing a transport-dependent “blunting” of differences in the K-complex among different regions of the brain.
This sensitivity of the K-complex to substrate transport may represent one of the limitations of the Patlak-plot approach with respect to [C-11]AMT data analysis. The Patlak-plot approach does not allow the separate study of the irreversible conversion of [C-11]AMT to [C-11]AM-5HT apart from the transport of [C-11]AMT into the cell across the blood-brain barrier. However, the transport of [C-11]AMT into the cell is affected by competition with other large neutral amino acids that compete with tryptophan for transport across the blood-brain barrier. In addition, the transport is also dependent on the various degree of tryptophan binding to albumin. Therefore differences in these systemic factors between patient groups might affect the obtained global K-complex values and may lead to differences in K-complex estimates not related to tryptophan hydroxylase activity. Thus it is imperative that every possible attempt is made to standardize the conditions under which the studies are carried out, in order to allow correct interpretation of global changes in serotonin synthesis rate. Further studies are needed to address this issue in future.
However, studies in our laboratory using this method indicate that certain patient groups (children with autism or epilepsy, unpublished data) show focal abnormalities on parametric images of the K-complex, showing that PET using [C-11]AMT is a sensitive method for measurement of pathological alterations of serotonin synthesis in patient groups. The observed focal abnormalities are unlikely to be explained by any systemic effects and strongly indicate the high potential of this tracer for clinical applications.
In conclusion, [C-11]AMT seems to be a useful agent for measuring serotonin synthesis rate in the human brain using dynamic PET. The data were shown to be reasonably well described by the Patlak-plot method within an acceptable error margin. Most importantly, the obtained K-complex values correspond well with serotonergic innervation patterns in the brain. The method should thus prove useful in the study of human neurological disorders.
Footnotes
Abbreviations used
Acknowledgements
We thank Dr. Mirko Diksic for many helpful discussions concerning these studies and Dr. John Ofenstein for plasma tryptophan measurements. We also express our thanks to Galina Rabkin, CNMT, Teresa Jones, CNMT, and Ben Lathrop, CNMT for their expert technical assistance in performing the PET studies.