
Abstract
[11C]SCH 23390 is a standard ligand for positron emission tomography (PET) studies on striatal dopamine D1 receptors. Its usefulness for cortical D1 receptor quantification in human PET studies has been questioned but has not been addressed previously. The authors tested the reproducibility of [11C]SCH 23390 binding potential (BP) in cortical areas in five healthy volunteers using three-dimensional PET. Measurement of D1 receptor BP was reproducible in basal ganglia, as well as in all cortical areas studied (intraclass correlation coefficients between 0.81 and 0.92). The absolute variability in cortical areas was 9.21% ± 0.07%. The reproducibility of cortical D1 receptor BP measurement with [11C]SCH 23390 is equal to that observed with a more recent D1 -ligand, [11C]NNC 112. [11C]NNC 112 produces slightly higher specific-to-nonspecific binding ratios but has markedly slower kinetics resulting in a need for a longer scan time. These aspects should be considered when designing studies on the cortical D1 -like receptors.
Keywords
SCH 23390 ((R)-(+)-8-chloro-2,3,4,5-tetrahydro-3-methyl-5-phenyl-1H-3-benzazepin-7-ol) is the first selective dopamine D1 -like (D1 and D5) receptor ligand (Hyttel, 1983; Iorio et al., 1983). It has been used extensively as a prototype D1 receptor antagonist in experimental studies and [3H]SCH 23390 has been a ligand of choice for in vitro D1 receptor binding studies. SCH 23390 also has been labelled with11 C (Halldin et al., 1986) and used for positron emission tomography (PET) imaging in man (Farde et al., 1987). The D1 -like receptors are found in relatively high density in basal ganglia and can be measured with good reproducibility with [11C]SCH 23390 (Chan et al., 1998). D1 -like receptors are distributed widely in the brain but are expressed in cortical areas with a density 3 to 5 times less than that in striatum (De Keyser et al., 1988). The usefulness of [11C]SCH 23390 for quantification of D1 -like receptors in cortical regions has been questioned based on a relatively low neocortex/cerebellum ratio with this ligand (Halldin et al., 1998; Chou et al., 1999; Abi-Dargham et al., 2000). However, these arguments have not been tested with [11C]SCH 23390 and modern three-dimensional PET methodology. Thus, the authors explored the reproducibility of cortical [11C]SCH 23390 binding in a standard test–retest setting on five healthy volunteers using a GE Advance PET camera (Milwaukee, WI, U.S.A.) in three-dimensional mode.
MATERIALS AND METHODS
Subjects
The study was approved by the Ethical Committee of the Turku University/University Hospital, Turku, Finland. Five male volunteer subjects (age = 28.3 ± 3.2 years, height = 181 ± 4 cm, and weight = 78.6 ± 9.4 kg, mean ± SD) free of any psychiatric or somatic illness participated in the study. All subjects were right-handed, nonsmokers, and had normal 1.5 T magnetic resonance imaging scans of the brain. Written informed consent was obtained in all cases.
Preparation of [11C]SCH 23390
The desmethyl precursor SCH 24518 and SCH 23390 were kindly supplied by Schering (Bloomfield, NJ, U.S.A.). [11C]Methyl triflate was prepared as described previously (Jewett, 1992; Någren and Halldin, 1998). [11C]Methyl triflate was reacted with SCH 24518 (0.3 mg) in acetone (100 μL) for 1 minute at 60°C. The reaction mixture was purified on a Waters μ-Porasil column (Milford, MA, U.S.A.) (300 mm × 7.8 mm, 10 μm) using a dichloromethane/methanol/triethylammonium acetate eluent, and a Pharmacia UV-1 UV-detector (Amersham Pharmacia Biotech, Uppsala, Sweden) (wavelength = 254 nm) in series with a coaxial type air ionization chamber (Sipilä and Saarni, 1984) for radioactivity detection. Propylene glucol/ethanol (7/3, 800 μL) was added to the eluent containing the purified product. After evaporation of the mobile phase, the residue was dissolved in 8 mL physiologic phosphate buffer (pH 7.4) and filtered through a Gelman Acrodisc (4192; Pall Gelman Laboratory, Ann Arbor, MI, U.S.A.) 0.22 μm sterile filter. The radiochemical purity and the specific radioactivity of the product were determined in analogy to the analysis of [11C]FLB 457 (Vilkman et al., 2000) using high-performance liquid chromatography and UV-detection at 205 nm. At time of administration, the specific radioactivities were 60.39 ± 16.34 and 68.51 ± 16.10 MBq/nmol for test and retest scans, respectively (mean ± SD). Radiochemical purity of the tracer was 98.3% ± 1.0% and 98.1% ± 0.6% for test and retest scans, respectively (mean ± SD).
Positron emission tomography method
Positron emission tomography experiments were performed using a whole-body, three-dimensional PET scanner (GE Advance; GE, Milwaukee, WI, U.S.A.) with 35 slices (4.25-mm-thick) covering the whole brain. The basic performance characteristics tests on this camera indicated transaxial and axial spatial resolution (FWHM) of 4.3 mm and 4.3 mm, respectively. The camera was run in the three-dimensional mode using scatter correction (Vilkman et al., 2000). Before each experiment, a transmission scan was performed with68 Ge filled rod sources. An intravenous rapid bolus of [11C]SCH 23390 (200 to 300 MBq) was given and flushed with saline. The uptake of [11C]SCH 23390 was measured for 51 minutes after injection using 13 time frames. The frame sequence consisted of three 1-minute frames followed by four 3-minute frames and six 6-minute frames. All subjects were scanned twice during the same day between 11.00 a.m. and 5.00 p.m. at least 1.8 hours apart. Two striatal (putamen and caudate) and five cortical—dorsolateral prefrontal (DLPFC), medial part of the superior gyrus of the frontal (MSFC), anterior cingulate (AC), posterior cingulate (PC), and temporal (TC) cortices—regions of interest (ROIs) were drawn on the magnetic resonance images resliced according to PET slices (Ardekani et al., 1995). Regular-shaped cortical ROIs were 6 to 7 mm in axial width. No gray/white matter segmentation was used for ROI definition. Regions of interest for cerebellum, as well as all other ROIs, were manually delineated based on visual inspection with reference to brain atlases. All structures were defined on 3 or 4 planes.
Quantification of [11C]SCH 23390 binding
Binding potential (k3 /k4) values were calculated using the simplified reference tissue model. The applicability of the simplified reference tissue model to [11C]SCH 23390 has been previously validated for ROI-based analysis by Lammertsma and Hume (1996). The authors also performed Logan analysis with reference tissue input to obtain distribution volume ratio (DVR) values (Logan et al., 1996). Data was weighted according to frame duration and total counts per frame, as described by Gunn et al. (1997), but the current data were decay-corrected. Cerebellum was used as a reference region in both analyses with negligible dopamine D1 receptor density. As shorter scanning times for [11C]SCH 23390 have been used, the authors also tested the effects of data collection time on the reproducibility of BP by calculating averages (±SD; n = 10) expressed as percentage of the reference (51 minutes) value for each data collection duration. Parameters were considered stable if means were within 10% of the reference value and standard deviations did not exceed 15% (Abi-Dargham et al., 2000). Times of transient equilibrium (dB/dt = 0) were achieved by defining the time point of maximal specific binding in each case.
Statistical analysis
The between-subject and within-subject variation were calculated and used in the determination of the intraclass correlation coefficient (ICC). ICC = (BSMS − WSMS)/(BSMS + [n − 1] WSMS), where BSMS is the between-subject mean square, WSMS is the within-subject mean square, and n is the number of repeated observations (in this case, n = 2). This coefficient can have values from −1 to 1 (where values close to 1 indicate that most variance is because of between-subject rather than within-subject variation). Also, the values for absolute variability were calculated as follows: |scan 2 − scan 1|/0.5 (scan 1 + scan 2) × 100%. Reliability coefficients (R) were calculated as described by Chan et al. (1998) for comparative purposes. Standard t-test of dependent samples was used for comparison of binding potential values between tests 1 and 2. P < 0.05 was considered statistically significant. Analyses were performed using SPSS for Windows (SPSS Inc., 1989–1999, Release 9.0.1.).
RESULTS
The uptake of [11C]SCH 23390 was highest in putamen and caudate and lowest in the cerebellum. In cortical regions, activity levels were between those of striatal and cerebellar regions (Fig. 1). The time for reaching a transient equilibrium of specific binding (dB/dt = 0) was relatively fast: caudate, 22.2 ± 4.6; putamen, 21.4 ± 3.8; TC, 19.4 ± 3.5; AC, 19.1 ± 3.9; MSFC, 16.6 ± 5.0; DLPFC, 14.7 ± 3.1; and PC, 12.3 ± 2.7 minutes (mean ± SD). Binding potential values ranged from 0.35 ± 0.07 in DLPFC to 1.74 ± 0.20 in putamen (n = 10, mean ± SD).
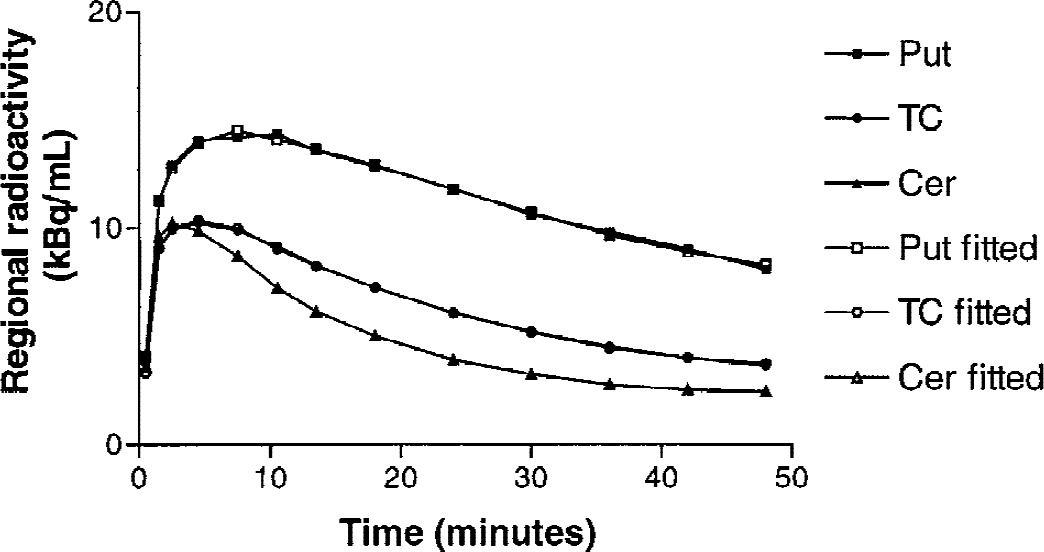
Example of time-activity curves of fitted data superimposed on the original regional time-activity data of one subject after injection of [11C]SCH 23390. The lines are practically indistinguishable from each other indicating nearly perfect fit. Put, putamen; TC, temporal cortex; Cer, cerebellum.
The test–retest results using a 51-minute scan time are summarized in Table 1. All BP measurements showed good to excellent reproducibility with high intraclass correlation coefficients and with no systematic differences in binding potential values between test 1 and test 2. The use of 45-minute data collection time resulted in almost identical ICC values (0.80–0.92) and absolute variability (8.10% ± 0.07%, mean ± SD) compared with those with the 51-minute time. The use of 39-and 33-minute collection times for cortical D1 receptor measurement resulted in ICC values of 0.59 to 0.94 and −0.86 to 0.94, respectively, and absolute variability of 9.22% ± 0.08% and 13.73% ± 0.14%, respectively. Stability also was evaluated by comparing the results with the reference value (that is, the 51-minute data acquisition time). Average BP values were 100.2% ± 0.84% at 45 minutes, 102.4% ± 7.5% at 39 minutes, and 107.9% ± 18.1% at 33 minutes.
Test–retest characteristics of dopamine D1 receptor binding with [11C]SCH 23390
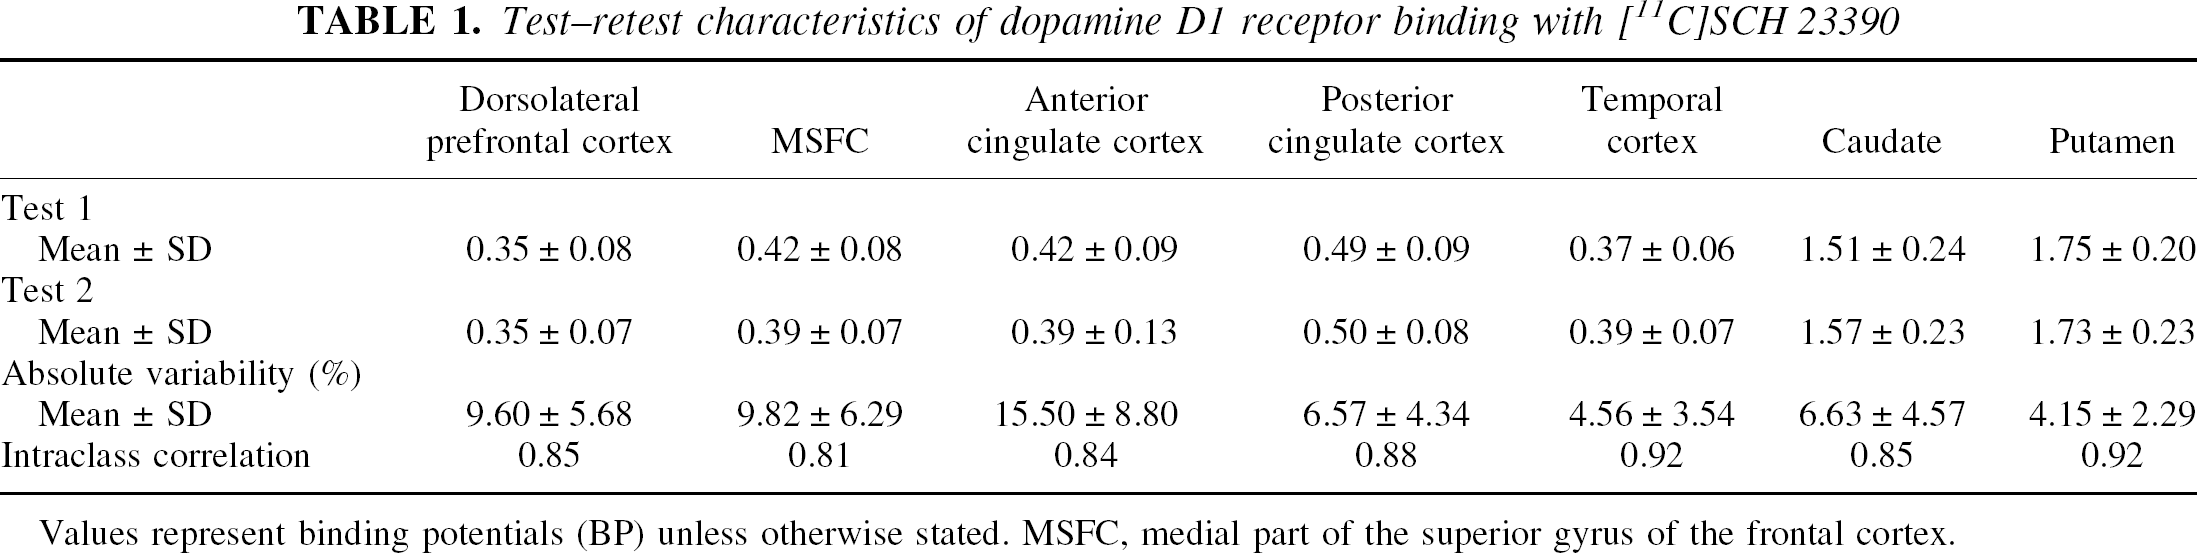
Values represent binding potentials (BP) unless otherwise stated. MSFC, medial part of the superior gyrus of the frontal cortex.
The Logan analysis produced DVR values from 1.33 (DLPFC) to 2.55 (putamen) and ICCs from 0.66 (MSFC) to 0.96 (TC). Binding potential values derived from the Logan analysis (DVR-1) were roughly similar to those derived from the simplified reference tissue model. Variability in cortical areas was only 2.01% ± 0.02% (mean ± SD). Reliability coefficients varied between 0.75 (MSFC) and 0.98 (TC).
DISCUSSION
Distribution and specificity of the [11C]SCH 23390 binding
The distribution of [11C]SCH 23390 binding in the brain corresponded well with postmortem studies of dopamine D1 receptors (De Keyser et al., 1988; Hall et al., 1988, 1994) and is also in line with the binding distribution of another D1 ligand [11C]NNC 112 (Abi-Dargham et al., 2000). The specific signal is likely to have a component of D5 receptor binding because SCH 23390 has almost equal affinity for the D1 and D5 receptor subtypes (Sunahara et al., 1991) and because D5 receptors are expressed in basal ganglia and cortex (Khan et al., 2000). There is currently no available data on the D1 -like receptor subtype selectivity for NNC 112. A serotonin 5-HT2 receptor component of the signal has been implicated based on in vitro affinity (Bischoff et al., 1986; Hall et al., 1988) but is unlikely because the D1 /5HT2 inhibition constant ratio of SCH 23390 is 0.0038 in rodents (Andersen et al., 1992) and because [11C]SCH 23390 binding in vivo in cortical regions cannot be displaced by ketanserin, a 5-HT2 antagonist in mice (Suhara et al., 1992). Roughly similar results have been obtained for [11C]NNC 112 (Halldin et al., 1998) along with a D1 /5-HT2 inhibition constant ratio of 0.01 in rodents (Andersen et al., 1992).
Considerations on reproducibility and stability
The reproducibility of [11C]SCH 23390 binding (DVR as outcome measure) in the striatum has been assessed by Chan et al. (1998) with a PET camera run in two-dimensional mode and with the use of reliability coefficients. For example, in caudate and putamen, DVR values were 2.20 ± 0.17 and 1.88 ± 0.19 (mean ± SD, respectively) obtained by Chan et al. (1998), whereas the authors observed slightly higher values in the current study, 2.34 ± 0.14 and 2.56 ± 0.12 (mean ± SD, respectively). Reproducibility was nearly similar, assessed by reliability coefficient (R) values of 84% and 94% for caudate and putamen compared with 86% and 93%, respectively, by Chan et al. (1998). The use of three-dimensional mode and a high-resolution PET camera increases sensitivity (about 10-fold) and reduces partial volume effects, thus improving the quantification of receptor binding. The current data indicate high ICCs for D1 receptor binding potential measures in caudate and putamen with [11C]SCH 23390. Comparable ICCs have been reported for striatal specific binding of [11C]NNC 112 (Abi-Dargham et al., 2000).
The authors observed high ICC values (0.81–0.92) for BP measurements in all studied cortical areas. Previous preliminary studies have reported a lower cortical/cerebellum ratio (approximately 1.5) for [11C]SCH 23390 (Karlsson et al., 1993) than that observed with [11C]NNC 112 (Foged et al., 1998). [11C]NNC 112 also penetrates into the brain slightly better than [11C]SCH 23390 (4.5% vs. 1.2%). However, these relative advantages of [11C]NNC 112 as opposed to [11C]SCH 23390 do not exclude good reproducibility for [11C]SCH 23390. In fact, the reproducibility measures for [11C]SCH 23390 are equally good or even slightly better than those reported for [11C]NNC 112. In the recent study by Abi-Dargham et al. (2000), the variability values for k3 /k4 analysis with [11C]NNC 112 were 20% ± 25%, 12% ± 11%, and 11% ± 14% for anterior cingulate, dorsolateral prefrontal, and temporal cortices, respectively, whereas the current data with [11C]SCH 23390 indicate respective values of 15.5% ± 8.8%, 9.6% ± 5.7%, and 4.6% ± 3.5% for above mentioned brain areas.
Because of relatively fast kinetics of [11C]SCH 23390 and because relatively short scanning times (40 minutes) have been used in previous studies with [11C]SCH 23390 (Okubo et al., 1997), a scanning time of 51 minutes was chosen for the current study. The current results with shorter data collection times show excellent stability at 45 and 39 minutes and moderate stability at 33 minutes according to stability criteria by Abi-Dargham et al. (2000). This indicates that even a shorter scanning time may be sufficient for [11C]SCH 23390, whereas [11C]NNC 112 has slower kinetics and seems to require a data collection time of 90 minutes for reliable analysis (Abi-Dargham et al., 2000). The advantages of [11C]SCH 23390 resulting from a shorter scanning time and no need for arterial input function are obvious and may offset the slightly lower specific/nonspecific binding ratio compared with [11C]NNC 112. However, simplified methods free of the need of arterial blood sampling have not yet been tested on [11C]NNC 112. SCH 23390 has two major metabolites that do not cross the blood–brain barrier and therefore do not interfere with quantification (Swahn et al., 1994). The use of arterial input data enables more detailed quantification but may also induce an additional source of error. The measurement of unchanged [11C]SCH 23390 in arterial plasma was not attempted in this study, but should be tested in further studies. The results from this study with regard to statistical aspects demonstrated greater between-subject than within-subject variation. Keeping this in mind, intrasubject designs with paired samples analyses would be most suitable for future PET studies with [11C]SCH 23390 and simplified reference tissue model (for a voxel-based approach see (Aston et al., 2000). Therefore, the choice of method (model) for quantification will be critically dependent on the study design.
In conclusion, the reproducibility of D1 receptor binding potential measurements with [11C]SCH 23390 is good to excellent in basal ganglia and also in cortical areas with a high-resolution scanner operated in three-dimensional mode. This assessment of [11C]SCH 23390 is important for at least two reasons. First, the in vivo receptor imaging studies have directly used the in vitro binding principles to characterize ligand–receptor interaction. This assumption clearly represents an oversimplification. SCH 23390 is a standard D1 -like receptor antagonist and is well characterized in in vitro/ex vivo studies, which will provide good basis for comparative studies and a more detailed understanding of the phenomena involved in receptor–ligand interaction in vivo (Laruelle, 2000). Second, recent reports using [11C]SCH 23390 suggest that D1 -like receptors in prefrontal cortex are decreased in schizophrenia and that this decrease may associate with negative symptoms (Okubo et al., 1997). The interpretation of this potentially important result will be dependent on the methodologic validity and reliability. The current results indicate good reproducibility of cortical D1 receptor quantification with [11C]SCH 23390.
Footnotes
Acknowledgments:
The assistance of the staff in the Turku PET laboratory and the MRI unit of Turku University Central Hospital is greatly appreciated.