
Abstract
The oxygen extraction ratio (OER) of a tissue describes the interplay between oxygen delivery and consumption and, as such, directly reflects the viability and activity of any organ. It is shown that OER can be quantified using a single magnetic resonance imaging observable, namely the relaxation time T2 of venous blood draining from the tissue. This principle is applied to study local OER changes in the brain on visual stimulation in humans, unambiguously demonstrating a mismatch between changes in blood flow and oxygen metabolism on activation.
A fundamental requirement for tissue functionality is maintenance of the appropriate balance between oxygen delivery and consumption. This interplay is described by the oxygen extraction ratio (OER), also called the oxygen extraction fraction (OEF):
in which [Hbtot] is the total hemoglobin concentration in the blood in mmol/L and Ya the arterial oxygen saturation fraction. The units of CMRO2 and CBF are μmol g−1 min–1 and mL g–1 min–1, respectively. The ability to image OER noninvasively in situ would allow direct assessment of tissue viability and activity in any organ. For instance, tissue activity is reflected by short-term changes in OER (Fox and Raichle, 1986; Fox et al., 1988), while long-term alterations may indicate pathology, such as ischemic disease or cancer (Powers et al., 1985; Heiss and Podreka, 1993; Leenders, 1994; Furlan et al., 1996; Gröhn et al., 1998). It appears from Eq. 1 that both CMRO2 and CBF need to be measured to determine OER, which has been achieved by positron emission tomography (PET) using radioactive tracers. However, no imaging methods are presently available to determine focal OER directly. We show here that this can be achieved by focusing on the blood oxygenation level-dependent (BOLD) (Thulborn et al., 1982; Ogawa et al., 1990; Wright et al., 1991; Haacke et al., 1997; van Zijl et al., 1998) magnetic resonance imaging (MRI) signal of venous blood draining from the tissue of interest, instead of on the tissue itself. In the Materials and Methods Section it is derived that the MRI relaxation rate T2 of venous blood is directly related to OER. Such localized measurements in the venous lumen can be achieved by using MRI at high spatial resolution, and as a first application of this approach we determine absolute OER in the visual cortex during light deprivation and visual stimulation. This experiment is of great interest with respect to ongoing fundamental discussions concerning physiologic coupling between blood flow and oxygen metabolism during brain activation (Gjedde, 1997). Although the OER seems to reflect directly on this coupling relationship, caution has to be exercised in its interpretation. The reason is that physiologic coupling relates to the necessity of a certain change in CBF to compensate for changes in CMRO2, which need not be equivalent to a quantitative matching of these changes. For instance, even if flow and metabolism are coupled, the percent change in both quantities is not necessarily equivalent because the hemodynamic response may well be over-compensating (Buxton and Frank, 1997). Because these definitions are not equivalent, we use the term “coupling” for the physiologic response and “matching” to indicate the percent change in the two quantities as reflected by Eq. 1. PET measurements have shown a change in OER on brain activation, leading to the suggestion of uncoupling of flow and oxygen metabolism under the condition of matched glucose metabolism (Fox and Raichle, 1986; Fox et al., 1988). Although it is generally assumed that functional MRI (fMRI) using the BOLD effect is only possible because of this mismatching effect (Ogawa et al., 1993), it has previously not been possible to prove this conclusively, because BOLD signal changes in perfused tissue (parenchyma) depend on the combined effects of OER, blood volume, and morphometry of the microvascular compartment (van Zijl et al., 1998). As a consequence, both mismatching and matching can give a positive BOLD effect, depending on the relative relaxation times of the tissue and microvascular blood compartments that comprise the parenchyma (van Zijl et al., 1998). Thus, if T2 of the blood compartment is longer than T2 of tissue, a cerebral blood volume increase will lead to a parenchymal signal increase even if flow and metabolism are coupled. However, as demonstrated in the Materials and Methods, the situation is different inside the veins draining from the activated region, where the relaxation time T2 specifically relates to OER. As reflected by Eqs. 1 through 3, the venous effect is a very sensitive measure of CBF-CMRO2 matching, because OER remains invariant under matched conditions. As a result, no changes in the relaxation time of venous blood would occur up on matching. Thus, our approach can be used to investigate directly the basic mechanism of the BOLD-fMRI changes with respect to oxygen utilization.
MATERIALS AND METHODS
Theory
The crucial step in understanding the possibility to determine OER directly by MRI is to realize that the deoxygenation ratio xdeoxy,v of venous hemoglobin is a linear function of OER:
in which [Hb] is the deoxygenated hemoglobin concentration and Yv, the venous oxygen saturation fraction. Changes in xdeoxy,v are reflected in an altered spin-echo relaxation time T2,blood,v of the venous blood:
in which
and

are, respectively, the relaxation-rate and susceptibility-shift differences between the erythrocytes and plasma for exchanging water in the blood (Fabry and San George, 1983; Brooks and Di Chiro, 1987; van Zijl et al., 1998). The subscripts “plas” and “dia” relate to water in plasma and on diamagnetic sites other than oxygenated hemoglobin; τcpmg is the time between individual echoes in a Carr-Purcell-Meiboom-Gill spin-echo experiment, where echo time (TE) = n • τcpmg. In multi-echo experiments the BOLD effect decreases and to maximize the effect we used multiple single-echo experiments, where TE = τcpmg- Because all constants in the equations have a physical meaning, measurements can be designed to determine them for the purpose of serving as an independent calibration for the human venous blood experiments in the present study. Fortunately, experiments that can be used for this purpose have been reported in the literature and our theory can be applied to those data. For instance, the constants 1/T2,plas, 1/T2,dia + 1/T2,oxy, and 1/T2,deoxy − 1/T2,oxy respectively, can be determined from experiments on oxygenated and deoxygenated blood. This is illustrated in Fig. 1 for 1/T2,plas and 1/T2,dia + 1/T2,oxy, while 1/T2,deoxy − 1/T2,oxy was determined using the average data for fully deoxygenated blood at short τcpmg for high field (4.3 and 4.7 T) (Thulborn et al., 1982; Gillis et al., 1995; Meyer et al., 1995) and low field (1.4 T) (Gomori et al., 1987; Bryant et al., 1990). Assuming negligible change in the diamagnetic parameters between 4.3 T and 4.7 T and 1.4T and 1.5T, the respective 1/T2,plas, 1/T2,dia + 1/T2,oxy, and 1/T2,deoxy − 1/T2,oxy values are 4.6, 9.3, and 42 s–1 at 4.7 T and 2.0, 7.5, and 14 s–1 at 1.5 T (van Zijl et al., 1998). The molecular susceptibilities for hemoglobin were determined by (Fabry and San George, 1983) and, assuming an average random orientation of the erythrocytes with respect to the magnetic field, these can be used to determine ωdia = 0.0304 ppm, ωoxy = −0.0538 ppm, and ωdeoxy = −0.2708 ppm, in which 1 ppm = 2π·63.8 rad/s at 1.5 T. The exchange lifetime between erythrocytes and plasma is τ = (1 − Hct)τery, in which τery = 12 ± 2 milliseconds is for humans (Herbst and Goldstein, 1989). The relationship between the hematocrit fraction and total hemoglobin concentration is Hct = 3.0 • [Hbtot] • 0.016125, in which 0.016125 is the micro-molar mass of one hemoglobin unit. Notice that the venous hematocrit is larger than in the microvessels, where a additional multiplication factor of 0.85 should be used. As no data are available on Hct in the cortical draining veins, it is assumed that this Hct is the same as measured in arterial sampling. Because [Hbtot] and Ya at normoxia are well known, xdeoxy,i is the only unknown in Eqs. 3 through 5 and can be determined from the measured venous T2 values. Subsequently, OER is determined using Eq. 2. This simplified situation is in contrast to BOLD-fMRI studies in parenchyma, which should account for the influence of tissue morphometry, CMRO2, CBF, blood volume, and the oxygen dissociation curve (van Zijl et al., 1998). Finally, it should be realized that the BOLD effect depends on the paramagnetic effect of deoxyhemoglobin on water relaxation, and that small changes in dissolved oxygen will not significantly influence this effect.
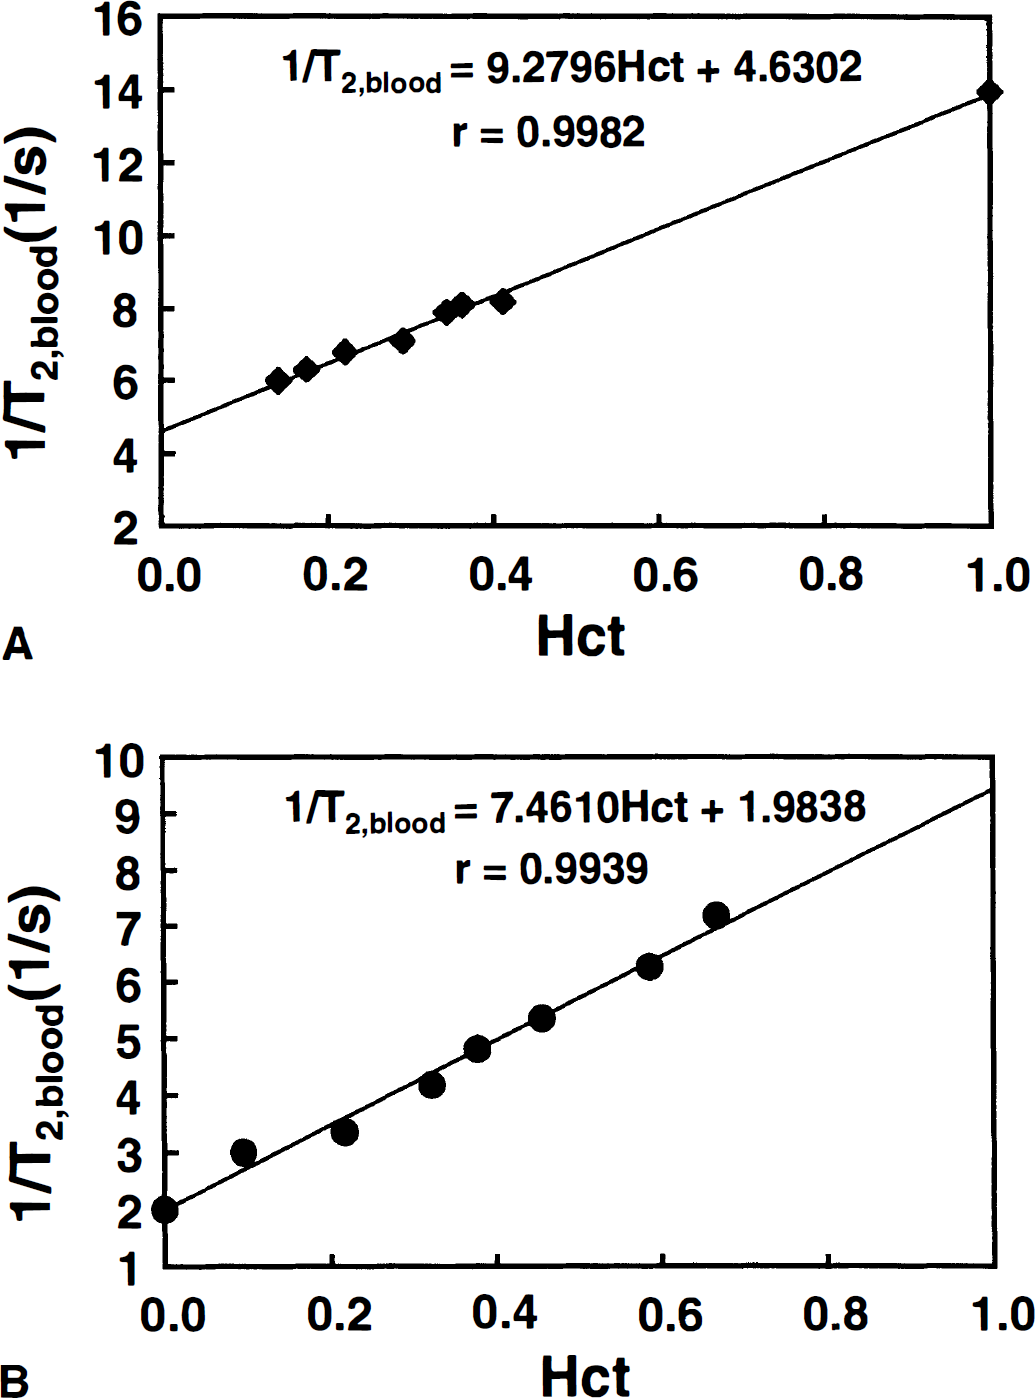
Determination of 1/T2,plas and 1/T2,dia + 1/T2,oxy from the hematocrit dependence of the relaxation rate of oxygenated blood (xdeoxy,v = 0) at short τcpmg (negligible exchange term) using data of (Thulborn et al., 1982) at 4.3 T
Visual activation
After obtaining informed consent, volunteers (n = 7) were asked to wear SV10 light emitting diode (LED) goggles (Grass, Inc. Quincy, MA, U.S.A.), which were flashed at a rate of 8 Hz. The protocol consisted of 4 periods (off-on-off-on) of 5 images each, of which the first image in each period was discarded to establish physiologic and magnetic equilibrium. Each period was 80 seconds long. Swallowing was also allowed during the first image of each period, which substantially reduced random motion artifacts in the other images. To restrain bulk motion, a comfortable well-fitting head holder was used, the head was taped to the holder, and the subject's torso was secured. Subjects were wearing earplugs to reduce noise exposure. Finally, time-dependent effects caused by dynamic changes in oxygen metabolism and flow are avoided by focussing on absolute T2 measurements during prolonged activation, at which a constant BOLD effect and thus physiologic equilibrium is known to exist.
Magnetic resonance imaging experiments and data processing
Experiments were performed on a 1.5T GE Signa scanner (General Electric, Milwaukee, WI, U.S.A.) equipped with 2.2 G/cm gradients. Whole body coil transmission and surface-coil (3 inch) detection were used. After acquiring sagittal localizer images (spin echo, repetition time [TR] = 500 milliseconds, echo time = 14 milliseconds, field of view [FOV] = 24 cm, 3 mm slice, 256 × 128 data matrix, zero filled to 256 × 256), an axial-oblique orientation was chosen parallel to the calcarine fissure, which is known to contain the primary visual area. Data were acquired using a segmented spin-echo echo-planar imaging sequence consisting of 16 segments, (TR = 1 second, FOV = 24 cm, 3 mm slice, flow compensated, 256 × 128 data matrix, zero filled to 256 × 256). The total study time was 22 minutes.
Data were processed on a Silicon Graphics Indigo workstation using programs written in IDL (Interactive Data Language; Research Systems, Inc., Boulder, CO, U.S.A.). To reduce motion artifacts, all acquired images were aligned using the automated image registration program (Woods et al., 1992). To judge the alignment efficacy, three independent approaches were used: (1) visual inspection, (2) calculation of difference images before and after alignment for all on and off images, and (3) center-of-mass calculation for the read and phase directions of all images before and after alignment. After image alignment, T2 maps were calculated and visual activation was analyzed by cross-correlating the absolute T2 changes to a boxcar waveform corresponding to the stimulation pattern (off-on-off-on; 4 images per condition). Activation maps were created by overlaying the activated pixels onto a TE = 140 millisecond image. Voxels were analyzed at a cross-correlation threshold (r) of 0.5 and activation maps were processed with a contiguity filter, retaining only activated pixels for which at least 3 of 8 neighbors had also passed the threshold. Using Bandettini's criteria (Bandettini et al., 1993), this procedure corresponds to P < 0.0001. However, it is clear from the data in Fig. 2a that, to properly quantify venous T2 and tissue OER, it is necessary to find a set of criteria on the basis of which only the veins are evaluated. Fortunately, at the field strength of 1.5 T, there have been several detailed reports of tissue and venous T2 values. Studies by Whittall et al. (1997) show parenchymal T2s for gray matter to be in the range between 83 and 87 milliseconds, while studies by Wright et al. (1991) indicate that venous T2s to be longer than 130 milliseconds in the vena cava. Obviously, the latter would go down at lower oxygenation and we therefore chose T2 > 90 ms as a first criterion for voxel selection. This approach, however, still included some voxels not localized in the veins. When hand-picking the venous structures in some of the volunteers at r = 0.5, we found that δT2 was always larger than 10%. When using this magnitude restriction as an additional criterion, we found consistent venous localization for the remaining activated voxels in all volunteers.
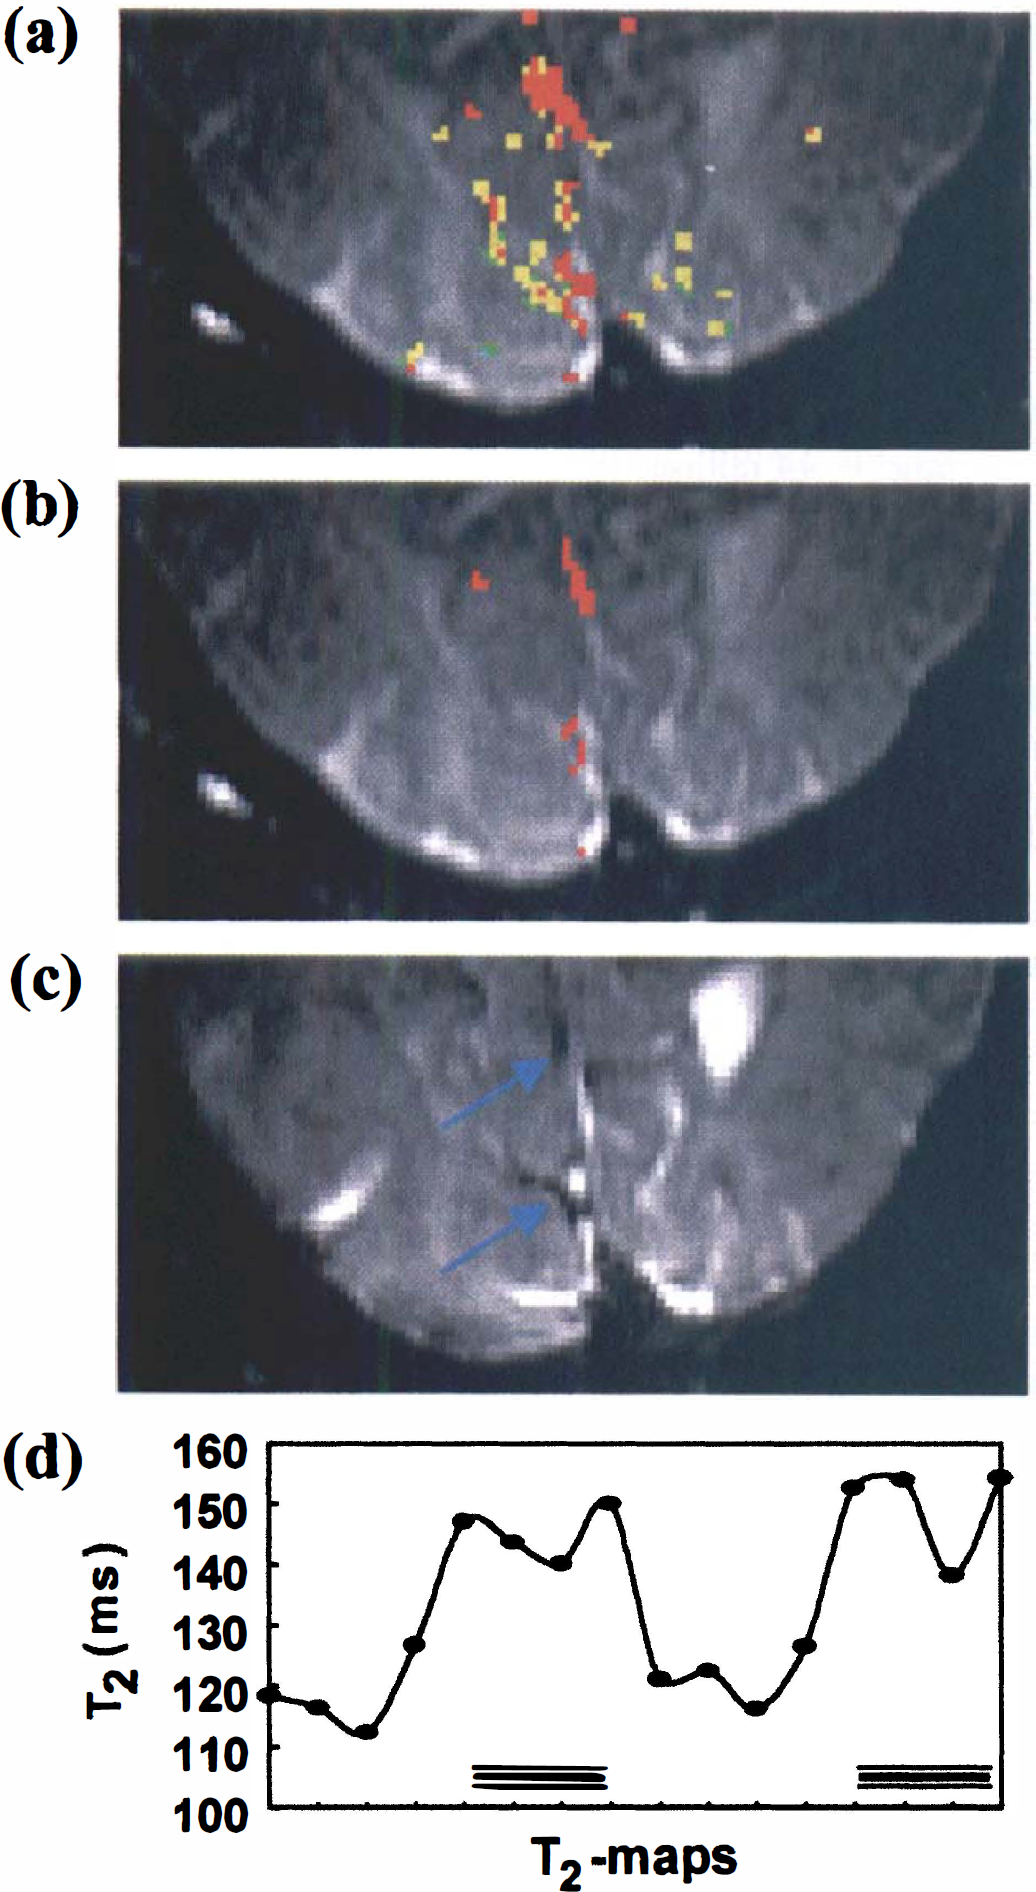
(a) Absolute-T2 visual activation data for one of the volunteers using a cross-correlation threshold r = 0.5. Only voxels neighboring at least three other activated voxels are displayed (P < 0.0001).
Absolute T2 was determined by voxel fitting the logarithm of the signal intensity data linearly versus TE using data obtained at TE = 50, 80, 110, and 140 milliseconds. Because T2 of venous blood is echo-time dependent (Eq. 4), OER was determined by calculating an apparent T2 and minimizing the difference with the measured T2. Special care needs to be taken to assure symmetric positioning of the multiple echoes in the EPI acquisition around the TE value. To accomplish this and to also avoid large differences in actual TE value between the individual readout gradients, we used segmented EPI. To test whether a 16-segment spin-echo echo-planar imaging measures the same T2s as a conventional spin echo we performed a reference study on a CuSO4-doped water phantom. We found T2 = 93.4 ± 1.6 milliseconds (629 pixels) and 93.7 ± 1.5 milliseconds (562 pixels) using EPI (3 inch surface coil, TE = 50, 80, 110, 140 milliseconds and TR = 2 seconds, 256 × 128, flow compensated) and standard spin-echo (headcoil, TE = 25, 50, 75, 100 milliseconds, TR = 3 seconds, 256 × 128, flow compensated), respectively. These T2s are equal within experimental error.
A final technical aspect that has to be addressed is the influence of flow effects on the measured changes. Inflow of fresh blood in the imaging slice can cause major signal increases on functional activation. In addition, rapid flow may reduce the T2 effect on activation because of a proportionally larger reduction in signal at long echo times. These effects are strongly dependent on experimental parameters such as the TR between subsequent data acquisitions and the range of TE values used, respectively. Absolute T2 experiments are expected to be less susceptible to TR effects because the determined T2 does not depend on the initial signal magnitude. To confirm this, we measured T2 at two different repetition times in one volunteer (TR of 1 and 2 s) and found comparable results on visual stimulation (δT2 of 19.9 and 20.2 milliseconds, respectively), indicating insignificant effects of inflow.
RESULTS
Absolute T2 during rest (nonactivated, eyes closed) and visual activation was examined in seven subjects using MRI with 5.3 μL volume elements (voxels). Figure 2A shows the activation maps for one of the volunteers. The results clearly indicate large spin-echo BOLD effects at this spatial resolution, which is much higher than that used in most fMRI studies, where the voxel size is approximately 70 μL. Figure 2B shows the set of activated voxels that remains after selecting only the veins through the procedure outlined in Materials and Methods. The correctness of this approach is confirmed by the image in Fig. 2C, which clearly accentuates the location of small veins adjacent to the primary visual areas. The measured relaxation times and corresponding oxygen extraction ratios and venous oxygenation fractions for all volunteers are listed in Table 1. The data show consistent increases in T2 during activation for all subjects (two-tailed paired Student's t-test: P < 0.01), clearly proving the existence of a mismatch between changes in flow and oxygen metabolism on visual activation. The nonactivated OER results are in reasonable agreement with CBF and CMRO2 data from PET studies by Leenders et al. (1990), which give an average focal OER of 0.42 ± 0.03 for five cortical structures, over a range of 0.27 to 0.50. In addition, studies on healthy volunteers by Marchal et al. (1992) show an OER range from 0.35 to 0.56, with an average of 0.45. Fox and Raichle (Fox et al., 1988) reported a decrease in OER of 31.2% on visual stimulation, comparing well with our reduction of 33.3%. They did not report a baseline CBF or Hct, but using their resting CMRO2 of 1.50 μmol g–1 min−1, a [Hbtot] of 8.41 mmol/L (corresponds to Hct = 0.41), and a typical resting CBF of 0.5 mL g–1 min–1, the absolute OER = 0.36 is also close to the one measured here. In agreement with this, Cohen et al. (1967) also reported an OER of 0.36. Haacke and coworkers (1997) recently determined venous oxygenation (Yv) using MRI phase imaging and found a value of 0.55 when assuming perpendicular orientation of the vessel with respect to the magnetic field. Contrary to this approach, the new technique demonstrated here is independent of vessel orientation, but assumes a random orientation of erythrocytes in the veins.
Measured venous T2, OER, and Yv for resting and activated brain
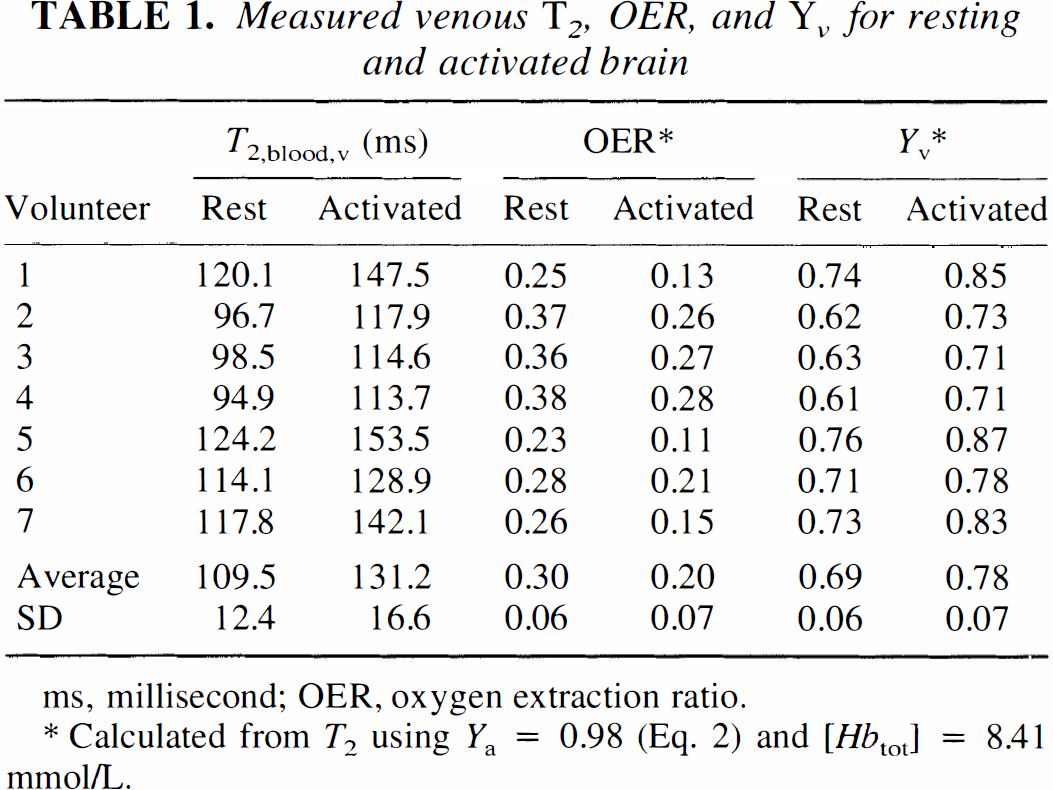
ms, millisecond; OER, oxygen extraction ratio.
Calculated from T2 using Ya = 0.98 (Eq. 2) and [Hbtot] = 8.41 mmol/L.
DISCUSSION
The results of these visual activation studies are of importance with respect to several issues. First, the data under nonactivated conditions provide quantitative validation of the new approach in that OER values found are close to the range reported in the literature for PET, which is the present gold standard. Second, the activation results provide independent and quantitative validation of a mismatch between oxygen metabolism and delivery in terms of an absolute OER. The new method also has several advantages over conventional approaches. For instance, contrary to the use of radioactive tracers or exogenous MRI contrast agents, this new approach does not require knowledge of an arterial input function because it exploits the nature of hemoglobin as an endogenous intravascular contrast agent for fMRI. Furthermore, contrary to parenchymal BOLD approaches, the new method uses only venous data and the results are therefore independent of the shape of the oxygen dissociation curve. Finally, as opposed to the more common T*2 fMRI measurements, the equations for T2 contain constants with a clear physical meaning that can be measured independently from separate experiments on blood and hemoglobin and do not need statistical modeling for verification. As a result, the absolute values of OER can be quantified directly from a single observable, the absolute relaxation rate T2, whereas T*2 MRI approaches (Kim and Ugurbil, 1997; Davis et al., 1998) presently only allow the study of relative changes. These two relaxation times are related via:

in which Tm,μ2 accounts for macroscopic and microscopic magnetic field variations such as those caused by heterogeneity in the static field of the scanner and local susceptibility variations at tissue interfaces. As a result, T2 experiments are more reproducible, but have still not been used much in fMRI because the effects are generally about a factor of three smaller (Bandettini et al., 1994) than for T*2 when using the typical large voxel size for fMRI studies. However, recent high-resolution T2 data (Oja et al., 1999) show that the venous effects are an order of magnitude greater than the tissue effects and therefore sufficiently large for T2 to be used for quantification.
Because of these resolution effects on T2 and in view of high-resolution T*2 data (Frahm et al., 1993; Haacke et al., 1994; Gati et al., 1997) showing a similar resolution dependence, it is very important to discuss the influence of partial volume effects on the present measurements as well as on standard T*2 fMRI measurements. Such partial volume effects between parenchyma and venous blood depend on the actual relaxation times of these two components and on their relative volume fractions in an MRI voxel. We have measured the venous T2 values (Table 1), and the parenchymal relaxation times can be estimated by using our average OER from Table 1, the PET values for cerebral blood volume (Leenders et al., 1990), and the MRI tissue relaxation rates measured in the nonactivated gray matter voxels (Whittall et al., 1997; van Zijl et al., 1998). At the echo times typically used for fMRI at fields of 1.5 T and 4.7 T, this results in a large venous signal contribution (Table 2). When one is concerned with quantification of relaxation times and physiologic parameters, it is therefore crucial to realize that the influence of small partial volume effects in BOLD-MRI is actually much smaller for venous OER determinations than for parenchymal OER measurements. For instance, using the parenchymal and venous T2 values at 1.5 T, it can be calculated that a 10% venous contamination of parenchyma will produce a change upon activation of 4.4%, versus 2.2% without contamination. On the other hand, a 10% parenchymal contamination of a venous voxel will lead to a 18.4% change in instead of 19.8% for a pure vein. As a consequence, the resulting OER will be correct within 7% when looking at the veins, while the physiologic determinations based on mainly parenchyma in large voxels will be off by more than 100%. Experimental accuracies of the order of 7% for quantitation are well acceptable. The fortunate reasons that such accuracy can be attained are that the vessel effects are much larger than the effects in parenchyma and that the T2 of venous blood is longer than that of parenchyma at 1.5T, allowing the voxel selection criteria chosen here. At higher fields, the venous determination of OER should be possible by using shorter echo times and adjusted criteria (a certain maximum T2 instead of a minimum). Therefore, our equations are an advance over previous BOLD fMRI estimates of OER changes using T*2 (Kim and Ugurbil 1997; Davis et al., 1998), which were on large voxels containing mainly parenchyma. In addition to being very susceptible to partial voluming with the veins, such methods have mainly focused on relative changes in OER because quantification of absolute changes in OER would be possible only when accounting for parenchymal morphometry and assumptions regarding the relationship between blood flow and blood volume. The most demanding aspects of our venous method are the need for careful voxel choice, high signal-to-noise ratio and careful checking of the presence of flow artifacts (see Materials and Methods). In addition, the assumption is made that venous drainage fields can be associated with activation effects occurring in parenchyma. Based on the resulting OER values we feel that this assumption is not unreasonable, especially when compared to other fMRI methodologies and PET where the effects occurring in these same drainage fields are generally included in the total activation effects measured in large voxels.
Parenchymal and venous T2 (ms) in visual cortex at two field strengths
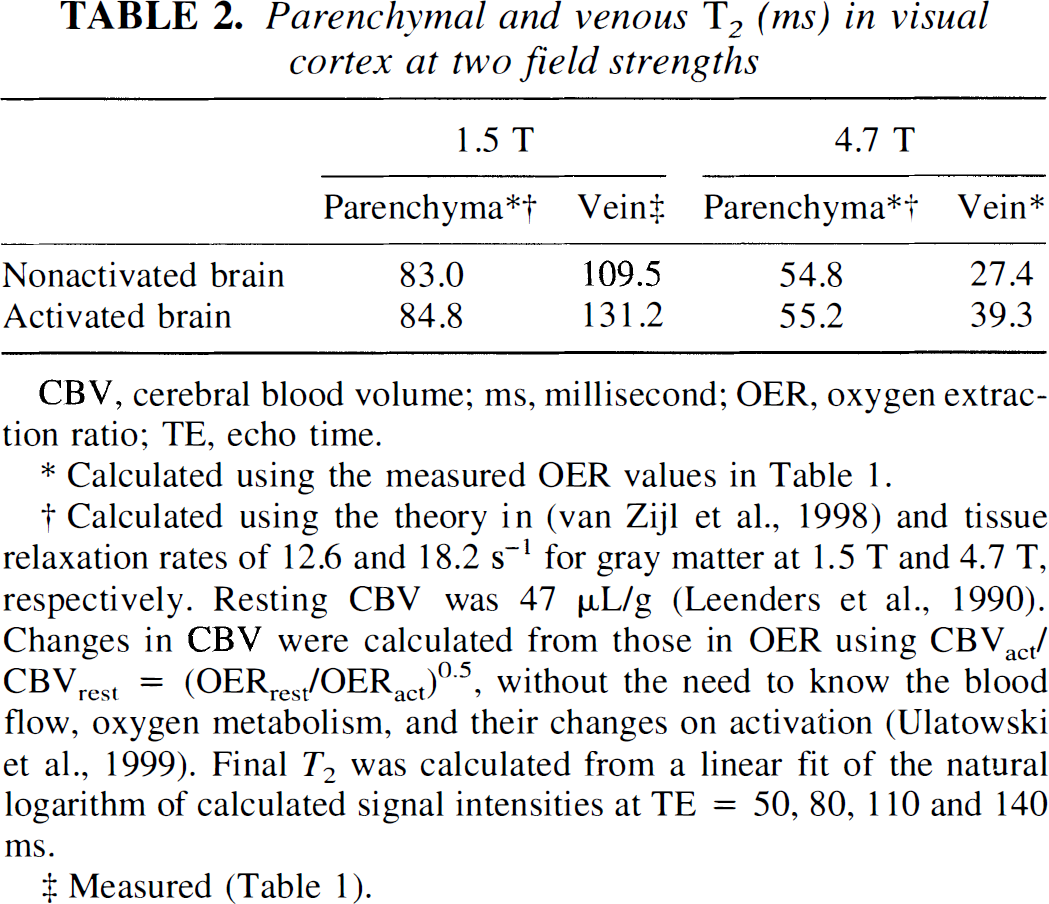
CBV, cerebral blood volume; ms, millisecond; OER, oxygen extraction ratio; TE, echo time.
Calculated using the measured OER values in Table 1.
Calculated using the theory in (van Zijl et al., 1998) and tissue relaxation rates of 12.6 and 18.2 s–1 for gray matter at 1.5 T and 4.7 T, respectively. Resting CBV was 47 μL/g (Leenders et al., 1990). Changes in CBV were calculated from those in OER using CBVact/ CBVrest = (OERrest/OERact)0.5, without the need to know the blood flow, oxygen metabolism, and their changes on activation (Ulatowski et al., 1999). Final T2 was calculated from a linear fit of the natural logarithm of calculated signal intensities at TE = 50, 80, 110 and 140 ms.
Measured (Table 1).
CONCLUSION
We have derived equations relating OER to the venous T2, which have general validity for all tissues. This noninvasive approach is therefore expected to be of use not only for the study of brain function but also for OER quantification in ischemic disease, cancer, and aging. In this respect, it is of interest to point out that the advantage of readily available equipment and the fact that no input function is required for our approach should be of great benefit for stroke studies, where the treatment window is presently restricted to be within about 3 hours and where changes in flow complicate the determination of arterial input functions. Finally, although this is counterintuitive, partial volume effects between tissue and veins should be a major concern in any attempt to quantify physiologic parameters when using low-spatial resolution, which is the common approach in fMRI. Such effects are much less when using the approach of venous determinations at high resolution outlined here.