
Abstract
Characterizing the effect of limited oxygen availability on brain metabolism during brain activation is an essential step towards a better understanding of brain homeostasis and has obvious clinical implications. However, how the cerebral oxygen extraction fraction (OEF) depends on oxygen availability during brain activation remains unclear, which is mostly attributable to the scarcity and safety of measurement techniques. Recently, a magnetic resonance imaging (MRI) method that enables noninvasive and dynamic measurement of the OEF has been developed and confirmed to be applicable to functional MRI studies. Using this novel method, the present study investigated the motor-evoked OEF response in both normoxia (21% O2) and hypoxia (12% O2). Our results showed that OEF activation decreased in the brain areas involved in motor task execution. Decreases in the motor-evoked OEF response were greater under hypoxia (−21.7% ± 5.5%) than under normoxia (−11.8% ± 3.7%) and showed a substantial decrease as a function of arterial oxygen saturation. These findings suggest a different relationship between oxygen delivery and consumption during hypoxia compared to normoxia. This methodology may provide a new perspective on the effects of mild hypoxia on brain function.
Keywords
Introduction
The cerebral oxygen extraction fraction (OEF) reflects the balance between oxygen delivery and tissue oxygen consumption and represents the proportion of oxygen extracted by the tissue as blood passes through the capillaries. 1 Importantly, precisely evaluating the OEF is indispensable for furthering the neurophysiological interpretation of blood oxygen level-dependent (BOLD) signals.
In concrete terms, the OEF can reflect underlying changes in cerebral oxygen metabolism. Taking the decrease in cerebral blood flow (CBF) caused by carotid or middle cerebral artery occlusion as an example, the OEF will correspondingly increase to maintain tissue oxygen metabolism or the cerebral metabolic rate of oxygen (CMRO2), and normal neuronal function cannot be preserved as the OEF reaches the maximum.2–5 Prior literature suggests that the OEF is decreased to preserve tissue oxygen partial pressure during neural activation, which helps clarify a physiological phenomenon in which the CBF increases considerably more than the CMRO2.6,7 Thus, the OEF represents a balance between the CMRO2 and CBF. A reduction in the OEF has been firmly established to result in locally decreased deoxyhemoglobin concentrations, which enables BOLD functional magnetic resonance imaging (fMRI) to reveal brain activity.8,9 Furthermore, the BOLD contrast mechanisms also depend on cerebral blood volume (CBV). The relative focal changes in the OEF during activation contribute to the BOLD effect, and changes in the baseline OEF will influence the size of the BOLD effect.10–12 Therefore, characterizing the OEF is essential for understanding the physiological mechanisms of brain activity and has important clinical implications.
Previous studies have reported that the relationship between oxygen delivery and oxygen metabolism is influenced by different oxygenation states. Here, this study set out to address this issue with a focus on characterizing the OEF in hypoxia, which remains largely unclear. The human brain is the most hypoxia-sensitive organ in the body because oxidative metabolism is the primary source of energy required for brain activity. 13 The most prominent physiological response to hypoxia is a global increase in CBF,14–16 whereas stimulation-induced regional CBF responses are not affected by hypoxia during increased neuronal activity.14,17–20 The amplitude of stimulus-induced BOLD responses decreases significantly during mild hypoxia compared with normoxia,17,20–23 while vascular responses to brain activation do not change during hypoxia.17,19–21,24 Based on an extended calibrated BOLD method, recent research has demonstrated that hypoxia with 12% O2 significantly decreased the amplitude of CMRO2 responses, 21 indicating that the oxygen metabolism response may change when the brain is exposed to transient hypoxia. Taken together, we hypothesize that OEF responses to neural stimulation will change in hypoxia relative to normoxia according to Fick’s principle. 25
However, existing OEF techniques using blood-T2-based15,26 or susceptometry-based 27 MRI cannot show potential regional heterogeneity during hypoxia, and only the global OEF can be obtained. This dilemma is largely due to the limited rapidity and availability of suitable techniques for OEF measurement. On the basis of the relationship between MR signals and tissue oxygenation in the presence of blood vessel networks, 28 we have developed an MR-based method, the multiecho asymmetric spin echo (MASE), for dynamic measurement of the OEF29 during fMRI studies. The MASE boasts high spatiotemporal resolution for OEF measurements and has been demonstrated to be feasible in functional localization 29 and brain network 30 studies. Using this novel method, the present study endeavored to characterize OEF changes as participants performed motor tasks under both hypoxia (12% O2) and normoxia (21% O2). The results were compared between different gas conditions and correlated with blood oxygen saturation levels in the same subjects.
Materials and methods
Participants
Twenty-one subjects (13 males; average age (mean ± SD) = 24.33 ± 2.99 years) without a history of neurological and respiratory abnormalities were recruited. Accordant to the Helsinki Declaration of 1975 (and as revised in 1983), the study was approved by the Institutional Review Board of Peking University. Written informed consent was obtained from each subject. Scanning was performed in the Center for MRI Research at Peking University on a GE Discovery MR750 3T MR whole body scanner with an eight-channel head coil receiver system (GE Healthcare, Milwaukee, Wisconsin, USA).
Experimental design
All subjects were instructed to perform a motor task in two different oxygen states, namely hypoxia (12% oxygen balanced with nitrogen) and normoxia (21% oxygen balanced with nitrogen). Gases were supplied at a flow rate of 15 L/min through a non-rebreathing face mask, and arterial oxygen saturation (SaO2) was monitored from the left index finger with a digital pulse oximeter (Model 7500FO, Nonin, Plymouth, USA) during scanning. The scanning order of normoxia and hypoxia was constant (normoxia followed by hypoxia). Approximately 5∼7 minutes of adaptation to each gas was required before a stable SaO2 was achieved.20,21
The motor task was conducted using a block-design paradigm wherein a 12-second dummy scan preceded five blocks (each lasted 60 seconds) alternating between task and resting states, and the whole scan took 312 seconds in total. For the motor task, the subjects performed grasp-release right-hand movements at a picture-guided frequency of 1 Hz. During the resting state, the subjects were instructed to focus on a fixation point on a black screen.
MRI scanning protocol
Before fMRI data collection, high-order shimming (five 2nd-order shim terms: XY, ZX, ZY, Z2, and X2–Y2) provided by the scanner vendor was used to reduce magnetic field inhomogeneity. The motor cortex was covered by sixteen interleaved transverse 6-mm slices. The OEF-fMRI images were acquired with a MASE pulse sequence 29 (field of view: 260 mm × 260 mm; matrix size: 64 × 64; repetition time (TR): 3 s; six different echo times (TEs): 65, 100, 135, 147.4, 159.8 and 172.2 ms; sensitivity-encoding factor: 2). Anatomical images were acquired using a 3D FSPGR sequence (TR/TE/θ = 6.6 ms/2.9 ms/12°, 192 sagittal slices, and voxel size = 1 × 1 × 1 mm3).
Data preprocessing and analysis
Data preprocessing was conducted with SPM12 software and further analyses based on the preprocessed data employed codes written in MATLAB (MathWorks, Inc., Natick, MA, USA). For each subject, the data acquired in the first 12 seconds (24 volumes) were discarded to ensure that the signal had reached a steady state. Motion correction parameters were estimated for each time point by aligning the first echo images to the corresponding first time point image. Then, the motion correction parameters were applied to the subsequent echoes. Motion-corrected OEF-fMRI images were coregistered to the anatomical image and normalized to the Montreal Neurological Institute (MNI) standard brain space. The normalized images were smoothed using a Gaussian kernel with full-width at half-maximum of 8 mm.
For each time point, the six echo data were analyzed by following procedures: (1) one pair of gradient echo images acquired symmetrically about the spin echo were used to estimate the effect of R2 according to a mono-exponential decay model; (2) R2* and the signal intensity of the spin echo (S(TESE)) were computed using linear least-squares curve-fitting with the last four gradient echo images; (3) both R2* and R2 were used to calculate R2′ (R2′ = R2*–R2); (4) combined with the actual acquired spin echo signal (S0(TESE)) from the second echo train, the venous blood volume fraction (fCBV) was obtained by the difference between the logarithm of S(TESE) and S0(TESE); and (5) based on the Yablonskiy and Haacke model,
28
the relationship between R2′ and the fraction of oxygenated blood

The


The OEF can be obtained by substituting equations (2) and (3) into equation (1). The BOLD response to the motor task during normoxia and hypoxia was investigated using the first echo (T2*-weighted signal) of the MASE pulse sequence.
Statistical analysis
For each gas condition, the OEF data were modeled voxel-wise using a general linear model in SPM12. This model was generated by a convolution of the stimulus pattern with a standard canonical hemodynamic response function. Z-score maps were calculated using the fMRI time series for each voxel with a voxel-level threshold of P < 0.001 and cluster-level family-wise error (FWE) correction of P < 0.05.
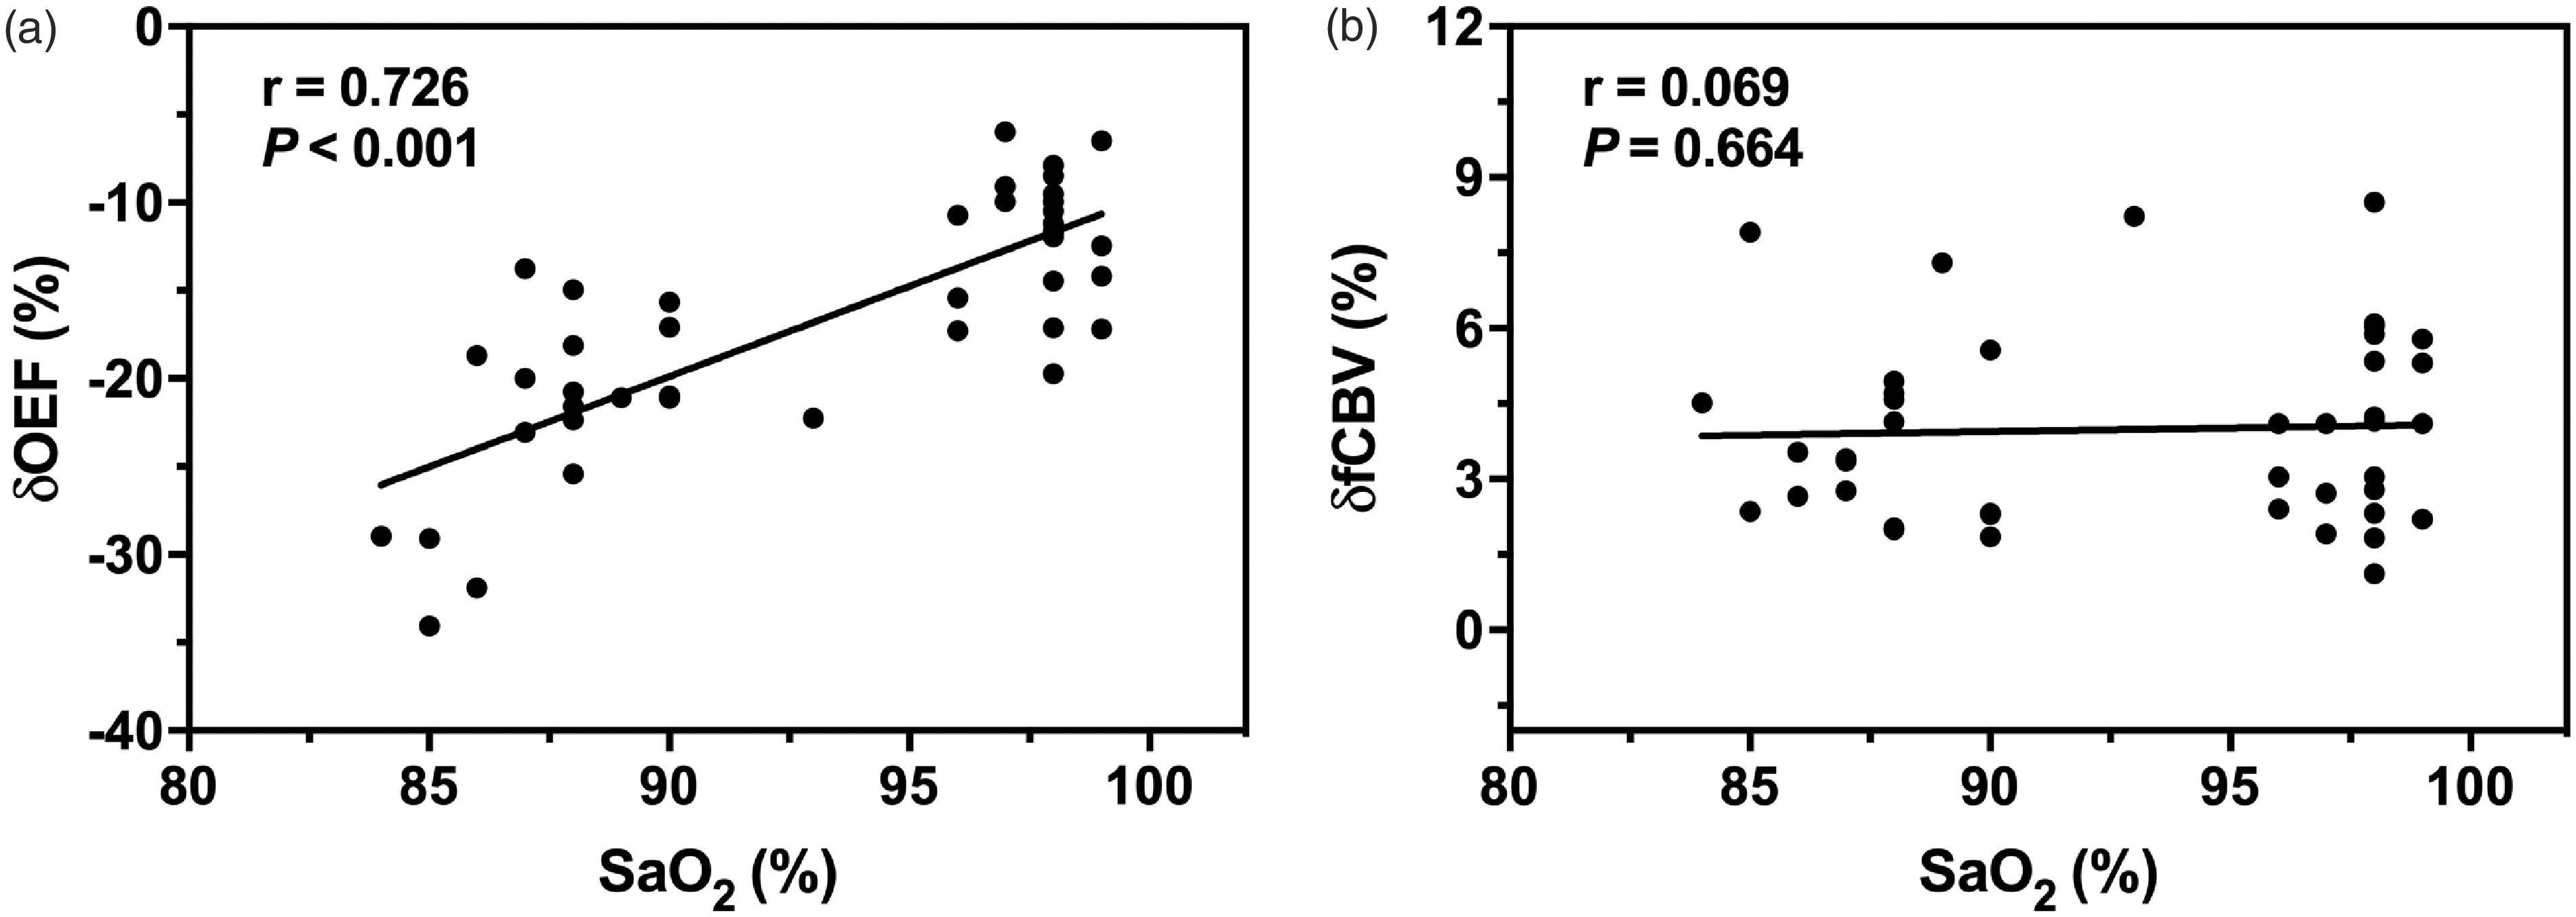
The region of interest (ROI) in the primary motor cortex was defined as the overlapping and threshold voxels of the OEF under both normoxia and hypoxia conditions. For each gas condition, the relative changes in the OEF (δOEF), fCBV (δfCBV) and BOLD (δBOLD) were evaluated in the same manner. Here, δOEF is used as an example for calculation. First, the time course of the OEF in all voxels of the ROI was extracted and averaged. Second, we calculated the mean resting-state data as the baseline value of the OEF (OEFbase), and the first five time points of each resting-state period were excluded considering the transition time of hemodynamic responses.35–37 Specifically, δOEF was calculated as follows:
The activation value of the OEF (OEFactive) was calculated by averaging the task-state data in the same manner as the OEFbase. The mδOEF, the mean magnitude of the δOEF, was computed by averaging the values of δOEF during the task state.
Normality of distribution of the variables was confirmed using a Skewness-Kurtosis normality test. Spearman’s rank correlation analysis was applied to assess significant correlations between the SaO2 and fMRI results (including voxel counts, δOEF, δfCBV). The relationship between the change in SaO2 and the change in OEF values (including OEFbase and OEFactive) was evaluated by Pearson correlation analysis. Paired t-tests were performed for the group comparisons between the normoxia and hypoxia conditions. For all statistical analyses, a two-tailed alpha level of 0.05 was used as the cutoff for significance. Data sets are presented as the mean ± standard deviation.
Results
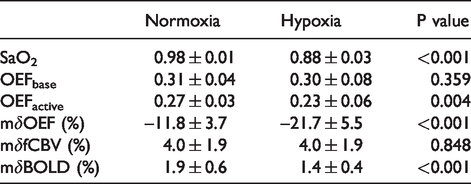
Oxygen saturation significantly decreased by 12% from 97.86% ± 0.85% to 87.24% ± 2.74% (
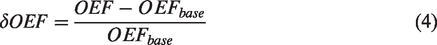
(a) OEF activation maps of three typical subjects during a 1-Hz right-hand grasp-release task for each gas condition. The activation region (in color) was generated using a voxel-level threshold of P < 0.001 and cluster-level FWE correction of P < 0.05 superimposed onto the standard template. (b) OEF-activated voxel counts as a function of SaO2. The normalized voxel count values in mild hypoxia are individually normalized to the voxel count in normoxia. Due to overlap, only four data points are presented for normoxia. All subjects (n = 21) were included in the statistical analyses, and a significant correlation (r = 0.617, P < 0.001) in OEF active voxel counts was detected with a changing level of SaO2.
As shown in Figure 2(a), the motor-induced OEF signal amplitude change was larger under mild hypoxia (−21.7% ± 5.5%) than under normoxia (−11.8% ± 3.7%) (
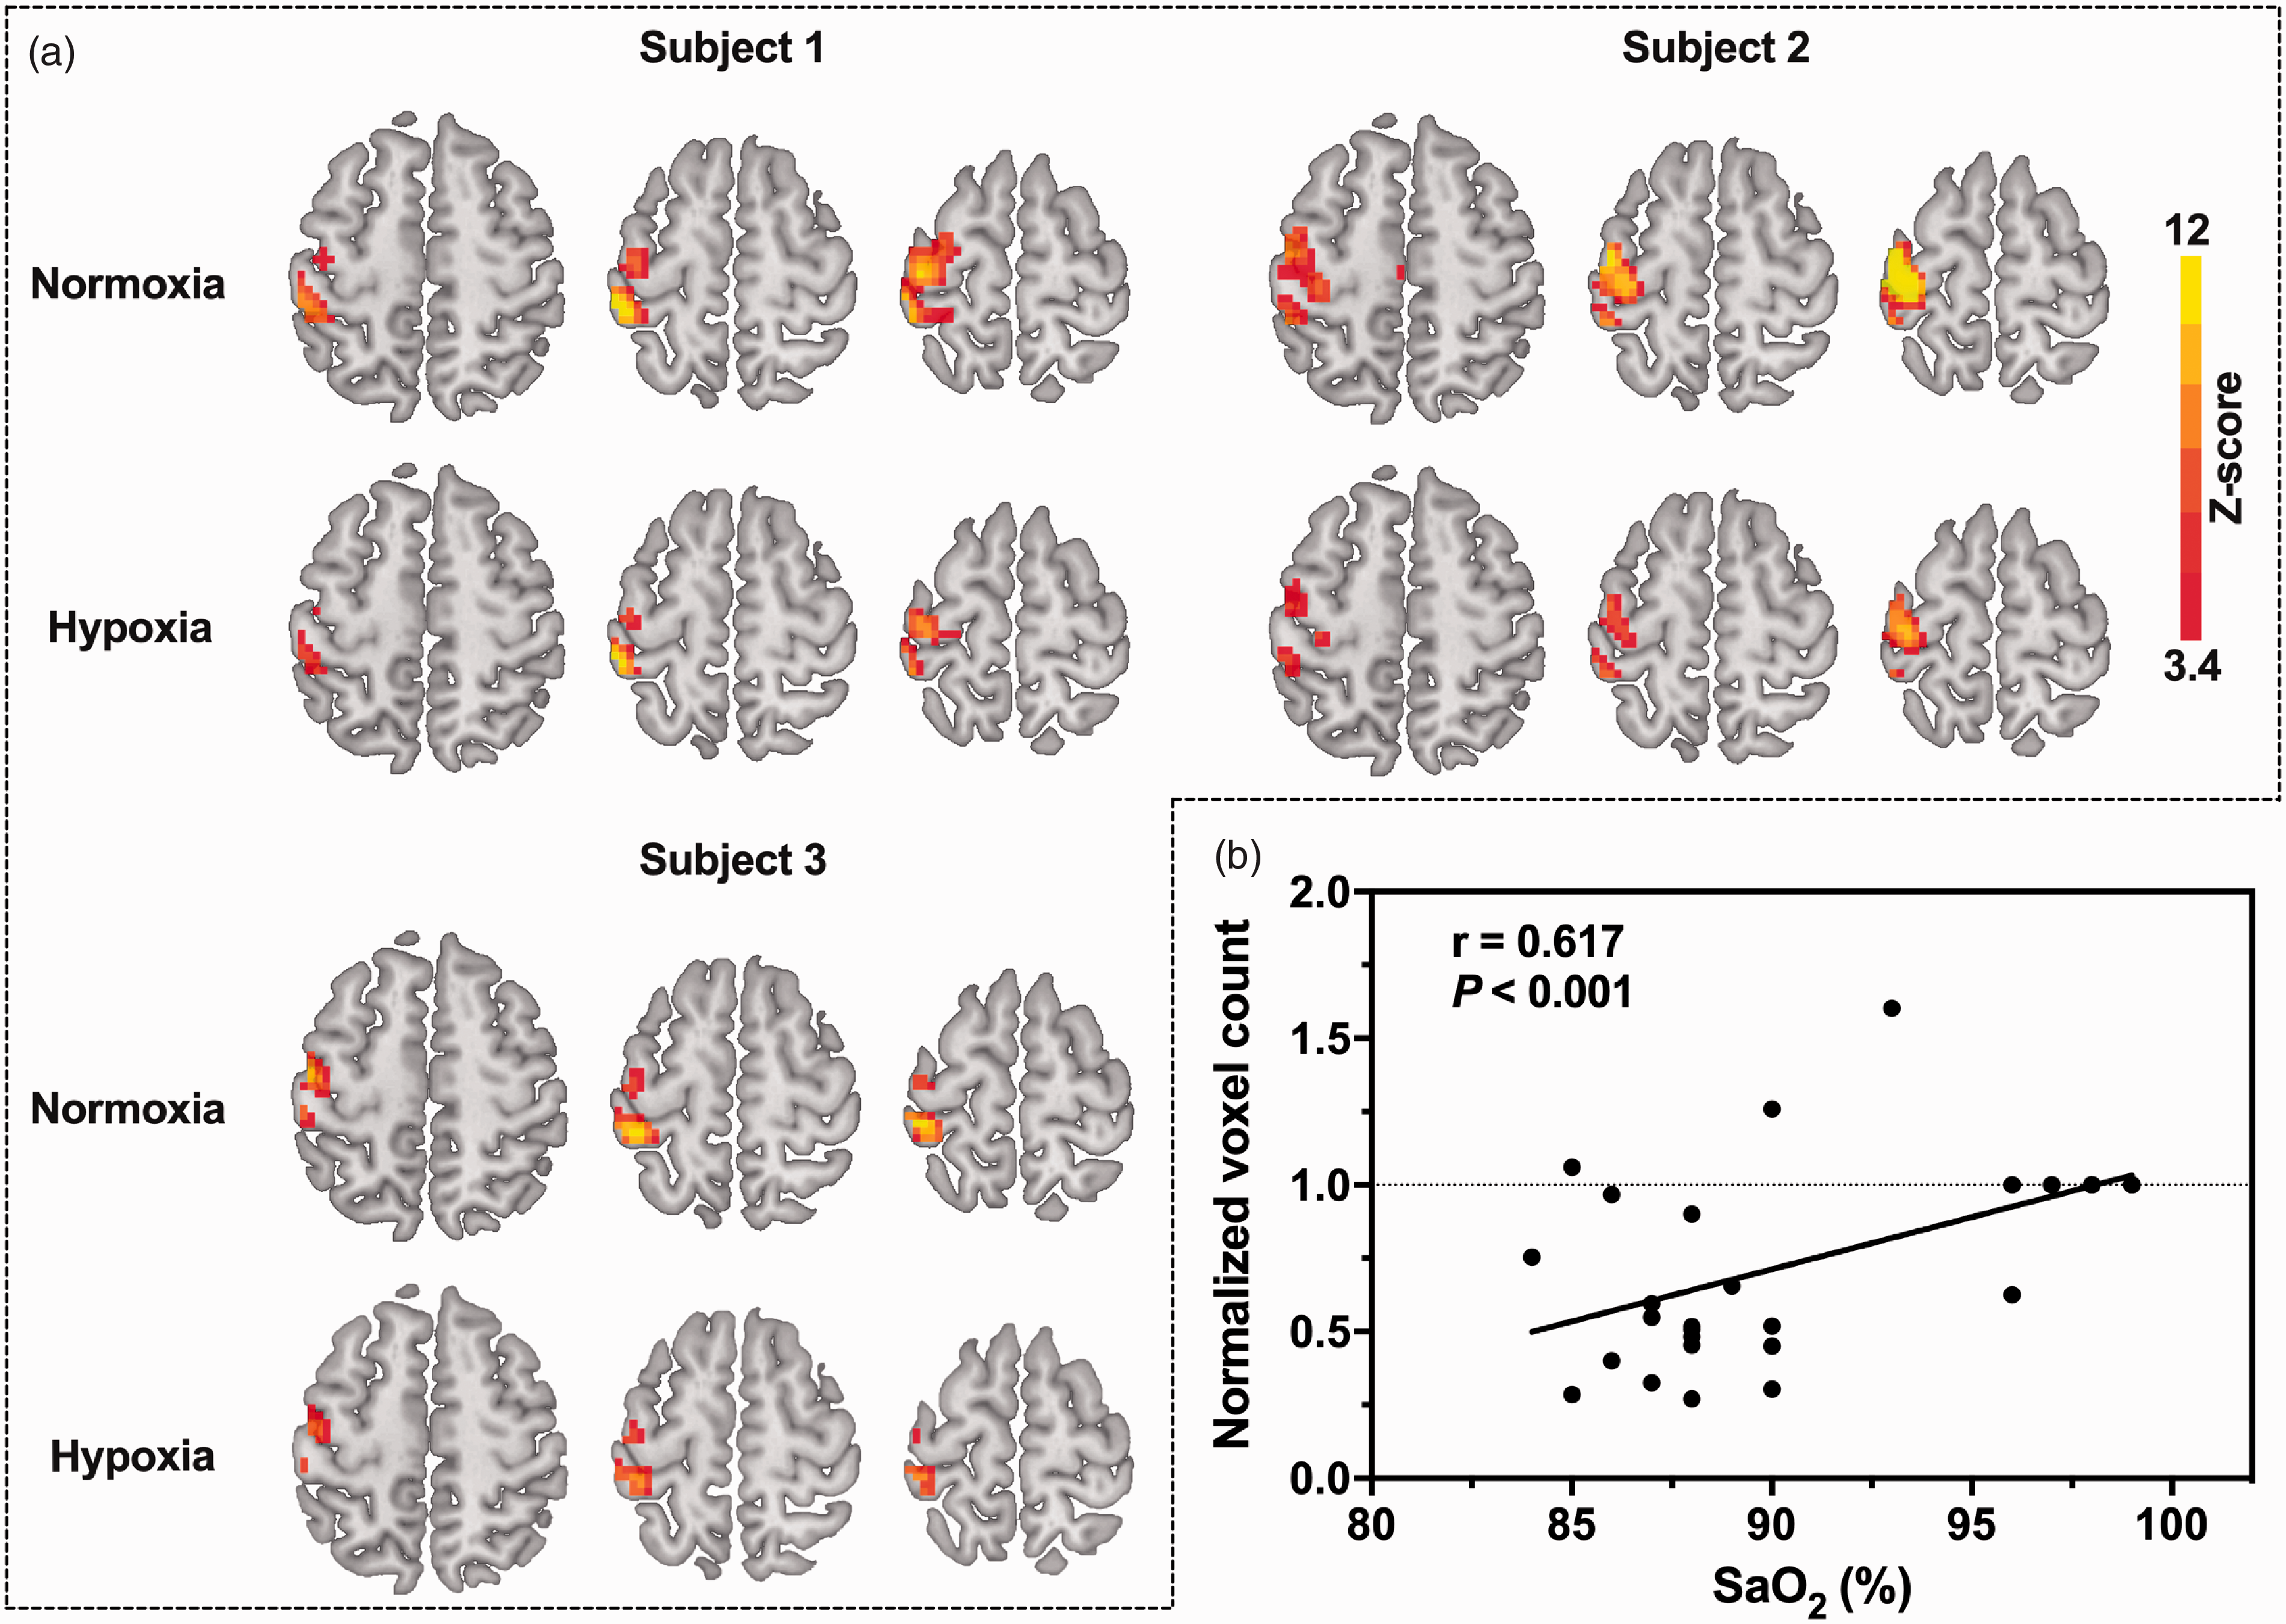
Time courses of OEF (a) and fCBV (b) responses from the overlapping area on OEF between the two gas conditions averaged across all subjects (n = 21). Data are shown as the mean ± SD. The areas in gray represent periods of stimulation.
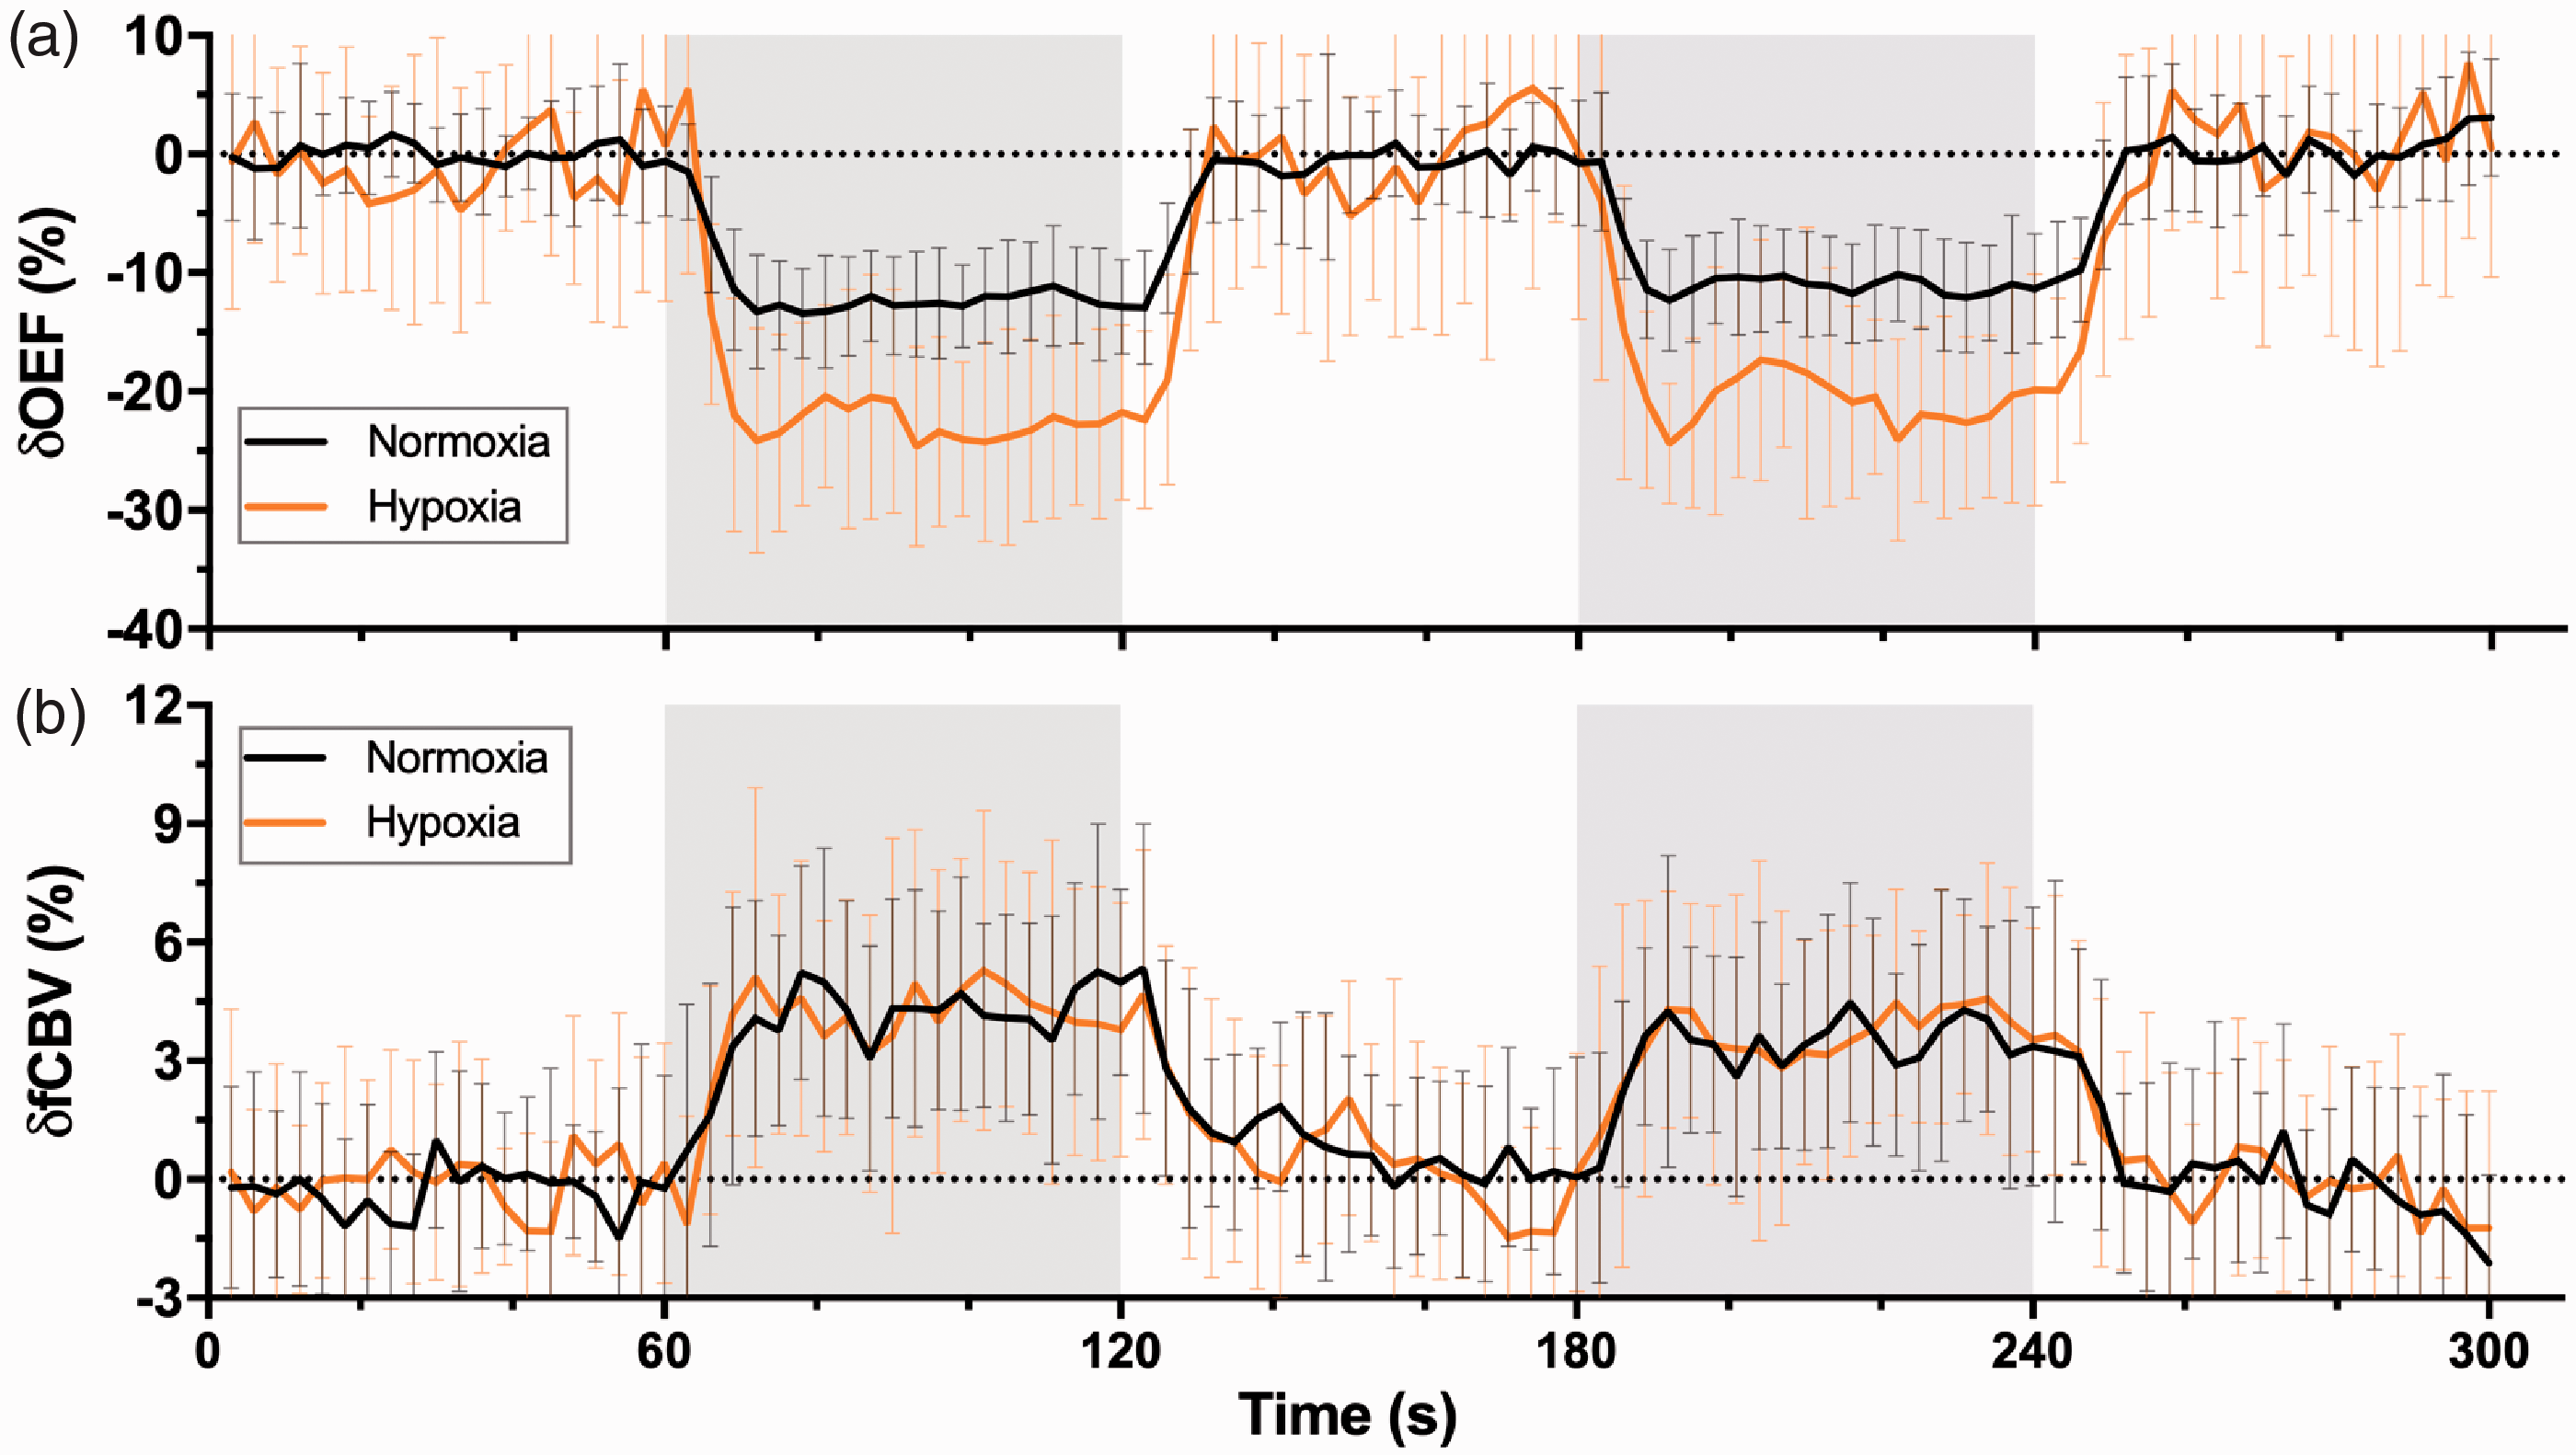
OEF (a) and fCBV (b) response amplitudes during motor activation plotted as a function of SaO2.
The individual OEF values during baseline (Figure 4(a)) and activation (Figure 4(c)) are shown with the corresponding SaO2. The averaged baseline OEF values were lower under mild hypoxia but displayed no significant difference between mild hypoxia (0.30 ± 0.08) and normoxia (0.31 ± 0.04) (
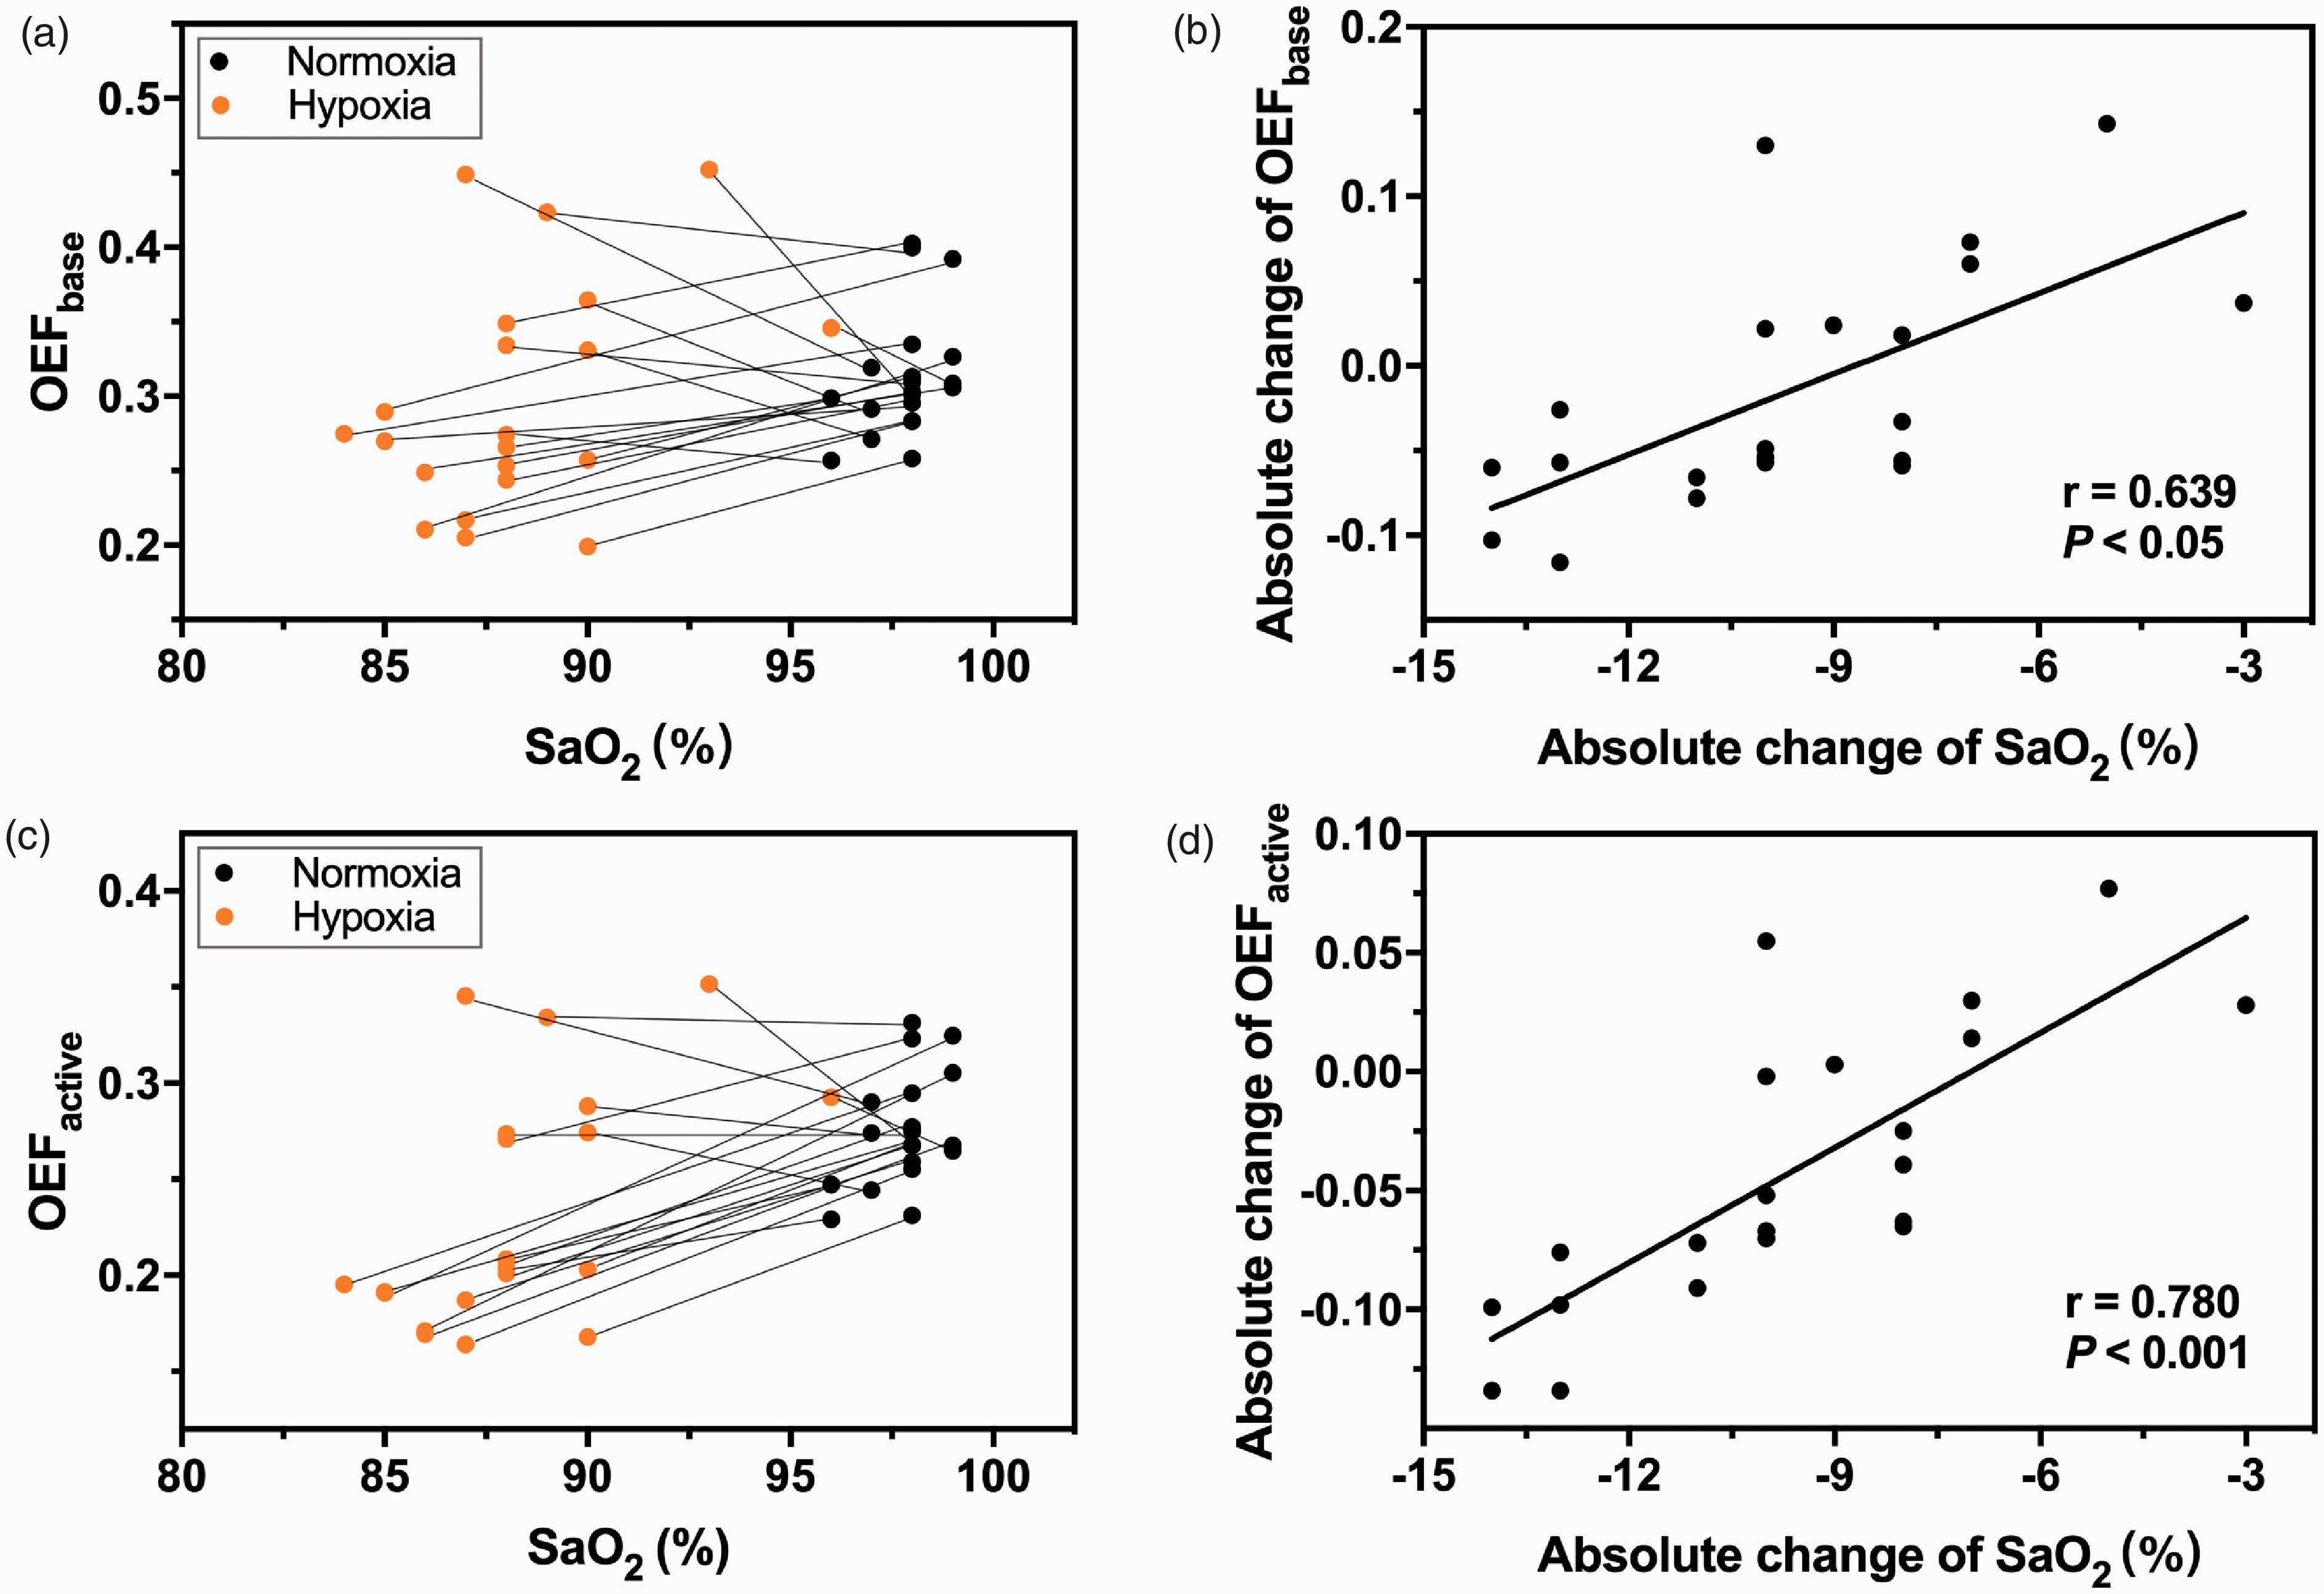
(a) A scatter plot of SaO2 and the OEF baseline values with two data points from individual subjects connected by a line. (b) A scatter plot of the absolute changes in SaO2 and the absolute changes in OEF baseline values. A significant correlation was observed (r = 0.639, P < 0.05). (c) A scatter plot of SaO2 and OEF activation values with two data points from individual subjects connected by a line. (d) A scatter plot of the absolute changes in SaO2 and the absolute changes in OEF activation values. A significant correlation was observed (r = 0.780, P < 0.001).
Discussion
The present study is the first to characterize OEF changes during increased neuronal activity under normoxia and mild hypoxia. Our results demonstrate that (1) the activated area of the OEF response during the motor task was smaller in mild hypoxia than in normoxia and had a significant correlation with SaO2; (2) the amplitude of the task-related OEF signal change obviously increased during hypoxia and was negatively correlated with SaO2; (3) both the baseline and activation OEF values decreased under hypoxia and displayed individual differences; and (4) the absolute changes in SaO2 were significantly correlated with the absolute changes in the baseline and activation OEF values.
The areas of the motor cortex showing task-related OEF responses in normoxia dramatically decreased in mild hypoxia (
An increased OEF response amplitude during mild hypoxia was observed in the overlapping activation region between the normoxia and mild hypoxia conditions (Figure 2(a)), representing the first demonstration of the time course of the OEF response for motor tasks in both normoxia and mild hypoxia conditions. When the oxygen concentration dropped to 12%, the OEF response changed from −11.8%
Summary results (mean ± SD, n = 21) of statistical analyses (paired t-test).
In accordance with studies showing similar characteristics of the CBV response determined by the VASO-fMRI technique,17,20,24 we found no significant difference in the fCBV response to motor tasks between the two oxygenation states (Figure 2(b)), implying that hypoxia had no effect on motor-induced vasoreactivity. Moreover, the fCBV response (Table 1) was not affected by the changes in SaO2 (Figure 3(b)). Notably, the VASO-fMRI technique measures changes in total CBV, while changes in venous CBV affect the BOLD response in normoxia.8,34,43–46 Previous studies have mostly assumed that CBV changes are uniformly distributed across vascular compartments. 40 In fact, the changes in venous CBV are smaller than those in arteries and are influenced by the duration of stimulation.47–49 With a short duration of stimulation, fMRI studies showed that venous CBV changes were small or nonexistent due to their slow temporal evolution.46,47 During long stimulation periods, cat studies have shown that the venous CBV eventually reached the same magnitude as the change in arterial CBV. These studies together support that the contribution of venous CBV changes to BOLD signals is significant for long stimulation periods. The stimuli used in this study belong to the long stimulus category with a classical block design and better account for the effects of changes in arterial deoxyhemoglobin volume during mild hypoxia since the fCBV change was the change in the volume of deoxygenated blood rather than in the volume of the vein.46,50 In addition, the cat study showed a decrease in the cerebrospinal fluid (CSF) volume fraction during visual stimulation, 51 suggesting that the contribution of CSF may lead to errors in fCBV evaluation.
In this study, the effects of hypoxia on the OEF both at baseline and during activation were observed. The results showed that both the baseline and activation OEF values were reduced under hypoxia. Specifically, as the SaO2 decreased from 98% to 88%, the baseline and activation OEF values decreased from 0.31
An important factor that affects the absolute OEF estimate is the effective blood oxygenation fraction (Y). In normoxia, Y is mainly considered the contribution of venous vascular components (
Studies have shown that
According to Fick’s principle, the change in OEF is related to the change in CBF, CMRO2 and arterial oxygen content. Previous studies have reported that global CBF increased under hypoxia, but regional CBF showed no significant changes.14,18 Assuming that the regional CMRO2 remains relatively constant under hypoxia, the regional OEF should increase with the decrease in the arterial oxygen content. However, due to the lack of measurement technology, little is known about whether hypoxia alters regional CMRO2. Moreover, experimental evidence suggests that the redistribution of blood low could affect OEF to support the changes in CMRO2, even without a noticeable change in CBF.65–68 Based on the result showing a reduction in the OEF in motor-related areas under hypoxia in this study, we speculate that the CMRO2 in corresponding areas decreases under hypoxia. However, the effect of hypoxia on regional CMRO2 needs to be further investigated using independent quantitative measurement technology. In addition, future studies should pay attention to the influence of the degree of hypoxia on CBF. The reason is that when SaO2 is less than 60%,69–71 a higher baseline CBF may limit further vasodilation induced by task stimulation, and then the same CBF response as in normoxia cannot be evoked. 72
Previous studies have found that the BOLD response significantly changes in different physiological states (i.e., hypoxia).17,23,73 In this study, the effect of hypoxia on the BOLD response to a motor task was estimated by the first echo of the MASE pulse sequence. The results showed that the BOLD response was smaller in mild hypoxia (1.4% ± 0.4%) than in normoxia (1.9% ± 0.6%) (
Notably, all the results obtained in this study were based on the common threshold region of the OEF in both normoxia and hypoxia, enabling direct comparison of OEF signal changes in the same parenchymal structures. However, since the activated OEF region under hypoxia was smaller than that under normoxia, this ROI selection method will be biased towards the smaller region. When the time courses were extracted from all active voxels for each gas condition, the baseline and activation OEF values were significantly increased (
Measurement of the OEF in this study was mainly based on the relationship between MR signals and blood oxygen saturation established by Yablonskiy and Haacke. 80 To meet the time resolution requirement of fMRI research, a simple qBOLD model considering only the contribution of tissues outside blood vessels was used for MASE data. This method has proven feasible in task-based OEF-fMRI29 and resting-state OEF-fMRI, 30 and studies have shown that OEF activation areas are mostly located in gray matter, partly eliminating the effect of white matter and CSF signals, which might have overestimated R2′ and fCBV.56,57,81 Another factor resulting in R2′ and fCBV overestimation is the contribution of intravascular signals.54–56 However, studies have shown that the lack of consideration of intravascular signal contribution had little impact on the evaluation of the OEF with undersampling data. 54 Moreover, the long TE acquisition setting in this study helped reduce the intravascular signal contribution.59,60 In addition, previous studies82–84 have shown that the inhomogeneity of the magnetic field and the diffusion effect of water in tissue will overestimate R2′; at the same time, because of a 180° refocusing pulse, the signal in the spin echo is not affected by magnetic field variation, which leads to overestimation of the fCBV. Although this experiment adopted the method of a high-order shimming field at the beginning to minimize the influence of magnetic field inhomogeneity, this method is not applicable to all brain areas, and an accurate calculation method is still needed.83,85 Despite these systematic offsets, the OEF assessment between different oxygen states is regulated by physiological changes, which have been demonstrated in pathological conditions using similar methods. 86 However, because few studies have investigated the effect of mild hypoxia on the contribution of blood vessel composition, the fCBV results must be interpreted with caution. An alternative and promising method for quantifying changes in fCBV involves measuring CBF with sophisticated measurement techniques and the relationship between CBF and CBV in each vascular component.56,62 Future work is needed to describe whether this association is affected by mild hypoxia. The fixed Hct value of all subjects under different oxygen states may be a factor affecting OEF evaluation. Recently, Broisat et al. 87 found that local decreases in Hct in stroke and glioma have spatial heterogeneity; therefore, accurate Hct assessments are necessary, especially for clinical application.
In conclusion, this study demonstrates the OEF response to motor tasks under both mild hypoxia and normoxia for the first time, which primarily benefited from a newly proposed technique, MASE, that can dynamically track the OEF in fMRI research. These findings provide a new perspective on the effects of mild hypoxia on brain function and a possible explanation for the change in BOLD signal during mild hypoxia, which is often difficult but important to determine in altered physiological states, especially in pathological states. The noninvasive and operable properties also reflect the potential for extensive application of these techniques to brain science in the future.
Supplemental Material
sj-pdf-1-jcb-10.1177_0271678X21992896 - Supplemental material for Effects of mild hypoxia on oxygen extraction fraction responses to brain stimulation
Supplemental material, sj-pdf-1-jcb-10.1177_0271678X21992896 for Effects of mild hypoxia on oxygen extraction fraction responses to brain stimulation by Yayan Yin, Su Shu, Lang Qin, Yi Shan, Jia-Hong Gao and Jie Lu in Journal of Cerebral Blood Flow & Metabolism
Footnotes
Funding
The author(s) disclosed receipt of the following financial support for the research, authorship, and/or publication of this article: This work was supported by the National Natural Science Foundation of China (81671662, 81901722, 81790650, 89790651, 81727808 and 31421003); China Postdoctoral Science Foundation (2019M650772).
Acknowledgements
The authors thank the National Center for Protein Sciences at Peking University for assistance with the MRI data acquisition.
Declaration of conflicting interests
The author(s) declared no potential conflicts of interest with respect to the research, authorship, and/or publication of this article.
Authors’ contributions
YY: study design, protocol development, data acquisition, data analysis, interpretation of the results, drafting and revising the article.
SS and LQ: data acquisition, data analysis, interpretation of the results.
YS: data acquisition, interpretation of the results.
JG: study design, study guide, interpretation of the results, revising the article.
JL: study design, study guide, interpretation of the results, revising the article.
Supplementary material
Supplemental material for this article is available online.
References
Supplementary Material
Please find the following supplemental material available below.
For Open Access articles published under a Creative Commons License, all supplemental material carries the same license as the article it is associated with.
For non-Open Access articles published, all supplemental material carries a non-exclusive license, and permission requests for re-use of supplemental material or any part of supplemental material shall be sent directly to the copyright owner as specified in the copyright notice associated with the article.