
Abstract
The goal of the present study was to examine the cerebral metabolism and vascular reactivity during extended breath-holds (ranging from 2 min 32 s to 7 min 0 s) and during a hypoxic challenge in freedivers and non-diver controls. Magnetic resonance imaging was used to measure the global cerebral blood flow (CBF) and metabolic rate of oxygen (CMRO2), and magnetic resonance spectroscopy was used to measure the cerebral lactate, glutamate+glutamine, N-acetylaspartate and phosphocreatine+creatine concentrations in the occipital lobe. Fifteen freedivers and seventeen non-diver controls participated. The freedivers showed remarkable increases in CBF (107%) during the breath-holds, compensating for arterial desaturation, and sustained cerebral oxygen delivery (CDO2). CMRO2 was unaffected throughout the breath-holds. During the hypoxic challenge, the freedivers had larger increases in blood flow in the sagittal sinus than the non-divers, and could sustain normal CDO2. No differences were found in lactate production, global CBF or CMRO2. We conclude that the mechanism for sustaining brain function during breath-holding in freedivers involves an extraordinary increase in perfusion, and that freedivers present evidence for higher cerebrovascular reactivity, but not for higher lactate-producing glycolysis during a hypoxic challenge compared to controls.
Keywords
Introduction
Freedivers are capable of holding their breath for several minutes. At the 2016 AIDA (International Association for Development of Apnea, https://www.aidainternational.org) world championship, the longest breath-hold (BH) during static apnea (BH with one’s face submerged in water without movement) was 9 min 34 s for men, and 7 min 59 s for women.
The brain requires a constant supply of oxygen to prevent neuronal insult. How freedivers maintain sufficient energy metabolism during extended BH and during a hypoxic challenge is investigated in this study. Humans have a number of coping mechanisms during diving that initiate during BH and constitute the so-called diver reflex. The diver reflex decreases the oxygen consumption in non-vital organs and muscles by means of peripheral vasoconstriction and the redistribution of blood and resources to the vital organs, including the heart, lungs and brain.
The main coping mechanism against cerebral hypoxia or hypercapnia is increasing cerebral blood flow (CBF) from the cerebrovascular reserve capacity (CVR). A high CVR is correlated with optimal brain health and intact cognitive function in elderly healthy adults1–3; in contrast, impaired CVR is evident in a number of diseases correlated with stroke and cognitive decline. Patients with metabolic syndrome and related diseases, such as type 2 diabetes and obstructive sleep apnea, have reduced baseline CBF and CVR.4–9 Furthermore, CVR decreases with age, 10 and this decrease may play a role in the development of Alzheimer’s disease. 11 These results suggest a correlation between high CVR and brain health. Previous studies in young, healthy subjects with normal CVR have found that a moderate-to-severe hypoxic challenge resulted in elevated CBF, which compensated, or almost compensated, for the arterial oxygen desaturation12–17 and sustained12–14, or slightly increased, the cerebral metabolic rate of oxygen (CMRO2).15–17 Elevated CMRO2 is likely driven by hypocapnia from increased ventilation during hypoxia.15,17
In addition to depending on oxygen, the brain relies on a continuous supply of glucose. In the adult brain, glucose is converted into energy mostly by oxidative phosphorylation; however, a small part of the glucose solely undergoes glycolysis where pyruvate is instead transformed to lactate as the end-product. Studies using magnetic resonance spectroscopy (MRS) have shown increased lactate concentrations in the resting brain during hypoxia17–19 and additionally, that a combination of visual stimulation and hypoxia results in an amplified lactate increase. 17 The exact reason for the higher lactate concentration during hypoxia is not clear, but could be from increased astrocytic glycolysis. We hypothesize that increased glycolysis and lactate production constitute a rescue mechanism when hypoxia develops and threatens oxygen metabolism, and is a healthy sign of an adaptable metabolic system prepared to face a dangerous lack of oxygen. A similar shift towards anaerobic glycolysis in addition to high cerebral perfusion is observed in some diving marine mammals. 20
During the prolonged BH performed by freedivers, the CVR is enhanced by both hypercapnia and hypoxia in the brain. Because freedivers can endure this critical environment in the brain, they are ideal candidates for the examination of the CVR in extreme situations. We hypothesize that the freediver will have a large increase in CBF to compensate for arterial desaturation. We conjecture further that if the increase in CBF is not sufficient to sustain cerebral oxygen supply, the freedivers will exhibit additional coping mechanisms, such as a shift towards more glycolysis, at least in astrocytes, which could manifest as a reduction in oxygen consumption.
The cerebrovascular reactivity and cerebral oxygen consumption in freedivers were examined by measuring the global CBF and global CMRO2 at a high temporal resolution during extended BHs using magnetic resonance imaging (MRI) techniques. To further investigate the effect of hypoxia on the cerebral metabolism, the participants underwent a 40 min hypoxic challenge by inhaling air with 10% fractional inspired oxygen (FiO2). In addition to CBF and CMRO2, cerebral lactate, glutamate+glutamine (Glu+Gln), N-acetylaspartate (NAA) and phosphocreatine+creatine (PCr+Cr) concentrations were measured by MRS before and during the hypoxic challenge. We hypothesize that a shift towards glycolysis is more pronounced in freedivers than in non-diver controls, and that during a hypoxic challenge, the freedivers will show a higher lactate concentration and thereby provide evidence of a cellular coping mechanism.
Methods
Fifteen freedivers (7 females, mean age=32.7 years, range=24.7–45.3 years) and 17 healthy controls (7 females, mean age=28.8 years, range=20.4–39.7 years) participated in the study. Only freedivers currently active in the sport were included in the study. The controls had no prior experience with freediving, diving in general or training BHs. The participants had no known heart, lung or neurological diseases.
The study was approved by the Danish National Committee on Health Research Ethics (H-15003589) and was conducted according to the Declaration of Helsinki. All subjects gave written informed consent prior to participation. All scans were performed on a Philips 3 Tesla Achieva dSTREAM MRI scanner (Philips Medical Systems, Best, The Netherlands) using a 32-channel phase array head coil.
The experiment consisted of one MRI session covering initial anatomical scans, followed by baseline normoxia functional scans, two to four scans during BHs, and lastly, functional scans during hypoxia (Figure 1). The functional scans consisted of acquisitions of global CBF, CMRO2 and the concentrations of lactate, Glu+Gln, NAA and PCr+Cr. During BHs, global CBF or CMRO2 was measured.
Timing of the measurement of parameters. Survey and anatomical scans, global CBF, combined oxygen saturation and blood flow in the sagittal sinus for calculation of CMRO2 and MR spectroscopy were acquired during the initial 30 min of normoxia. Hereafter, the participants performed two to four breath-holds, with pauses between each breath-hold. During breath-holding, either global CBF or combined oxygen saturation and blood flow in the sagittal sinus for calculation of CMRO2 was measured. After 60 min, the participants initiated the hypoxic challenge by inhaling 10% FiO2 hypoxic air. After 20 min of hypoxic exposure, the MR spectroscopy measurements were repeated, and after 32 min, the acquisitions of CBF and CMRO2 were repeated.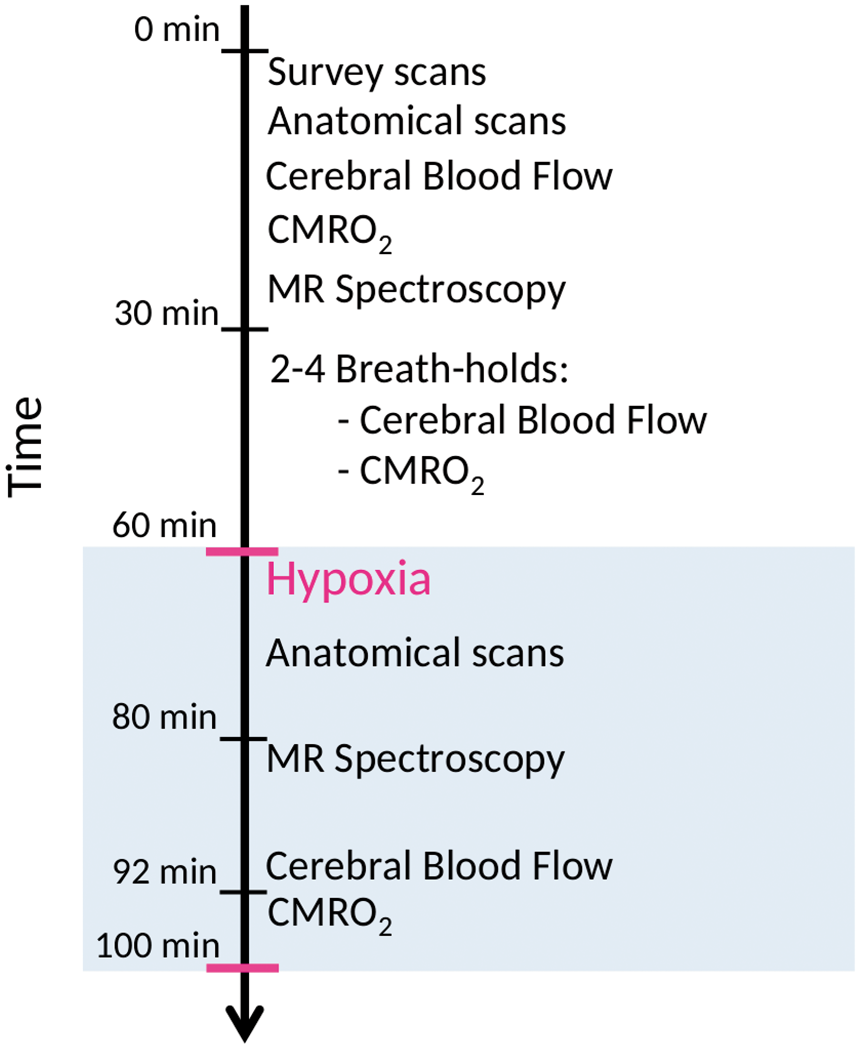
During the scan, the subjects were fitted with a facemask covering the mouth and nose. During normoxia measurements, the subjects inhaled atmospheric air from the surrounding environment. During the hypoxia measurements, the mask was connected by a tube and a one-way valve to an AltiTrainer system (SMTEC, Nyon, Switzerland) that provided hypoxic air. A one-way valve in the mask ensured that no rebreathing was possible. End-tidal CO2 tension was measured from a tube connected to the mask by a Veris Monitor system (MEDRAD, Pittsburgh, Pennsylvania, USA). Heart rate and arterial oxygen saturation were measured continually throughout the scan by fingertip pulse oximetry, also using the Veris Monitor. Before the scan, a venous blood sample was drawn and analysed immediately for haemoglobin and haematocrit using a Radiometer ABL800 Flex (Radiometer, Copenhagen, Denmark).
Breath-hold paradigm
Acquisition of CBF or CMRO2 was initiated approximately 2–3 min prior to breath-holding, and was thereafter continuously measured until cessation of the BH period. After approximately 2 min of resting for baseline measurements, the subjects were asked to prepare for breath-holding and subsequently start the breath-holding. The preparation consisted of one to three deep inhalations depending on the divers’ personal preference. The participants were encouraged not to hyperventilate or to perform lungpacking. The breath-holding was initiated after a full inhalation. The contribution of breath holding to CBF or CMRO2 measurements was inferred by comparing data acquired during the 2-min baseline period with the subsequent breath-holding phase.
Magnetic resonance imaging methods
Anatomical scan
Anatomical scans for estimating brain weight were obtained with a 3D T1-weighted turbo field echo sequence (150 slices, field of view (FOV) =241×180×16 mm3 voxel size = 1.09×0.81×1.10 mm3, echo time (TE) = 2.78 ms, repetition time (TR)=6.9 ms, flip angle = 9°). Brain volume was estimated from anatomical images using FSL BET and FAST software (FMRIB Software Library, Oxford University, Oxford, UK), 21 and brain weight was calculated by assuming a brain density of 1.05 g/ml. 22
Magnetic resonance spectroscopy
The lactate, Glu+Gln, NAA and PCr+Cr concentrations were measured in the occipital lobe using MRS. It is not possible to differentiate between the concentrations of glutamate and glutamine or between phosphocreatine and creatine when using 3 Tesla MRS in vivo in humans. Therefore, only the combined concentrations of glutamate+glutamine and phosphocreatine+creatine are reported. A water-suppressed point-resolved spectroscopy (PRESS) pulse sequence was used (TR = 3000 ms, TE = 36.5 ms, voxel size = 30×35×30 mm3, 160 acquisitions, total scan time = 8 min 54 s). Post-processing and quantification of the spectra were performed using LCModel (LCModel (Version 6.3-1F), Toronto, Canada).
Cerebral blood flow
The mean global CBF was calculated by measuring the mean velocity and the cross-sectional area of the carotid arteries and basilar artery by phase contrast mapping. Blood velocity maps were acquired with a turbo field echo sequence (FOV=240×240 mm2, voxel size = 0.75×0.75×8 mm3, 1 slice, TE = 7.33 ms, TR = 27.63 ms, flip angle = 10°, velocity encoding = 100 cm/s).
For acquiring global CBF before and during the hypoxic challenge, two measurements were performed. The first measurement was performed with an imaging slice placed orthogonal to the carotid arteries and was followed by a second measurement with an imaging slice placed orthogonal to the basilar artery. Each measurement was repeated five times and averaged, resulting in total scan-time of 3 min 19 s. To measure global CBF during BH, only one imaging slice was used that acquired flow in the carotid and vertebral arteries simultaneously, thus enabling a high temporal resolution of 10.9 s but at the cost of slightly decreasing the accuracy of the quantification. 23 Examples of velocity maps acquired during a BH are shown in the supplementary material (Figure S1). Regions of interest (ROIs) were drawn corresponding to each cerebral artery, and the mean velocities and cross-sectional areas were calculated from the ROIs. The ROIs were initially drawn on the magnitude image and thereafter copied to each velocity map and corrected for misalignment due to possible motion, if necessary. Flow was calculated by multiplying the mean velocity and cross-sectional areas for all arteries. Quantitative global CBF was calculated by normalizing the total flow to the whole brain tissue weight.
The cerebral delivery of oxygen (CDO2) was calculated by multiplying CBF by the arterial oxygen concentration (CaO2). CaO2 was calculated as the arterial saturation multiplied by the oxygen carrying haemoglobin concentration.
Post-processing was performed using Matlab (Mathworks, Natick, MA, USA) scripts developed in-house.
Cerebral metabolic rate of oxygen
CMRO2 was calculated using Fick’s Principle (equation (1))

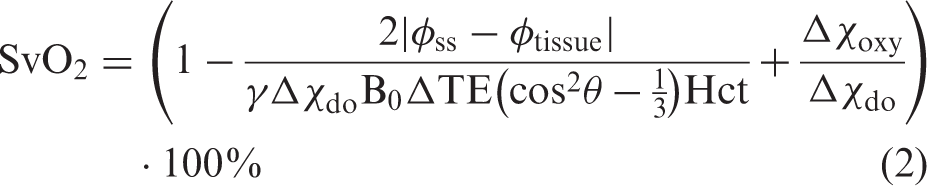
The sequence uses a dual gradient-echo sequence to generate susceptibility-weighted phase-difference maps by subtracting phase maps from the two echoes (FOV = 220×189 mm2, 1 slice, voxel size = 0.7×0.7×8 mm3, TR = 23 ms, TE1 = 8.03 ms, TE2 = 17.73 ms, flip angle = 30°, velocity encoding = 100 cm/s, SENSE-factor = 2). The differences in phase-difference values in venous blood and brain tissue can be related to saturation using an exact formulation (equation (2))24,25
SaO2 was continuously sampled by pulse oximetry. Prior to the study, the pulse oximeter was calibrated with simultaneously drawn arterial blood samples from 23 subjects during normoxia and hypoxia from a previous study with a similar set-up and equipment. 17
Arteriovenous oxygen saturation difference (A-V O2) was calculated by SaO2-SvO2 for the measurements from normoxia, the hypoxic challenge, and the time series from the BHs. The time series of A-V O2 saturation and BFss acquired during BHs were low-pass filtered with a five-sample mean filter to reduce noise in the time series before the CMRO2 calculations.
Post-processing was performed using Matlab scripts developed in-house.
Statistics
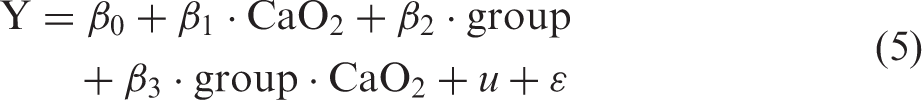
The time series acquired during BH were aligned to the beginning of the BHs (example in Figures 2, 3 and 5). To test for significant changes during BH, the time series were stretched or narrowed by linear interpolation to the mean BH duration (example in Figure 2(c) and (d)). Each interpolated time point (Yt) was tested against baseline values before the BHs by a mixed model linear regression (equation (3)) with a categorical variable indicating BH or baseline (CBaseline|BH), subject grouping (u, matrix indicating subject as most subjects contributed with multiple BHs) as a random variable to account for between-subject variability and ɛ as noise (equation (3)).
Time series of blood gasses and heart rate during breath-holds. Time series (yellow and purple lines) of arterial saturation during breath-holds (BH) in freedivers (n = 38) (a) and non-diver controls (n = 30) (b). Breath-holds, indicated by the purple line, were aligned to start at time equal zero. Individual time series of the arterial saturation were stretched or narrowed by linear interpolation to the average breath-hold duration (3 min 50 s) with mean saturation (green line) for freedivers (c) and for non-divers (d). Mean (black line) and standard deviation (blue shade) from the interpolated time series and indication of significant differences (black star) from baseline values from before breath-hold for freedivers (e) and non-diver controls (f). Time series of heart rate in freedivers (g) and non-diver controls (h). Mean heart rate (black line) and standard deviation (blue shade) and indication of significant differences (black star) for freedivers (i) and non-diver controls (j). Time series of end-tidal CO2 from expired air from freedivers (k) and non-diver controls (l). End-tidal CO2 could not be measured during the breath-hold because of no expired air (indicated by the gray lines). Time series of CBF and CDO2 during breath-holds. Time series of global CBF during breath-holds for freedivers (n = 11) (a) and non-diver controls (n = 15) (b) and mean CBF (black line) and standard deviation (blue shade) for interpolated time series with indications of significant differences (black star) for freedivers (c) and non-divers controls (d). Global CDO2 during breath-hold for freedivers (e) and non-diver controls (f) and mean CDO2 and standard deviation for interpolated time-series with indication of significant differences (black star) for freedivers (g) and non-diver controls (h). (i) Rate of increase in CBF from the breath-holds performed by the non-diver controls (yellow) and from the early phase of the breath-holds from freedivers (blue) against total duration of breath-hold. Student’s t-test between the rates from freedivers and controls yielded a significant difference (p = 0.0058).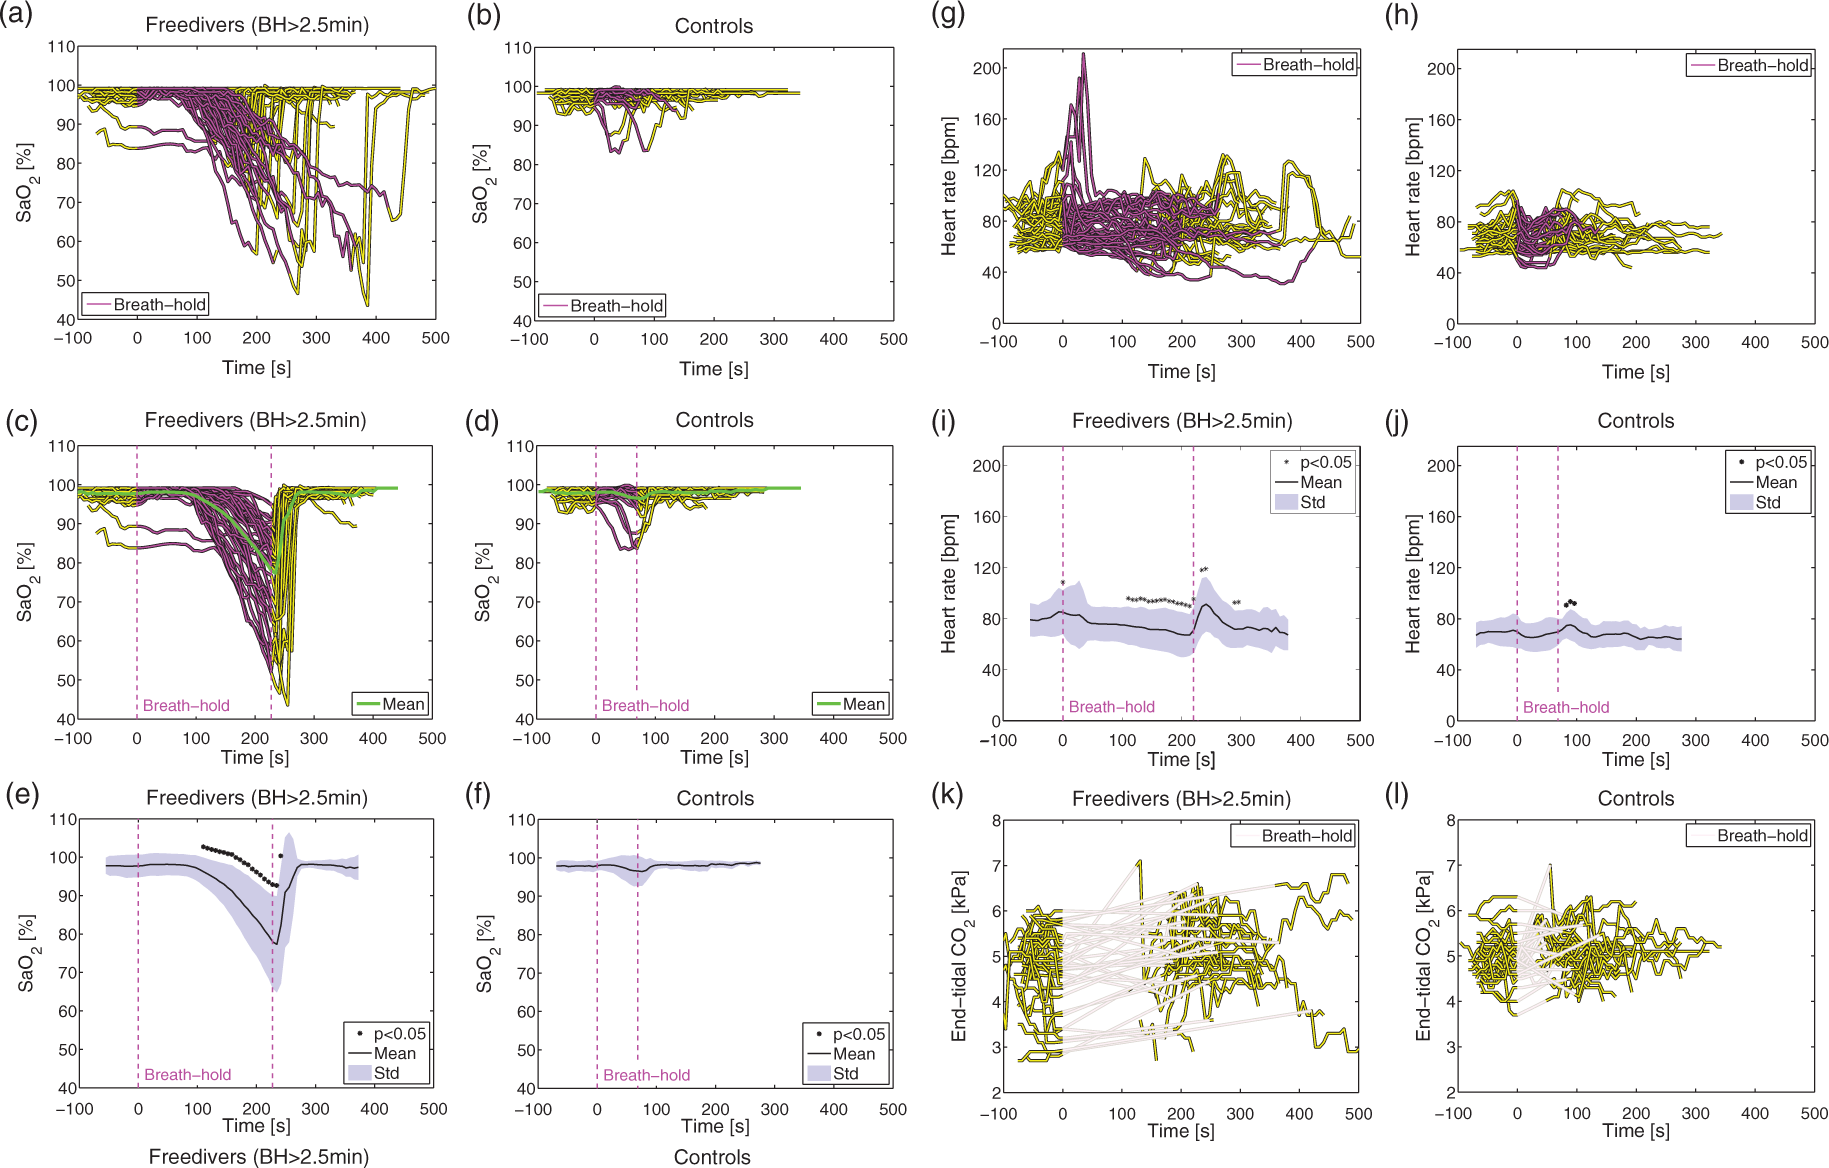
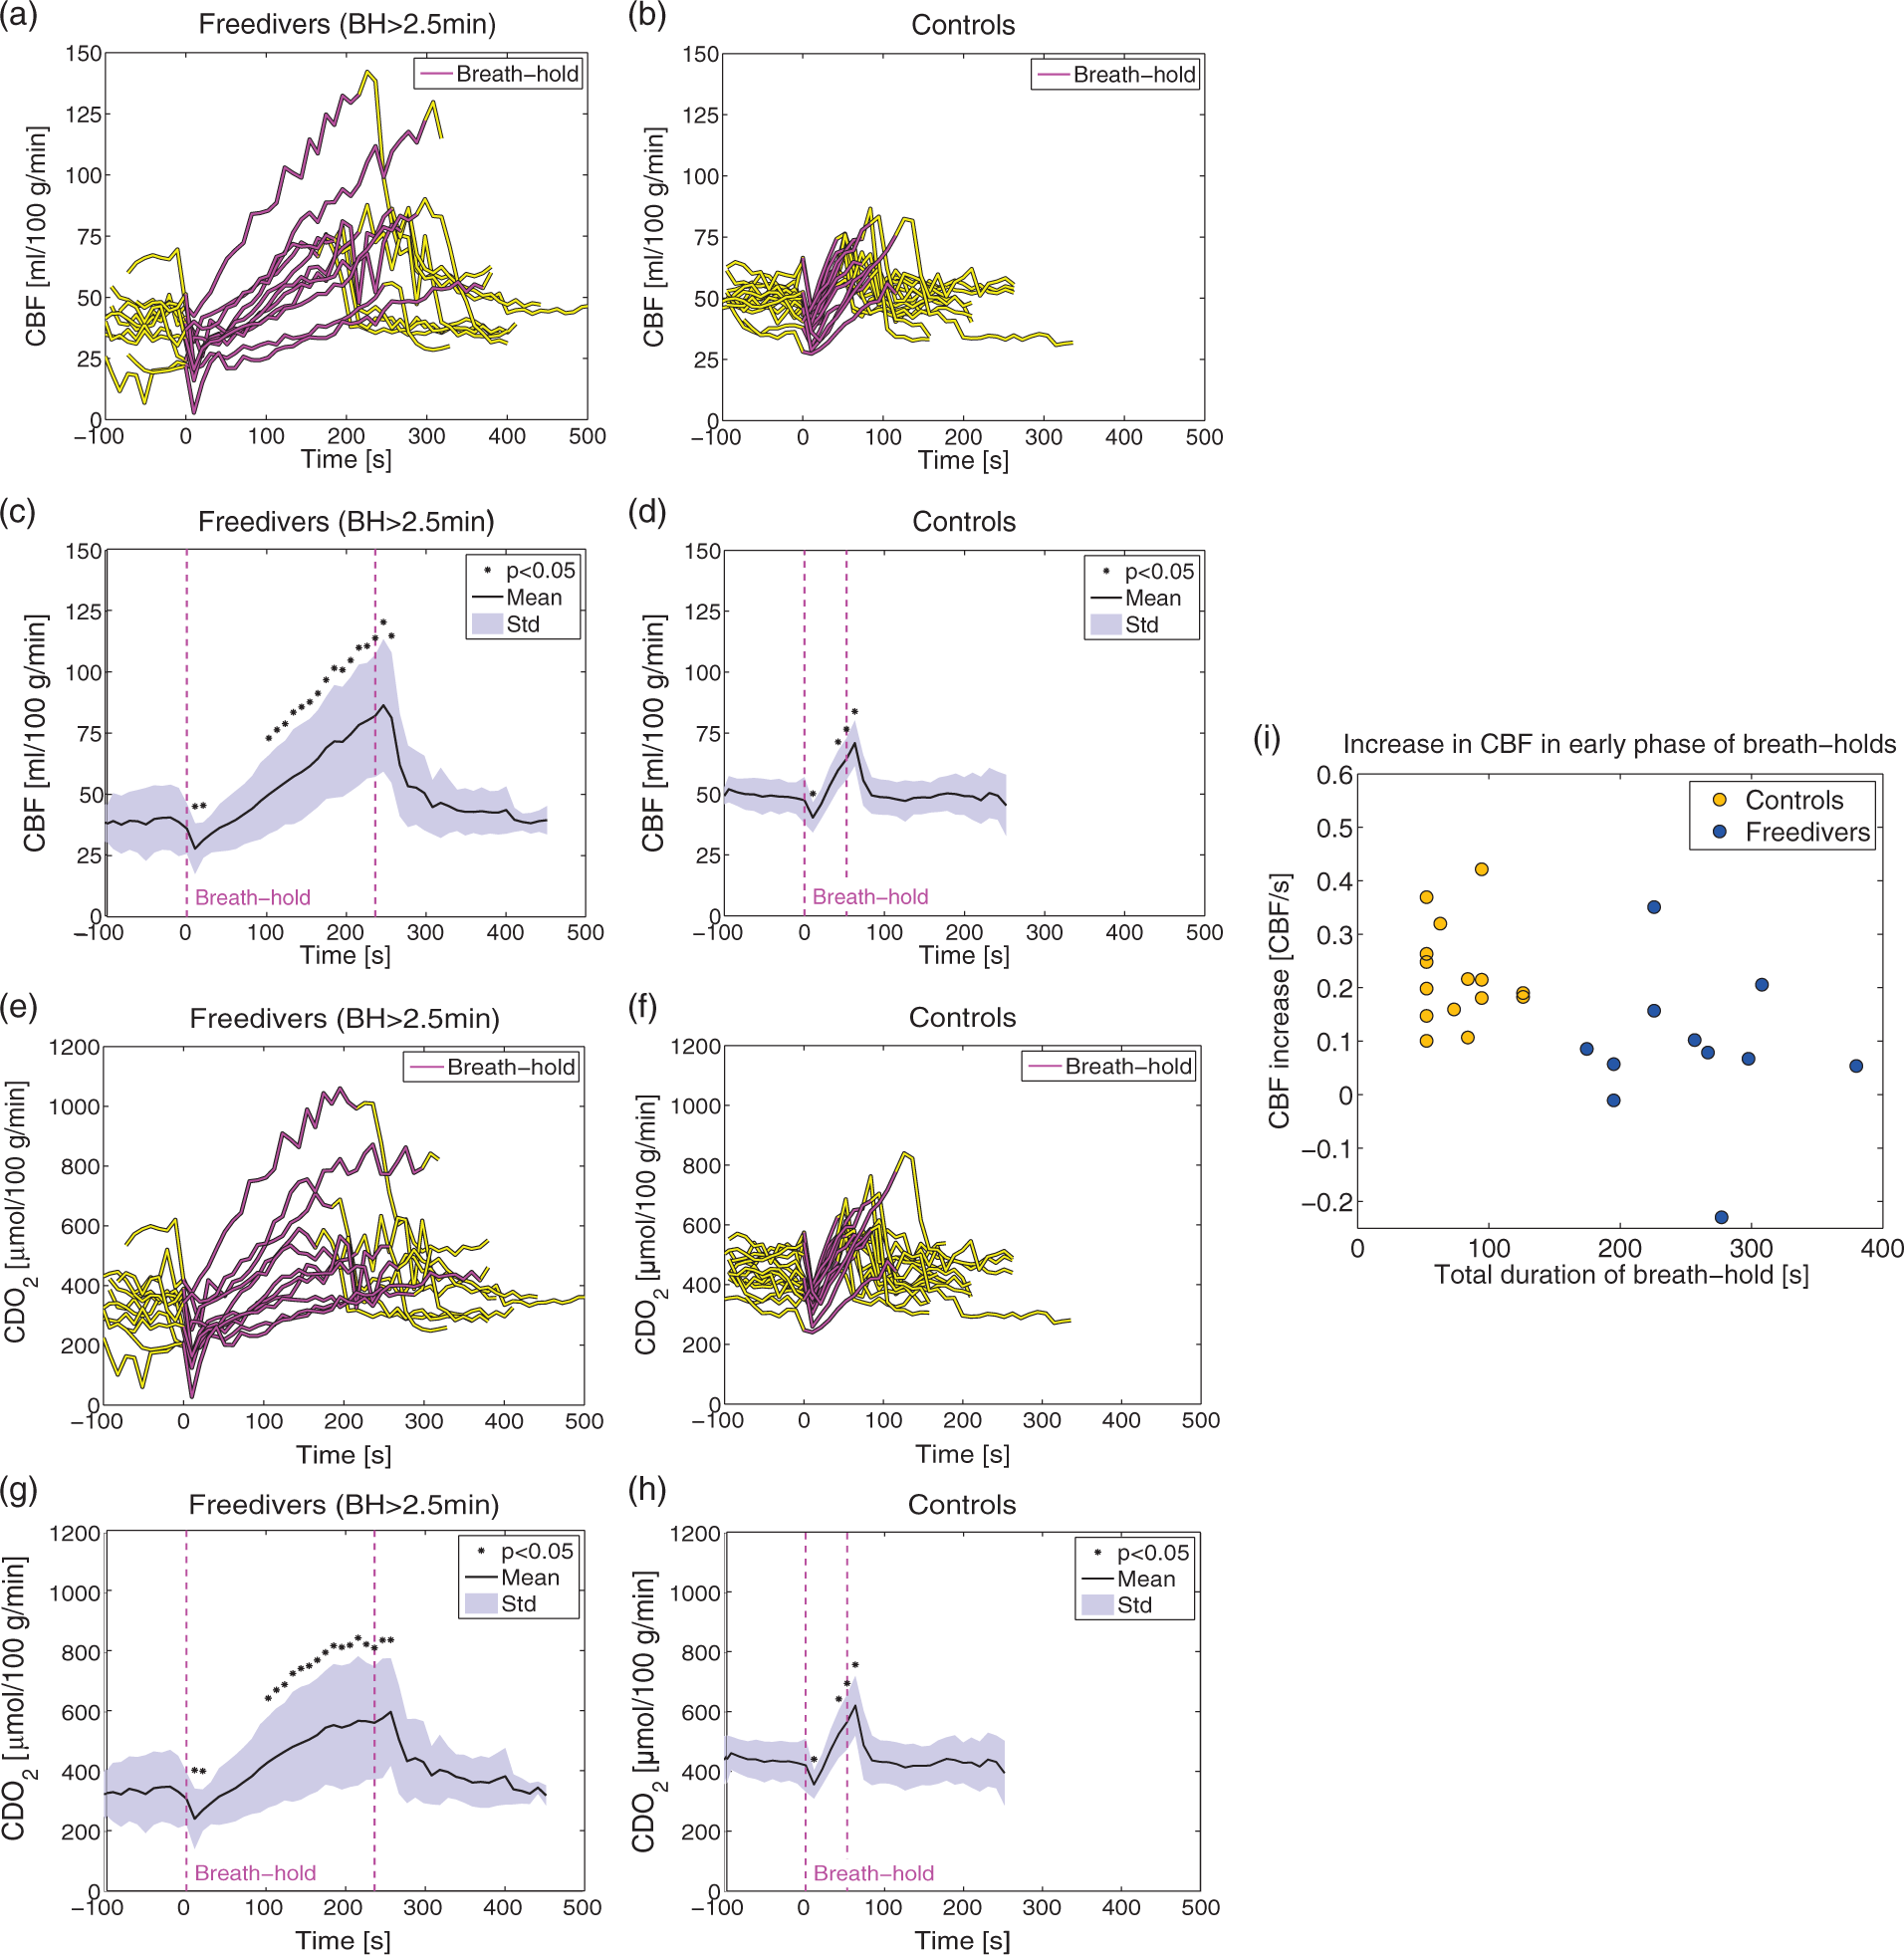

The average rates at which CBF increased during the BHs of the non-diver controls were compared with the rates observed in freedivers in the early phase of their BH, which corresponded to the mean duration of the controls’ BHs. The rate of CBF increase is shown against the total BH duration for the two groups in Figure 3(i). The rates of CBF increase between the two groups were compared using Student’s t-test. Post-processing of measurements from BHs was blinded regarding subject.

Summary of the results and statistics from the hypoxic challenge.
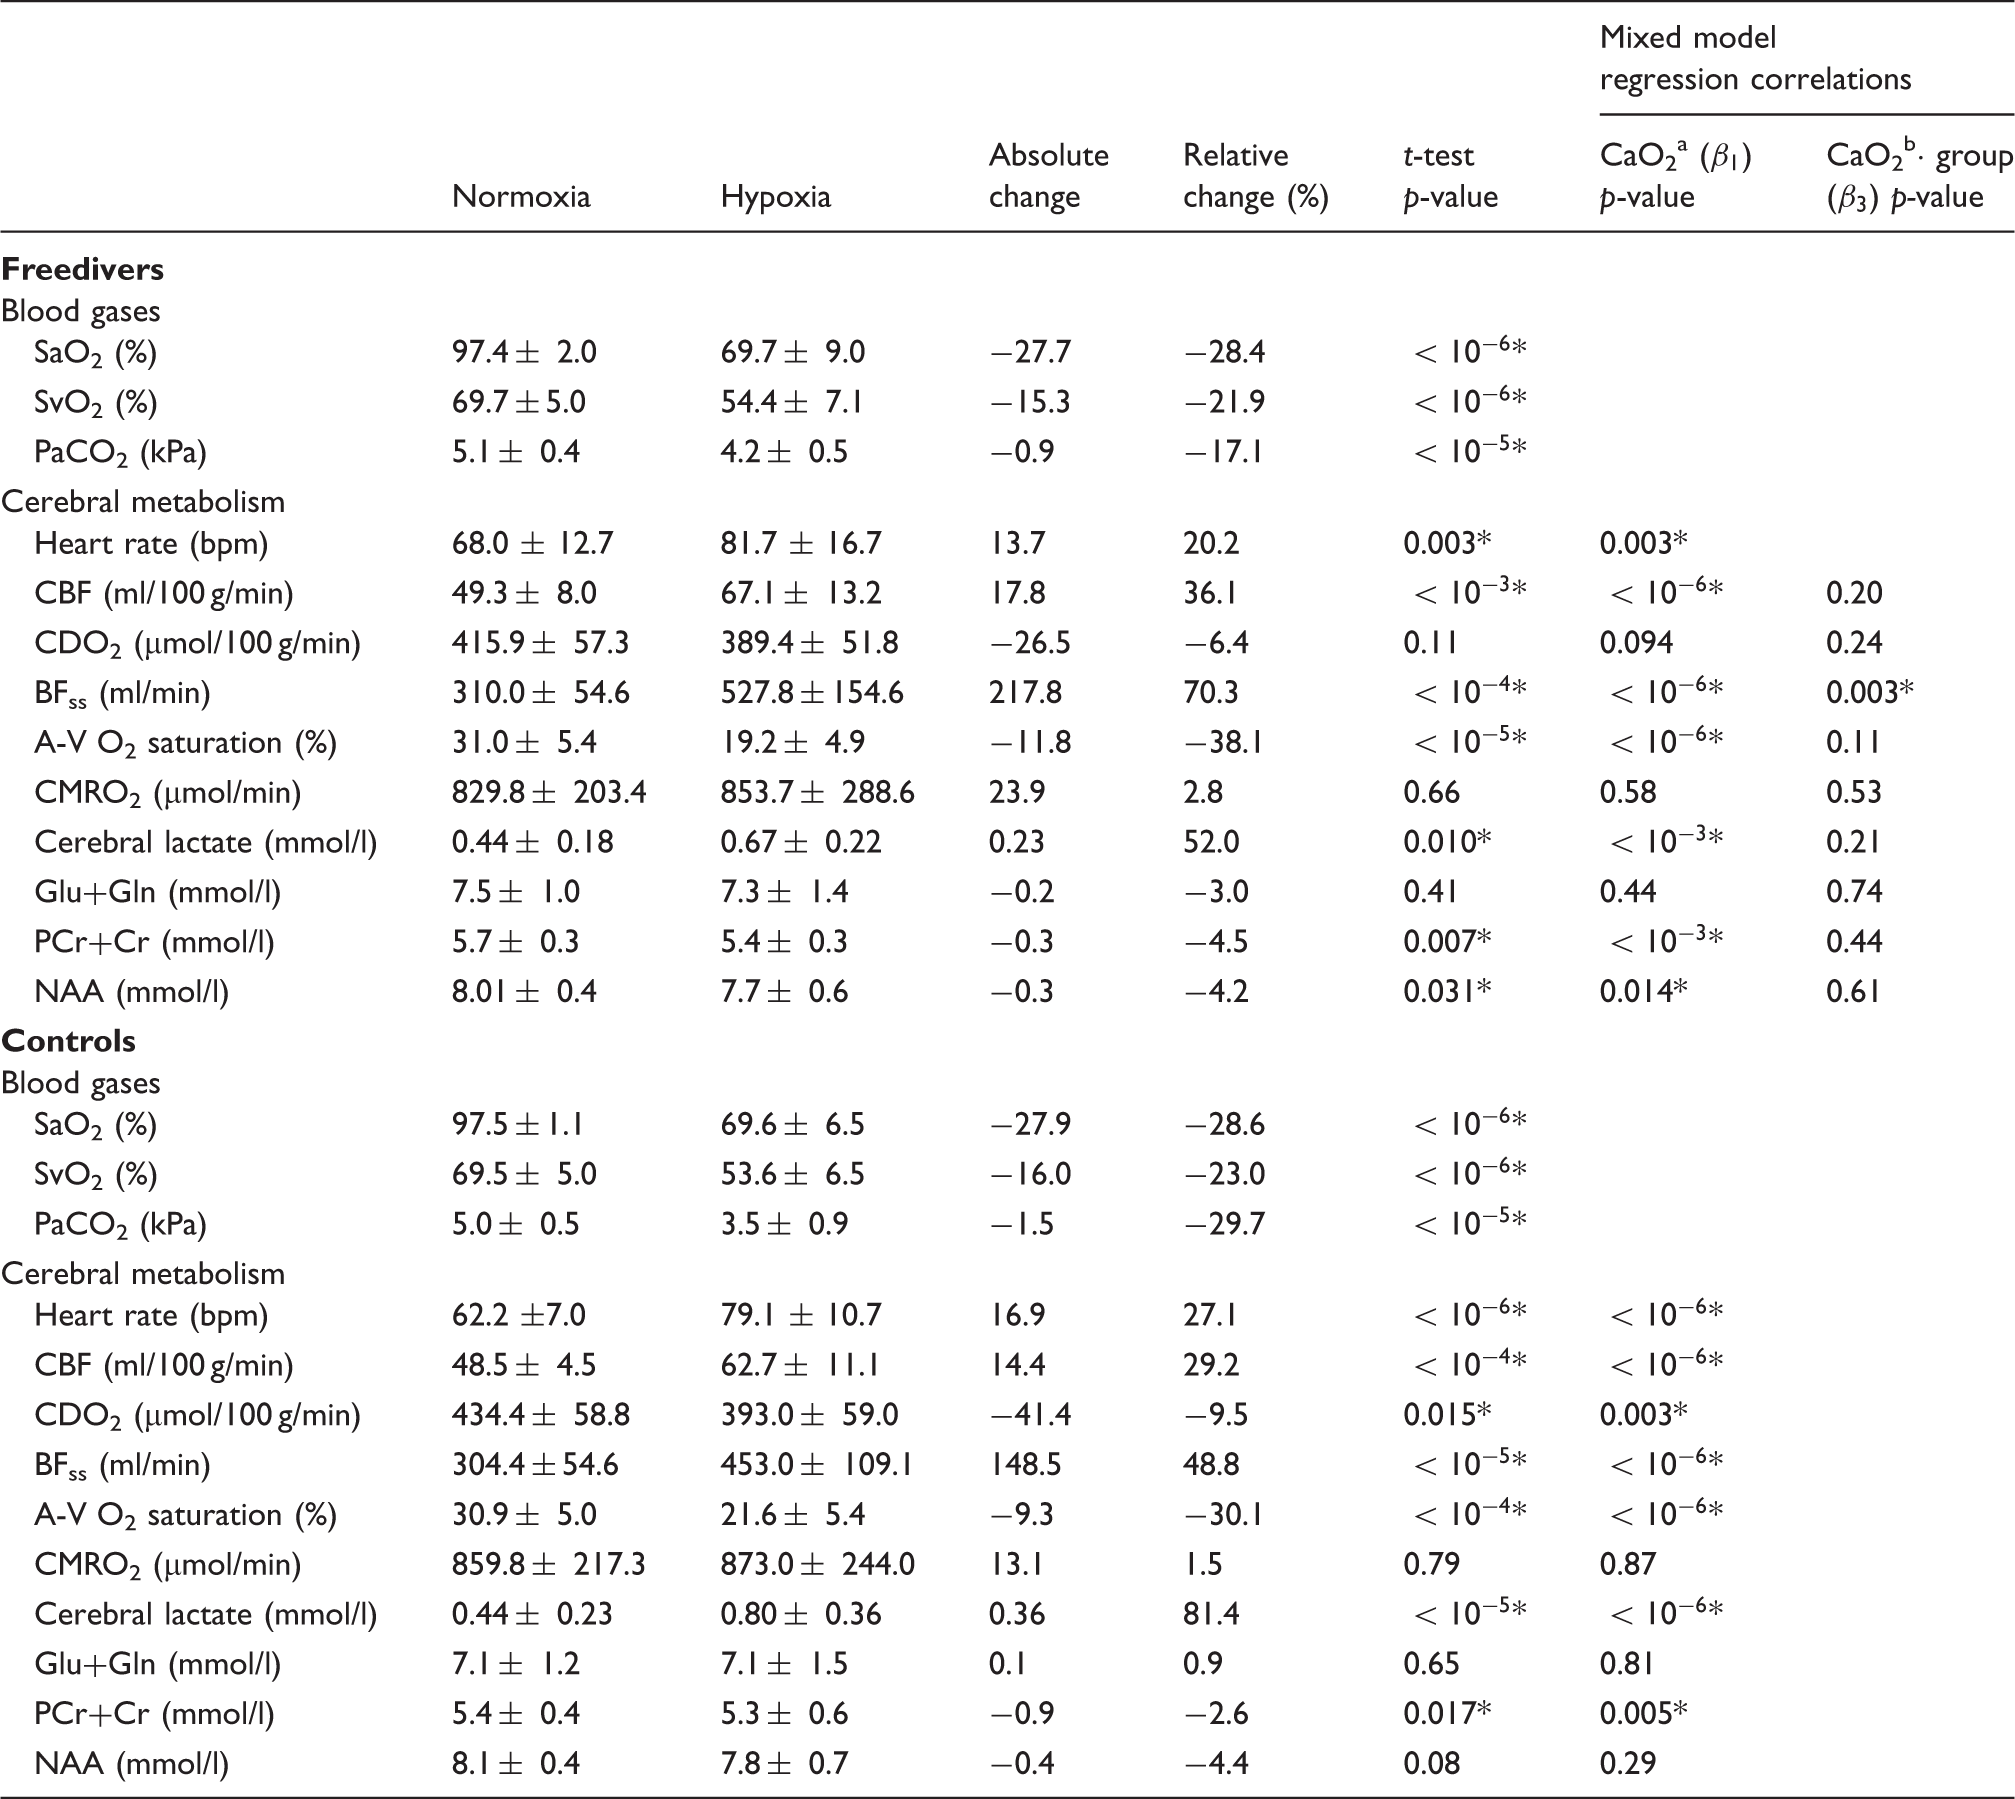
Note: Results are reported as mean±SD.
A statistically significant change (p < 0.05).
p-value for correlation with CaO2 from mixed model linear regression (equation (4)).
p-value for correlation with the interaction term from mixed model (equation (5)) with CaO2, subject grouping and their interaction (
Results
Data collection
In total, 47 BHs were performed by 15 freedivers. Eight BHs were shorter than 2 min 30 s and were excluded from further analysis. This exclusion resulted in 11 BHs during measurement of global CBF and 28 during measurements of combined flow and oxygen saturation in the sagittal sinus for the calculation of CMRO2.
Seventeen non-diver controls performed a total of 30 BHs: 15 corresponding to global CBF measurements, and the remaining 15 corresponding to the combined flow and oxygen saturation CMRO2 calculation.
Fourteen divers and all controls completed the hypoxic challenge. One freediver had pronounced hyperventilation with arterial saturation over 85% during the hypoxic challenge, likely due to discomfort from ventilating through the mask and valves in the oxygen delivery system, and was excluded from further analysis. The same subject also demonstrated pronounced hyperventilation before breath-holding. One control had a bifurcation of the sagittal sinus making it unfeasible to measure SvO2. Measurements of BFss, A-V O2 saturation and CMRO2 were excluded from this subject.
Blood gases
The mean duration of all the BHs performed by the freedivers was 3 min 50 s±1 min 5 s (range=2 min 32 s to 7 min 0 s) and 1 min 9 s±26 s (range=42 s to 2 min 19 s) for the non-diver controls. On average, the arterial oxygen saturation decreased significantly to 75.3%±13.2% (range=43.6–94.7%) in the BHs from the freedivers (Figure 2(a) and (e)). The arterial oxygen saturation at the end (or a few seconds after the end) of the BHs decreased to less than 60% for seven divers and decreased to less than 50% for two divers. In the non-divers, the arterial saturation decreased slightly for two subjects and was unchanged for the remaining subjects (Figure 2(b) and (f)).
The average end-tidal CO2 was 4.8±0.8 kPa (range=2.7–6.0 kPa) before the BH and 5.1±1.0 kPa (range=3.2–7.0 kPa) immediately after the BH in the freedivers, and these values in the non-divers were 5.0±0.5 kPa (range=4.2–6.2 kPa) and 5.2±0.6 kPa (range=4.0–7.0 kPa), respectively (Figure 2(k) and (l)).
The heart rate decreased gradually throughout the BH in the freedivers but increased immediately before and after the BHs (Figure 2(g) to (j)).
Cerebral blood flow
The mean duration of the freedivers’ BHs during the measurement of the global CBF was 4 min 2 s±1 min 0 s (range=2 min 43 s to 6 min 4 s) and the arterial saturation decreased on average to 78.3%±9.6% (range=56.8–93.0%). The global CBF increased significantly by 107.8% from 40.2 ± 12.5 ml/100 g/min before the BH to 81.1± 24.1 ml/100 g/min at the very end of the BH (Figure 3(a) and (c)). During the initial phase of the BHs, CBF decreased significantly by 30.6%. The three longest BHs lasted 4 min 47 s, 4 min 59 s, and 6 min 4 s, and revealed increases in CBF of 137%, 165% and 132%, respectively.
The mean duration of the BHs of the non-diver controls was 1 min 7 s±26 s (range=42 s to 1 min 56 s). The global CBF increased significantly by 25.6% from 49.7 ± 6.2 ml/100 g/min before the BH to 62.0 ± 8.1 ml/100 g/min at the end of the BH (Figure 3(b) and (d)). During the initial phase of the BHs, CBF also decreased significantly for the controls by 19.3%. The two longest BHs for the controls were both 1 min 56 s and CBF increased by 47.4% and 47.2%. The increased CBF compensated for desaturation, and caused increased CDO2 throughout the BHs for both freedivers and controls (Figure 3(e) to (h)).
For both the freedivers and non-diver controls, CBF decreased immediately after the end of BHs and normalized in less than 1 min (Figure 3(c) and (d)).
The rates at which CBF increased during the early phase of the BHs were significantly lower in the freedivers than the non-divers (p=0.0058) (Figure 3(i)).
Cerebral metabolic rate of oxygen
Examples of time series of BFss, A-V O2 saturation and calculated CMRO2 for a BH from a freediver with an average duration (4 min 8 s), and for the longest BH (duration=7 min 0 s) are shown in Figure 4. The mean duration of the BHs when measuring CMRO2 was 3 min 44 s±1 min 5 s (range=2 min 32 s to 7 min 0 s), and the average lowest arterial saturation was 74.1±14.4% (range=43.6–94.7%). BFss increased significantly by 115.0% from 250.6±65.3 ml/min to 525.5±120.1 ml/min (Figure 5(a) and (d)). The A-V O2 saturation decreased significantly by 54.4% from 34.2 ± 11.3% before the BH to 15.5±6.8% at the very end of the BHs (Figure 5(g) and (j)). CMRO2 was sustained throughout the BHs (Figure 5(m) and (p)).
Example of concurrent measurement of blood flow in the sagittal sinus (blue line) and A-V O2 saturation (green) from the sagittal sinus and CMRO2 (black) calculated from Fick’s principle for an average freediver breath-hold (duration=4 min 8 s) (a) and for the longest freediver breath-hold (duration=7 min 0 s) (b). The raw time series (thin line) and the low-pass mean filtered time series (thick line) are shown. Time series of BFss, A-V O2 saturation and CMRO2 during breath-holds. Time series of blood flow in the sagittal sinus (a), arteriovenous oxygen saturation difference (g) and CMRO2 for breath-holds longer than 2 min 30 s from freedivers (n = 28) (m), for breath-holds longer than 4 min from freedivers (n = 9) (b,h,n) and for non-diver controls (n = 15) (c, i, o). Mean (black) and standard deviation (blue shade) of interpolated time-series with indication of significant differences (black star) for blood flow in the sagittal sinus (d), A-V O2 saturation(j) and CMRO2 (p) for all breath-holds from freedivers, for breath-holds over 4 min from freedivers (e,k,q) and from non-diver controls (f, l, r).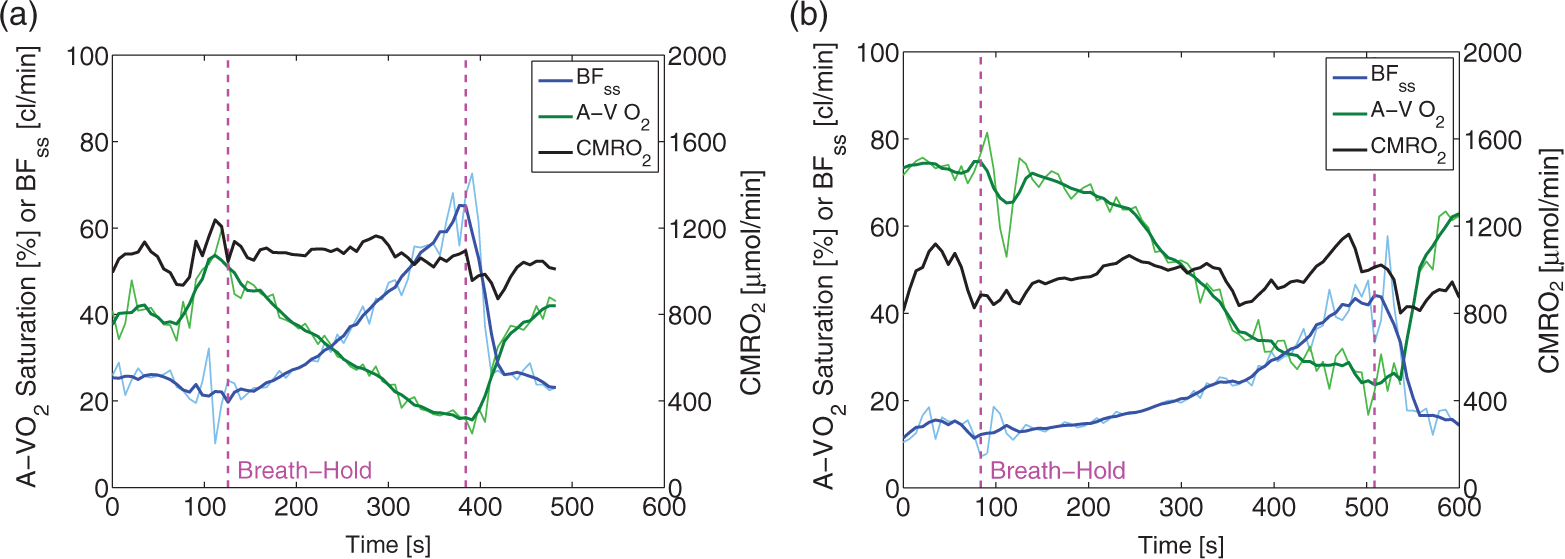
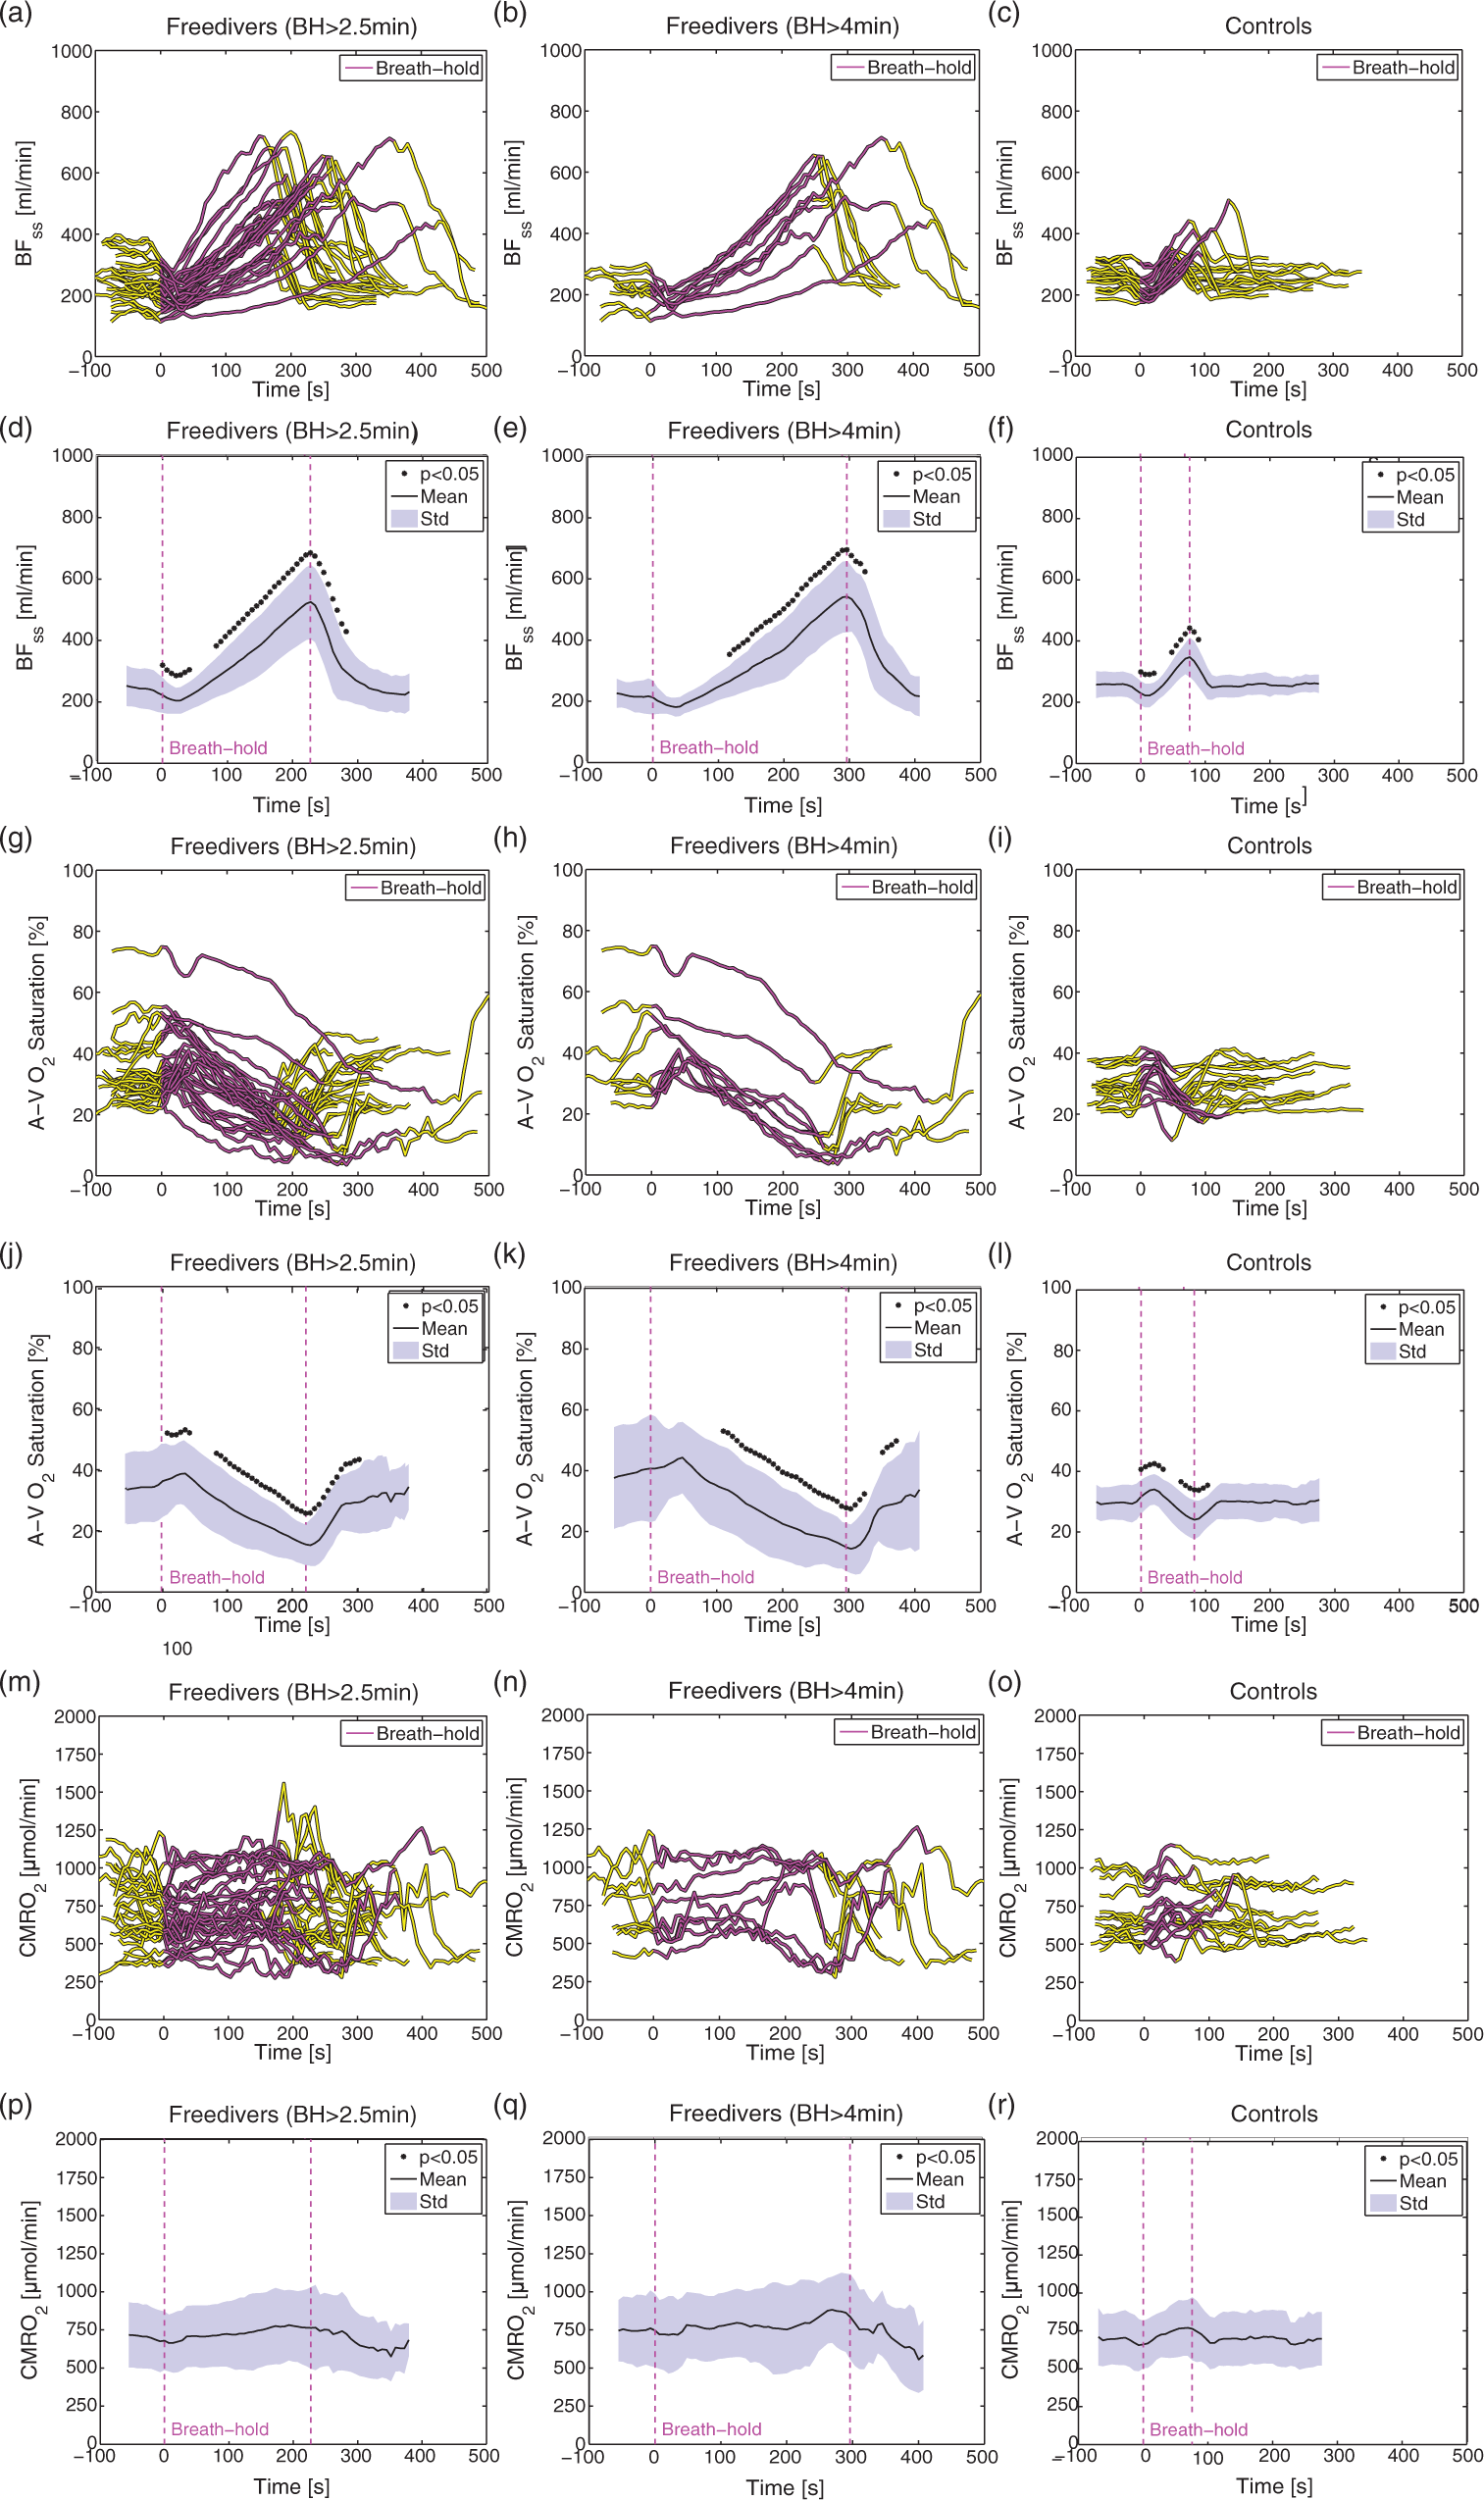
When only BHs over 4 min were included in the analysis, nine BHs remained, with an average duration of 4 min 56 s±1 min 6 s (range=4 min 8 s to 7 min 0 s), and the average lowest arterial saturation was 59.3±11.3% (range=43.6–80.0%). For these BHs, BFss increased by 144% from 226.0±49.3 ml/min to 542.1±116.6 ml/min, and A-V O2 saturation decreased by 60.8% from 37.8±16.5% to 14.7±7.9% (Figure 5(b), (e), (h) and (k)). CMRO2 remained unaffected (Figure 5(n) and (q)).
In non-divers, the mean BH duration was 1 min 12 s±27s (range=48 s to 2 min 19 s), and BFss increased significantly by 35.6% (Figure 5(c) and (f)), the A-V O2 saturation decreased significantly by 18.8% (Figure 5(i) and (l)), at the end of the BHs and CMRO2 was unchanged (Figure 5(o) and (r)).
The results of breath-holding are summarized in in the supplementary material (Table S1).
Hypoxic challenge
The results of the hypoxic challenge are shown in Table 1. Baseline normoxia CMRO2 scaled to global CBF and normalised to individual brain volumes yielded on average 129.8±18.6 µmol/100 g/min for the freediver group and 136.9±27.0 µmol/100 g/min for the non-diver group, which compare favourably with previous published values.13,17,24
We observed increased global CBF, BFss and lactate concentration, decreased PCr+Cr concentration, and unaffected CMRO2 and Glu+Gln concentration (Figure 6). The mixed model regression showed significant negative correlations between global CBF, BFss, lactate concentration, and CaO2 and a significant positive correlation between PCr+Cr and CaO2 for both freedivers and controls.
Results from hypoxic challenge. Global CBF (a), CDO2 (b), BFss (c), A-V O2 saturation (d), CMRO2 (e) and lactate, (f) PCr+Cr, (g), Glu+Gln (h) and NAA (i) concentrations in the occipital lobe during normoxia (blue dots) and during the hypoxic challenge (red dots). Correlations between the parameters and CaO2 from the mixed model linear regression are shown as black dotted lines. P-values and regression-coefficients (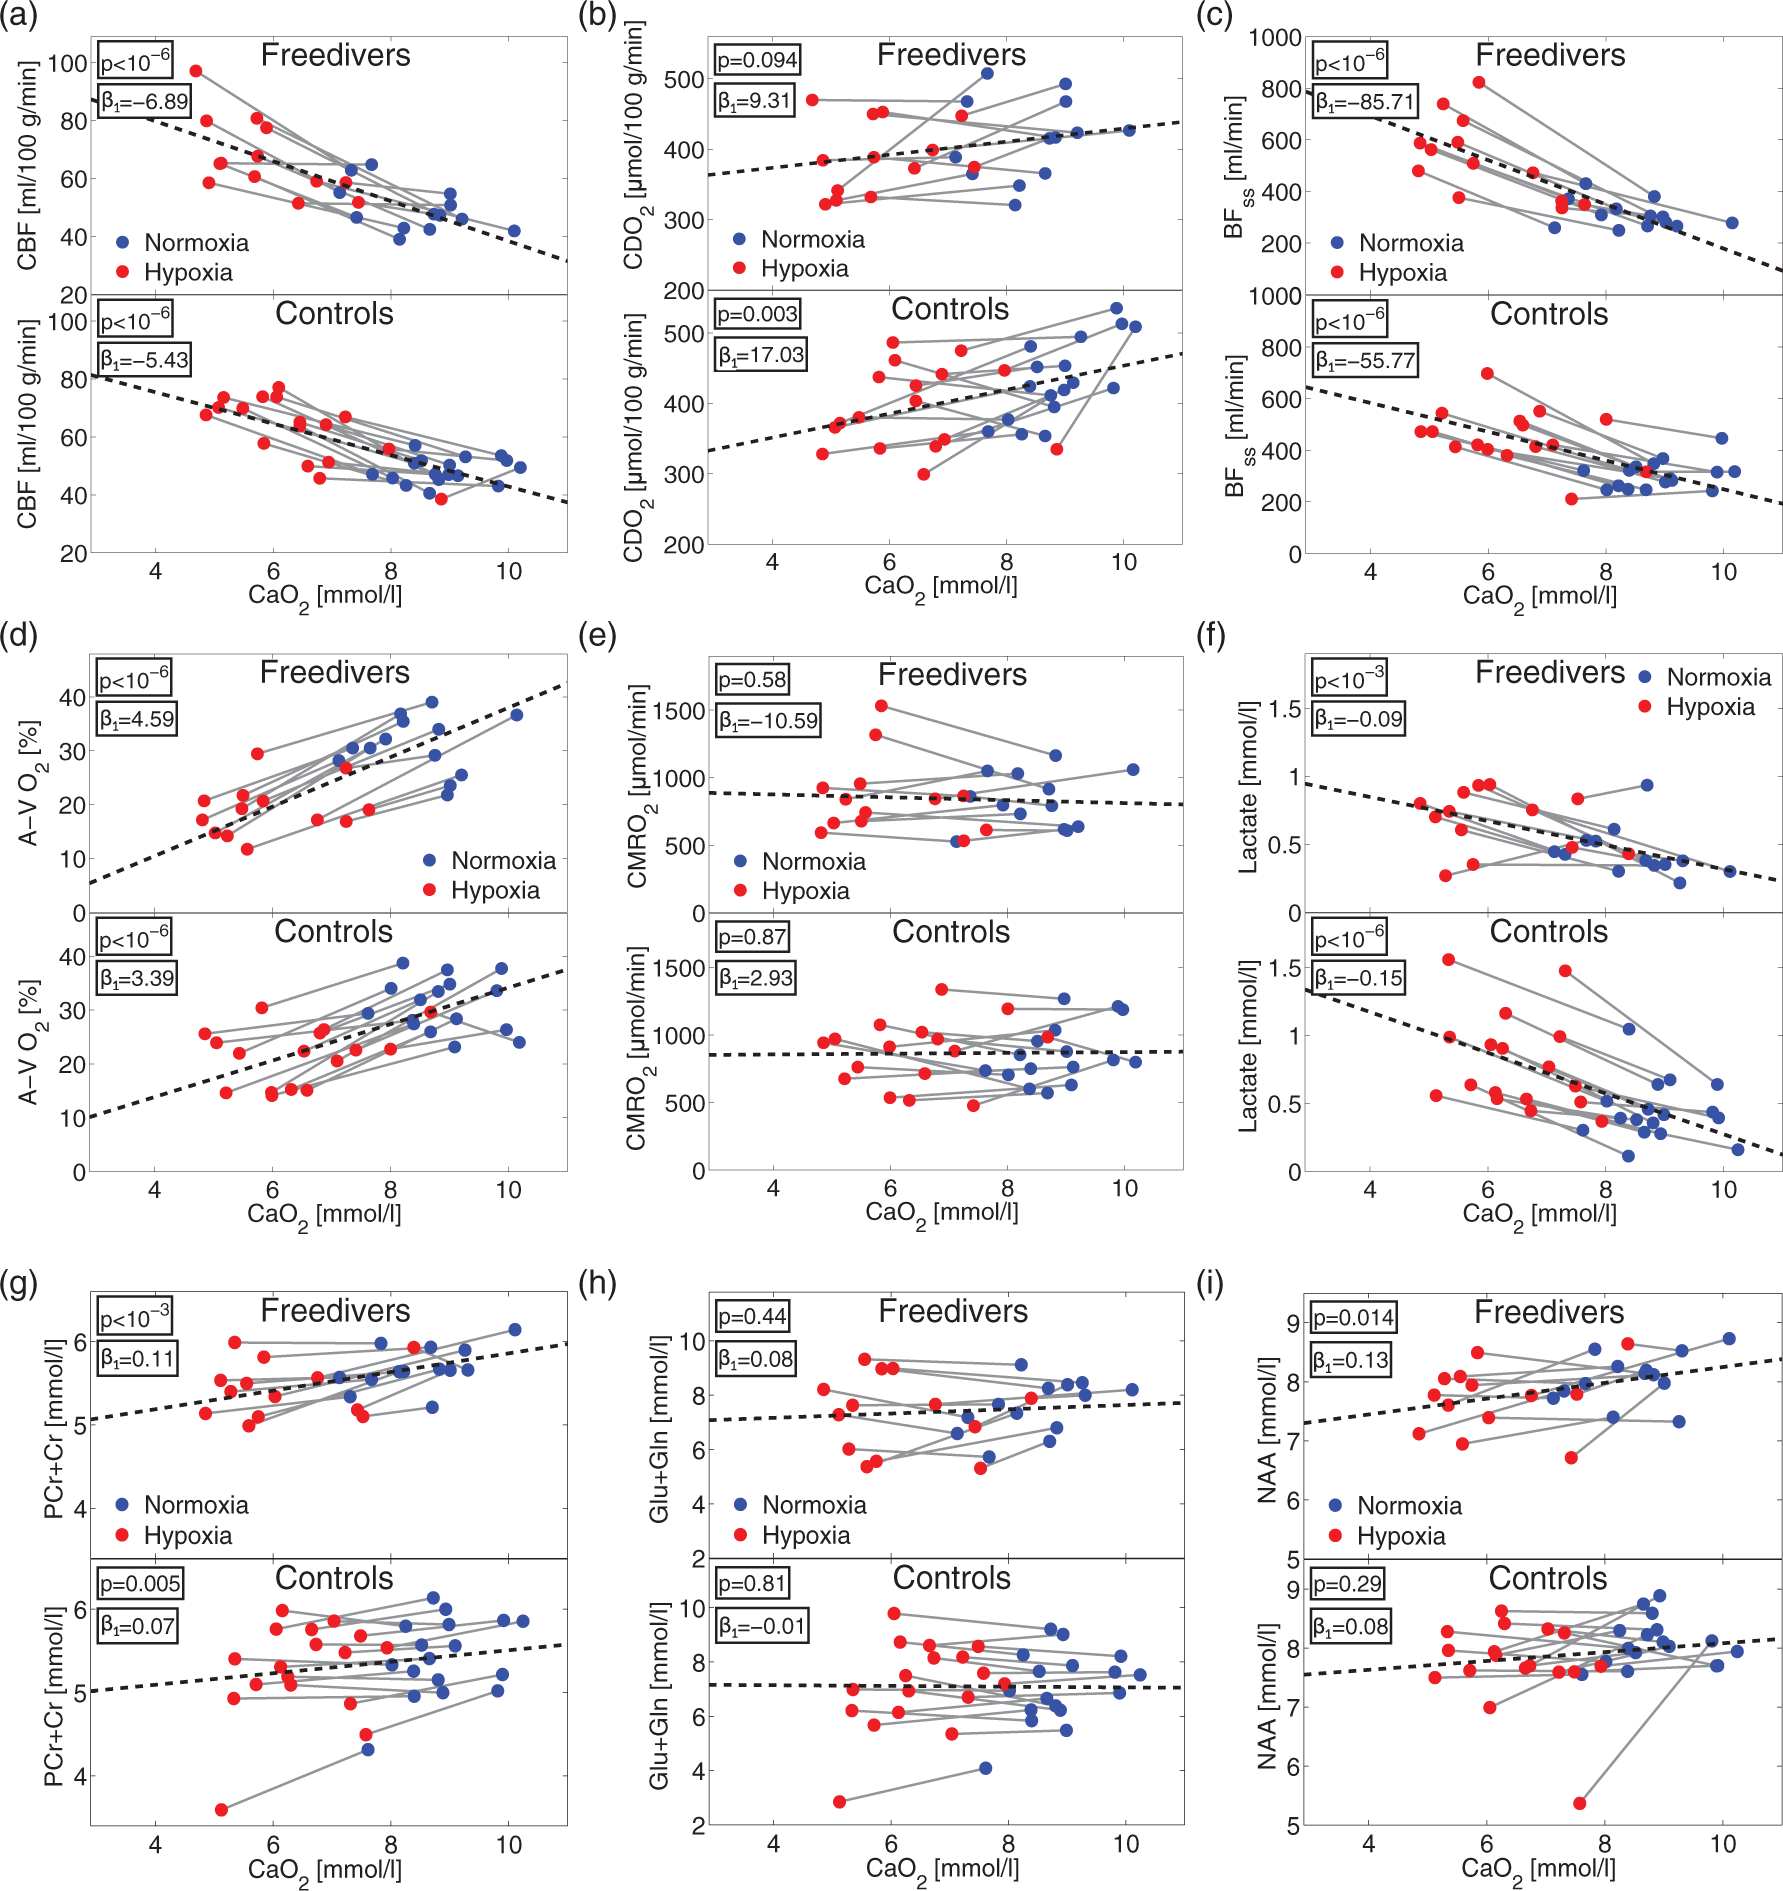
NAA concentration was significantly positively correlated with CaO2 (p = 0.014) in freedivers but not in controls. CDO2 was significantly positively correlated with CaO2 in the non-divers (p = 0.003) but was unaffected in the freedivers (p = 0.094). Comparisons of the correlation with CaO2 (the interaction parameter
Discussion
Despite being in an unfamiliar and dry environment, the freedivers were still able to demonstrate extraordinary long BHs. During most BHs, the effect of the diver reflex was apparent as a slowing of the heart rate. The arterial oxygen saturation was highly dependent on the duration of the BH, and decreased to remarkably low values for long BHs.
End-tidal CO2 was only marginally increased after the BH. This result is probably due to the measurement setup, which was not ideal for measuring CO2 from a single expiration because the expired air was not collected in a bag but instead analysed continuously. A more elaborate setup with arterial blood sampling or collection of expired air was not possible in the MRI-scanner environment. Previous studies on arterial blood gases in freedivers have shown an average increase in arterial CO2 tension of approximately 50% by blood sampling at the end of extended BHs. 29 This is probably an accurate depiction of the level of hypercapnia during the extended BHs.
Cerebrovascular reactivity
Freedivers presented remarkable increases in CBF throughout the entire BH, resulting in on average a more than two-fold increase of CBF. The elevated CBF compensated for the decreased oxygen content in the blood, maintaining the oxygen delivery to the brain. Additionally, CMRO2 was not impaired, corresponding to the absence of oxygen deprivation in the brain throughout the BHs. At the beginning of a BH, the arterial oxygen saturation was not decreased. Thus, increase in CBF must have been due to the increasing CO2 tension causing vasodilation. During a BH, when arterial blood began to desaturate, the CVR was further stimulated by hypoxia. In the non-divers, we observed little or no desaturation, and the increased BF must have been due to hypercapnia.
One may speculate that the non-diver controls could be capable of an equal elevation in CBF, as was seen in the freedivers, and that the main difference with freedivers is due to their ability to suppress the CO2 stimulus to breathe. This in turn enables them to prolong the BH into more severe state of hypercapnia and hypoxia. However, we did find a correlation between the rate at which the CBF increases and the duration of the BH. For long BHs, the rate at which CBF increased was smaller, especially at the beginning of the BH (Figure 3(i)). This may explain the differences in regulation of CBF between the freedivers and controls. If the non-divers were able to prolong their BHs, the CBF would increase at a higher rate and reach maximal CBF sooner than in the freedivers. It is not clear why the freedivers had a slower rate of increase in CBF. The freedivers could have a less sensitive vasodilating response to hypercapnia, which traditionally means a reduced reactivity. On the contrary, during the hypoxic challenge, the freedivers had the same or slightly higher increases in CBF as the controls with normal reactivity. There could be a decline in the selective sensitivity to hypercapnia, but not to hypoxia. The difference in the rate of CBF increase could also be due to difference in end-tidal CO2 in the freedivers (4.6 kPa) before the BH compared to that of the controls (5.1 kPa). The CO2 build-up starts at a lower CO2 tension at the beginning of the BH, the stimulation from pronounced hypercapnia would manifest later during the BH, and the sensitivity to CO2 would not be reduced. We expect that the rate of CO2 build-up was similar between groups as CMRO2 was equal and sustained in both groups. High CVR is positively correlated with brain health and cognitive function, and negatively correlated with a number of diseases, such as small and large vessel brain diseases, including stroke and cognitive decline.2,5–7 It is unclear whether the overall ability of cerebral vasodilation or the selective sensitivity to CO2 or hypoxia is the most important factor for brain health, but in patients with type 2 diabetes, the decrease in CVR is present regardless of the stimulation.6,7 We therefore conjecture that the capacity for vasodilation is an important component for the beneficial effects in the prevention of cerebral decline, and that strengthening the CVR with BHs has potential as a beneficial preventative activity.
Previous studies have quantified CBF and oxygen consumption during BHs by freedivers.29,30 Two studies found that CBF compensated completely for decreased oxygen in the blood, and that the delivery of oxygen to the brain was not impaired. Results are similar to our findings. One study found significantly decreased CMRO2 at the very end of the BH but not during the BH. 30 The authors suggested cause for this decrease is hypercapnia.30,31 In contrast, we did not find decreased CMRO2 in our study. Differences in experimental setup could account for some of the discrepancy, i.e. study by Bain et al. 30 allowed lung packing and had a longer BH preparation phase. Also, study by Bain et al. 30 had on average 1 min longer BHs when comparing with our group of BHs longer than 4 min, which could cause difference in blood gasses at end of breath-holding; however, the average desaturations were similar.
A further reason could be that we found a larger increase in CBF of 107.0% compared to an 80% increase, which will manifest itself in the CMRO2 calculation using Fick’s principle. Methodological differences could also account for the discrepancy observed as we used MRI techniques rather than Doppler ultrasound. Doppler ultrasound is not ideal for measuring quantitative flow, and it presents errors mainly related to user-dependent biases and difficulty measuring the blood velocity and cross-sectional area in all of the feeding arteries simultaneously. On contrary, phase contrast mapping can potentially overestimate the flow quantification due to partial volume errors in small vessels.23,43,44 All of which could account for the inconsistency between the studies.32,33
Breath-hold breakpoint
During freediver competitions, loss of consciousness or motor control can occur. 34 In these situations, there must be insufficient cerebral oxygen delivery and therefore decreased CMRO2. Saturations less than 40–50% will often result in loss of consciousness and neuronal function. In this study, the arterial saturation decreased on average to 59.7% in BHs over 4 min and to less than 50% for two BHs, which we must expect is close to a hypoxic loss of neuronal function, yet in these BHs, the CMRO2 was not decreased. Our data therefore suggest that CMRO2 is sustained until, or very close to, the potential loss of consciousness or neuronal function.
The breaking point of the BH is determined by numerous factors, including lung stretch, volitional cognitive factors, and chemoreceptor stimulation by oxygen and CO2.35–38 For the non-diver controls, increased stimulation from CO2 tension caused a breaking point before any hypoxic stress in the brain. The freedivers, in contrast, seemed to be capable of suppressing the CO2 stimulation to stop the BH and could even continue during hypoxia. For the majority of BHs observed in freedivers, we saw a breaking point before severe hypoxia in the brain, but for the very long BHs, over 4 min, the arterial blood desaturated on average to less than 60%. The ability to reach severe hypoxia during a BH is probably determined by volitional cognitive factors.
By hyperventilating before the BH, freedivers can decrease the CO2 tension in the blood and delay the CO2 drive to end the BH. This capability is often the reason for hypoxic loss of consciousness or motor function because the BH can be extended into dangerous hypoxic levels. 34 In the longest BH in this study lasting 7 min 0 s, the freediver had pronounced hyperventilation before the BH, a feature not observed with the other subjects within the study. This effect was accompanied by low end-tidal CO2, large A-V O2 saturation and low CBF before the BH (Figure 4(b)). The hypocapnic environment from hyperventilation could cause the slow rate of increase in CBF; however, a large A-V O2 saturation was required to account for the low CBF and continued throughout the BH. This BH showed that through hyperventilation, the point of maximal CBF can be substantially delayed to prolong the BH. However, the extraction of oxygen will be increased and make the brain more sensitive to desaturation, thus shortening the BH. There seems to be an advantageous effect from hyperventilation through lowering of the CO2 tension and CBF but an opposite effect from higher oxygen extraction; however, the total effect seems to result in a prolonged BH.
Hypoxic challenge
During the hypoxic challenge, both groups presented increased CBF and BFss. We observed significantly larger BFss in the freedivers when compared to the non-divers, which suggests increased hypoxic reactivity in the freedivers. The freedivers also had a larger increase in global CBF compared to non-divers, but this was not significantly different. The reason we observed significant differences in BFss and not global CBF could be due to relatively greater increases in perfusion in the areas of the brain drained by the sagittal sinus during the hypoxic challenge. The freedivers sustained normal CDO2 during the hypoxic challenge (Table 1, Figure 6(b)), which also suggests increased cerebrovascular reactivity, at least to hypoxic stimulation; however, the mixed model regression showed no significant difference between the freedivers and controls. Both groups showed unchanged CMRO2. Similar studies have previously shown no effect12,13 or small increases in CMRO2 that might be related to different levels of hypocapnia.15–17 The discrepancy with Vestergaard et al. 17 is probably due to the more homogenous ventilatory responses in this study, where the subjects on average demonstrated greater desaturation. The discrepancy with the increased CMRO2 observed by Smith et al. 15 and Xu et al. 16 could also be due to the greater desaturation found in this study.
For both groups, we observed increased lactate concentrations, similar to previously published results. 19 The exact reason for the increased lactate is not obvious as CMRO2 is maintained. It could be hypothesized that lactate is produced by increased glycolysis in astrocytes, a defence mechanism that potentially conserves oxygen for the more oxygen-dependent neurons. We would expect that increased astrocytic glycolysis would cause a decrease in CMRO2, which we did not observe. However, this finding could be because the global CMRO2 measurement is not sensitive enough, and regional variation could not be observed. Additionally, astrocytes only account for 5–15% of the global oxygen consumption,39,40 and a small shift towards glycolysis in astrocytes could be smaller than our detection limit. We did not observe differences in lactate concentrations between the two groups, and therefore found no evidence for a larger shift towards glycolysis as a coping mechanism in freedivers compared to controls.
The NAA concentration was slightly decreased in the freedivers during the hypoxic challenge. NAA is related to neuronal density; thus, we would not expect an effect from this short hypoxic challenge, and we believe the decrease is more likely a result of a blood oxygenation level dependent (BOLD) effect on the measured spectrum from the increased flow than a physiological change during the hypoxic challenge.41,42 A possible BOLD effect will most likely be present in the strongest singlet in the spectrum, e.g. the NAA peak, and negligible in the weaker metabolite peaks.
The Glu+Gln concentrations were unchanged for both groups, and the PCr+Cr concentrations decreased for both groups. Hypoxic challenges have previously been shown to increase glutamate concentration and decrease PCr+Cr, but during additional neuronal simulation, making comparisons with this study difficult. 17 It is hypothesized that the decrease is due to a shift towards creatine kinase-mediated ATP catalysis as a potential coping mechanism during hypoxia.
We found no differences between the freedivers and controls in CMRO2 or lactate, Glu+Gln or PCr+Cr concentrations during the hypoxic challenge and no effect on CMRO2 during the BH. Therefore, the only coping mechanism we found evidence for in freedivers was a remarkable increase in CBF.
Strengths and limitations
The main strength of this study was our ability to measure quantitative blood flow and CMRO2 throughout entire BHs with a high temporal resolution, and our ability to measure quantitative CBF and CMRO2 along with lactate and glutamate concentration during a hypoxic challenge. Furthermore, we had a relatively large group of freedivers and a non-diver control group, who together provided a large number of BHs.
A limitation of this study is the lack of arterial CO2 tension measurements during BHs. Such knowledge on CO2 tension would have provided further insight into the individual characteristics of BHs.
Measurement of flow by phase mapping has potential errors regarding artery geometry in-plane resolution and cardiac pulsation; however, these errors have been shown to be minor with the present setup.23,43,44
A further limitation is that we only measured the global values of CBF and CMRO2, and the values of MRS parameters in the occipital lobe. The combination of position-specific lactate and CMRO2 measurements will be especially advantageous to further examine possible anaerobic glycolysis at a regional level.
Conclusion
The freedivers presented a remarkable increase in blood flow during BHs, while simultaneously maintaining oxygen consumption throughout. However, in the early phase of the BHs, the freedivers demonstrate a slower increase in CBF compared to controls. This difference could be due to hyperventilation before breath-holding or decreased sensitivity to hypercapnic vasodilation. During the hypoxic challenge, the freedivers, unlike the controls, sustained CDO2. Additionally, we observed greater increases in blood flow in the sagittal sinus but found no evidence for differences in the lactate production, CMRO2, Glu+Gln or PCr+Cr concentrations when comparing freedivers to controls. We conclude that the main coping mechanism against hypoxia in freedivers is a remarkable aptitude for increasing CBF with no evidence for increased lactate-producing glycolysis compared to controls.
Footnotes
Funding
The author(s) received no financial support for the research, authorship, and/or publication of this article.
Acknowledgements
We express our gratitude to the freedivers who participated in the study and to Københavns Fridykkerklub. We also thank Helle Juhl Simonsen for assistance with blood sampling and analysis.
Declaration of conflicting interests
The author(s) declared no potential conflicts of interest with respect to the research, authorship, and/or publication of this article.
Authors’ contributions
MBV and HBWL designed the experiment, conducted the data processing and analysis, and wrote the manuscript. MBV collected the data. Both authors approved the final version of the manuscript.
Data availability
The data derived from the MRI-images and all other data supporting the findings of this study are available from the corresponding author upon request.
References
Supplementary Material
Please find the following supplemental material available below.
For Open Access articles published under a Creative Commons License, all supplemental material carries the same license as the article it is associated with.
For non-Open Access articles published, all supplemental material carries a non-exclusive license, and permission requests for re-use of supplemental material or any part of supplemental material shall be sent directly to the copyright owner as specified in the copyright notice associated with the article.