
Abstract
The purpose of this study was to establish the dynamics of nitrotyrosine (NO2-Tyr) formation and decay during the rise of NO2-Tyr in rat brain subjected to 2-hour focal ischemia-reperfusion, and to evaluate the role of inducible nitric oxide synthase in the rise. The authors first determined the half life of NO2-Tyr in rat brain at 24 hours after the start of reperfusion by blocking NO2-Tyr formation with NG-monomethyl-
Peroxynitrite, a potent oxidant generated by the reaction of nitric oxide (NO) and superoxide (Beckman et al., 1990), is implicated in diverse pathologic conditions (Miller et al., 1995; Shigenaga et al., 1997). It has a very short half-life in vivo and is usually measured in terms of the formation of 3-nitro-
MATERIALS AND METHODS
Animal preparation for focal cerebral ischemia-reperfusion
The surgical preparation of the animals has been described in detail previously (Fukuyama et al., 1998). Briefly, transient focal cerebral ischemia was induced in halothane-anesthetized male Sprague-Dawley rats weighing 300 to 350 grams (n = 106) by a 2-hour temporary occlusion of the right middle cerebral artery (MCA) with two microaneurysm clips, combined with permanent ligation of the ipsilateral common carotid artery (Tamura et al., 1981; Hogan and Hakim, 1992). Mean arterial blood pressure, brain and rectal temperatures, arterial gases, blood glucose level, and hematocrit were systematically monitored. The rats were killed at the indicated times in each group, then the brain was removed and cut into four cross-sections. The parts corresponding to the core of infarct in the cortex, the peri-infarct region in the cortex, the caudoputamen, and the noninfarct region in the cortex were taken.
Measurement of cerebral blood flow
Regional CBF (n = 7) was measured by the hydrogen clearance method in parallel with the NO2-Tyr experiments. Four burr holes were drilled in the skull 4.5 mm lateral to the right and 3 mm posterior to the bregma, 4.5 mm lateral to the left and 3 mm posterior to the bregma, 3 mm dorsal to the site of MCA occlusion on an anteroposterior level with the bregma, and 3.0 mm lateral to the left and 0 mm posterior to the bregma, which correspond to noninfarct, peri-infarct, core of infarct, and caudoputamen. Four platinum electrodes, 0.2 mm in diameter and 3 mm in length (6 mm for the caudoputamen), were inserted through the burr holes. The CBF was calculated from the hydrogen clearance curve obtained after a 1-minute administration of 10% hydrogen gas mixture (Aukland et al., 1964).
Hydrolysis of brain tissue and NO2-Tyr analysis by HPLC
Brain sections were homogenized with 500 µL of Milli-Q water and hydrolyzed (Tsugita and Scheffler, 1982). Homogenized tissue was incubated at 110°C for 24 hours in a vessel rack containing 6 N HCl and 0.1% phenol, which was added to avoid artifactual formation of NO2-Tyr during acid hydrolysis in the presence of nitrite or nitrate (Shigenaga et al., 1997). Separation of NO2-Tyr was achieved by HPLC on a Nucleosil 5-µm C-18 reverse-phase column eluted with 50 mmol/L KH2PO4H3PO4 (pH 3.01) containing 10% methanol, with ultraviolet detection at 274 nm. The NO2-Tyr peak was identified by comparison of its retention time with that of authentic NO2-Tyr. The NO2-Tyr data were expressed as ratios of NO2-Tyr to total tyrosine (Fukuyama et al., 1998).
Experimental protocol for determination of half-life of NO2-Tyr
To examine the degradation dynamics of accumulated NO2-Tyr, 25 rats were given 50 mg/kg of L-NMMA intraperitoneally at 24 hours after the start of reperfusion after a 2-hour occlusion to immediately halt the production of peroxynitrite. The rats were killed at 0, 3, 6, 9, and 12 hours (n = 5 in each group) after the administration of L-NMMA. The brain was cut into four cross-sections, in which NO2-Tyr was measured by HPLC in the same manner as above, The decay curves of NO2-Tyr were fitted by a nonlinear regression, and the half-life (T1/2) of NO2-Tyr in each region was calculated.
Experimental protocol for measuring NO2-Tyr during ischemia-reperfusion and the effect of aminoguanidine
Animals were divided into an ischemia-reperfusion group (n = 48) and an ischemia-reperfusion with aminoguanidine (AG) treatment group (n = 26). Rats in the ischemia-reperfusion group underwent a 2-hour occlusion followed by reperfusion and were killed at the indicated times for NO2-Tyr measurement: just before the occlusion of the left MCA (n = 6), at the end of the 2-hour occlusion (n = 7), and at 1, 6, 24, 48, and 72 hours after the start of reperfusion (n = 7 in each group). Rats in the AG-treated group, in which aminoguanidine hemisulfate (Sigma Chemical Co., St. Louis, MO, U.S.A.; 100 mg/kg in 1 mL of saline) was given intraperitoneally twice a day (at 9:00 and 19:00), starting from just after reperfusion until an indicated time (Iadecola et al., 1995), underwent the same ischemia-reperfusion procedure and were killed at 6, 24, 48, and 72 hours after the start of reperfusion (n = 6, 7, 7, and 6).
Statistical analysis
The statistical significance of the differences in NO2-Tyr and CBF among the regions in each group was analyzed by use of the Wilcoxon signed-ranks test. The statistical significance of the differences in NO2-Tyr in each region among groups, and in physiologic parameters among the three groups, was analyzed by one-way analysis of variance followed by Fisher's protected least significant difference. All values were expressed as mean ± SD.
RESULTS
Physiologic parameters at preischemia were as follows in the ischemia-reperfusion group (n = 48), AG-treated group (n = 26), and CBF-study group (n = 7): MABP, 104 ± 9, 103 ± 10, and 104 ± 8 mm Hg; brain temperature, 36.3°C ± 0.5°C, 36.5°C ± 0.6°C, and 36.2°C ± 0.4°C; rectal temperature, 37.3°C ± 0.6°C, 37.4°C ± 0.4°C, and 37.9°C ± 0.4°C, respectively. Although there were statistically significant changes in some parameters, including brain temperature at 30 minutes after reperfusion, rectal temperature at preischemia, and Po2 and glucose levels at preischemia and at 30 minutes after reperfusion, these changes were all within the ranges of normal physiologic responses and are considered unlikely to have materially affected the conclusions of this study. Cerebral blood flow during preischemia, occlusion, and reperfusion in the four regions were sequentially measured. In the noninfarct region CBF remained unchanged. In the peri-infarct region, CBF was significantly reduced to 31 ± 15 mL·100 g−1·min−1 immediately after occlusion, remained low at 30 minutes after occlusion (27 ± 14 mL·100 g−1·min−1), and then returned to the preocclusion level with reperfusion (74 ± 34, 79 ± 24, and 77 ± 28 mL·100 g−1·min−1 at 5, 60, and 180 minutes after the start of reperfusion, respectively). The decreases in CBF at 0 minutes of occlusion in the core-of-infarct region (16 ± 5 mL·100 g−1·min−1) and caudoputamen (12 ± 5 mL·100g−1·min−1) were significantly greater than that in the peri-infarct region. Furthermore, the recovery of CBF with reperfusion in both regions tended to be less than that in the peri-infarct region. In particular, the CBF at 180 minutes in the caudoputamen (57 ± 24 mL·100 g−1·min−1) remained impaired compared with that in the peri-infarct region.
Figure 1 shows the decrease in NO2-Tyr with time in the four regions when 50 mg/kg of L-NMMA was injected at 24 hours after the start of reperfusion to halt further production of NO2-Tyr. The NO2-Tyr levels in all four regions declined with time, reaching the limit of detection within 3 hours in the noninfarct region and caudoputamen and within 9 hours in the peri-infarct and the core-of-infarct regions. The degradation curves of NO2-Tyr in the peri-infarct and the core-of-infarct regions were fitted by a nonlinear regression method (y = 2.91 × e(−x/403) and y = 1.94 × e(−x/6.77)), and the T1/2 values of NO2-Tyr were obtained as 2.2 and 2.3 hours, respectively. The T1/2 values of NO2-Tyr in the noninfarct region and caudoputamen could not be determined because the values were too low to be fitted reliably to a nonlinear regression equation.
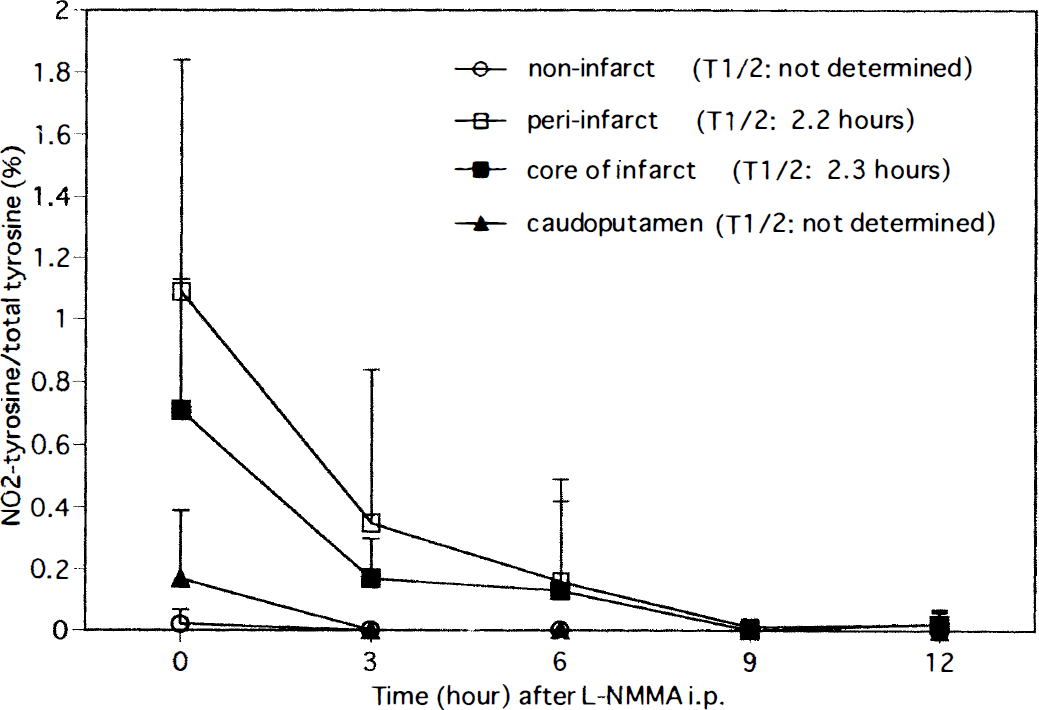
The degradation of accumulated NO2-Tyr. L-NMMA was injected 24 hours after the start of reperfusion to halt further production of NO2-Tyr. The T1/2 values of NO2-Tyr in the peri-infarct and core-of-infarct regions are 2.2 and 2.3 hours, respectively.
Figure 2 shows the serial changes in NO2-Tyr levels after transient focal ischemia and reperfusion. In the peri-infarct region, NO2-Tyr levels were elevated slightly at 2 hours after occlusion and markedly at 1 hour after the start of reperfusion, then remained high until 48 hours (0.40% ± 0.35% at 2 hours of occlusion, 0.95% ± 0.34%, 1.21% ± 0.71%, 0.97% ± 0.76%, and 1.42% ± 1.09% at 1, 6, 24, and 48 hours of reperfusion, respectively). These values were significantly higher than that before occlusion (one-way analysis of variance, P < 0.01). At 72 hours, the NO2-Tyr level was reduced to 0.32% ± 0.24%, which was not significantly different from that in the noninfarct region. The NO2-Tyr levels in the core-of-infarct region were also increased, and the time course of the elevation was identical to that in the peri-infarct region. In contrast, NO2-Tyr levels in the caudoputamen and the noninfarct region were not significantly increased throughout ischemia-reperfusion compared with those before occlusion, although those at 48 hours tended to be increased (one-way analysis of variance, P = 0.07). In terms of the regional difference in NO2-Tyr among the four regions during reperfusion, the NO2-Tyr level was highest in the peri-infarct region, second highest in the core-of-infarct region, and lowest in the caudoputamen and the noninfarct region (Wilcoxon signed-ranks test, P < 0.05).
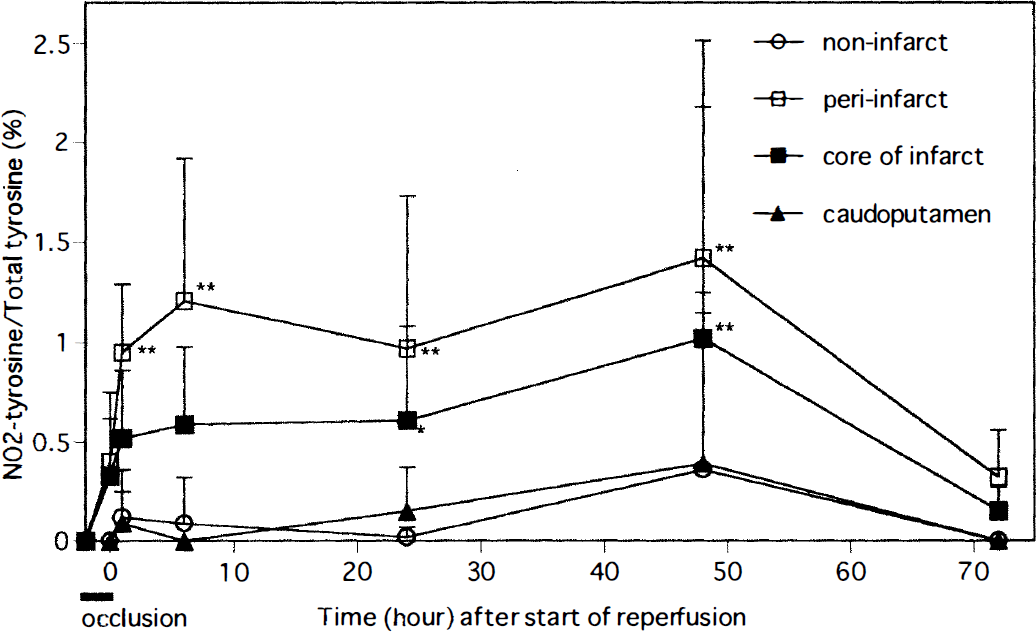
Time course of NO2-Tyr formation in various regions during ischemia-reperfusion. In the peri-infarct region, NO2-Tyr levels were significantly increased 1, 6, 24, and 48 hours after the start of reperfusion (**P < 0.01 compared with that before occlusion), but declined at 72 hours. NO2-Tyr levels in the core-of-infarct region were also significantly elevated at 24 and 48 hours (*P < 0.05, **P < 0.01 compared with that before occlusion), and also declined at 72 hours. In contrast, the NO2-Tyr levels in the caudoputamen and noninfarct regions were not increased throughout the ischemia-reperfusion period.
Figure 3 shows the effect of AG on NO2-Tyr levels in the peri-infarct region. Aminoguanidine treatment significantly reduced the NO2-Tyr levels at 6, 24, and 48 hours after the start of reperfusion in the peri-infarct region, compared with those in the ischemia-reperfusion group. As the increase in NO2-Tyr was not significant at 72 hours, no effect of AG was observed at 72 hours. In the core-of-infarct region, NO2-Tyr levels were also decreased at 6 and 24 hours, compared with those in the ischemia-reperfusion group (data not shown).
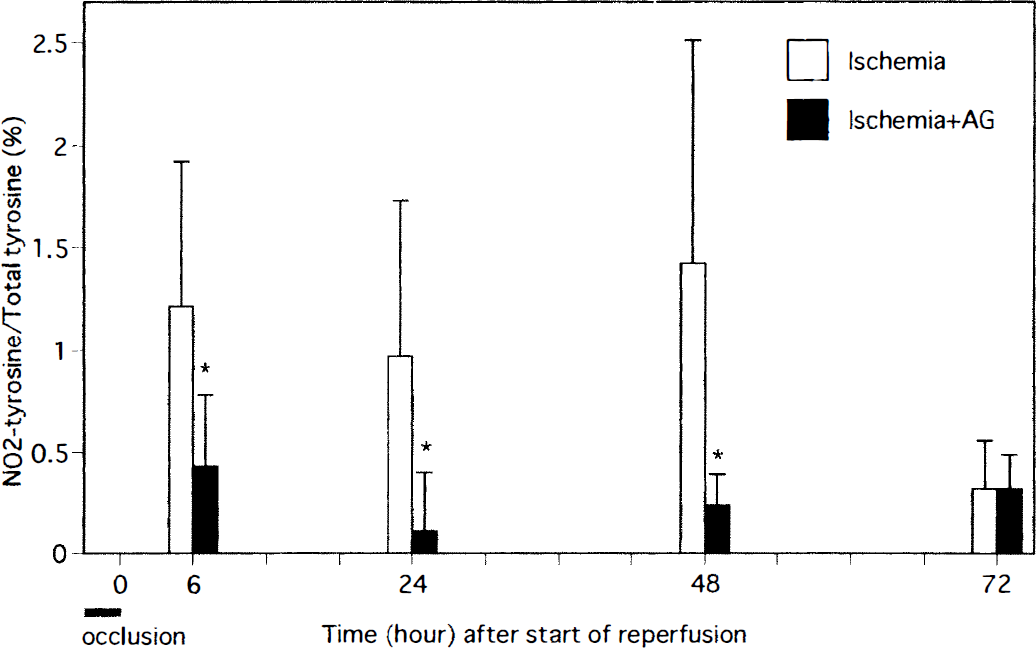
The effect of AG on NO2-Tyr levels in transient focal ischemia. Significant reductions in NO2-Tyr levels were observed 6, 24, and 48 hours after the start of reperfusion, but not at 72 hours, in peri-infarct region of the AG treatment group (* P < 0.05, compared with ischemia-reperfusion group).
No peak of chlorotyrosine (Cl-Tyr) was identified in the chromatogram of any of the samples obtained from brain tissues by comparison of the retention time with that of authentic Cl-Tyr, which is located between the peaks of authentic tyrosine and NO2-Tyr (data not shown).
DISCUSSION
The main findings of this study were that (l) NO2-Tyr increases in the region rendered ischemic and then reperfused; (2) the T1/2 of NO2-Tyr is approximately 2 hours when further generation of NO2-Tyr is halted with L-NMMA; (3) generation of NO2-Tyr starts during the ischemic period, increases after reperfusion, peaks at 48 hours, and then declines up to 72 hours; (4) the NO2-Tyr level is highest in the peri-infarct region, second highest in the core-of-infarct region, and lowest in the caudoputamen and the noninfarct region; and (5) AG reduces the generation of NO2-Tyr at 6, 24, and 48 hours after the start of reperfusion.
The formation of NO2-Tyr is considered to be the footprint of peroxynitrite-mediated damage in. vivo, because peroxynitrite forms nitrates of phenols and tyrosine, which are the most abundant phenolic compounds in cells and tissues (Beckman, 1994; Kooy et al., 1995; Smith et al., 1997). Thus, our findings imply that production of both superoxide and NO increases during ischemia, and especially ischemia-reperfusion, in the brain, resulting in the formation of peroxynitrite. However, the recent report by Eiserich et al. (1998) raised a question as to the validity of NO2-Tyr as a specific marker of peroxynitrite formation. They showed that nitrite, a major end product of NO, can promote tyrosine nitration in the presence of myeloperoxidase in polymorphonuclear neutrophils. However, Cl-Tyr is cogenerated with NO2-Tyr in the NO2-myeloperoxidase-related reaction, and we were unable to detect any peak of Cl-Tyr in the chromatogram of samples obtained from brain tissues. This result suggests that the formation of NO2-Tyr is predominantly mediated by peroxynitrite, at least in our ischemia-reperfusion model.
Although it is well known that the formation rate of NO2-Tyr is very fast (Ischiropoulos et al., 1992), the degradation rate of NO2-Tyr has not been evaluated. Because our goal in this study was to clarify the time course of peroxynitrite formation, as a measure of superoxide and NO production in the reperfused brain, we needed to know the decay rate of NO2-Tyr. From our previous finding that L-NMMA at a dose of 50 mg/kg completely inhibited NO2-Tyr formation in rat brain during ischemia-reperfusion (Fukuyama et al., 1998), we measured the decay rate of NO2-Tyr after the administration of L-NMMA in our model. The T1/2 value of NO2-Tyr in both the peri-infarct and core-of-infarct regions was approximately 2 hours. Thus, the time course of NO2-Tyr measured by HPLC is considered to reflect quite closely the actual formation of both NO and superoxide at each time.
Among three isoforms of NOS, i.e., neuronal NOS (nNOS), endothelial NOS, and iNOS, nNOS may play a key role in NO generation in the brain just after ischemia, because (1) nNOS is constitutively expressed in the brain; (2) the specific activity (Vmax) of nNOS is nine times greater than that of endothelial NOS (Garvey et al., 1996); and (3) the maximum concentration of NO generated by nNOS is as much as 4 µmol/L in the ischemic brain (Malinski et al., 1993). The contribution of nNOS in the early phase of ischemia-reperfusion was further supported by the results of immunohistochemical analysis, which demonstrated that nNOS-positive neurons reached a maximum at 4 hours after MCA occlusion (Zhang et al., 1994). The mechanism of nNOS activation in ischemia involves an increase of glutamate release (Choi, 1991), which induces postsynaptic calcium influx via N-methyl-
We observed that the formation of NO2-Tyr was highest in the peri-infarct region, followed in decreasing order by the core-of-infarct region and caudoputamen. This regional difference cannot be explained by the difference in NOS activities, because NOS activity in the core of infarct was shown to be higher than that in the penumbra in a transient focal ischemia model (Ashwal et al., 1998). However, superoxide production is influenced by the rapidity of oxygen supply at the time of reperfusion (Opie, 1989), and it seems likely that more superoxide can be formed in the peri-infarct region than in the core-of-infarct region or caudoputamen, where the recovery of CBF is limited. Interestingly, we noted the presence of NO2-Tyr in the noninfarct region at 48 hours after the start of reperfusion. This may be a result of remote effects, such as spreading depression or transneuronal action, from the infarcted region.
In conclusion, we have found that NO2-Tyr is formed from the 2-hour occlusion time until 48 hours after the start of reperfusion in our focal ischemia-reperfusion model, and that iNOS is predominantly responsible for the NO2-Tyr formation, at least in the late phase of reperfusion. Further, NO2-Tyr formation was highest in the peri-infarct region. The information obtained in this study should be helpful in devising therapeutic strategies to rescue the ischemically injured region in patients with cerebral infarction, particularly from the viewpoints of the therapeutic window and choice of NOS inhibitors.
Footnotes
Acknowledgments
The authors thank S. Ogawa (Department of Neurology) and Y. Takahari (Laboratories for Experimental Animals and Physiologic Research) at Tokai University School of Medicine for their skillful technical assistance.