
Abstract
Peroxynitrite (ONOO−) exhibits potent neurotoxicity and plays an important role in neu ronal death, but no evidence shows that it is formed in the brain during ischemia or subsequent reperfusion. To detect the formation of ONOO−, we used a hydrolysis/HPLC procedure to measure the formation of 3-nitro-
Keywords
Nitric oxide (NO) is produced in endothelial cells, neurons, hepatocytes, neutrophils, and macrophages through three types of NO synthase (Palmer et al., 1987; Garthwaite et al., 1988; Curran et al., 1989; Schmidt et al., 1989; Hibbs et al., 1987; Marietta et al., 1988). It reacts with superoxide (O2·-) at a rate of 4.3 to 6.7 × 10⁹ mol/L−1·second−1 to form a potent oxidant, peroxynitrite (ONOO−) (Goldstein and Czapski 1995; Huie and Padjama 1993). The ONOO− directly oxidizes sulfhydryl groups at a 1000-fold greater rate than hydrogen peroxide (Radi et al., 1991a) and inhibits the function of various enzymes, including mitochondrial electron transport chain components (Radi et al., 1994). Protonation of ONOO− at pH 7.4 produces peroxynitrous acid (ONOOH), which has reactivity equivalent to that of the hydroxyl radical (Beckmann et al., 1990) and can induce lipid peroxidation (Radi et al., 1991b). In clinical studies, cytotoxic effects of ONOO− have been demonstrated in various pathologic conditions, including reperfusion injury in ischemic heart disease (Schulz and Wambolt, 1995), acute lung injury (Kooy et al., 1995), inflammatory bowel disease (Miller et al., 1995), and acute gastric mucosal lesion (Lamarque and Whittle, 1995).
In the nervous system, production of O2·- and NO increases in cerebral ischemia–reperfusion injury in rats (Kumura et al., 1995; Malinski et al., 1993). In experiments using cultured cells, ONOO−—not O2·- or NO itself—was shown to be the major cytotoxic molecule in glutamate-induced neuronal cell injury and apoptotic cell death (Lipton et al., 1993). Thus, ONOO− appears to play an important role in cerebral ischemia–reperfusion injury. Nevertheless, the formation of ONOO− in the brain during ischemia–reperfusion has not been demonstrated. Although it is difficult to measure ONOO− in tissues or organs because of its short half life, 3-nitro-
We measured NO2-Tyr production in rat brain using a combination of hydrolysis and HPLC. The NO2-Tyr concentrations in noninfarct, periinfarct, and core-of-infarct regions were evaluated during ischemia and reperfusion. The regional CBF was measured in parallel to clarify the relation between NO2-Tyr formation and blood flow.
MATERIALS AND METHODS
Focal cerebral ischemia and reperfusion
The surgical and anesthetic procedures were approved by the Animal Experimentation Committee, School of Medicine, Tokai University, Japan. Male Sprague-Dawley rats (Clea Japan Co., Ltd., Kanagawa, Japan), weighing approximately 300 to 350 g, were used in this study. Animals were starved overnight, but allowed free access to water. They were anesthetized with 3.0% halothane mixed with 30% oxygen and 70% nitrous oxide initially. Halothane was reduced to 2.0% during the operation and maintained at 1.5% from the end of the operation to the end of the experiment. The left femoral artery was exposed and catheterized with polyethylene tubing (PE-50) to allow blood sampling and the continuous monitoring of arterial blood pressure. Thermocouple probes (52 K/J thermometer; John Fluke Manufacturing Co., Everett, WA, U.S.A.) were placed in the rectum and in the left temporal muscle (this is regarded as giving an equivalent of brain temperature). Focal cerebral ischemia was achieved using the method described by Tamura and coworkers (1981), as modified by Hogan and others (1992). Briefly, the right common carotid artery (CCA) was isolated through a midline neck incision and a loose ligature placed around it. Then two microaneurysm clips (Sundt AVM micro-clip #1, Codman, Boston, MA, U.S.A.) were placed in tandem on the left middle cerebral artery (MCA) proximal and distal to the lateral olfactory tract. This was immediately followed by the permanent ligation of the ipsilateral CCA. Application of the clips was completed within 60 seconds, and 2 hours later reperfusion was performed by removing the clips. During the experiment, both brain and rectal temperatures were maintained at about 37°C with an external heating lamp and a heating pad. These temperatures and blood pressure were continuously monitored. Arterial gases, blood glucose level, and hematocrit were examined before occlusion, during occlusion, and 5 minutes, 30 minutes, 1 hour, and 3 hours after the start of reperfusion.
The rats were killed with an overdose of pentobarbital sodium at indicated times in each group. The brain then was removed and cut into four cross-sections, and the parts corresponding to the core-of-infarct, periinfarct, and noninfarct regions were immediately frozen to −190°C with liquid nitrogen (Fig. 1). The selection of periinfarct, core-of-infarct, and noninfarct regions was made based on a preliminary study in which 2,3,5-triphenyltetrazolium chloride staining was performed in rats subjected to identical ischemia–reperfusion procedures.
Method of tissue dissection. The whole brain was sectioned at 2-mm thickness from the anterior tip of the frontal lobe. Four cross-sections (from 2- to 10-mm anterior coodinate) then were selected and redissected into three compartments (noninfarct,  ; periinfract,
  ; and the core-of-infarct regions,
  ) based on the location of the three compartments previously identified by 2,3,5-triphenyltetrazolium chloride (TTC) staining in another group od identically treated animals.
Regional CBF was measured by the hydrogen clearance method using a digital tissue blood flow meter (digital UH-meter model NMG-D1; Unique Medical Co. Ltd., Tokyo, Japan). Three burr holes were drilled 4.5 mm lateral to the right and 3 mm posterior to the bregma, 4.5 mm lateral to the left and 3 mm posterior to the bregma, and 3 mm dorsal to the site of MCA occlusion on the same anteroposterior level as the bregma, corresponding to the noninfarct, periinfarct, and core-of-infarct regions. Three Teflon-coated platinum electrodes, 0.2 mm in diameter and 3 mm in length with a 2-mm uncoated portion at the tip, were inserted through each burr hole. The reference electrode was inserted under the skin. After a recovery period of 2 hours after insertion of the electrodes, CBF measurements were performed during ischemia and reperfusion. The CBF was calculated from the hydrogen clearance curve obtained after a 1-minute administration of 10% hydrogen gas mixture, according to the formula of Auckland and associates (1964).
Experimental design
Animals were divided into five groups: group 1 (n = 6), 2-hour ischemia in which the rats were killed at 2 hours after the occlusion; group 2 (n = 7), 2-hour ischemia/3-hour reperfusion in which the rats were killed at 3 hours after release of the left MCA; group 3 (n = 6), 2-hour ischemia/3-hour reperfusion with administration of NG-monomethyl-
Hydrolysis of brain tissue and NO2-Tyr analysis by HPLC
Brain tissue was homogenized with 500 μL of Milli-Q water and hydrolyzed, as previously reported with slight modifications (Tsugita et al., 1982). Briefly, homogenized tissue was incubated at 110°C for 24 hours in a vessel lack (JASCO Ltd., Tokyo, Japan) containing 6 N HCl and 0.1% phenol, which was added to rule out artifactual formation of NO2-Tyr during acid hydrolysis in the presence of nitrite or nitrate (Shigenaga et al., 1997).
Separation of NO2-Tyr was achieved by HPLC on a Nucleocil 5 μm C-18 reverse-phase column (15 cm × 4.6 mm) with a guard column (JASCO Ltd.).
The column was eluted with 50 mmol/L KH2PO4–H3PO4 (pH 3.01) containing 10% methanol (v/v) at a flow rate of 1 mL/min through an isocratic pump and peaks were measured with an ultraviolet detector set at 274 nm (JASCO Ltd.). The NO2-Tyr peak was identified by comparison of its retention time with that of authentic NO2-Tyr, and the identification was confirmed by reduction with excess Na2S2O4 to yield aminotyrosine. The detection limit of this system is 0.6 μmol/L. Recovery rates of tyrosine and NO2-Tyr after the hydrolysis procedure, determined by using authentic tyrosine and NO2-Tyr, were 80% in both cases. NO2-Tyr data were expressed as ratios of NO2-Tyr to total tyrosine to normalize the values with respect to brain concentration of tyrosine.
Statistical analysis
The statistical significance of differences in NO2-Tyr among the regions in each group and of CBF among the regions at each time point after occlusion in group 5 was analyzed by use of the Wilcoxon signed-ranks test. The statistical significance of differences in NO2-Tyr among group 1 through 4 in each region, and physiologic parameters among the five groups was analyzed by one-way analysis of variance (ANOVA) followed by Tukey's protected least significant difference. To assess further the differences in CBF after reperfusion among the regions in group 5, two-way repeated ANOVA was used. All data are expressed as mean ± SD.
RESULTS
Table 1 shows physiologic parameters in each group. There were no significant differences in brain temperature, rectal temperature, pH, Pa
Physiologic variables
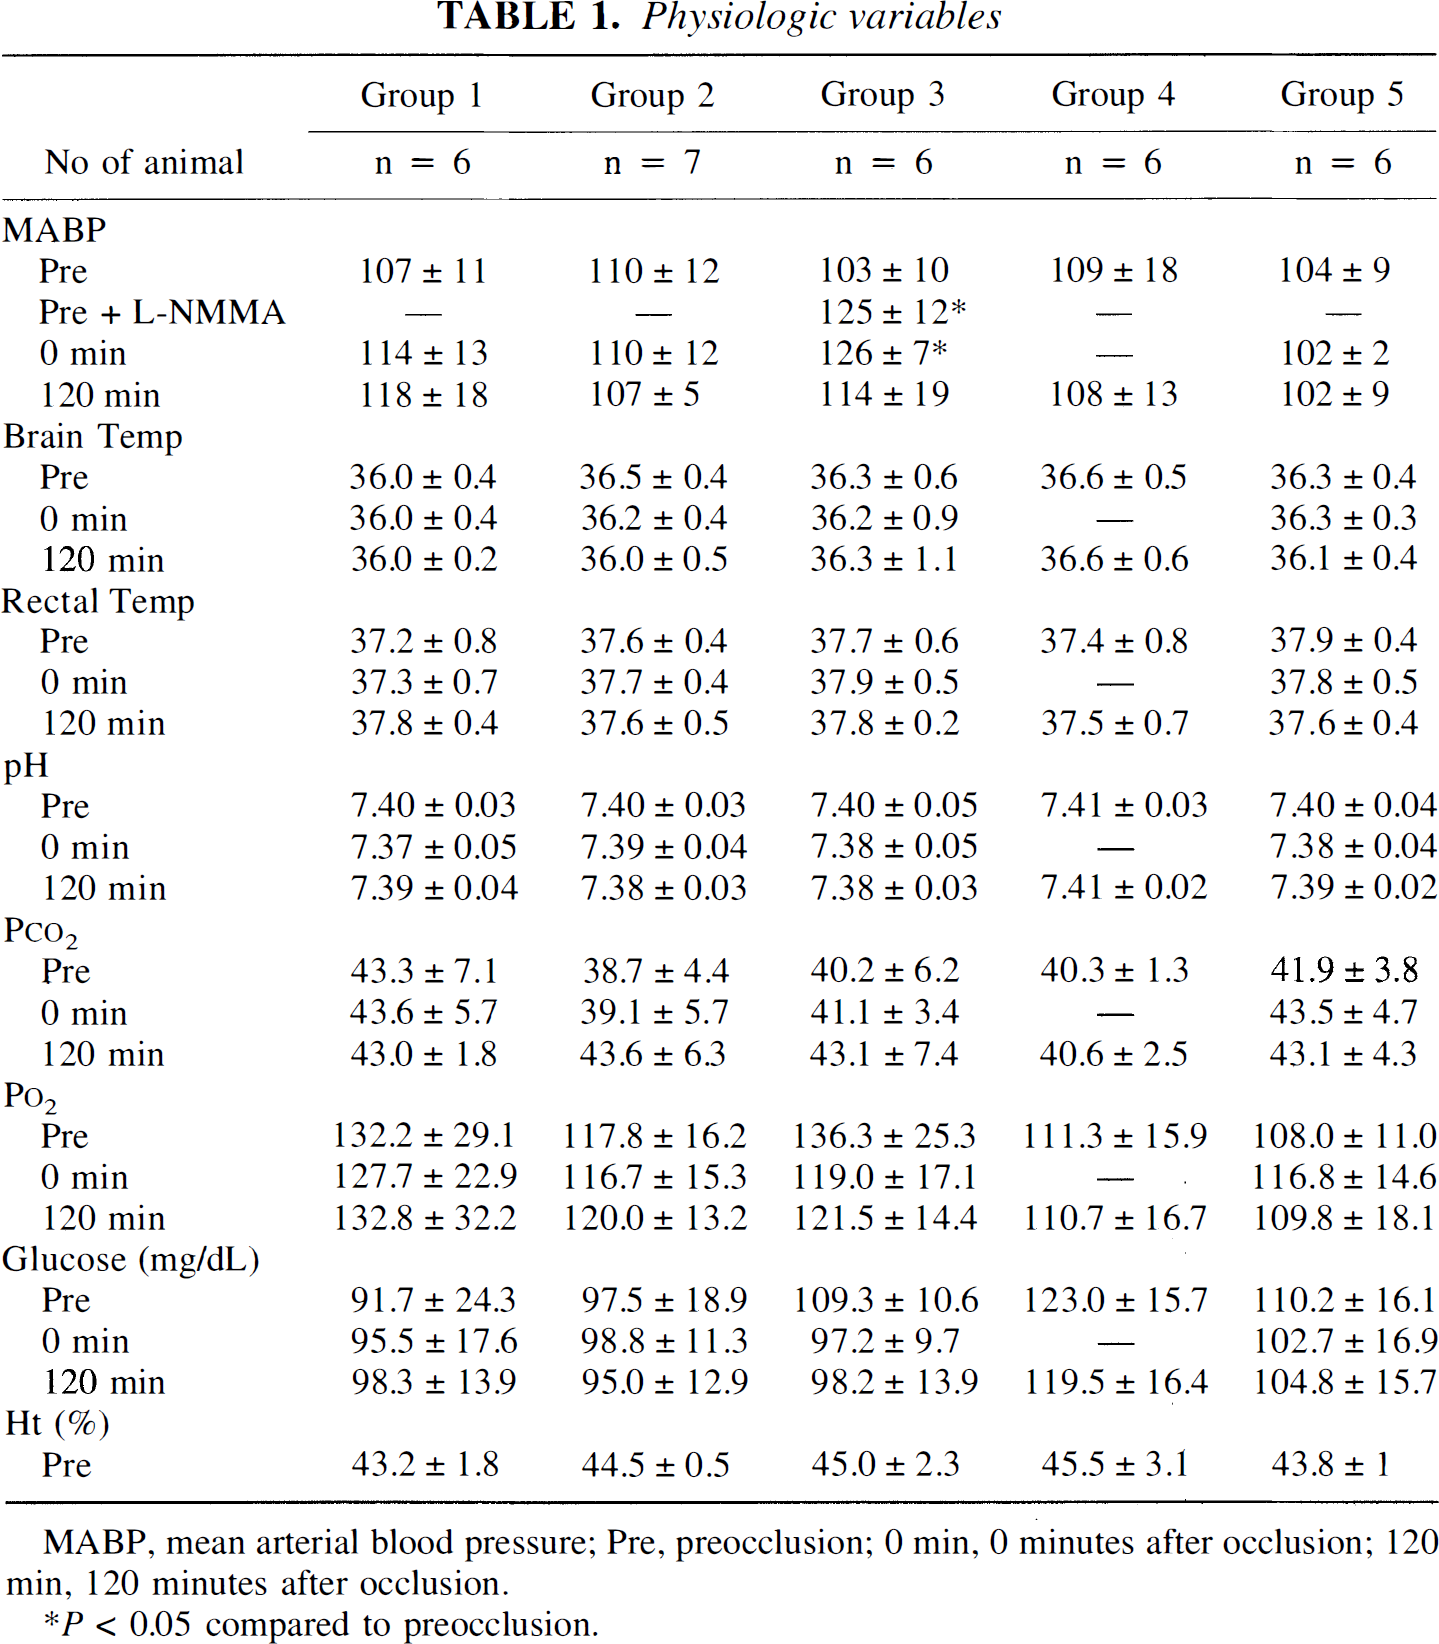
MABP, mean arterial blood pressure; Pre, preocclusion; 0 min, 0 minutes after occlusion; 120 min, 120 minutes after occlusion.
P < 0.05 compared to preocclusion.
Figure 2 shows representative HPLC chromatograms obtained from the noninfarct, periinfarct, and core-of-infarct regions at the end of 2-hour/ischemia 3-hour/reperfusion (group 2). A well-defined peak at the retention time of NO2-Tyr was seen in the sample from the periinfarct region (Fig. 2B). The identity of this peak was confirmed by co-elution of the sample with authentic NO2-Tyr, which resulted in an increase in the height of the NO2-Tyr peak (Fig. 2C). Figure 2D shows an HPLC chromatogram of the sample from the periinfarct region after addition of Na2S2O4. The peak of NO2-Tyr disappeared, and a peak of aminotyrosine appeared. No NO2-Tyr peak was seen in the sham-operated or Representative HPLC chromatograms of brain tissues. Formation of NO2-Tyr in noninfarct (□), periinfarct (▪), and core-of-infarct regions 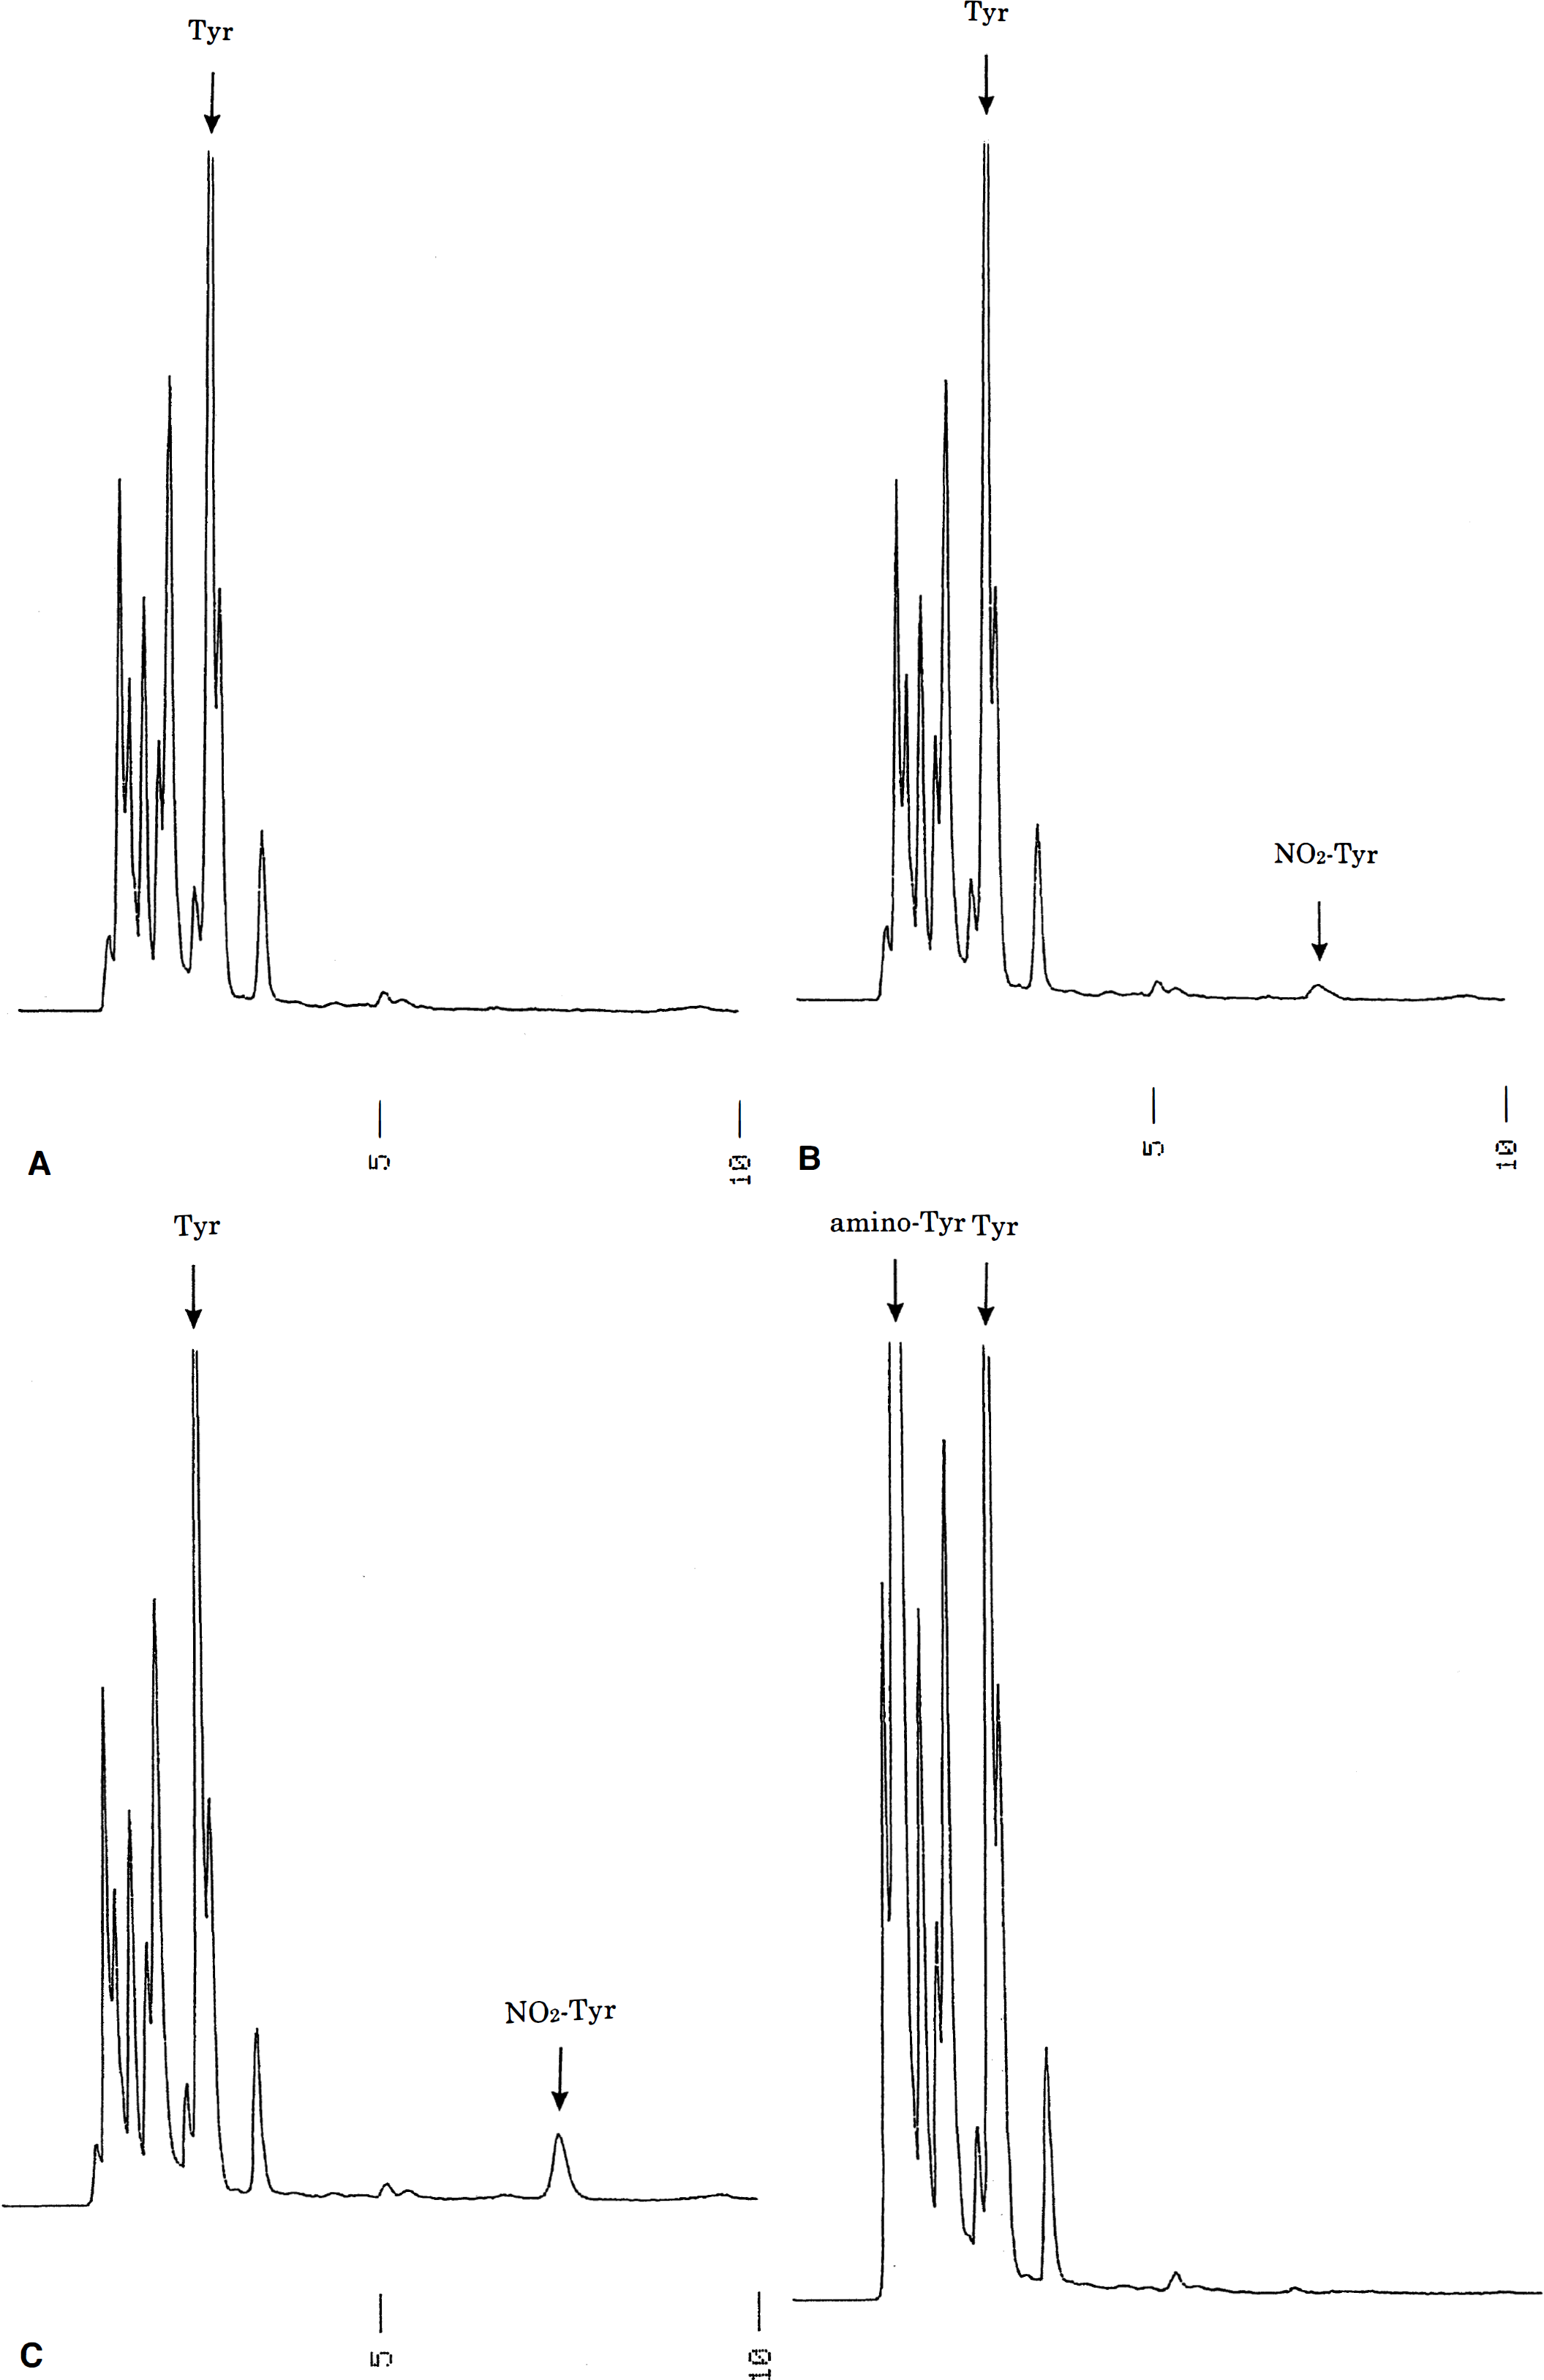
 of rat brain after 2-hour ischemia, 2-hour ischemia followed by 3-hour reperfusion, and 2-hour ischemia followed by 3-hour reperfusion in animals treated with NG-monomethyl-
Figure 4 shows regional CBF throughout the ischemia and reperfusion periods. In the noninfarct region, CBF remained unchanged throughout. However, in the periinfarct region, CBF was significantly reduced to 34.7% of the preocclusion level immediately after occlusion (0 minutes) and remained low (29.2 ± 13.6 mL/100 g/min, 32.9% of the preocclusion level) at 30 minutes after occlusion, then returned to the preocclusion level with reperfusion (80.0 ± 31.7, 79.3 ± 24.4 and 83.5 ± 23.0 mL/100 g/min immediately after reperfusion, at 1 hour and 3 hours thereafter, respectively). The CBF in the core-of-infarct region tended to decrease more than in the periinfarct region and did not return to the preocclusion level on reperfusion. Two-way repeated ANOVA showed a significant difference (F = 5.725, P < 0.05) between the CBF recovery patterns in the periinfarct and the core-of-infarct regions.
DISCUSSION
In the current study, we have demonstrated that (1) NO2-Tyr was formed in the brain during both the ischemic and reperfusion periods; (2) its formation was more marked after reperfusion, and was significantly greater in the periinfarct region than in the core-of-infarct region; (3) pretreatment with
Methods to measure ONOO− directly in biological systems face the difficulty of nonspecific reaction (Crow, 1997; Gow et al., 1996a). In contrast, the measurement of NO2-Tyr by HPLC is well established and reproducible (Kaur et al., 1994; Fukuyama et al., 1997). The specificity of the HPLC peak attributed to NO2-Tyr in the chromatogram was confirmed by the elimination of the peak on treatment with excess Na2S2O4. Furthermore, complete inhibition of NO2-Tyr formation occurred in the presence of an NO synthase inhibitor, supporting the idea that NO2-Tyr can be used as a marker for ONOO− formation. The increase in NO2-Tyr even during the ischemic period is reasonable, since CBF during the ischemic period did not fall to zero (Fig. 4) and the generation of O2·- has been shown to occur during ischemia in the brain (Fabian et al., 1995).
Regional CBF data in noninfarct (□) periinfarct (▪), and core-of-infarct regions  . Regional CBF in the periinfarct region decreased to 30.8 ± 15.9 mL/100 g/min (34.7% of the preocclusion), but recovered with reperfusion more rapidly and completely (83.5 ± 23.0 mL/100 g/min, 94.1%) than that in the core-of-infarct region (decreased to 15.2 ± 5.4 mL/100 g/min, 16.1% and recovered to 69.5 ± 27.9 mL/100 g/min, 73.8%; P < 0.05 two-way repeated ANOVA). *P < 0.05 versus preocclusion in each region.
The reasons why the NO2-Tyr concentration is higher in the periinfarct region than in the core-of-infarct region, even though the ischemic insult is more severe in the latter than in the former, are not clear. But the high concentration of O2·- in the periinfarct region during reperfusion may be one of the underlying mechanisms. Namely, the increase in CBF after the reperfusion was faster in the periinfarct region than in the core-of-infarct region. Given that the O2·- production is influenced by the rapidity of oxygen supply at the time of reperfusion (Opie, 1989), it is likely that more O2·- is formed in the periinfarct region than in the core-of-infarct region. Regarding NO concentration, it is reported that NO production is high in the core-of-infarct region, since the increase in glutamate release is high in this region (Choi, 1991), resulting in the activation of NO synthase. The concentration of NO is at the micromolar level during ischemia (Malinski et al., 1993), whereas the O2·- concentration is at the 10 pmol/L level (Fabian et al., 1995). Since the rate of ONOO− formation is determined by the product of the concentrations of O2·- and NO, it can be expected to increase sharply in the periinfarct region when the O2·- concentration in this region increases as a result of the rapid rise in oxygen supply during reperfusion. Another possibility that must be considered is that the formed NO2-Tyr might have been gradually reduced in the core-of-infarct region, since it has been reported that NO2-Tyr is degraded to 3–nitro-4-hydroxyphenylacetic acid (Ohshima et al., 1990) or removed by some enzymatic process (Gow et al., 1996b).
As for the source of NO, it is unclear which type of nitric oxide synthase is relevant to our experiment. However a contribution of inducible nitric oxide synthase in our study is unlikely, since the expression of inducible nitric oxide synthase mRNA was reported to start at 12 hours and to peak at 48 hours (Iadecola et al., 1995). As for O2·-, the mitochondrial electron transport system may be the major source, since its activity was shown to be increased in the early phase of reperfusion (Dirnagl et al., 1995). Notice that the level of nitrated tyrosine in the periinfarct region (0.89%) is much higher than that in the brain of a Huntington's disease model, in which the NO2-Tyr ratio reached only 0.13% (Matthews et al., 1997), suggesting that ONOO− plays a more important role in the pathologic mechanism of ischemia–reperfusion than in that of Huntington's disease.
In conclusion, the demonstration that NO2-Tyr is formed in the brain during ischemia–reperfusion supports the idea that both O2·- and NO play important roles, and provides a basis for further studies to clarify the pathophysiologic characteristics of this condition and to devise a therapeutic strategy.