
Abstract
To determine the occurrence and time-course of presumably irreversible subcellular damage after moderate focal ischemia, rats were subjected to 1, 3, 6, 9, or 24 hours of permanent unilateral middle cerebral and common carotid occlusion or 3 hours of reversible occlusion followed by 3, 6, or 21 hours of reperfusion. The topography and the extent of damage were analyzed with tetrazolium staining and immunoblot using an antibody capable of detecting breakdown of neurofilament. Neurofilament proteolysis began after 3 hours in the infarct core but was still incomplete in penumbral regions up to 9 hours. Similarly, tetrazolium-staining abnormalities were observed in the core of 50% of animals after 3 hours of ischemia. At 6 hours of permanent ischemia, infarct volume was maximal, and further prolongation of occlusion to 9 or 24 hours did not increase abnormal tetrazolium staining. In contrast to permanent ischemia and in agreement with the authors' previous demonstration of “reperfusion injury” in this model, prolongation of reperfusion from 3 hours to 6 and 21 hours after 3 hours of reversible occlusion gradually augmented infarct volume by 203% and 324%, respectively. Neurofilament proteolysis initiated approximately 3 hours after ischemia was quantitatively greatest in the core and extended during reperfusion to incorporate penumbra with a similar time course to that of tetrazolium abnormalities. These data demonstrate that, at least as measured by neurofilament breakdown and mitochondrial failure, extensive cellular damage is not present in penumbral regions for up to 9 hours, suggesting the potential for rescuing these regions by appropriate and timely neuroprotective strategies.
Cerebral ischemia triggers a myriad of biochemical processes leading to cellular destruction. Determination of the time window before such damage becomes irreversible is critical. Therapeutic intervention before this time with “neuroprotective” strategies is at least feasible, but “reincarnation” after this time is not likely.
Morphologic evidence of cellular death caused by an ischemic insult is commonly detected by stains such as hematoxylin and eosin or 2,3,5-triphenyltetrazolium chloride (TTC), beginning anywhere from 3 to 12 hours after ischemia. Furthermore, it is now known that the dying process can continue and the area of destruction enlarge for several days after some ischemic insults. The onset and progression of damage detected by such methods depends to a great extent on the model, depth, and duration of ischemia, the staining method, and cell type examined. For instance, morphologic evidence of death of CA-1 neurons as detected by hematoxylin and eosin staining after 30 minutes of transient forebrain ischemia begins after 24 hours and does not become maximal for 72 hours (Pulsinelli et al., 1982), whereas the same or longer durations of middle cerebral artery (MCA) occlusion produces cortical infarction detected by TTC staining beginning after 3 hours and becoming maximal by 6 to 24 hours (Lin et al., 1993; Bartus et al., 1995).
In determining the onset of irreversibly injury, such stains are probably inaccurate because they detect morphologic changes which represent the final stages of nuclear or cytosolic destruction (hematoxylin and eosin) or mitochondrial failure (TTC). It is unlikely that cells are viable during the entire time before such stains become “positive.”
Determining the exact time that cells remain alive after an ischemic insult is important because neuroprotective or other rescue therapies are unlikely to be effective once a threshold of neuronal damage occurs. However, there is no universally accepted marker for when this threshold is passed. One candidate marker may be the appearance of neurofilament breakdown products, signifying the onset of the loss of subcellular integrity.
Neurofilament consists of three subunits called the neurofilament triplet proteins NF-L (NF68; 68 kDa), NF-M (NF160; 160 kDa), and NF-H (NF200; 200 kDa) that assembled together build filaments. Neurofilament plays a critical role in neuronal function both as a skeletal protein maintaining neuronal shape and caliber (Morris and Lasek, 1982; Hoffman et al., 1984) and as a facilitator of axonal transport (Grafstein and Forman, 1980; Griffin and Watson, 1988). Neurofilament proteins are substrates of the calcium/calmodulin-dependent protease, calpain (Schlaepfer and Zimmerman, 1985; Schlaepfer et al., 1985), and therefore neurofilament degradation can occur after postinjury loss of calcium homeostasis. Because damage to neurofilament indicates destruction of cell integrity, it may be a useful predictor of neuronal death.
In this study, we describe the occurrence and time course of neurofilament destruction and correlate this with TTC staining in a model of MCA occlusion with and without reperfusion.
MATERIAL AND METHODS
Production of ischemia
Focal ischemia of variable duration in male 350 ± 28 g Long-Evans rats was induced by left MCA and left common carotid artery (CCA) occlusion as described previously (Aronowski et al., 1997).
Briefly, all animals were fasted overnight with free access to water and then anesthetized with 0.45 g/kg intraperitoneal injection of chloral hydrate. The femoral artery was cannulated for blood pressure measurement. Temperature from the right temporalis muscle was monitored and maintained at 37.0°C ± 0.4°C during ischemia and the first hour of reperfusion using a feed-forward temperature controller (YSI model 72, Yellow Springs, OH, U.S.A.) that used a heating lamp and warming blanket. The CCA was isolated through a midline incision and tagged with a suture. An incision was made through the left temporalis muscle perpendicular to a line drawn between the external auditory canal and the lateral canthus of the left eye. Under direct visualization with the surgical microscope, two burr holes were made with a handheld drill: a 1-× 3-mm rectangular burr hole, situated 2 to 3 mm rostral to the fusion of the zygomatic arch with the squamosal bone to expose the left MCA rostral to the rhinal fissure, and a 1-mm burr hole for cerebral perfusion measurement. The beveled edge of a 23-gauge hypodermic needle was used to pierce and open the dura along the entire length of the rectangular burr hole. A 0.005-inch diameter stainless steel wire (Small Parts Inc, Miami, FL, U.S.A.) was placed underneath the left MCA rostral to the rhinal fissure, proximal to the major bifurcation of the MCA, and distal to the lenticulostriate arteries. The artery was then lifted, and the wire rotated clockwise. The left CCA was then occluded using atraumatic Heifetz aneurysm clips for reversible ischemia and ligation with a 5-0 silk suture for permanent ischemia. Reperfusion was established by first removing the aneurysm clips from the CCA, and then rotating the wire counterclockwise and removing it from beneath the MCA. Interruption of flow through the MCA was inspected under the microscope and verified by cerebral perfusion measurement using a laser Doppler flowmeter (model BPM2, Vasamedics Inc, St. Paul, MN, U.S.A.). Only those rats that displayed reduction of cerebral perfusion after ischemia to less than 15% of the preischemic value or those with a cerebral perfusion reading of 10 or less on the laser Doppler flowmeter in the center of the ischemic zone were studied.
Infarct volume analysis
For infarct volume measurement animals were sacrificed between 60 minutes and 24 hours after MCA/CCA occlusion as indicated in the text. At the end of the period, under deep chloral hydrate anesthesia, rats were decapitated, and their brains were removed rapidly (within 15 to 20 seconds) and immersed in ice-cold phosphate-buffered saline (PBS). The dissected brains were cut into 2-mm-thick coronal sections using a Jacobowitz brain slicer. All sections except for the third rostral section, which was used to determine neurofilament degradation (see below), were stained in 2% TTC in PBS for 25 to 30 minutes at room temperature. Stained sections were fixed in phosphate-buffered 10% formalin before the morphometric analysis. Morphometric determination of the infarct size was achieved using a computer-based image analyzer operated by “Brain” software (Drexel University) as previously described (Aronowski et al., 1997). Infarcts produced by our protocol were restricted to cortical tissue. The infarct volume (in cubic millimeters) was calculated from the difference between the volume of the contralateral cortex and the volume of the TTC-stained portion (nonischemic) of the ipsilateral cortex of each rat. This indirect measure of infarct volume, based on the assumption that the volume of the ipsilateral and contralateral cortex are the same before ischemia, corrects the total infarct volume for the edema component (Swanson et al., 1990). Statistical significance was determined by analysis of variance and the Newman-Keuls test.
Analyses of neurofilament breakdown in ischemic cortex
At various intervals after ischemia with and without reperfusion we analyzed proteolysis of neurofilaments using immunoblotting with antibodies to 68-kDa and 200-kDa neurofilament (Sigma Chemical Co., St. Louis, MO, U.S.A.) that recognize both the full-length neurofilament protein and its proteolytic products. The same antibodies were recently shown to be excellent markers of damaged neurons in a rat model of traumatic brain injury (Posmantur et al., 1996). The ischemic cerebral cortex of the third 2-mm-thick rostral coronal section (see above) was divided into five pieces, each representing tissue at varying distances from the ischemic core, with 1, 2, and 3 being the infarct core; 4, the penumbra; and 5 being the peri-ischemic zone. A control piece (6) was obtained from the contralateral cortex as illustrated in Figs. 2 and 4. Dissected pieces of the cortex were immediately homogenized with 15 strokes of glass/Teflon homogenizer using 300 mL of hypotonic buffer containing 20 mmol/L Hepes, pH 7.4, 1 mmol/L EGTA, 4 mmol/L EDTA, 10 mg/mL leupeptin, 0.7 mg/mL pepstatin A, 0.1 mmol/L phenylmethylsulfonyl fluoride, 0.1% Triton X-100, and 0.1 mmol/L dithiothreitol. The aliquots of homogenates were stored in −80°C before analysis. After protein determination (Micro-BCA; Pierce Chemical Company, Rockford, IL, U.S.A.), 40 mg of protein from each homogenate was solubilized in sodium dodecyl sulfate (SDS) sample buffer and separated on an 8% SDS-polyacrylamide gel electrophoresis before transfer to nitrocellulose membrane using Tris/glycine buffer containing 20% methanol and 0.0025% SDS as described previously (Aronowski et al., 1992). After overnight blocking with 5% milk plus 1% bovine serum albumin in PBS at 4°C, immunostaining was performed using monoclonal antibody to NF68, clone NR4 (1:1000), and to NF200, clone N52 (1:1000), both antibodies recognizing phosphorylated and nonphosphorylated protein (Shaw et al., 1986). We have also used monoclonal antibody that recognizes both NF200 as well as 150-kDa (NF150) phosphorylated neurofilaments (1:2,000; SMI 31; Sternberger Monoclonals Incorporated). We also used 2D5 monoclonal antibody to a 50-kDa subunit of calcium/calmodulin-dependent protein kinase II (1:3,000) (Aronowski et al., 1992) and a monoclonal antibody to all isoforms of actin (supplied by Dr Jim Lessard) (1:1,000). Primary antibody was followed by horseradish peroxidase-conjugated goat antimouse (Promega) (1:3,000) and enhanced chemiluminescence reagents (Amersham). Both primary and secondary antibody incubation was performed for 1 hour at room temperature. Semiquantitation of immunostaining intensity visualized on x-ray film was accomplished by analyses of optical density using Bio-Rad's computer-assisted GS-670 Imaging Densitometer and Molecular Analyst program. Multiple exposures of each blot were analyzed to avoid potential problems with film saturation. Detection of NF-68 with this protocol was linear up to at least 40 mg of total protein. Three or four animals per group were used as indicated in the text.
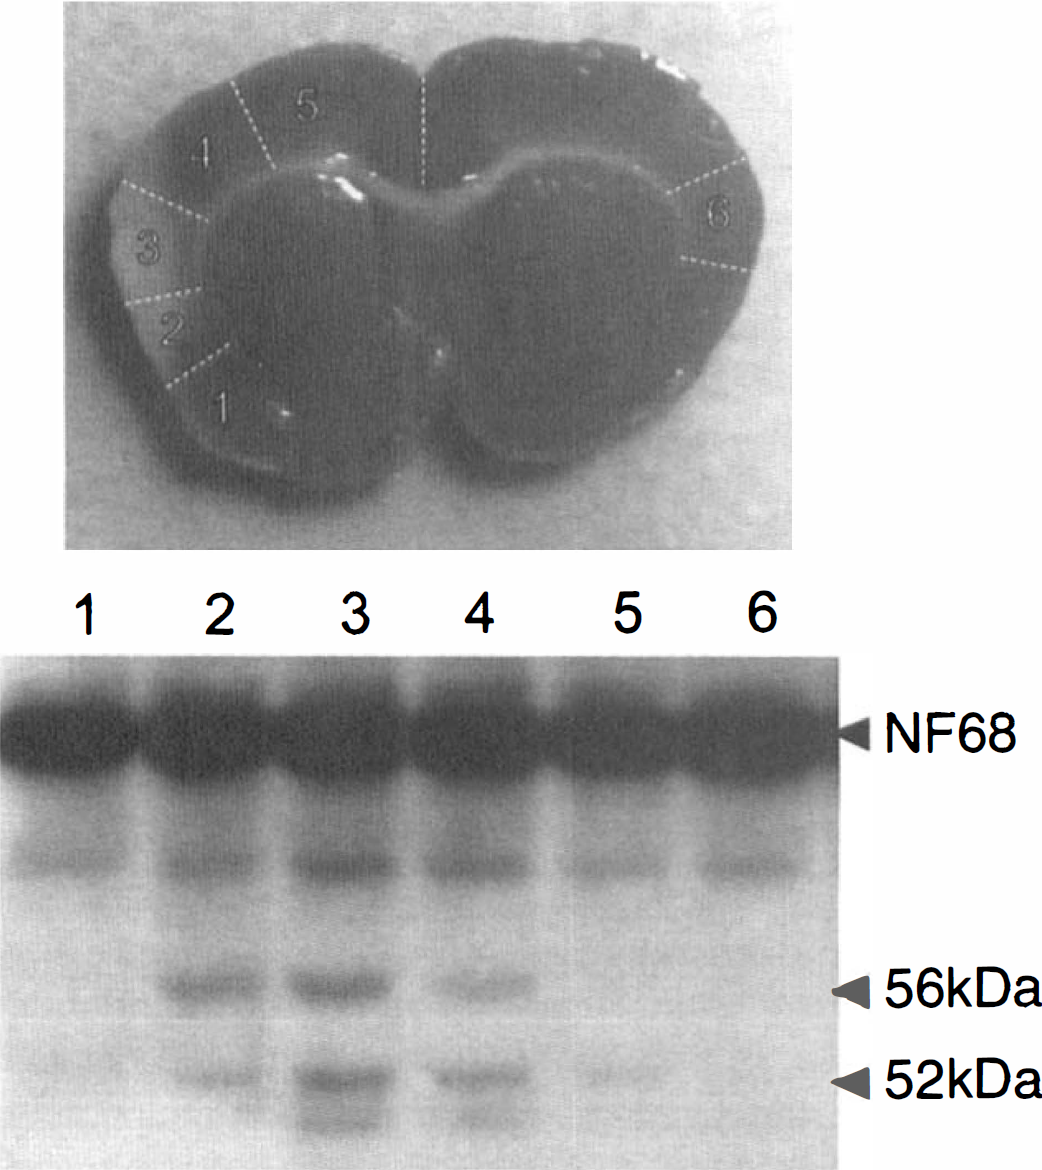
Samples of cortex obtained from rat brain after 3 hours of ischemia from locations 1 through 6 as indicated on the brain photograph (white lines indicate location of cortex dissection) were homogenized, separated on SDS-polyacrylamide gel electrophoresis, and electroblotted on nitrocellulose. Immunoblot with anti-NF68 antibody indicates presence of NF68 breakdown products at 56 and 52 kDa. Notice that most of the proteolysis occurs in the infarct core.
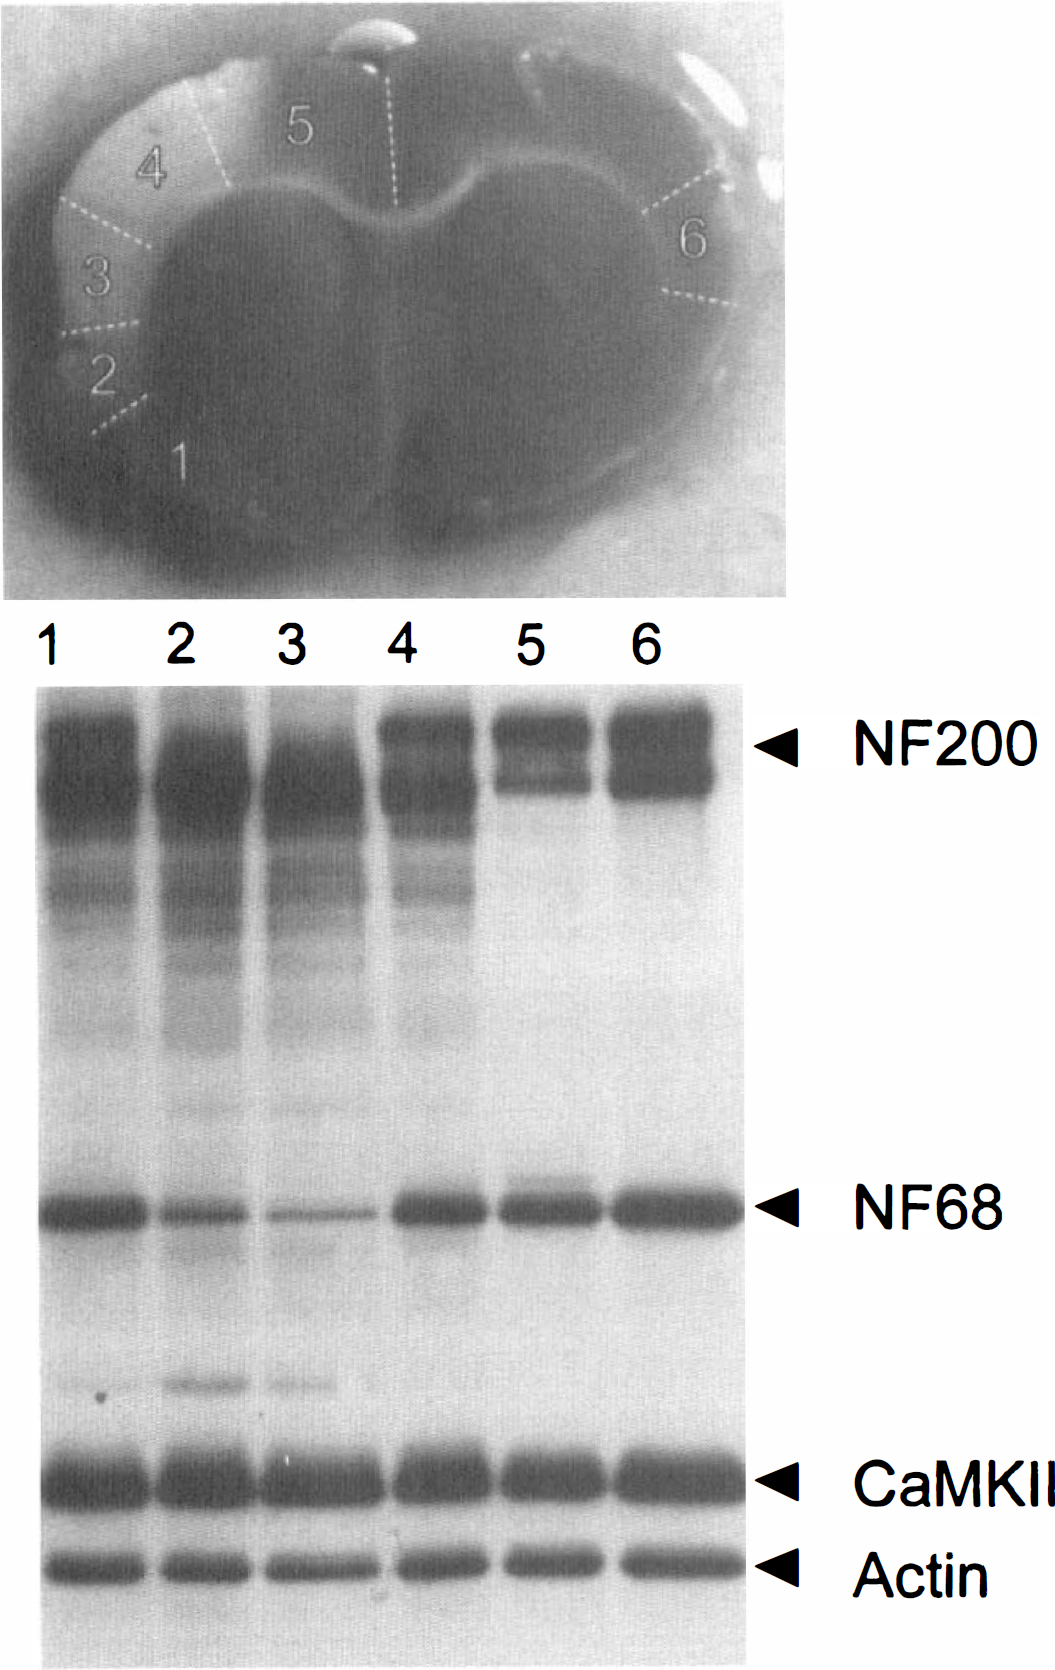
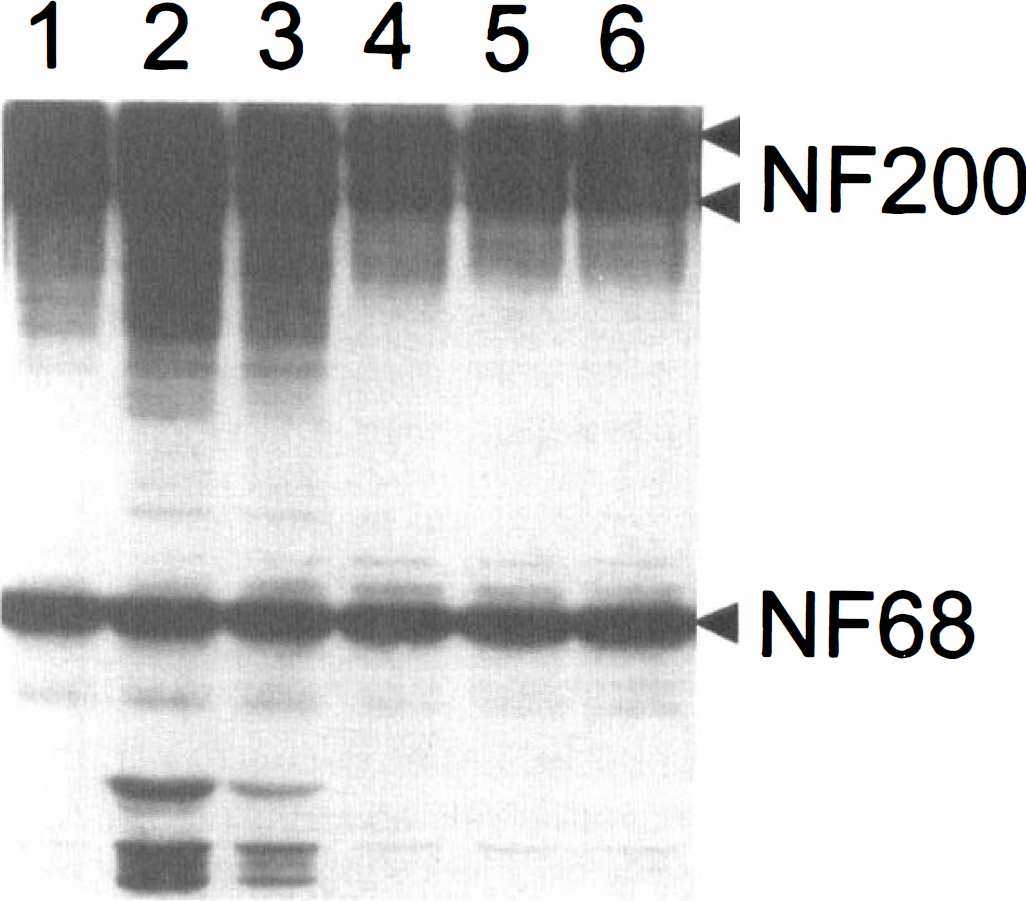
Immunoblot illustrating immunoreactivity of anti-NF68 (NF68), anti-NF200 (NF200), anti-alpha subunit of calcium/calmodulin-dependent protein kinase II (CaM-KII), and anti-actin (actin) in homogenate samples obtained from ipsilateral cortex (sections 1 through 5 with 2 and 3 depicting the infarct core) and contralateral cortex (6), as indicated on the picture above the blot (white lines indicate location of cortex dissection), in rat after 3 hours of occlusion and 21 hours of reperfusion. Note dramatic decrease in immunoreactivity to NF68 and the upper band of NF200 and no change in immunoreactivity of CaM-KII and actin.
RESULTS
Maturation of cortical infarction after unilateral permanent and reversible MCA/CCA occlusion
Permanent ischemia Unilateral occlusion of MCA/CCA in Long-Evans rats for 1 hour did not result in any detectable abnormality in TTC staining of ischemic cortex (n = 4). Animals sacrificed after 3 hours of ischemia without reperfusion displayed very minor changes in TTC staining. In two of four animals there was a slight decrease in TTC-staining intensity. Blurry and diffuse margins of aberrant staining did not allow for accurate morphometric analysis of these brains. In two remaining brains there were no TTC-staining abnormalities. Extension of the ischemic duration to 6 hours resulted in a significant augmentation of the amount of TTC-unstained (ischemic) tissue to 35.8 ± 30.5 mm3 (Fig. 1), with infarct volume ranging between 5.6 and 80.4 mm3. There was no further increase in the infarct volume after 9 hours of ischemia (33.2 ± 27.4 mm3; range, 8.8 to 73.3 mm3). Similarly, there was no further increase in infarct volume at 24 hours (34.5 ± 39.8 mm3), indicating that most changes leading to cellular death after permanent ischemia in this model occur during the first 6 hours.
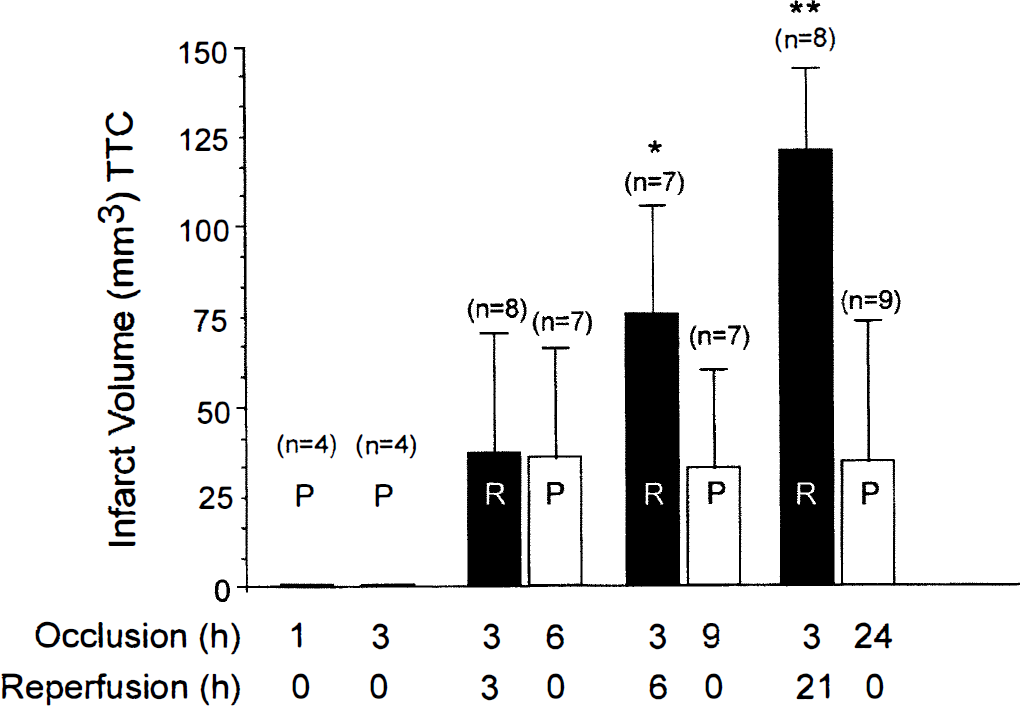
Infarct volume (mean ± SD) after permanent (P) ischemia or after 3 hours of reversible (R) ischemia (followed by reperfusion). * significantly different from infarct volume after 3 hours of ischemia plus 3 hours of reperfusion; ** significantly different from infarct volume after 3 hours of ischemia and 3 or 6 hours of reperfusion (P < 0.05).
Reversible ischemia We have previously shown that the amount of damage produced by ischemia in our model is augmented by reperfusion if initiated between 2 and 5 hours of ischemia (Aronowski et al., 1997). Again, using TTC staining as an indicator of cell damage, we tested the time course of reperfusion-related maturation of ischemia/reperfusion damage. Animals were subjected to 3 hours of ischemia and infarct volume determined after various durations of reperfusion. Three hours of ischemia plus 3 hours of reperfusion resulted in damage that was similar (37.2 ± 33.3 mm3; range, 5.1 to 135.3 mm3) to that produced by 6 hours of permanent ischemia (Fig. 1). Infarct volume continued to grow with increased duration of reperfusion. Ischemia plus 6 hours of reperfusion produced 75.4 ± 30.1 mm3 infarction (range, 34.6 to 116.4 mm3), whereas ischemia plus 21 hours of reperfusion resulted in 120.5 ± 23.2 mm3 infarct volume (Fig. 1).
Analysis of neurofilament degradation in the ischemic cortex after permanent and reversible ischemia
One hour of MCA/CCA occlusion, a duration of ischemia that did not produce visible infarction on TTC staining, also did not result in detectable proteolysis of NF68 and NF200 (Table 1). There was no change in the amount of parent protein and no neurofilament breakdown products in core, penumbra, or peri-ischemic region. Three hours after occlusion, a slight increase in neurofilament proteolysis in two of four animals was detected. As shown in Fig. 2 (an animal with the highest degree of proteolysis is shown) the presence of 56-kDa and 52-kDa breakdown fragments of 68-kDa neurofilament could be detected predominantly within the infarct core. The extent of neurofilament degradation was minimal at this time and required overexposure of the film to bring up a signal from the immunostained breakdown fragments. There was no coinciding detectable change in the amount of parent 68-kDa protein (Table 1), once more confirming that the amount of NF68 proteolysis after 3 hours of ischemia was so small that it was beyond the sensitivity of our assay. Again, similar overexposure was necessary to detect minor degradation products of NF200 confined to the same anatomic regions of the cortex that showed degradation of NF68 (data not shown).
Percent degradation of NF68 after permanent ischemia or reversible ischemia plus reperfusion
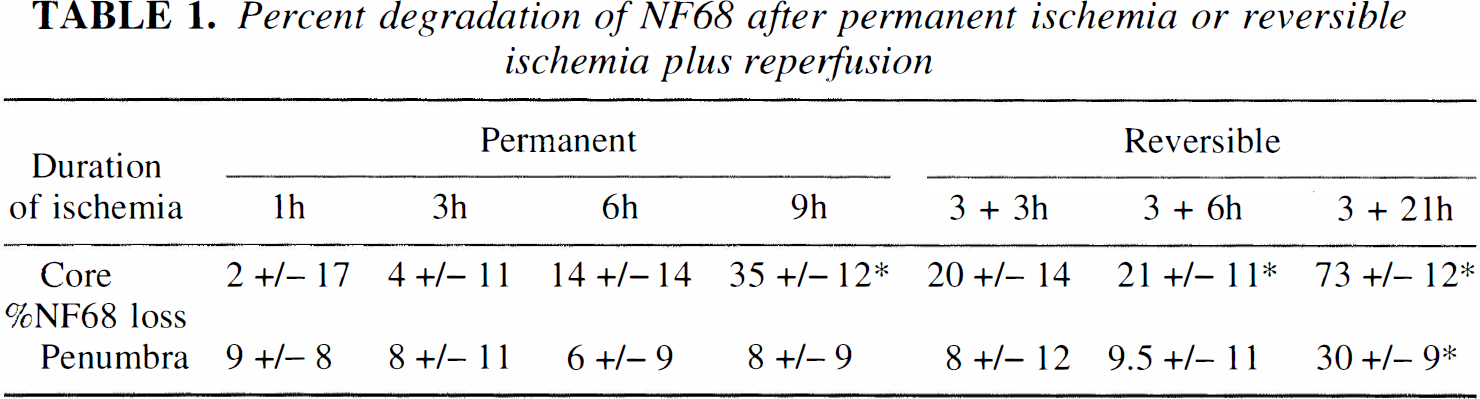
A small increase in the amount of proteolytic products of both NF68 and NF200 was evident in the core after 6 hours of permanent ischemia and after 3 hours of ischemia plus 3 hours of reperfusion (Table 1). This increase in proteolytic products coincided with a minor decrease of the immunostaining of parent NF68 in the core of the infarct. This reduction in the core was similar in both the 6-hour ischemia and the 3-hour ischemia plus 3-hour reperfusion groups, and ranged between 13.7% ± 13.6% and 20.1% ± 13.7% of control for permanent and reversible ischemia, respectively (n = 3 per group). There was no change in neurofilament immunostaining in the penumbra. An example of neurofilament degradation after 6 hours of ischemia is shown in Fig. 3. Further prolongation of ischemia to 9 hours significantly augmented neurofilament breakdown (Table 1). We observed 39.7% ± 8.8% and 29.8% ± 13.4% (n = 4 per group) reduction in immunostaining of NF68 in the infarct core (regions 2 and 3, respectively). There was no significant reduction in immunoreactivity of NF68 in the infarct penumbra (7.6% ± 8.9% of control) in the same animals. Interestingly after 3 hours of ischemia plus 6 hours of reperfusion we observed 21.3% ± 14.6% and 20.3% ± 7.1% (regions 2 and 3, respectively) NF68 degradation (n = 4). Although the mean amount of degradation in the core after 9 hours of permanent ischemia was higher than that after 3 hours of ischemia plus 6 hours of reperfusion, the difference was not statistically significant (P = 0.074 and P = 0.25 for sections 2 and 3, respectively). Similar to 9 hours of permanent ischemia, there was no reduction of NF68 immunoreactivity in the infarct penumbra (9.5% ± 11.2% of control) after 3 hours of ischemia and 6 hours of reperfusion.
Immunoblot illustrating immunoreactivity to anti-NF68 and anti-NF200 in homogenate samples obtained from ipsilateral cortex (sections 1 through 5 with 2 and 3 depicting the infarct core) and contralateral cortex (6), analogous to that demonstrated in Fig. 2 in rat after 6 hours of permanent ischemia. Note increased immunoreactivity to breakdown products of NF200 and NF68 in the fraction representing the infarct core.
Finally, the last group of animals analyzed in this study was subjected to 3 hours of ischemia and 21 hours of reperfusion. After this time, degradation of NF68 was very profound throughout the entire ischemic region. Immunoreactivity decreased by 73.0% ± 12.2%, 30.2% ± 8.9%, and 17.3% ± 7.5% of control in the core (location 2 and 3), penumbra (location 1 and 4), and peri-ischemic (location 5) regions, respectively (Table 1). We also observed almost entire degradation of the upper band, from two bands that were immunopositive to anti-NF200 antibody in the core of the infarction (Fig. 4) (the two immunopositive bands to NF200 antibody are thought to represent the same NF200, differing in their level of phosphorylation, the upper band having a higher level of phosphorylation). To confirm that the upper band represents NF200 of higher level of phosphorylation, we performed immunoblotting with a unique monoclonal antibody recognizing only highly phosphorylated NF200. The same antibody also reacts with NF150. Using this antibody, similar results indicating massive degradation of the hyperphosphorylated NF200 were obtained (Fig. 5). Similar profound degradation of NF150 was also observed. The degradation of neurofilament appears to be specific because actin and the 50-kDa subunit of calcium/calmodulin-dependent protein kinase II were not affected by proteolysis (Fig. 4).
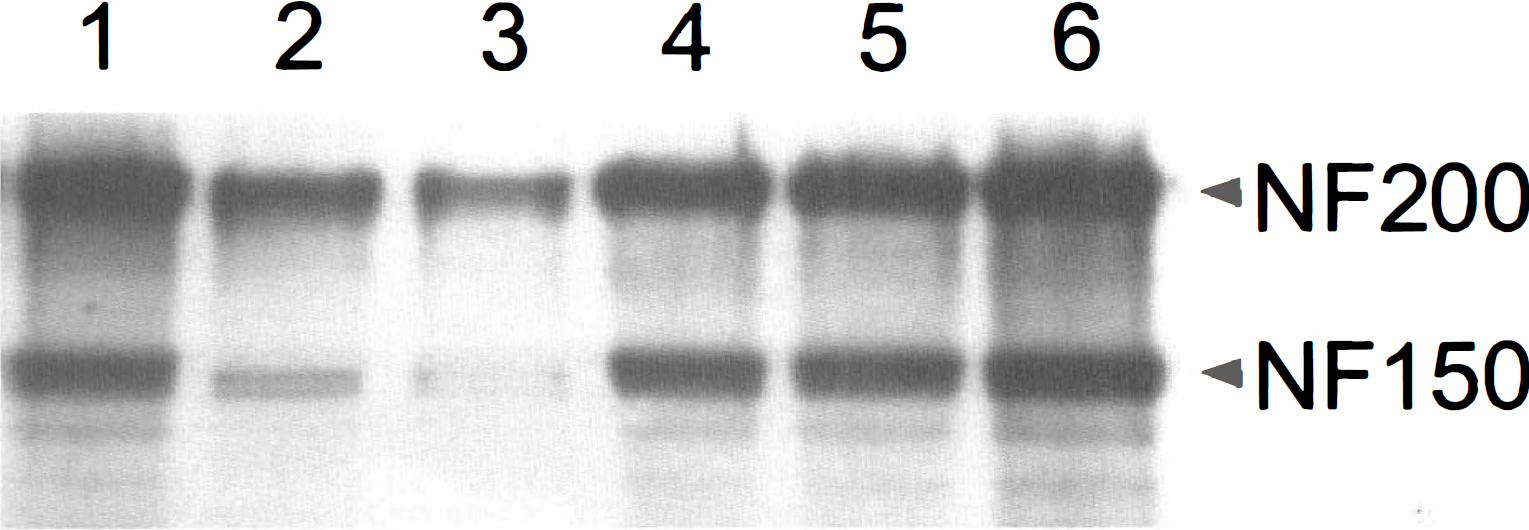
The identical blot to that in Fig. 4 was also probed with antibody that selectively recognizes the highly phosphorylated form of NF200 and NF150. NF200 band recognized by this antibody colocalized with the upper band of NF200 in Fig. 4. Note dramatic degradation of NF200 and NF150 in the core (2 and 3) of the infarct.
Correlation between maturation of infarct volume and neurofilament degradation
The first sign of TTC staining abnormality was observed after approximately 3 hours of ischemia. As mentioned earlier, the presence of such abnormality was weak, diffuse, and not consistent, and occurred in only two of four animals tested. Interestingly, samples of tissue from the infarct core of only those animals that showed TTC abnormalities also demonstrated the presence of neurofilament breakdown products. Neither of the samples tested at 3 hours of ischemia showed changes in quantity of the parent neurofilament protein, indicating a very low level of proteolysis. Therefore, we conclude that little irreversible cellular or subcellular destruction or mitochondrial damage occurs by 3 hours after the onset of ischemia in this model.
The first sign of well-defined TTC staining abnormality was observed 6 hours after the onset of either permanent ischemia or 3 hours of ischemia plus 3 hours of reperfusion. The amount of abnormal tissue at that time was similar for both permanent and reversible ischemia (Fig. I). As mentioned earlier, the presence of neurofilament breakdown was noticed at this time, but the extent of neurofilament proteolysis was minimal in all rats, and except for one rat that displayed loss of parent NF68 immunoreactivity, no change in the amount of NF68 was detected. The amount of proteolytic fragments was always highest in the infarct core, and the regions with proteolytic fragments were always confined within brain regions with TTC-staining abnormalities. Brains with larger infarctions contained more sections with proteolytic fragments as illustrated by Fig. 6, which shows NF68 immunoreactivity 6 hours after the onset of ischemia in three animals that developed infarction of different sizes. The pattern of proteolytic fragments was identical throughout the entire infarct (i.e., in all infarcted fragments), with the only difference between core and penumbra being that there was a greater accumulation of proteolytic products in the infarct core. Therefore, we conclude that after 6 hours of permanent ischemia or 3 hours of ischemia followed by 3 hours of reperfusion, subcellular proteolysis is primarily localized to the ischemic core, indicating that structural damage may not be far advanced and ischemic injury potentially reversible in penumbral regions.
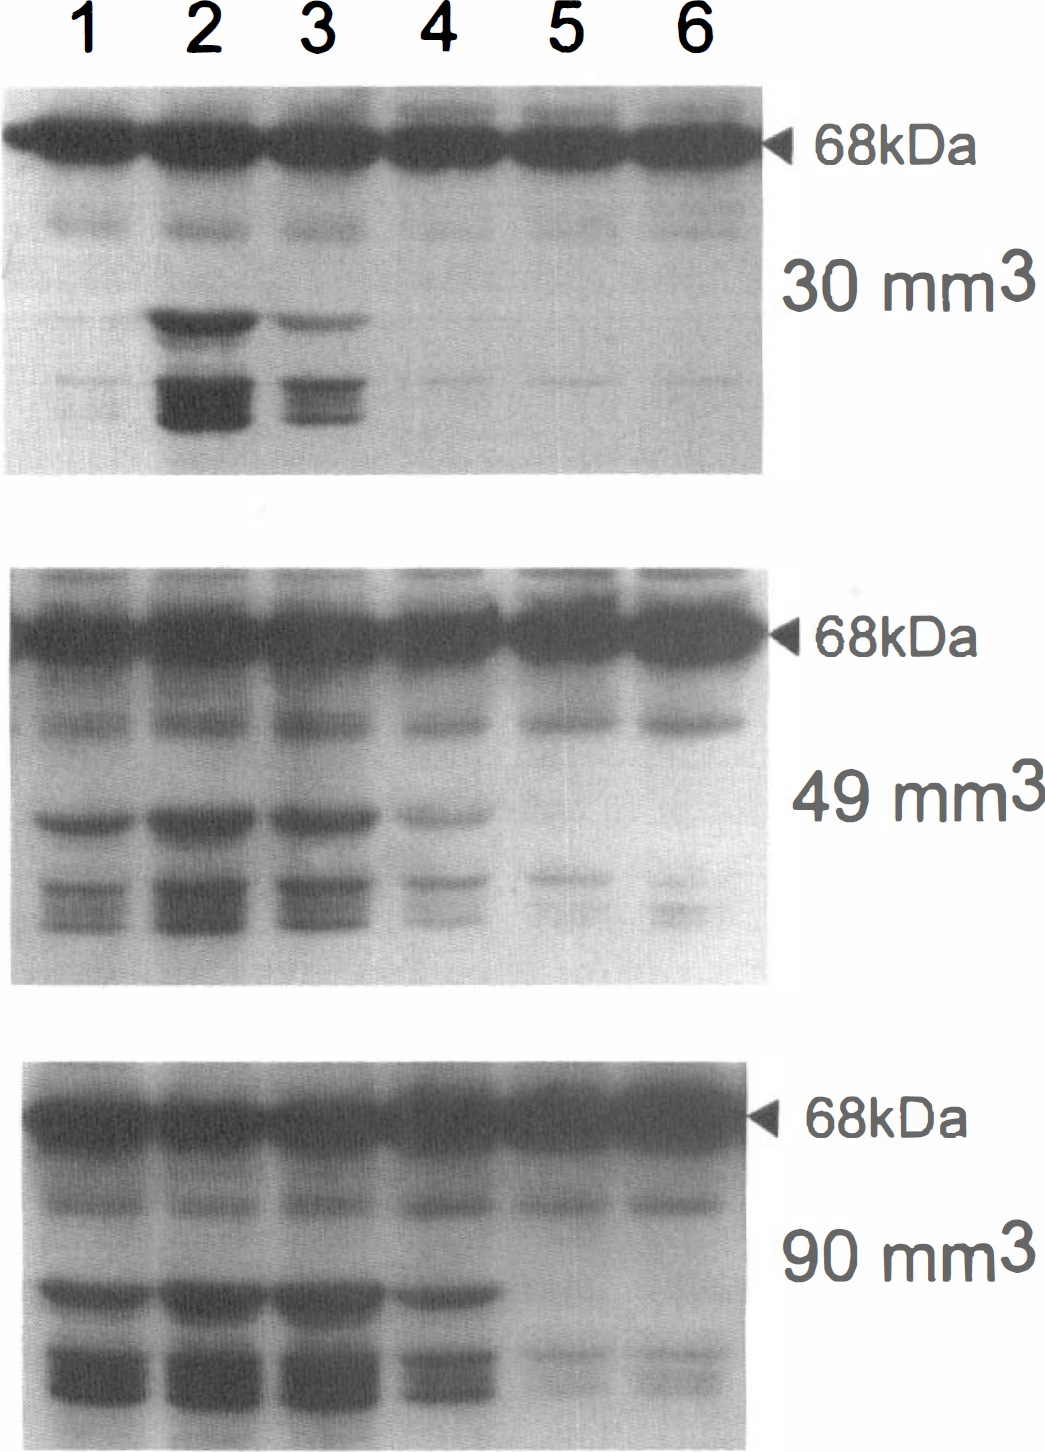
Three animals with 30-, 49-, and 90-mm3 infarct volume after 6 hours of permanent ischemia were selected and analyzed for presence of NF68 breakdown products, using anti-NF68 antibody, in selected regions of ipsilateral (sections 1 through 5) and contralateral (6) cortex, using Western blot analysis, as schematically shown in Figs. 2 and 4. Note increasing widespread NF68 breakdown in the ischemic cortex, from being limited to the core in the animal with smallest infarction (top) to extending into the penumbral region (section 4) in animals with larger infarction (middle and bottom). Note that there was no substantial decrease in parent NF68 (68 kDa) immunoreactivity, indicating a minor degree of neurofilament proteolysis. In fact to visualize breakdown product, film had to be overexposed, resulting in a nonlinear relationship between optical density of 68 kDa and its breakdown product.
At 9 hours after the onset of ischemia, as mentioned above, there was a further increase in infarct volume in animals that were subjected to 3 hours of reversible ischemia. However, there was no increase in the infarct volume in animals subjected to permanent ischemia. Both groups also demonstrated increased neurofilament breakdown compared with that after 6 hours, but this was still mostly limited to the core and did not substantially include the penumbral region. Decrease in the immunoreactivity of the parent NF68 and NF200 was also evident in the infarct core. No further increase in the amount of breakdown product compared with that at 6 hours was observed, suggesting that the products of initial degradation underwent further processing into smaller fragments that were no longer recognized by our antibody. Although there appeared to be a trend toward greater processing of neurofilament (loss of parent protein) in the infarct core of brains with no reperfusion (see above), the presence of breakdown products of NF200 (but not NF68) was more widespread (extending toward the distal penumbra) in animals with reperfusion, correlating with more widespread TTC abnormalities in those animals. For example, the presence of the proteolytic product of NF200 in section 4 (distal penumbra) was present in two of three animals after 3 hours ischemia and 6 hours of reperfusion but in none of three animals after 9 hours of permanent ischemia (Fig. 7). Therefore, we conclude that 9 hours after reversible ischemia extensive proteolytic activity has occurred, indicating subcellular destruction and probably irreversible damage in the core that is beginning to extend into penumbral regions. The wider extent of neurofilament breakdown after 3 hours of occlusion followed by 6 hours of reperfusion compared with 9 hours of permanent occlusion is consistent with our previous demonstration of reperfusion injury in this model.
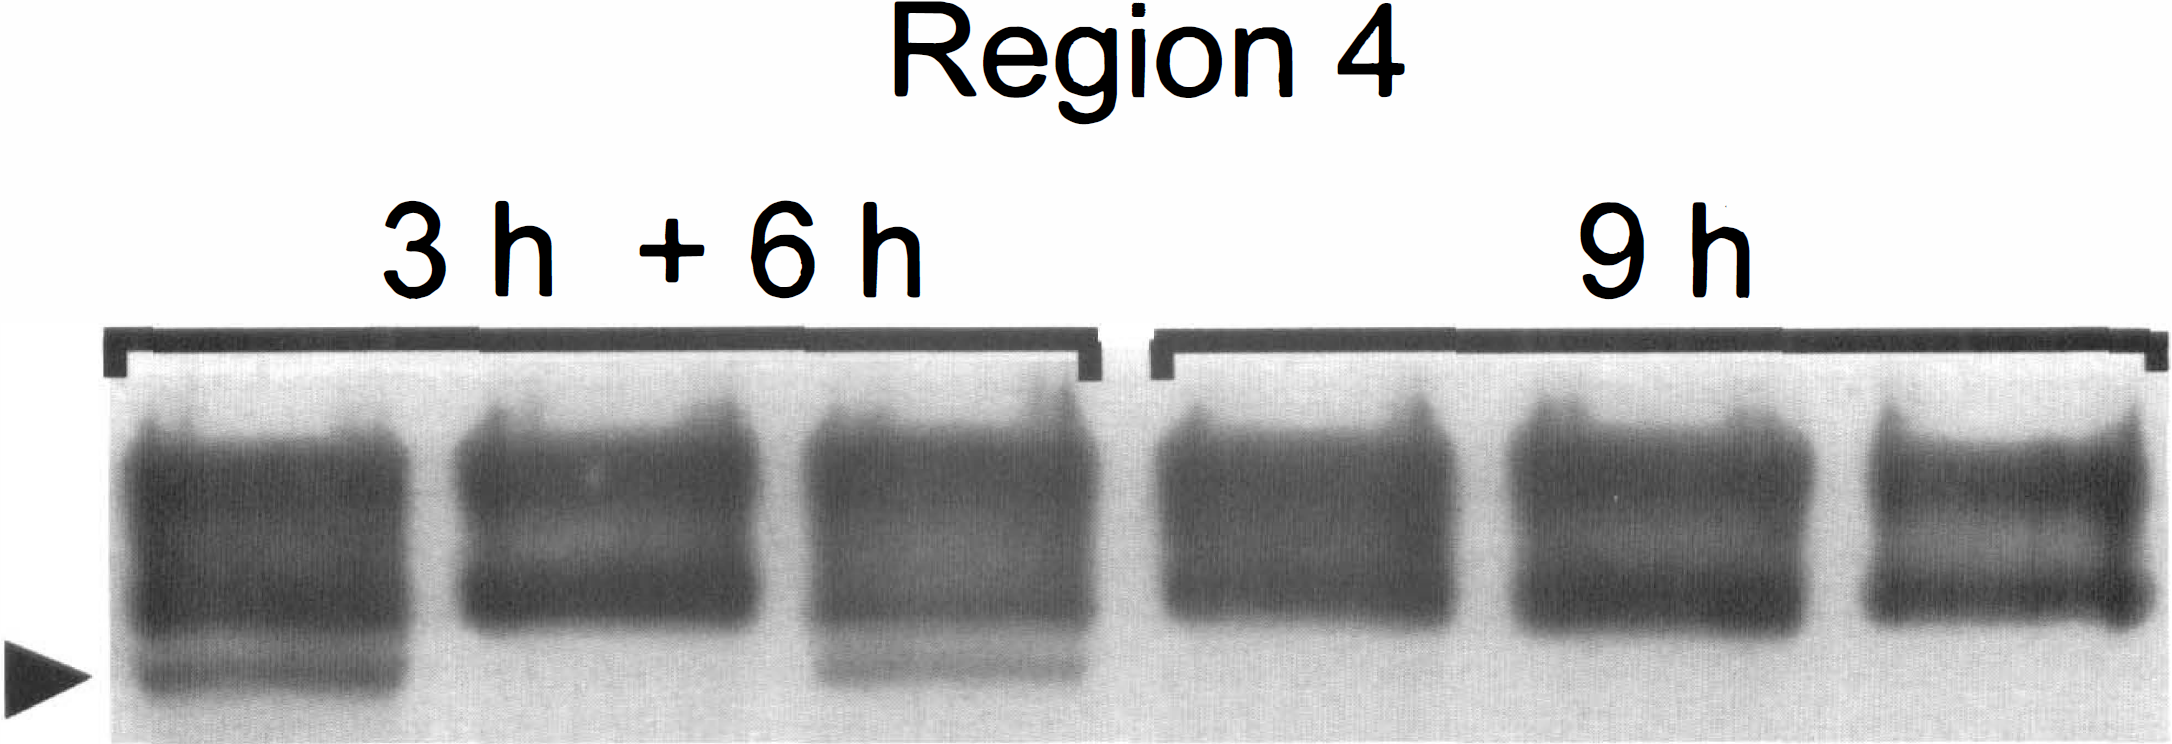
Three randomly selected rats were subjected to 3 hours of ischemia plus 6 hours of reperfusion (3h + 6h) and an additional three rats were subjected to 9 hours of permanent ischemia (9h). Region 4 (see Figs. 2 or 4) from each of the rat's cortex, representing infarct penumbra, were used in the experiment. Each column represents immunoreactivity to anti-NF200 for each rat analyzed by Western blotting. Note presence of breakdown product in two of three animals subjected to 3 hours of ischemia and 6 hours of reperfusion whereas no proteolysis is present in any of the animals after 9 hours of permanent ischemia.
Finally, it was observed that proteolysis of neurofilament 24 hours after ischemia, at a time when the infarct has reached its maximal volume, resulted in almost complete degradation of neurofilament protein in the infarct core, with little or no changes in regions that were on the margin or not included in TTC-abnormal brain regions. This indicates full maturation of the infarct by this time.
DISCUSSION
The main finding in this study is the correlation of the extent and distribution of TTC-staining abnormalities (thought to represent irreversible loss of mitochondrial function) with the development of neurofilament breakdown products (thought to represent early evidence of subcellular structural damage) after variable durations of permanent or reversible MCA occlusion. There is little evidence of permanent damage before 3 hours after ischemia, at which time cellular death begins to occur in infarct core. The core enlarges and cellular integrity begins to become jeopardized in penumbral regions between 3 and 9 hours of reperfusion after 3 hours of transient occlusion but not if the artery is kept occluded. However, even 9 hours after reversible occlusion, substantial penumbral regions show little or no structural damage. Damage in this model is almost complete by 24 hours.
In a majority of studies performed to date, treatment of ischemia needs to be initiated within the first 2 hours after the onset of ischemia to produce any benefit. However, one substance, the spin-trapping agent PBN, tested independently in two laboratories, has been shown to provide neuroprotection if administered as late as 12 hours after permanent occlusion (Cao and Phillis, 1994) or 5 hours after initiation of reperfusion after reversible ischemia (Zhao et al., 1994). Given these findings it is likely that the time necessary for consolidation of cell death is longer than 2 hours and that interference with selected deleterious pathways even at such delayed stages of ischemia/reperfusion could still offer benefit.
It has also been demonstrated that ischemic damage can be accelerated or augmented by reperfusion after reversible ischemia. Six hours of permanent ischemia has been shown to produce smaller infarction and less blood—brain barrier disruption than 3 hours of ischemia followed by 3 hours of reperfusion (Yang and Betz, 1994). Similarly, we have recently demonstrated that moderate ischemia produced by unilateral, permanent, tandem occlusion of the MCA plus CCA for up to 2 weeks in Long-Evans rats resulted in much smaller infarction than that after 2 to 5 hours ischemia followed by reperfusion (Aronowski et al., 1997). Because reperfusion may augment ischemic infarction, it is logical to anticipate that at the time reperfusion begins, the extent of damage is not yet maximal. Therefore, in evaluating the temporal profile of ischemic damage, it is relevant to use models with and without reperfusion.
Triphenyltetrazolium chloride is a sensitive histochemical indicator of mitochondrial respiratory enzyme function. It reacts with intact oxidation enzyme systems in mitochondrial cristae in viable tissue (e.g., succinate dehydrogenase). Accepting electrons thereby are reduced to a red fat-soluble compound, formazon, Irreversibly impaired mitochondria with damaged inner membranes and oxidative respiratory enzyme system cannot convert colorless TTC into red formazan, demarcating irreversibly damaged tissue as a pale area of the brain, Demarcation of infarcted tissue with TTC as a marker for irreversible damage after ischemia has been validated in numerous studies through comparing TTC-stained tissue with tissue stained with conventional histologic markers including hematoxylin and eosin (Lin et al., 1993; Bartus et al., 1995).
However, subcellular damage may occur before TTC demonstration of irreversible damage. Proteases, which catalyze hydrolysis of proteins, are enzymes that likely produce irreversible damage, Activated proteases can degrade enzymes, receptors, and ion channels as well as cytoskeletal proteins essential to support cell function. One of the multiple cytoskeletal proteins known to be degraded after various neurologic injuries, including ischemia, is neuronal-specific intermediate filament protein, or neurofilament (Hayes et al., 1995; Posmantur et al., 1994, 1996; Kaku et al., 1993; Ogata et al., 1989; Nakamura et al., 1992; Braughler and Hall, 1984; Banik et al., 1982).
Our data are consistent with the few published studies exploring this question. Garcia et al. (1993), 1995a, 1995h), in an elegant study, used light and electron microscopy and neuronal counting after MCA occlusion lasting 30 minutes to 7 days. They found that necrosis was not seen before 4 hours, and that 15% of counted neurons showed necrotic changes by 6 hours, and 65% by 12 hours. They also found that neuronal death was delayed in the infarct margin, sometimes as much as 4 to 5 days. They did not compare permanent occlusion with occlusion followed by reperfusion in their model, although in a companion study they found that relatively brief (30 to 60 minutes) transient ischemia produced less damage than permanent occlusion. It should be noted that they used the intraluminal suture occlusion model, which produces more severe ischemia and infarction involving both striatum and cortex compared with the model used in our study. In a study similar to ours, Bartus et al. (1995) analyzed time-related morphologic and biochemical (spectrin proteolysis) changes after permanent MCA occlusion with intraluminal suture. They observed gradual evolution of the infarct volume by TTC staining between 3 and 24 hours after MCA occlusion, with a sixfold expansion in infarct volume between 6 and 12 hours after occlusion. Such late maturation of the infarct volume is in contrast to our results with permanent ischemia demonstrating that infarct volume after 6 hours of permanent ischemia was fully matured, and that further prolongation of ischemia did not result in additional enlargement of infarct volume. Interestingly, in our model of reversible ischemia we found a similar pattern of infarct volume maturation to that after permanent occlusion with the intraluminal suture, with the only difference that expansion of infarct volume during the first 6 hours in our model occurred two to three times faster. Emergence of TTC-staining abnormalities in both studies was preceded by proteolysis. Spectrin proteolysis was detected as early as 1 hour after ischemia (Bartus et al., 1995), whereas neurofilament breakdown products in our study were detected by 3 hours. Acute cytoskeletal rearrangements after focal ischemia were also documented using immunohistochemistry with antibody to predominantly somatodendritic microtubule-associated protein 2 (MAP2) as early as 15 minutes after induction of ischemia (Pettigrew et al., 1996). Such changes preceded neuronal death and eventually led to extensive MAP2 degradation by 24 hours after ischemia. It was suggested that proteolytic changes of MAP2 were caused by activation of calpain, because increased immunostaining with antibody specific to calpain-cleaved spectrin fragments paralleled the loss of MAP2 immunostaining in the same brain regions.
In conclusion, we have demonstrated neurofilament proteolysis beginning after 3 hours in the infarct core but still incomplete in the penumbral region up to 9 hours after moderate focal ischemia. In our study, penumbral regions are defined as those with more moderate intraischemic reduction of perfusion and which initially are not part of the infarct core but are gradually incorporated into the infarcted region by 24 hours. Our study suggests that, at least as measured by neurofilament breakdown, extensive cellular damage is not present in penumbral regions for up to 9 hours, suggesting the potential for rescuing these regions by appropriate and timely neuroprotective strategies during this interval.