
Abstract
Contrast-enhanced magnetic resonance imaging was used to produce high-resolution activation maps reflecting local changes in cerebral blood volume after a simple sensory stimulus, Activation of the forelimb region of the somatosensory cortex was performed in α-chloralose—anaesthetized rats with an electrical stimulus (5 V, 3 Hz) delivered through needle electrodes placed subcutaneously on the left forelimb, A gradient echo magnetic resonance imaging sequence, sensitive to changes in the relative amount of deoxyhemoglobin within the cerebral vasculature, produced a 4.05% ± 1.69% increase in signal intensity. This effect was enhanced with an injection of an intravascular iron oxide contrast agent (Combidex, Advanced Magnetics), resulting in a 9.11% ± 1.52% decrease in signal intensity.
Keywords
Recovery of brain function and reorganization of sensory and motor maps after deprivation of sensory input or local damage is an active area of neuroscience research. Whereas it is recognized that the adult brain is able to undergo considerable plastic changes to affect restitution of function, much of the underlying neurophysiologic mechanisms remain unknown. The cortex of the rat provides a valuable model with which to study recovery of function. The cytoarchitecture is accurately documented, and its functional physiologic features are well characterized. Studies on this subject have relied on techniques that are either invasive (eg, involve electrode placement) or lack the spatial resolution necessary when working with laboratory animals. Recent developments in magnetic resonance (MR) imaging technology have allowed the spatial distribution of functional neuronal activity to be mapped noninvasively. Whereas most of these studies have been confined to human cognition (Kwong et al., 1992; Bandettini et al., 1992; Moseley and Glover, 1995), functional magnetic resonance imaging (fMRI) provides an attractive alternative for functional mapping in the laboratory animal.
During somatosensory stimulation, local alteration in neuronal activity induces local changes in metabolism and CBF and volume (Fox and Raichle, 1986). This results in a change in the local concentration of deoxyhemoglobin within the cerebral vasculature (Ogawa et al., 1990; Turner et al., 1991) and, because of the paramagnetic properties of deoxyhemoglobin, causes a change in local T2 and T2* nuclear magnetic resonance relaxation time (Thulborn et al., 1982). This effect has been termed blood oxygenation level—dependent (BOLD) image contrast. Several studies have demonstrated the feasibility of performing fMRI in rats exploiting the BOLD effect (Kerskens et al., 1996; Hyder et al., 1994; Yang et al., 1996; Scanley et al., 1997; Gyngell et al., 1996). The problem of working with anesthetized animals can partly be overcome with the use of α-chloralose, which is known to maintain cerebral vascular responses to sensory stimuli. Even so, under these conditions the signal intensity changes observed by exploiting the BOLD effect typically are on the order of a few percentage points, and, as such, are vulnerable to changes in the basal physiologic responses and can be obscured by noise and MR system instability. If functional brain mapping in laboratory animals is to be a valuable adjunct to conventional neurophysiologic techniques, then a robust approach enabling high spatial resolution is required. The MR imaging—detectable response associated with a functional task can be enhanced with the use of exogenous contrast agents (Villringer et al., 1988; Rosen et al., 1990). Changes in local cerebral blood volume (CBV) associated with a sensory task can be mapped using dynamic MR imaging to follow the susceptibility-induced signal loss after the bolus injection of a suitable contrast agent (Belliveau et al., 1991; Rosen et al., 1990; Reimer et al., 1995). Although this approach has been used successfully in several fMRI studies in man, because of the need for rapid imaging, it is often inappropriate for laboratory experiments in which high-resolution of a small volume of tissue is required. Intravascular MR contrast agents, such as superparamagnetic iron oxide, with long half-lives in the blood pool, provide an alternative approach for CBV mapping (Mandeville et al., 1996; Berry et al., 1996). An increase in blood volume increases the concentration of the blood pool contrast agent (per unit volume of tissue) in the imaging slice and causes a local decrease in T2* and T2 (Ogawa et al., 1990; Hamberg et al., 1996; Mandeville et al., 1996; Reimer et al., 1995; Rosen et al., 1990). Although the change in blood volume is small compared with the blood flow response (Grubb et al., 1974), the large microvascular surface area causes a large change in the microscopic magnetic field gradients around the capillaries and small vessels, which in turn changes the degree of dephasing of the diffusing water proton spins (even far from the vessels and capillaries). It is this spin dephasing effect that is observed as a dramatic change in the T2 and T2* of the tissue volume.
Several ultrasmall superparamagnetic iron oxide (USPIO) colloids are in development for clinical use and have been used for contrast-enhanced MR imaging of liver, spleen, and lymph nodes in humans. One such agent, Combidex USPIO (Advanced Magnetics, Inc., Cambridge, MA, U.S.A.; Code 7227, AMI-227), which has a long blood half-life (Saini et al., 1995) (more than 2 to 3 hours in rat), is suitable for contrast-enhanced CBV imaging. We report here on the use of Combidex to produce functional activation maps of the rat somatosensory cortex associated with forelimb stimulation.
MATERIALS AND METHODS
Animal preparation
Male Sprague-Dawley rats (weighing 200 to 350 g) were anesthetized with isoflurane in oxygen (1.5% to 2%) for all surgical procedures. All experiments involving the use of animals were approved by Genentech's Animal Care and Use Committee (AAALAC accredited). The right femoral artery was cannulated for mean arterial blood pressure recording and blood sampling for blood gas measurements. The right femoral vein was cannulated for the administration of α-chloralose and contrast agent. After surgery, the anesthesia was switched to α-chloralose (80 mg/kg given intravenously in the initial dose; maintenance dose, 40 mg/kg at 90 minutes). Approximately 30 to 45 minutes was allowed after the initial bolus of α-chloralose before a successful fMRI experiment could be performed. Rats were allowed to breath spontaneously (oxygen, approximately 20% in air, adjusted to compensate for fluctuation in blood gases). The rats were placed in a purpose-built head holder (Applied Neuroscience, Thursod U.K.) and secured with ear bars. Fourteen animals were include in the fMRI study. Three additional rats were used to estimate a suitable dose of contrast agent.
Magnetic resonance imaging protocol
Magnetic resonance imaging experiments were performed on a 4.7-T Varian INOVA system (Varian Associates, Palo Alto, CA, U.S.A.) using a single-surface coil (3-cm diameter) for all imaging experiments. Since it has previously been shown that for both the BOLD response (Menon et al., 1993) and contrast-enhanced CBV-weighted imaging (de Crespigny et al., 1997) that the optimal absolute change is obtained when the echo time (TE) is equal to the T2* of the tissue, all activation experiments were performed with TE = T2*. After global field inhomogeneity was reduced by shimming on the signal from the slice of interest, a series of gradient echo images were acquired at different TE to estimate T2* values from the rat cortex (TE: 10, 20, 30, 40, 50 milliseconds; other parameters include TR: 1 second, number of repetitions 4, field of view 30 mm2). Multiple images were analyzed by a least-square fitting procedure using MRVision software (Menlo Park, CA, U.S.A.). T2* in the cortex was estimated to be 45 milliseconds before contrast agent and the TE for the BOLD experiment was adjusted accordingly. After injection of contrast agent, a reduction in the T2* occurred in a dose-dependent manner. To estimate a suitable dose of Combidex for the CBV-weighted activation studies, the fMRI paradigm was repeated in three rats after incremental amounts of contrast agent to give the plasma doses quoted in Table 1, and, assuming negligible washout over the experimental period (less than 45 minutes), the relative activation response was determined at each dose. A Combidex dose of approximately 6 mg Fe/kg body weight (in 500 µL saline, intravenous bolus) was used for all subsequent studies. For the functional activation experiments, gradient echo images were acquired using a fast low-angle shot-based sequence (Haase, 1990) (TE 15 or 40 milliseconds; TR 70 milliseconds; field of view 30 mm2; 23-degree flip angle; 1.0-mm slice thickness; image acquisition matrix was 128 × 64 and zero-filled to 256 × 256; number of repetitions 2; giving an acquisition time of approximately 9 seconds per image). The higher resolution functional activation maps shown in Fig. 2 were acquired with the same parameters with the exception that the image acquisition matrix was 256 × 128.
Relative signal intensity change during functional activation with increasing doses of Combidex†
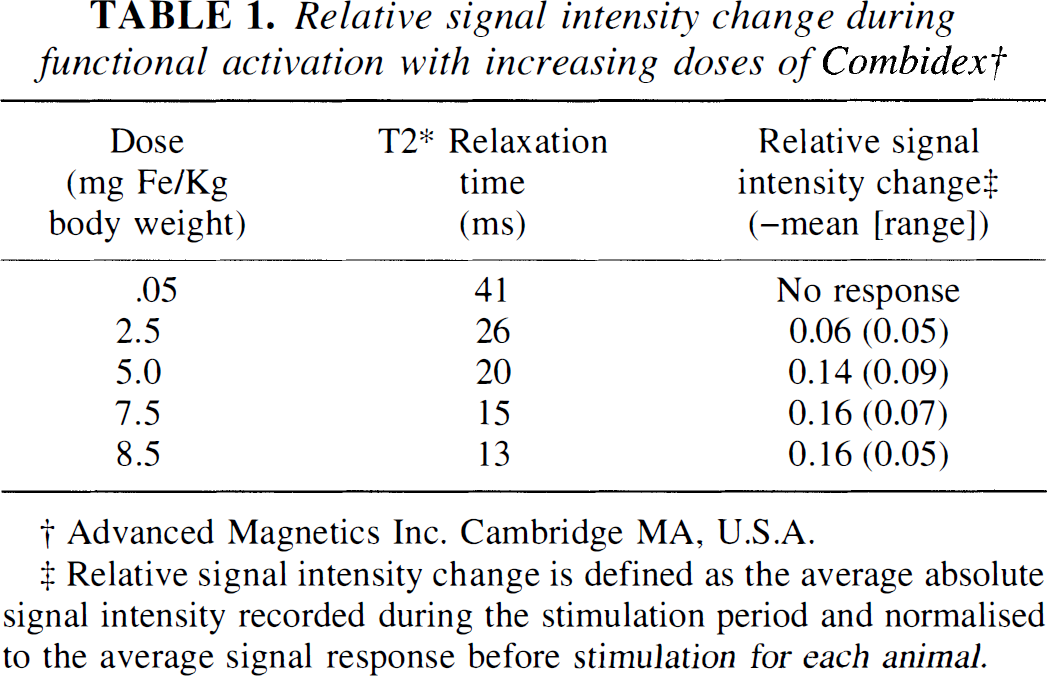
Advanced Magnetics Inc. Cambridge MA, U.S.A.
Relative signal intensity change is defined as the average absolute signal intensity recorded during the stimulation period and normalised to the average signal response before stimulation for each animal.
Functional activation paradigm
The fMRI activation paradigm consisted of an off—on—off sequence, with each period consisting of 10 images. A recovery period of at least 5 minutes was left between experiments. Forelimb stimulation was performed with a train of 3- to 5-V pulses with a 3-millisecond duration at 3 Hz, delivered using a pair of small needle electrodes inserted subcutaneously in the left forelimb. For reproducible stimulation, the electrodes were positioned such that digit motion was observed with the stimulation mentioned earlier.
All image postprocessing was performed using the MRVision software. Activation maps were generated by calculating the correlation for each pixel between the idealized square stimulation function and the measured time course. Signal intensity response was measured from the regions of activation, determined by eye from the cross-correlation maps. The observed signal intensity changes were normalized to the mean signal intensity recorded from the baseline images before stimulation.
RESULTS AND DISCUSSION
Physiologic parameters were recorded at intervals during the experiments and remained within an acceptable range (pH 7.25 to 7.45, Pa
The normalized signal intensity response for the BOLD effect is shown in Fig. 1A. A significant increase in signal intensity of 4.05% ± 1.69% was seen (mean ± SD signal response recorded during activation compared with the mean preactivation, n = 6, P = 0.002). A reduction in T2* from 45 to 16 milliseconds measured from the cortex was seen after injection of Combidex (6 mg Fe/kg body weight). Repeating the activation paradigm under these conditions resulted in a dramatic reduction in signal intensity during the stimulation period (Fig. 1B). Comparing the mean signal intensity before stimulation with the mean intensity during stimulation period gave a 9.11% ± 1.52% reduction in signal intensity (n = 6, P < 0.001). The coefficients of variation for the BOLD response and the CBV changes were 41.7% and 16.7%, respectively.
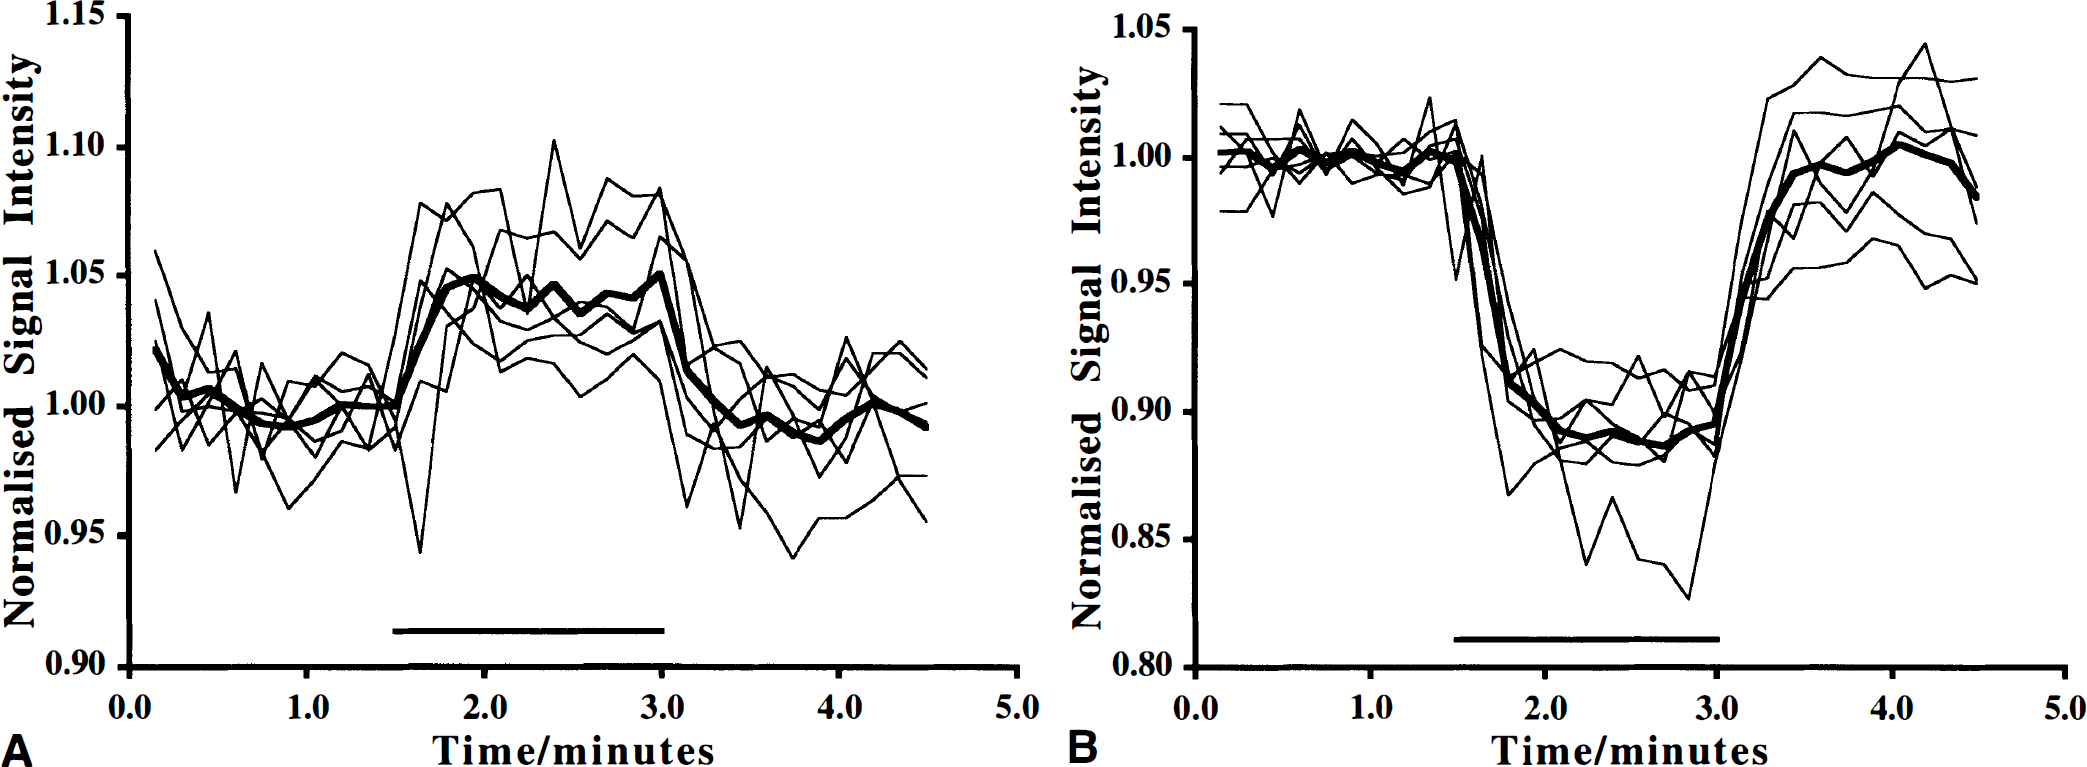
Relative signal intensity change with time during somatosensory stimulation. A comparison between the relative signal intensity response recorded from a region-of-interest centered in activated cortex is shown.
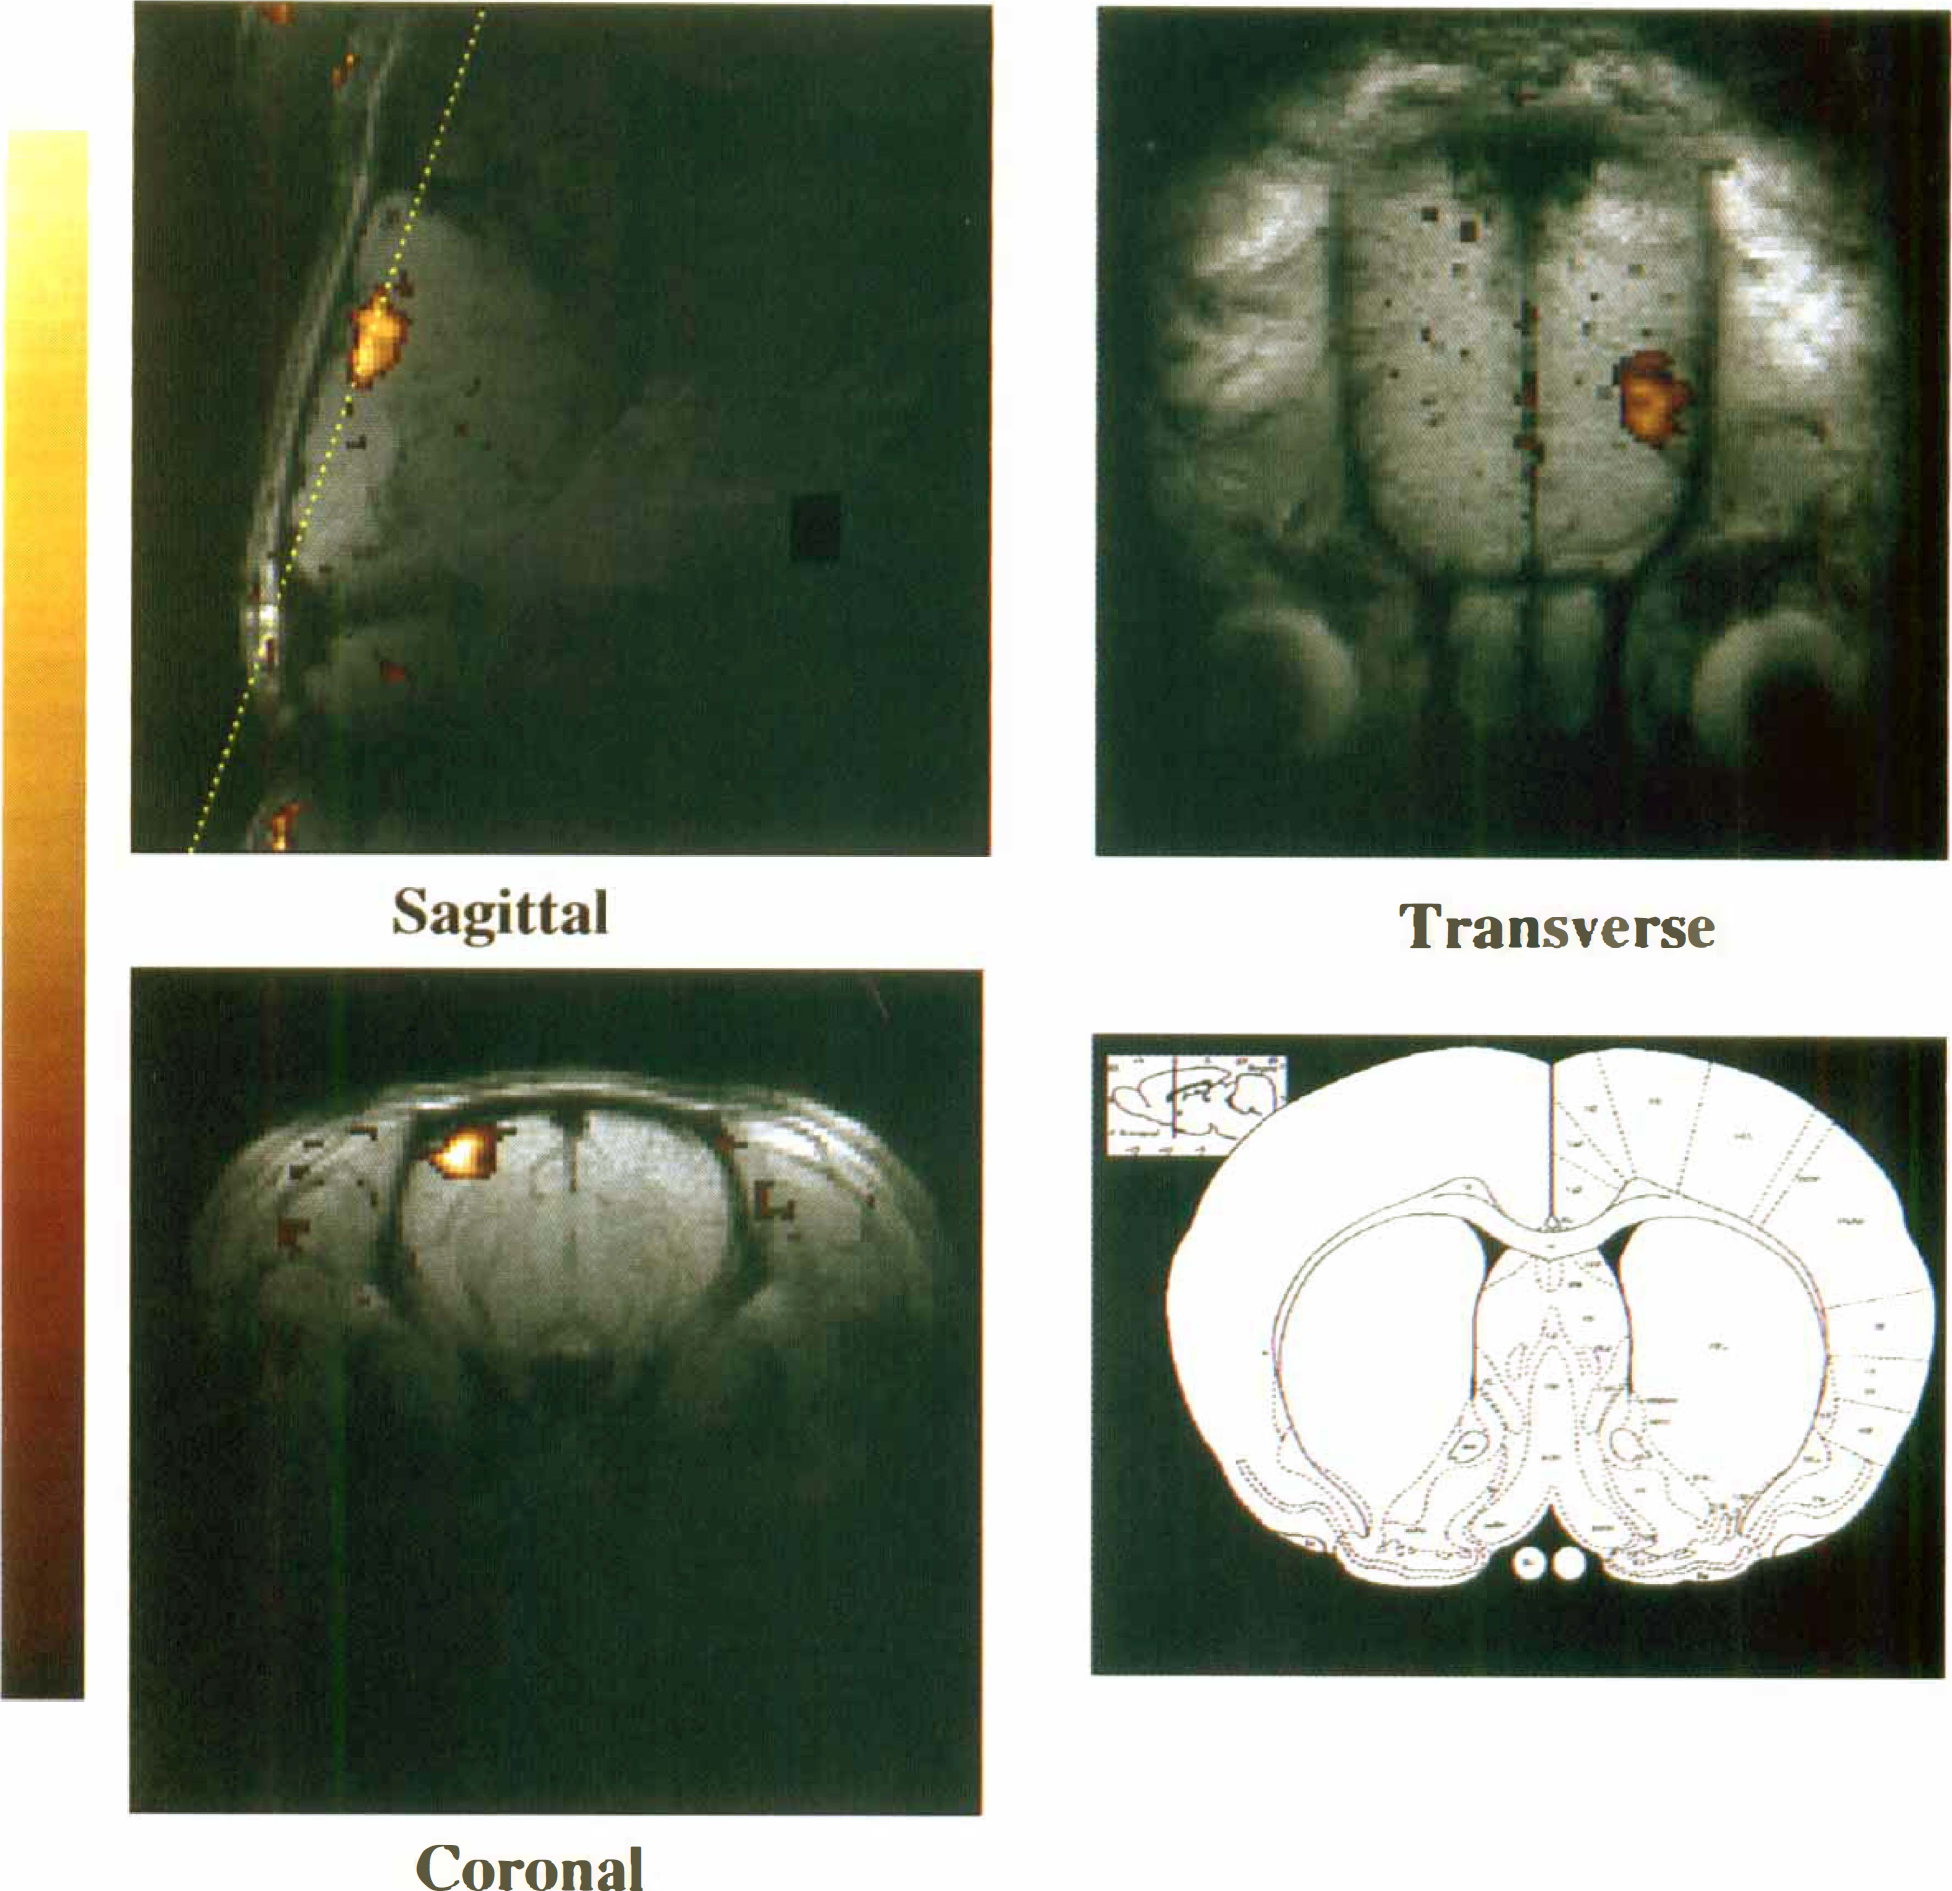
Activation maps acquired after Combidex injection. The sagittal section was defined from a transverse conventional spin-echo sequence, centered 3 mm from the midline contralateral to the stimulated forelimb and including the forelimb area of the cortex, as indicated by the line diagram (outline of rat brain centered 0.48 mm from bregma; reproduced from Paxinos and Watson, 1996, with permission from Academic Press, Inc.). The axial section was prescribed from the sagittal functional map as shown, and the transverse section was planned from the axial activation map. Functional magnetic resonance imaging parameters: repetition rate/echo time 70/14 milliseconds, field of view 30 mm, 23-degree flip angle, number of repetitions 4, 256 × 128. Correlation maps were overlaid in color onto gradient echo images acquired with higher signal-to-noise (number of repetitions 16) for anatomical localization. To map the activated areas, a correlation map was generated between the idealized square stimulation function and the measured time course at each pixel position and displayed as a pseudocolor temperature scale superimposed on the anatomical image.
The changes in signal intensity seen on stimulation were more marked at higher doses of contrast agent (Table 1). The response appeared to plateau at the top end of the concentration range used in this study, and no adverse side effects were associated with this dose. Higher doses of contrast agent may produce greater enhancement of the activation response but its effect on the physiologic state of the animal is uncertain.
To demonstrate the anatomical location of the regional changes seen from the CBV-weighted protocol, the fMRI experiment was repeated, but at higher resolution. Three consecutive activation experiments were performed in each plane, and activation maps were superimposed onto anatomical images (Fig. 2). Discrete activation in the somatosensory cortex was observed, consistent with the known tomographic location of the forelimb cortical representation.
Recent theoretical and experimental work shows that the dependence of nuclear magnetic resonance transverse relaxation rate (R2 & R2*) on agent concentration is approximately linear (Fisel et al., 1991; Berry et al., 1996; Weisskoff et al., 1994; Quast et al., 1994), thus it is possible to write

where S(0) is the MR image intensity precontrast injection, S(t) is the signal some time t after injection of the iron oxide contrast agent, and TE is the echo time of the gradient echo imaging sequence. This assumes that (1) the contrast agent is uniformly mixed throughout the blood volume, and (2) there is negligible contrast agent washout throughout the experiment. Strictly speaking, this technique is sensitive to the cerebral plasma volume (PV) = (1 – Hct)*CBV, where Hct is the (microvascular) hematocrit. A more useful quantity, however, is the change in blood volume, ΔCBV, during some event such as functional activation. This is the ratio of ΔR2* values before and during stimulation, and unknown constants of proportionality and Hct cancel from the equation (assuming that they remain constant during activation). If the relative signal change from the initial contrast agent injection is SrO and the relative signal change on activation is Sra (compared with preactivation, postinjection baseline), then the relative blood volume change on activation can be estimated as follows:

This assumes negligible change in T2* during the short time between contrast injection and the start of the activation scan. Using this formula for ΔCBV, from the average “CBV” signal change on activation and the average signal change on Combidex injection (9.11% ± 1.52% and 54% ± 14% at TE = 15 milliseconds, respectively) the relative CBV change that occurs during activation can be estimated as 19 ± 6%. Unfortunately, it is difficult to compare this estimate to literature values because of a lack of similar published studies. It is interesting to estimate the size of the competing BOLD effect at the same TE used for the CBV fMRI experiments. The average BOLD signal increase of 4.05% at TE = 40 milliseconds is equivalent to a change in transverse relaxation rate, ΔR2* = −0.99 seconds−1. This translates into a 1.5% BOLD signal increase at TE = 15 milliseconds, compared with the 9.11% signal decrease observed using the CBV effect, which suggests that our value of CBV change during activation is a slight underestimate as a result of the competing BOLD signal changes.
There are several potential advantages of using this approach over the BOLD response. The absolute signal intensity change is greater, resulting in improved contrast-to-noise ratio in the functional maps. The use of shorter TE would ultimately lead to more rapid acquisition (since TR can be reduced after the reduction in TE) for the gradient echo imaging sequence, or alternatively, an improvement in signal-to-noise ratio for the same acquisition time by allowing, for example, the acquisition of two averages after halving the TR interval. In addition, a lower TE may render the imaging sequence less sensitive to a loss of phase coherence resulting from system phase instability. Shorter TEs reduce the sensitivity of the imaging sequence to global macroscopic susceptibility artifacts that arise from interfaces of differing magnetic susceptibility outside of brain tissue (eg, skull and sinuses) but which may extend over a considerable distance. This kind of distortion is prevalent in animal experiments because of the small, highly inhomogeneous samples and the fact that the work is done at higher magnetic field strengths. However, the signal response observed in these studies contains contributions from several different tissue compartments, both intravascular and extravascular, including capillary bed and larger vessels. The relative contribution from each depends on factors such as vessel size and geometry, as well as the MR imaging protocol used, and several detailed studies have been performed to address these issues (Weisskoff et al., 1994; Kennan et al., 1994; van Zijl et al., 1998). The MR pulse sequences, such as spin-echo—based sequences with reasonable TE (eg, rapid acquisition with relaxation enhancement-based sequences [Hennig et al., 1986]), are more sensitive to small vessels and may produce better parenchymal localization (Bandettini et al., 1994; Weisskoff et al., 1994; Kennan et al., 1994). Further studies are required to fully establish the underlying mechanism responsible for the observed signal response and to optimize the experimental conditions for accurate CBV-weighted fMRI of somatosensory function.
In conclusion, we have demonstrated that the local increase in CBV associated with somatosensory activation can be detected by MR imaging using steady-state magnetic susceptibility contrast agents. The signal response observed occurs mainly as a result of a change in CBV and offers a robust approach for generating activation maps of cortical function in laboratory animals.
Footnotes
Acknowledgments
The authors thank Dr. S. Davies for helpful discussions.