
Abstract
Magnetic resonance imaging (MRI) and spectroscopy (MRS) were used at a magnetic field strength of 7 T to measure CBF and CMRO2 in the sensorimotor cortex of mature rats at different levels of cortical activity. In rats maintained on morphine anesthesia, transitions to lower activity and higher activity states were produced by administration of pentobarbital and nicotine, respectively. Under basal conditions of morphine sulfate anesthesia, CBF was 0.75 ± 0.09 mL · g−1 · min−1 and CMRO2 was 3.15 ± 0.18 μmol · g−1 · min−1. Administration of sodium pentobarbital reduced CBF and CMRO2 by 66% ± 16% and 61% ± 6%, respectively (i.e., “deactivation”). In contrast, administration of nicotine hydrogen tartrate increased CBF and CMRO2 by 41% ± 5% and 30% ± 3%, respectively (i.e., “activation”). The resting values of CBF and CMRO2 for α-chloralose anesthetized rats were 0.40 ± 0.09 mL · g−1 · min−1 and 1.51 ± 0.06 μmol · g−1 · min−1, respectively. Upon forepaw stimulation, CBF and CMRO2 were focally increased by 34% ± 10% and 26% ± 12%, respectively, above the resting nonanesthetized values (i.e., “activation”). Incremental changes in CBF and CMRO2, when expressed as a percentage change for “deactivation” and “activation” from the respective control conditions, were linear (R2 = 0.997) over the entire range examined with the global and local perturbations. This tight correlation for cerebral oxygen delivery in vivo is supported by a recent model where the consequence of a changing effective diffusivity of the capillary bed for oxygen, D, has been hypothetically shown to be linked to alterations in CMRO2 and CBF. This assumed functional characteristic of the capillary bed can be theoretically assessed by the ratio of fractional changes in D with respect to changes in CBF, signified by Ω. A value 0.81 ± 0.23 was calculated for Ω with the in vivo data presented here, which in turn corresponds to a supposition that the effective oxygen diffusivity of the capillary bed is not constant but presumably varies to meet local requirements in oxygen demand in a similar manner with both “deactivation” and “activation.”
Keywords
Brain cells rely on an abundant and continuous supply of oxygen for normal function. Reductions in the supply of oxygen can readily lead to neuronal damage. This extreme vulnerability of cerebral tissue to oxygen deprivation results from the high rate of metabolism, relatively low intracellular energy reserves, and the low blood volume supplying the oxygenated hemoglobin. Therefore, normal brain function requires that oxygen delivery be regulated in relation to the oxidative metabolic requirements of the nerve cells.
The rate of oxygen delivery to brain tissue from blood depends on the vessel-to-tissue oxygen partial pressure (P
On basis of the assumption that oxygen delivery across the endothelium is proportional to the vessel P
An extensive reexamination of the relevant rat and human data from the literature (Hyder et al., 1998) demonstrates that at steady-state conditions, CBF and CMRO2 change in a near-stoichiometric manner from the resting anesthetized condition over a wide dynamic range (including the resting awake condition or higher). As pointed out by Gjedde (1997) and Buxton and Frank (1997), a near-linear relationship between CBF and CMRO2 cannot be maintained with a constant oxygen diffusivity because of the vessel P
A limitation in inferring a relationship between CBF and CMRO2 from values reported in the literature is that most of the studies were done by different investigators using different methodologies. In the current study, we use magnetic resonance imaging (MRI) and spectroscopy (MRS) methods to perform combined measurements of CMRO2 and CBF in rats under different levels of hemodynamic and metabolic activity induced by anesthesia along with sensory stimuli. We find that over a large activity range the data are best fit with a single value of Ω which is nonzero. These results imply an important role for changes in capillary bed diffusivity in regulating oxygen delivery.
MATERIALS AND METHODS
Animal preparation
Sprague-Dawley rats (adult males weighing 140 to 210 g, fasted 24 hours) were tracheotomized and ventilated with a mixture of N2O/O2 (70/30) under 1% halothane anesthesia. A femoral artery and vein were cannulated for periodic blood sampling (for measurement of blood gases, pH, pressure, and glucose) and
Experimental paradigm
The objective of these experiments was to obtain paired measurements of cortical CBF and CMRO2 at different levels of cerebral activity. Animals were divided into five treatment groups.
In three cases, each group received an anesthetic dose of morphine sulfate balanced with nitrous oxide either alone (group A) or in combination with sodium pentobarbital (group B) to reduce activity or nicotine hydrogen tartrate (group C) to increase activity. The animals in group A (protocol I) received an initial morphine sulfate intraperitoneal dose of 50 mg/kg with supplemental doses of 25 mg/kg every 30 minutes. The animals in group B (protocol II, “deactivation”) received an initial pentobarbital intraperitoneal dose of 45 mg/kg with supplemental doses of 10 mg/kg every 30 minutes. The animals in group C (protocol III, “activation”) received nicotine hydrogen tartrate at a dose of 4 mg/kg at a constant intravenous infusion rate of 16.7 μL/min. For each animal in group A (n = 5), CBF and CMRO2 were measured together under basal conditions of morphine/nitrous oxide anesthesia. For each animal in group B (n = 4), the CBF alone was measured before pentobarbital administration under basal conditions, then CBF and CMRO2 were measured together after pentobarbital administration. For each animal in group C (n = 5), the CBF was measured before nicotine administration under basal conditions, then the CBF and CMRO2 were measured together after nicotine administration.
In two cases, each group received an anesthetic dose of α-chloralose balanced with nitrous oxide either alone (group D) or in combination with forepaw stimulation (group E) to increase focal activity in the sensorimotor region of both hemispheres (Hyder et al., 1996). The CBF was measured at rest for the animals in group D (protocol IV, n = 4) and during stimulation of both forepaws (i.e., activation) for the animals in group E (protocol V, n = 4). The CMRO2 values for groups D (n = 4) and E (n = 3) were obtained from unpublished data collected from a protocol described in Hyder et al (1996). A pair of copper electrodes (6 mm long, 1 mm in diameter) were inserted into the skin of each forepaw (between digits 1 and 2, and 3 and 4). An electrical stimulator (Harvard Apparatus Limited, Kent, MA, U.S.A.) provided low-voltage square-wave pulses of 0.3-millisecond duration at 3 Hz (Hyder et al., 1994).
Infusion of 13C-labeled glucose
MRS and MRI measurements
General procedures. All in vivo MRS and MRI data were acquired on a highly modified 7 T Bruker Biospec I horizontal-bore spectrometer (Bruker, Billerica, MA, U.S.A.) operating at 300.6 and 75.5 MHz for 1H and 13C, respectively. The transceiver coils consisted of a 1H resonator (8-cm diameter) for transmission of RF pulses with an orthogonally oriented 1H surface-coil as a receiver (1-cm diameter). The two coils were positioned relative to one another such that the homogenous regions of the two RF coils were coincident. The arrangement of the two 1H RF coils also minimized sensitivity losses in the receiver coil, permitting better localized shimming and homogeneous transmission. The 1H resonator covered the upper half of the rat's torso, whereas the 1H surface-coil was positioned over the frontoparietal region of the brain. A concentric surface-coil (20-mm diameter) tuned to the 13C frequency was used for the proton observed carbon edited (POCE) experiment (see later).
The static magnetic field homogeneity of the localized volume, which encompassed the bilateral sensorimotor area of the cortex, was optimized by localized shimming before data acquisition. The line-width at half-height for the water signal obtained from the localized volume (x, y, z = 7.5, 1.6, 4.0 mm3) was between 14 and 16 Hz. Coronal, multislice anatomic images (four slices separated by 1 mm, each slice 1-mm thick) provided coordinates for the placement of a 48-μ
Determination of CMRO2 from [C4]-glutamate turnover. The POCE data were acquired during infusion of [1-13C]glucose and localized to the sensorimotor cortex. The experimental details of the localized POCE experiment have been described earlier (Hyder et al., 1996, 1997). Briefly, the sequence included inversion recovery water suppression, image selected in vivo spectroscopy (ISIS; Ordidge et al., 1986) volume selection (x, y, z = 7.5, 1.6, 4.0 mm3), and surface lipid suppression (Hyder et al., 1999a) before the POCE pulse sequence. The POCE segment of the sequence consisted of a spin-echo with TE of 20 milliseconds, and two balanced crusher gradients (each 2 milliseconds in duration) were used in each half of the spin-echo sequence to eliminate nonrefocused magnetization. A 1H90° composite pulse (θyθxθ_yθx) was followed by a 1H-180° 2-τ-2 semiselective pulse (θxθx; τ = 676 microseconds). A 13C-180° phase-cycled pulse (θxθ± x) was centered at ½J (= 4 milliseconds; J ≈ 125 Hz) from the 1H-90° pulse. Each free-induction decay was acquired in the presence of a broadband (± 20 ppm) 13C composite Waltz-16 decoupling pulse (θ θ θ θ, where θ = 270°_x360°+x180°_x270°+x90°_x 180°+x360°_x180o+x270°_x and θ denotes the phases inverted; Shaka et al., 1983) at 2 W during the acquisition time (204.8 milliseconds). The 13C inversion pulse, which was applied in alternate scans by alteration of its phase (θxθ± x), resulted in more than 98% inversion over a bandwidth of ± 2.5 ppm (in 1H chemical-shift) based on in vitro samples of [2-13C]acetate and glycine. The TR for each acquisition was 2 seconds, and these parameters corresponded to a decoupling duty cycle of approximately 7%, with an average power deposition of 140 mW (at the preamplifier level). The actual power deposition in the brain was several-fold less than this value because the 13C RF coil covered a larger region than the brain as well as loss of power within the coil. Consecutive free-induction decays, with and without the 13C inversion, were collected in two different memory blocks (64 scans per block). Before Fourier transformation, one block was substracted from the other, zero-filled to 8 K, and exponentially line-broadened (10 Hz). The POCE difference-spectrum was phase corrected between 4.0 and 0.5 ppm (zero- and first-order phase corrections), and the peak height of [C4]-glutamate at 2.35 ppm was measured.
The rat brain was frozen in liquid nitrogen at the end of each in vivo experiment. Each brain was removed from the skull, and an identical region of the cortex (approximately 50 mg), as in the in vivo study (see earlier), was removed. Acid-soluble amino acids were extracted from the frozen tissue using methanol/HCl and 3 M perchloric acid, as previously described (Behar et al., 1986). The 13C fractional enrichment of [C4]-glutamate was determined from POCE spectra at 360.13 MHz. Samples of blood plasma (approximately 50 μL) were extracted for quantitation (Behar et al., 1986) of total glucose concentration and 13C fractional enrichment of [C1]-glucose.
The details of the metabolic modeling have been described previously (Mason et al., 1992; Hyder et al., 1996, 1997). Bestfit of the metabolic model to the [C4]-glutamate fractional enrichment time course was used to calculate tricarboxylic acid (TCA) cycle flux (VTCA). For each value of VTCA, CMRO2 was determined by relationship 3 × VTCA. From our previous studies (Hyder et al., 1996, 1997), it was determined that the major source of dilution to the acetyl coenzyme A pool is the pyruvate/lactate blood-brain exchange, which has little effect on the calculated rates. Fits performed with either slow or rapid glucose transport showed that glucose transport is not the rate-limiting factor in glucose metabolism in vivo, and glutamate-glutamine exchange is not the rate-limiting factor in the 13C turnover data of [C4]-glutamate (Hyder et al., 1996, 1997). These analyses reveal relatively small effects of flux measurements (≤10%) for the dynamic range covered in this study (Mason et al., 1992; Hyder et al., 1996, 1997). Partial-volume corrected CMRO2 values were obtained for the forepaw stimulation data, as previously described (Hyder et al., 1997), using the relationship of CMRO2(activated) = [CMRO2(observed) – (1 – f) × CMRO2(rest)]/f, where f represents the fraction of activated tissue in the ISIS compartment using the activated CBF map thresholded at the resting CBF value.
Determination of CBF from absolute R1 maps. The CBF data were obtained by an inversion recovery method (Schwarzbauer et al., 1996). Coronal, multislice, spin-echo echo-planar imaging (EPI) data (Mansfield, 1977) with R1-weighting were obtained with 10 TIR values, ranging from 200 to 1800 milliseconds, with delayed acquisition approaches to minimize the effects of vascular artifacts in steady-state arterial spin labeling methods (Calamante et al., 1999). The EPI data were acquired with sequential sampling (Hyder et al., 1995) and the following parameters: TE = 28 milliseconds, image matrix = 32 × 32 pixels, and spatial resolution = 430 × 430 × 1000 μm. A sinc pulse (Mansfield et al., 1979) was used for slice-selective excitation and an adiabatic fast passage hyperbolic secant pulse (Silver et al., 1984) was used for slice refocusing. Excitation and refocusing slice thicknesses were 1 mm, whereas the inverted slice was 5 mm. Two consecutive images corresponding to slice-selective and nonselective inversions were obtained under fully relaxed conditions for each TIR. Adiabatic fast passage hyperbolic secant pulses also were used for inversions. R1 maps for slice-inverted (R1s) and nonselect inverted (R1n) data were calculated with single exponential recovery fits. The use of this method requires the value of R1 of blood water (R1b). Because the EPI data were not of sufficient spatial resolution to delineate large arteries in the imaging plane, high spatial resolution spin-echo MRI data (consecutive coronal images of slice-selective and nonselective inversions) were acquired for rats (condition A, n = 3) with the following parameters: TE = 28 milliseconds, image matrix = 256 × 256 pixels, spatial resolution = 75 × 75 × 250 μm, and multiple TIR values ranging from 200 to 2200 milliseconds. R1b was measured (0.5 ± 0.1 s−1) from pixels in the R1n images, which clearly delineated large vessels near the cortical surface. The dynamic range of this perfusion imaging method, which is based on absolute R1 measurements in labeled and control images, was tested by obtaining images before and during hypercapnia (10% CO2 inhalation) and at death (see later). Absolute CBF was calibrated (Schwarzbauer et al., 1996) on a pixel-by-pixel basis by the relationship of 60 × (λ/(1+∊))(R1s – R1n), where λ is the brain-blood partition coefficient for water (0.95 mL/g) and ∈ is a correction coefficient, which is given by ¾(1 – R1b/R1n). Another perfusion image was calculated, CBF0 = 60 × λ(R1s – R1n), and a relative error image, δCBF, was calculated as (CBF0 – CBF)/CBF. From the high spatial resolution perfusion data (see earlier), a systemic error of less than 5% was determined for the dynamic range (Schwarzbauer et al., 1996). Regional values of CBF were obtained by averaging pixels in the rectangular volume of 7.5 × 1.6 × 4.0 mm3 across four slices. The position of the resulting volume in the cortex corresponds to the same region used in the measurement of CMRO2.
The “tagged” signal in MRI spin tagging methods is not only contingent on tissue perfusion, but also is dependent on vascular transit time effects. Problems of this nature can be minimized (Calamante et al., 1999) with optimal choice of inversion-excitation slice thickness ratio, short pulse lengths, uniform nonselective inversions, and acquisition of each inversion recovery image under fully relaxed conditions. To use optimal conditions for accurate CBF measurement, we performed all of the studies at metabolic and hemodynamic steady-state. Since the pulse duration for each adiabatic inversion was less than 5 milliseconds, the inversion-excitation slice thickness ratio was 5:1, and each tag was made under relaxed conditions (i.e., data acquisition did not have time constraints), the induced systematic errors were negligible (≤5%). Since methods that require subtraction of the control image from the labeled image are heavily dependent on the choice of an optimal TIR value so that the arterial transit time can be accounted for in the difference image (Yang et al., 1998), the approach used here relies on comparison of R1 maps (Schwarzbauer et al., 1996). The use of a large homogenous RF transmission coil for each nonselective inversion provided a situation that, for each subsequent slice excitation, the “untagged” blood volume was negligible. Specific approaches have been described to reduce systematic errors associated with rapid acquisition of CBF data (Buxton et al., 1998).
Simulations and calculations
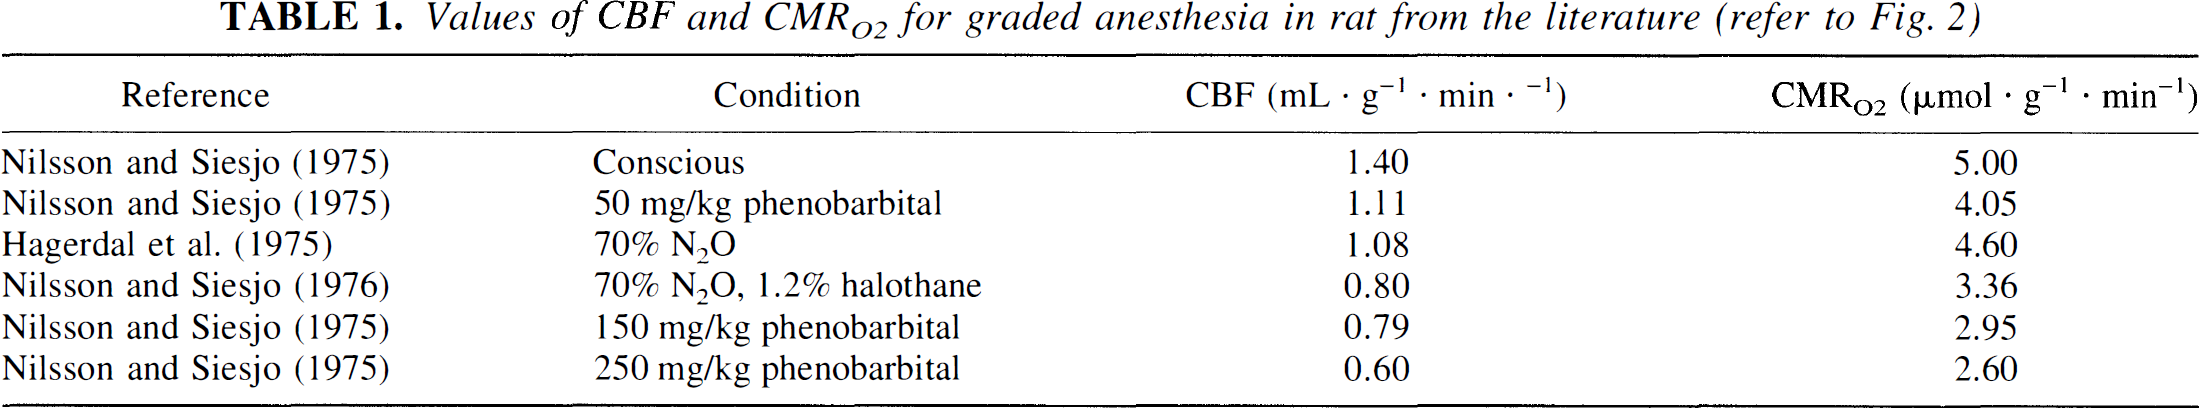
Values of CBF and CMRO2 for graded anesthesia from the literature. Basal values of CBF and CMRO2 for the conscious condition and graded anesthesia were obtained from the literature for the rat cortex (Hagerdal et al., 1975; Nilsson and Siesjo, 1975, 1976) as shown in Table 1. In each study, the systemic physiologic parameters as measured from blood (e.g., P
Values of CBF and CMRO2 for graded anesthesia in rat from the literature (refer to Fig. 2)
Calculation of Ω, prediction of ΔCMRO2/CMRO2, and uncertainty in Ω. Oxygen extraction fraction (OEF) in the vicinity of a capillary bed is given by (Hyder et al., 1998, 1999b)

where the mathematical notation of D as well as the hypothetical makeup, the assumptions involved, and the flexibilities of the parameter are discussed briefly in Appendix B. Assuming equivalence between Eq. 1 and Fick's equation

where

where the term Ω is hypothesized to reflect the changes in the effective diffusivity of oxygen in relation to circulation (Appendices A and B). The value of Ω (Hyder et al., 1998a, 1999c; Appendix C) can be determined by
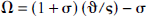
where
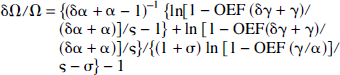
where δα and δγ are errors associated with ΔCBF/CBF and ΔCMRO2/CMRO2, respectively, at different activity levels. All results are presented as means ± SD.
RESULTS
Cerebral function in terms of “deactivation” and “activation” transitions
Whereas the blood gases (i.e., P
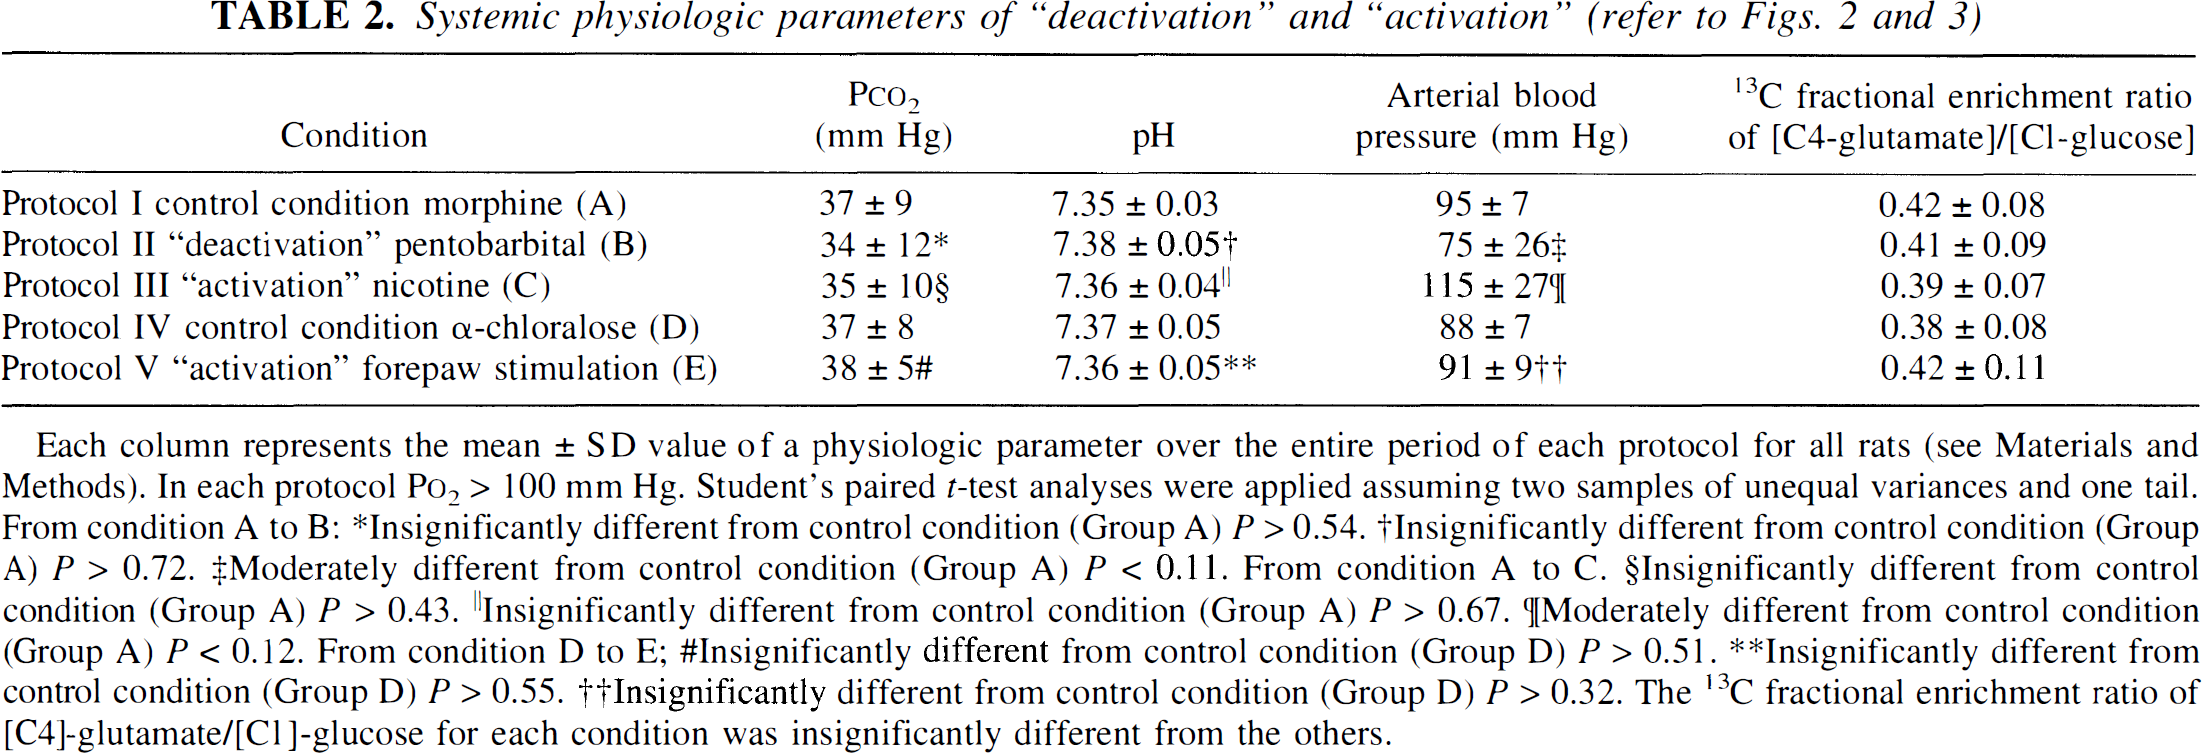
Each column represents the mean ± SD value of a physiologic parameter over the entire period of each protocol for all rats (see Materials and Methods). In each protocol P
Insignificantly different from control condition (Group A) P > 0.54.
lnsignificantly different from control condition (Group A) P > 0.72.
Moderately different from control condition (Group A) P < 0.11. From condition A to C.
Insignificantly different from control condition (Group A) P > 0.43.
Insignificantly different from control condition (Group A) P > 0.67.
[Moderately different from control condition (Group A) P < 0.12. From condition D to E;
Insignificantly different from control condition (Group D) P > 0.51.
Insignificantly different from control condition (Group D) P > 0.55.
Insignificantly different from control condition (Group D) P > 0.32. The 13C fractional enrichment ratio of [C4]-glutamate/[C1]-glucose for each condition was insignificantly different from the others.
The anesthetics and dosage levels were chosen such that “autoregulation” of metabolism and perfusion were maintained over the full range of activity. Additional evidence that autoregulation was maintained in our protocol is that across the full range of activity achieved, the correlation coefficients between regional metabolic and perfusion rates for the anesthetized conditions are nearly identical to those of the awake rat, e.g., 0.84 ± 0.14 versus 0.92 from Des Rosiers et al. (1974) and 0.88 from Sokoloff (1981). These results support the concept that the primary control over cerebral perfusion in the mature brain is related to the regional metabolic demands of the mitochondria (i.e., autoregulation).
Changes in CBF and CMRO2 during global and focal perturbations
Figure 1 shows examples of metabolic and perfusion data obtained from rats during the control condition of morphine anesthesia (group A), pentobarbital administration (group B), and nicotine infusion (group C), another control condition of α-chloralose anesthesia (group D), and forepaw stimulation of α-chloralose anesthetized rats (group E). For global perturbations, Fig. 1 demonstrates that relative to the control condition of morphine anesthesia (group A), VTCA and CBF are lowered with pentobarbital (group B, “deactivation”) and increased with nicotine (group C, “activation”). Similarly, for focal perturbations, Fig. 1 demonstrates that relative to the control condition of α-chloralose anesthesia (group D) VTCA and CBF are increased with forepaw stimulation (group E, “activation”). A mean value of 67 ± 18% was determined for f based on thresholded activated CBF maps. Use of high-resolution VTCA mapping (Hyder et al., 1999c) in conjunction with multiple tissue compartmental analysis of VTCA (Hyder et al., 1997) would reduce the uncertainties associated with the current partial-volume correction approach.
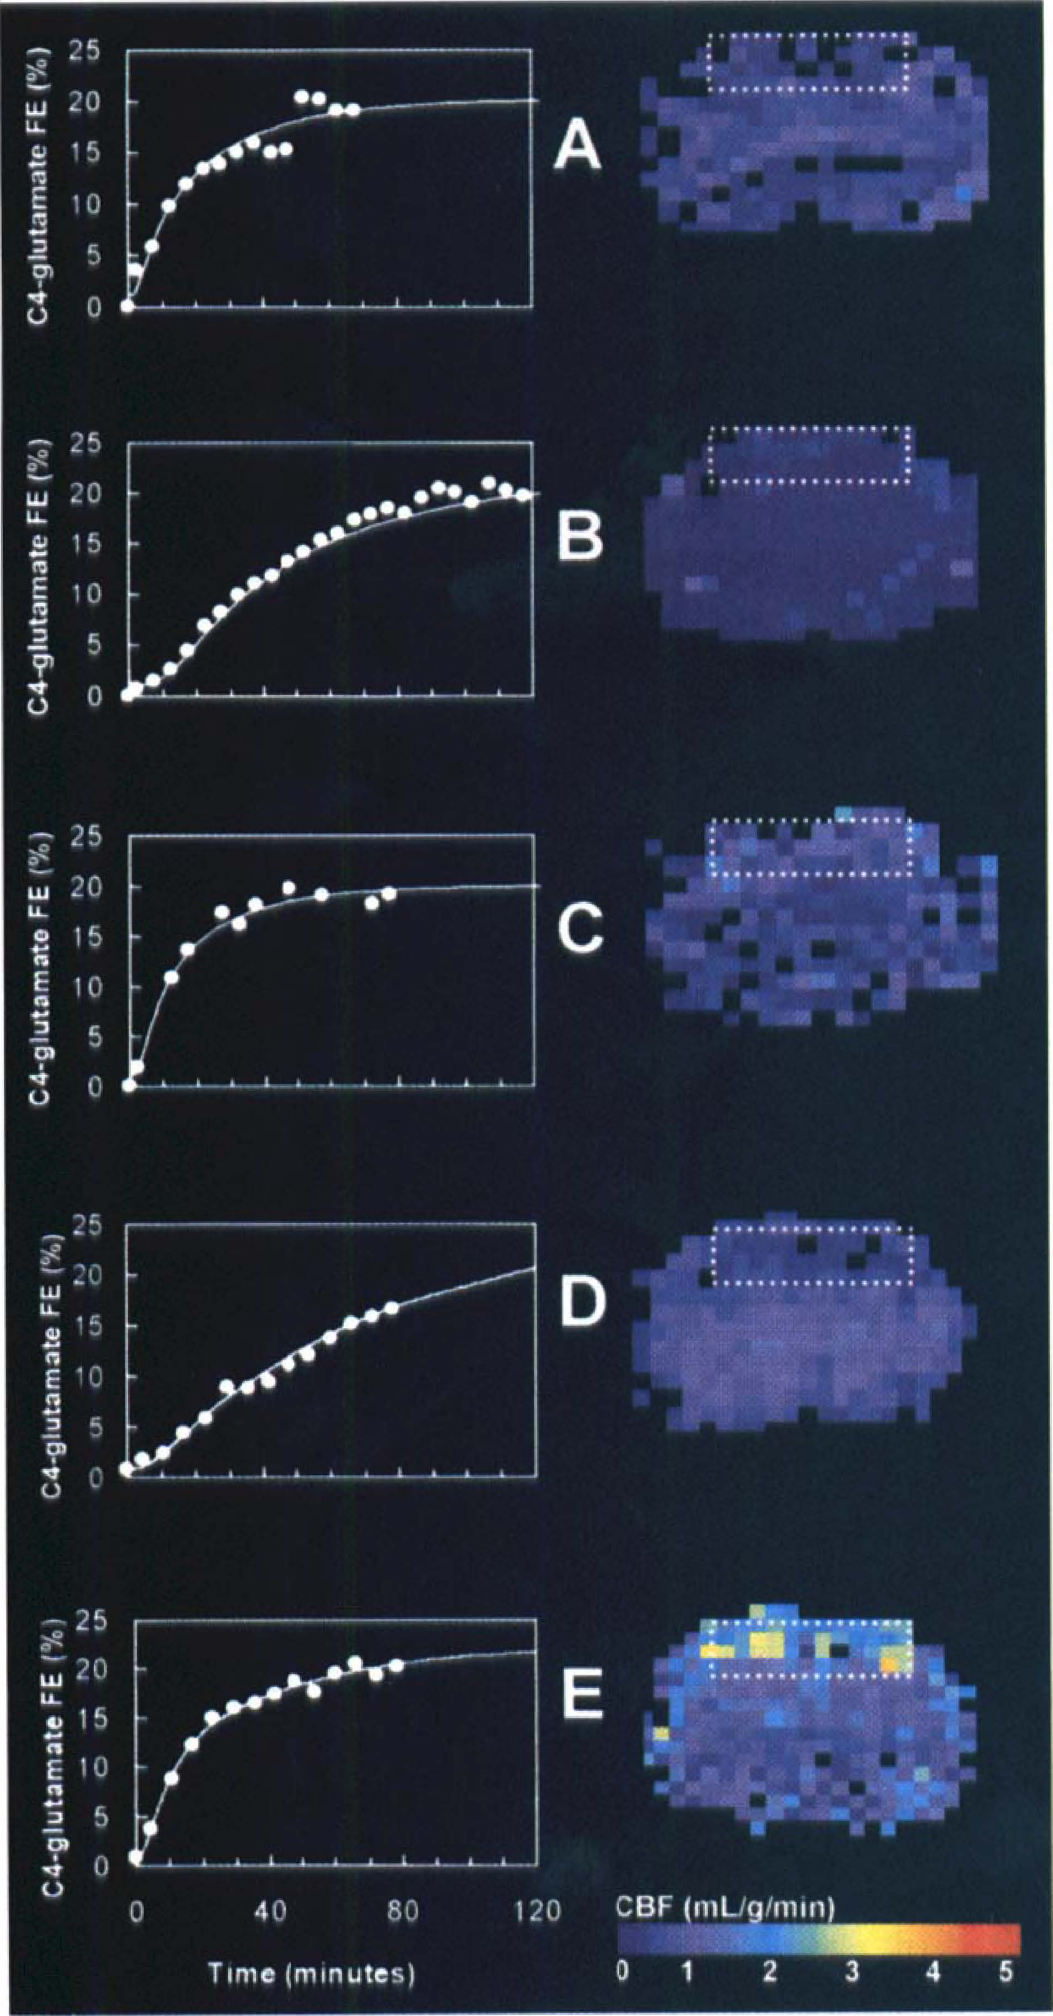
Measurements of CBF and CMRO2 in the same rat, by MRI and MRS methods, such that changes in cerebral activity induced by barbiturate and narcotic agents, as well as sensory stimulation, could be quantified in the sensorimotor cortex. The right and left columns show the CBF (mean of four slices) and VTCA (which then is converted to CMRO2) data, respectively. The color bar at the bottom right shows the scaling for the CBF data. The metabolic information is depicted as [C4]-glutamate time courses from POCE data (•) and the best-fits of the metabolic model (—) to the data, where the vertical axis is the [C4]-glutamate 13C fractional enrichment in the brain and the horizontal axis is the time after [1-13C]glucose infusion began. The dotted white box in each CBF map represents the localized region from where the metabolic data were obtained. The data are separated into five groups: group A is the control condition of morphine sulfate anesthesia, group B is the lower activity condition (“deactivation” from A) with addition of sodium pentobarbital, group C is the higher activity condition (“activation” from A) with infusion of nicotine hydrogen tartrate, group D is another control condition of α-chloralose anesthesia-nitrous oxide, and group E is the higher activity condition (“activation” from D) with forepaw stimulation. For the global perturbations, CBF is lowered to 0.28 ± 0.05 mL · g−1 · min−1 with pentobarbital (group B) and increased to 0.90 ± 0.10 mL · g−1 · min−1 with nicotine (group C) from the control condition value of 0.77 ± 0.08 mL · g−1 · min−1 (group A), and VTCA is decreased with the barbiturate to 0.46 ± 0.06 μmol · g−1 · min−1 (group B) and increased with the narcotic to 1.27 ± 0.15 μmol · g−1 · min−1 (group C) from a control value of 0.96 ± 0.11 μmol · g−1 · min−1 (group A). For the focal perturbations, CBF is increased to 1.94 ± 0.24 mL · g−1 · min−1 with forepaw stimulation (group E) from the control condition value of 0.42 ± 0.07 mL · g−1 · min−1 (group D), and VTCA is increased with the forepaw stimulation to 2.11 ± 0.31 μmol · g−1 · min−1 (group E) from a control value of 0.51 ± 0.06 μmol · g−1 · min−1 (group D). See Fig. 2 for the CBF and CMRO2 values obtained for each condition.
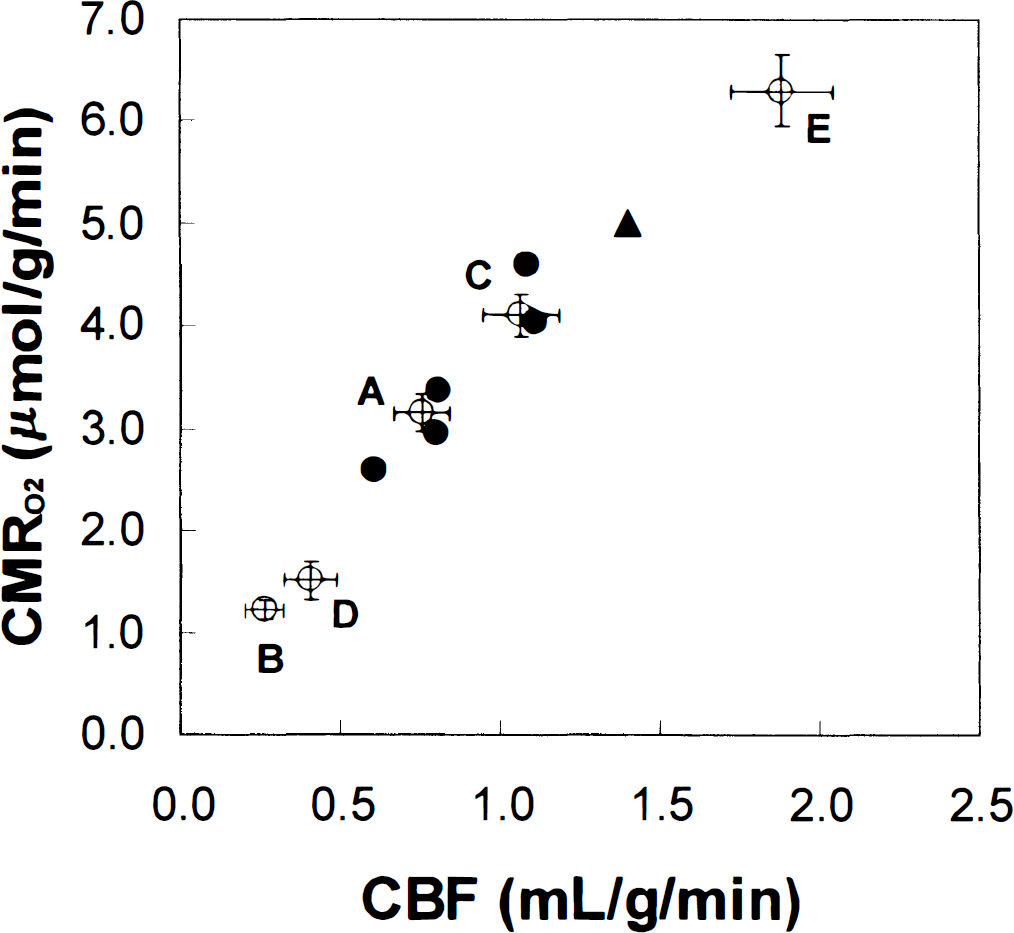
Absolute values of CMRO2 and CBF for the five levels of activities measured in this study (○) in the rat cortex are compared with conscious data (△) and graded anesthesia data from the literature (•) for rat cortex. See Table 1 for details of the literature data points. Statistical significance were determined by Student's paired Mest assuming two samples of unequal variances with one tail. For the global perturbations, from the control condition of group A, CBF and CMRO2 were reduced by 66% ± 16% (P < 0.003) and 61% ± 6% (P < 0.001), respectively, with sodium pentobarbital in group B; CBF and CMRO2 were increased by 41% ± 5% (P < 0.002) and 30% ± 3% (P < 0.001), respectively, with nicotine hydrogen tartrate in group C. For the focal perturbations, from the control condition of group D, CBF and CMRO2 were increased by 34% ± 10% (P < 0.006) and 26% ± 12% (P < 0.008), respectively, above the resting nonanesthetized values with forepaw stimulation in group E. For the rat sensorimotor cortex, the value of Ψ, which is equal to the slope of the curve or (ΔCMRO2/CMRO2)/(ΔCBF/CBF), determined from this study (0.84 ± 0.14) is in excellent agreement with the literature value (0.88 ± 0.06). These results suggest that CBF and CMRO2 change linearly within the autoregulation range. The error bars represent mean ± SD in each case.
For the whole study, under the control condition of morphine—nitrous oxide, CBF was 0.75 ± 0.09 mL · g−1 · min−1. As shown in Fig. 2, CBF decreased to 0.26 ± 0.06 mL · g−1 · min−1 after pentobarbital treatment (Fig. 2, group B) and increased to 1.06 ± 0.12 mL · g−1 · min−1 in rats treated with nicotine (Fig. 2, group C) from the control condition (Fig. 2, group A). In these same animals, the cortical TCA cycle flux, VTCA, changed in parallel with changes in CBF (Fig. 2). The VTCA decreased to 0.41 ± 0.03 μmol · g_1 · min−1 after pentobarbital treatment and increased to 1.37 ± 0.07 μmol · g−1 · min−1 in rats treated with nicotine, compared with the morphine-nitrous oxide control group (1.05 ± 0.06 μmol · g−1 · min−1). Assuming that glucose is the main substrate for mitochondrial oxidation, the corresponding values of CMRO2 for groups A to C were 3.15 ± 0.18 μmol · g−1 · min−1 (control), 1.23 ± 0.09 μmol · g−1 · min−1 (pentobarbital), and 4.11 ± 0.21 μmol · g−1 · min−1 (nicotine). Similarly, under the control condition of α-chloralose anesthesia-nitrous oxide, CBF and CMRO2 were 0.40 ± 0.09 mL · g−1 · min−1 and 1.51 ± 0.06 μmol · g−1 · min−1, respectively, for all rats studied (Fig. 2, group D). Upon forepaw stimulation, CBF and CMRO2 were focally increased by 34 ± 10% and 26 ± 12%, respectively, above the resting nonanesthetized values (Fig. 2, group E).
Comparison of current findings with previous results in the literature
The values of CMRO2 and CBF for the five levels of cortical activity (open circles) are plotted in Fig. 2 along with a comparison of cortical CBF and CMRO2 from studies of awake (solid triangle) and anesthetized rats (solid circles) from the published literature (Table 1). As shown in Fig. 2, the results of the current study (open circles) are in excellent agreement with the reported values (solid symbols). The CBF and CMRO2 values for the data points in Fig. 2 are replotted in Fig. 3, where the awake condition (solid triangle) is the point of reference. The relationship was nearly linear over a wide range of cerebral activity. The slope of the line defined by the open circles in Fig. 3, given by Ψ = (ΔCMRO2/CMRO2)/(ΔCBF/CBF), was 0.84 ± 0.14 (R2 = 0.98), which is in good agreement with the previously reported values of 0.88 ± 0.06 for the anesthetized (Hyder et al., 1998, 1999b).
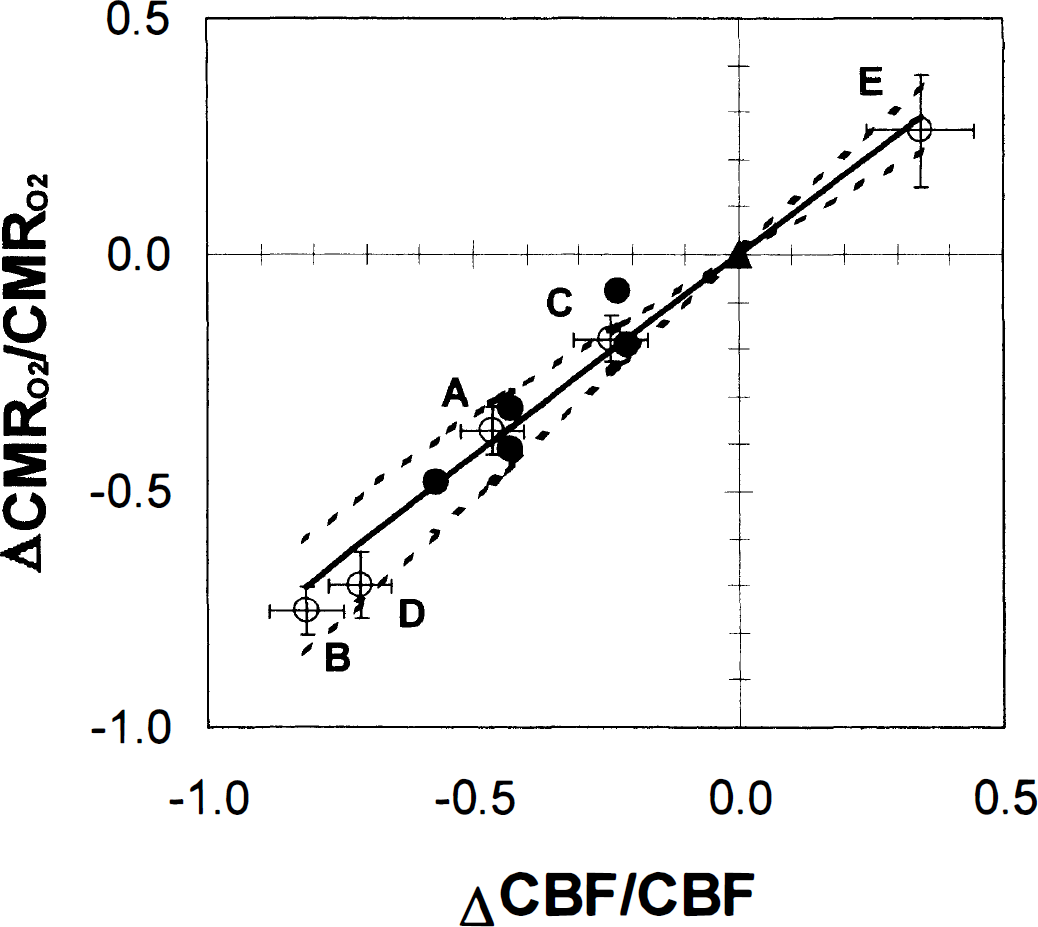
The ΔCMRO2/CMRO2 and ΔCBF/CBF values for the data points in Fig. 2 have been replotted here, where the conscious condition (△) is the point of reference. This comparison demonstrates that relationship between ΔCBF/CBF and ΔCMRO2/CMRO2 over a wide range of cerebral activity is linear. The predictions of the model with Ω = 0.81 (−) and 0.81 ± 0.23 (&) are compared with experimental data (○, current study; •, literature data). The basal OEF for the conscious condition was assumed to be 0.3. This comparison shows that prediction with 1 > Ω > 0 for this model is in great agreement with experimental data over a wide range of cerebral activity.
Comparison of measured changes in CMRO2 and CBF with predictions of the model
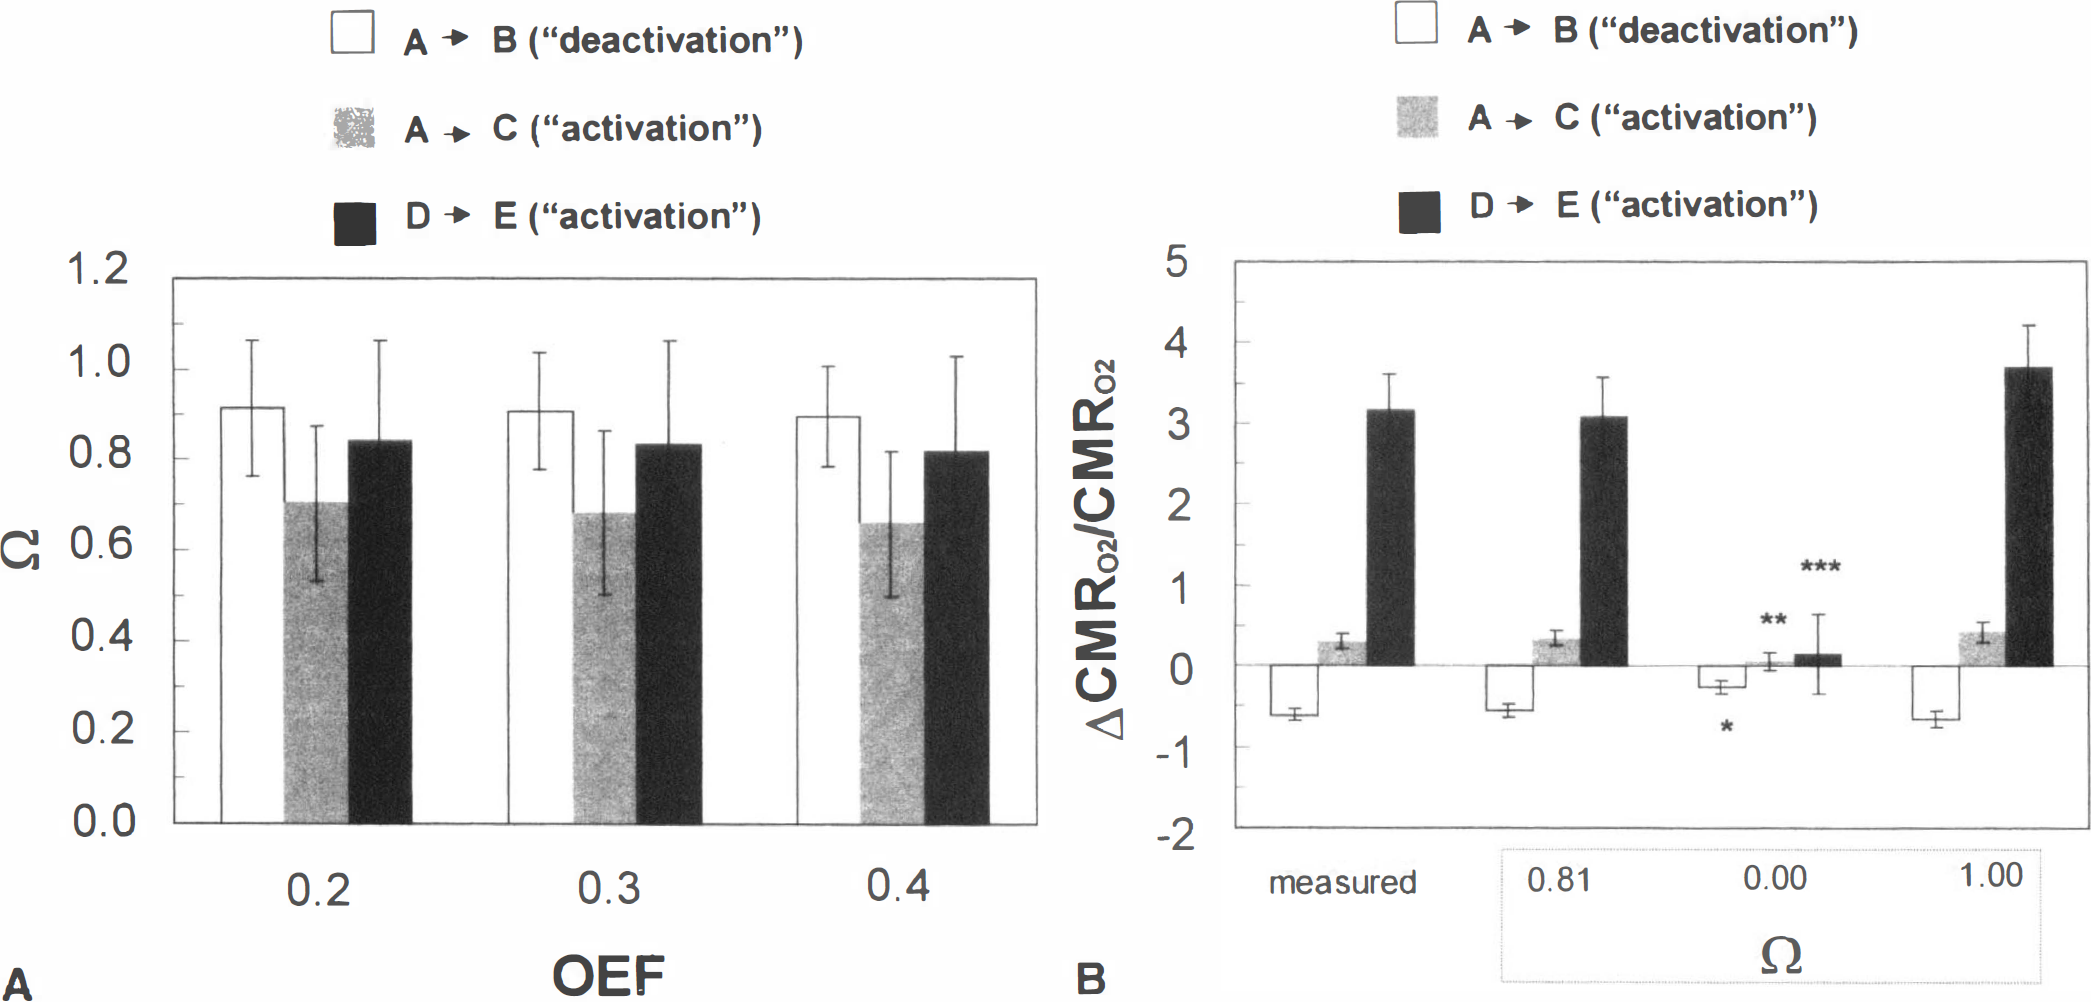
For the case where 1 > Ω > 0, a value of Ω was determined using Eq. 4 for each “deactivation” and “activation” transition, with basal OEF values of 0.2, 0.3, and 0.4. No significant differences were found for Ω between the “deactivation” and “activation” transitions of cerebral function (Fig. 4A). The mean value of Ω over all three transitions examined was 0.81 ± 0.23. The ΔCMRO2/CMRO2 for each transition was predicted using Eq. 2 with Ω values of 0.0, 0.81 ± 0.23, and 1.00 (Fig. 4B), where 0 and 1 represent the limiting and nonlimiting cases of the model, respectively. A significantly better fit is obtained for Ω = 0.81 ± 0.23 than for Ω = 0, which clearly provides a poorer fit to the results. The predictions of ΔCMRO2/CMRO2 with Ω = 1 are not significantly different from the measured values, but in this nonlimiting case of oxygen transport the blood oxygenation level dependent (BOLD) functional MRI (fMRI) signal change (Ogawa et al., 1993) would be null (or even negative) because the predicted ΔCMRO2/CMRO2 would be equal to the measured ΔCBF/CBF (Appendix A; see Discussion).
(
The uncertainty in the calculated value of Ω can be determined with Eq. 5. For similar magnitudes of systematic error in both CBF and CMRO2 measurements, the maximum misestimation in Ω would be less than ± 0.5% of the calculated value. If the CMRO2 measurements were underestimated by 10%, then the respective Ω values also would be underestimated by 9% to 14%. However, a similar magnitude of underestimation in CBF measurements would correspond to an overestimation of Ω values by 13% to 15%. An assumed maximum systematic error of ± 10% in both CBF and CMRO2 measurements would correspond to a maximum of ± 25% misestimation of Ω. Based on this analysis, it is concluded that even with some degree of misestimation of Ω caused by systematic error in measurements, the calculated value of Ω still would be significantly nonzero.
The prediction of ΔCMRO2/CMRO2 with Ω of 0.81 ± 0.23 were compared with the experimental (open circles) and literature (filled symbols) data (Fig. 3). The ΔCBF/CBF and ΔCMRO2/CMRO2 values for the data points in Fig. 3 are plotted with the awake resting condition as the point of reference (Table 1). This comparison demonstrates that relationship between CBF and CMRO2 over a wide range of cerebral activity is linear and shows that prediction with 1 > Ω > 0 for this model is in great agreement with experimental data.
DISCUSSION
In this study, we used MRI and MRS methods to make paired measurements of CBF and CMRO2 in the same rat sensorimotor cortex under conditions in which global cerebral activity was altered pharmacologically and focal activity was altered with sensory stimulation (Fig. 1). The values of CBF and CMRO2 obtained at the different levels of activity agree well with data trends from the literature (Fig. 2). A close to linear relationship was observed between changes in oxidative metabolism and perfusion over a wide range of activity (Fig. 3). The derived values of Ω for “deactivation” and “activation” were found to be approximately equal, and an average value of 0.81 ± 0.23 was determined for Ω covering the entire range of activity (Fig. 4). The results support an important role of modulation of capillary bed diffusivity in regulating oxygen delivery.
Comparison with previous measurements of CBF and CMRO2
In this study, pentobarbital and nicotine were administered to decrease and increase, respectively, global cerebral activity from the control condition of morphine anesthesia. In the sensorimotor cortex, the changes in CBF and CMRO2 with pentobarbital and nicotine were consistent with previous studies (Otsuka et al., 1991a, 1991b; Grunwald et al., 1987, 1991). The CBF value for the control condition achieved with moderate dose morphine anesthesia was approximately 40% lower than the awake state value for the sensorimotor cortex of the rat (Fig. 2). A similar degree of CBF depression was observed in the cat cortex when administered a comparable dose of morphine (Buchweitz et al., 1984). In the rat brain, Nilsson and Siesjo (1975) demonstrated well-correlated decreases of CBF and CMRO2 with increasing doses of phenobarbital, whereas Michenfelder and Theye (1975) showed a similar trend for CMRO2 and EEG activity with increasing doses of halothane. In the human brain, similar dose-dependent results for CBF and CMRO2 have been obtained with thiopental (Pierce et al., 1962; Smith and Wollman, 1972). Likewise, in α-chloralose anesthetized rats, focal activity was altered with forepaw stimulation, which is in good agreement with previous observations (Ueki et al., 1988; Hyder et al., 1996, 1997; Silva et al., 1999). Notice that the absolute values of CBF and CMRO2 on sensory activation with α-chloralose anesthetized rats rise above the resting nonanesthetized value (Figs. 2 and 3), and these types of changes are typical of certain anesthetics used for sensory activation studies (Shulman et al., 1999).
Role of diffusivity in regulating oxygen delivery
The primary goal of this study was to determine whether the theoretically defined terms of oxygen diffusivity in the capillary bed increases with increased cerebral activity. We have previously shown that the change in oxygen diffusivity with a change in perfusion referred to as Ω, as in Eq. 3, may be determined by plotting changes in CMRO2 versus changes in CBF (Appendix A). If D is a constant and Ω = 0, then the efficiency of oxygen delivery decreases as CBF is increased because of the vessel P
The hypothetically defined term of effective diffusivity, D, which relates oxygen delivery to perfusion, is derived under the assumption that in every segment of each capillary oxygen delivery is proportional to local vessel P
The value of D is theoretically defined to be dependent on characteristics of capillaries within the tissue, such as their number, geometry, blood volume, and circulation time distribution. Each of these parameters has been proposed to be of importance in regulating oxygen delivery (Mochizuki, 1966; Lawson and Foster, 1967; Moss et al., 1976; Homer et al., 1981), and maintaining cerebral energy homeostasis (Betz, 1977; Elkof and Siesjo, 1971).
Although the use of the term capillary bed readjustment in the literature generally reflects changes in blood volume (Kuschinsky and Paulson, 1992), there are several mechanisms by which the capillary bed may increase its oxygen diffusivity, thereby increasing the efficiency of oxygen delivery. Among these mechanisms are the dilating of capillaries (Cox et al., 1993; Narayan et al., 1995), decreases in the number of plasmatic capillaries (Francois-Dainville et al., 1986; Tajima et al., 1992), and intracapillary stacking of erythrocytes (Mochizuki, 1966; Lawson and Foster, 1967; Moss et al., 1976). The relative importance of these mechanisms in causing the assumed changes in the capillary bed diffusivity remains to be determined (Niimi and Yamakawa, 1985; Tsai and Intaglietta, 1989; Duling, 1994; Kleinfeld et al., 1998).
In the current modeling scheme, no attempt is made to define which particular physiologic events or episodes regulate CBF. Blood flow in brain circulation serves many functions (e.g., CO2 and heat clearance) in addition to substrate delivery, and several models in the field (Ursino et al., 1989a, 1989b; Ye et al., 1994) deal with some of these other functions of perfusion and the effects of these factors on tissue oxygen levels. However, notice that good fits to the results may be obtained through theoretical consideration of oxygen delivery alone.
Cerebral metabolism and perfusion above the resting awake condition
The discussion has dealt with the regulation of cerebral metabolism and perfusion below the awake condition as observed with graded anesthesia (Figs. 2 and 3). In this range, both the current results and previous published results support a near linear relationship between CBF and CMRO2. Should the regulation of cerebral metabolism and perfusion above the awake condition be the same as observed with graded anesthesia? In the current study, on sensory activation of α-chloralose anesthetized rats (Fig. 1), the absolute values of CBF and CMRO2 rose above the resting nonanesthetized values (Fig. 2), the derived value of Ω for sensory activation was indistinguishable from the other “deactivation” and “activation” paradigms studied (Fig. 4), and a single value of Ω produced excellent predictions of ΔCMRO2/CMRO2 for the entire activity range, which spanned from deeply anesthetized conditions to the functionally activated state (Fig. 3). This suggests that cerebral metabolism and perfusion above and below the awake condition may be regulated in the same manner.
Position emission tomography studies of functional activation in the activated human brain show that in some cases the changes in CMRO2 and CBF are close to proportional (Katayama et al., 1986; Roland et al., 1987; Seitz and Roland, 1992; Blomqvist et al., 1994; Hatazawa et al., 1995; Marrett and Gjedde, 1997; Vafaee et al., 1998), whereas in others, there is a much larger increase in CBF than CMRO2 (Fox and Raichle, 1986; Fox et al., 1988). The studies which have found a relatively greater increase in CBF have been interpreted as being consistent with there being no increase in oxygen diffusivity with increases in perfusion in the activated brain (Buxton and Frank, 1997; Gjedde, 1997).
A possible explanation for the inconsistency in the activation results is that certain stimuli may only activate a fraction of the tissue within an image voxel, and the effect of this partial-volume on CMRO2 and CBF may be considerably different (Lebrun-Grandie et al., 1983). Support of this idea comes from studies of effects of graded anesthesia on human brain (for recent reviews see Hyder et al., 1998, 1999b), where a linear relationship has been observed for changes in CMRO2 and CBF (Pierce et al., 1962; Smith and Wollman, 1972). Under these conditions, heterogeneity in the responses of different regions (similar to effects of partial-volume) are reduced because of the global nature of the perturbation. Alternatively, it has been reported that variations in stimuli frequency and context may affect the magnitude of changes in CBF and CMRO2 differentially (Katayama et al., 1986; Sadato et al., 1997; Vafaee et al., 1998; Zhu et al., 1998). To definitively assess these possibilities, it is necessary to obtain measurements of CBF and CMRO2 at a sufficiently high spatial resolution to encompass uniformly activated regions of the cortex. However, it would be surprising if there is no increase in oxygen diffusivity in the activated state given the considerable evidence, both from the current and previous studies, for its critical role in modulating oxygen delivery at and below the awake condition (Hyder et al., 1998, 1999b).
Implications for BOLD fMRI
The principle of Fick prescribes that the functional increases in CMRO2 and CBF observed during functional activation should reflect a decrease in OEF from its basal value, which is commensurate with an increased venous blood oxygenation in cerebral capillaries, as in the BOLD fMRI method (Ogawa et al., 1993). The BOLD fMRI method allows the detection of changes in cerebral blood oxygenation during functional challenges with gradient-echo MRI. The gradient-echo image contrast relies on physiologically induced changes in the magnetic properties of blood (oxyhemoglobin is diamagnetic and deoxyhemoglobin is paramagnetic), where an increase in the fractional BOLD fMRI signal change (ΔS/S > 0) is consistent with a drop in venous deoxyhemoglobin concentration. Results from near infrared spectrophotometry (Hoshi and Tamura, 1993) and intrinsic optical reflectance studies (Narayan et al., 1995), which have shown that deoxyhemoglobin concentration decreases after stimulation onset in the adult mammalian brain, provide qualitative support for the BOLD fMRI hypothesis. A common expression for BOLD fMRI signal change, ΔS/S, is A (ΔCBF/CBF – ΔCMRO2/CMRO2), where A is a magnetic field-dependent physiologic constant. This expression reveals that the relative difference between ΔCBF/CBF and ΔCMRO2/CMRO2 creates the small positive values of ΔS/S observed in vivo. Therefore, it is not necessary for ΔCMRO2/CMRO2 to be close to zero for the BOLD fMRI image contrast mechanism to be observed (Ogawa et al., 1993; Buxton and Frank, 1997; Gjedde, 1997). Recent BOLD fMRI experiments in the human visual cortex (Sadato et al., 1997; Zhu et al., 1998) and in the rat sensorimotor cortex (Kida et al., 1999a; Silva et al., 1999) show that ΔS/S and ΔCBF/CBF are linearly related. These observations, in conjunction with the equation earlier, indicate that the relationship between ΔCBF/CBF and ΔCMRO2/CMRO2 also would be linear with functional activation. We have shown experimentally (Fig. 3) that this is the case. Proper calibration of the BOLD fMRI signal (Kida et al., 1999a, 1999b), however, requires measurements of changes in CMRO2 and CBF over a wider range of activity and conditions. This relationship is further strengthened by the strong correlation between evoked electrical activity and BOLD response during functional activation (Yang et al., 1997).
CONCLUSIONS
The results of this study indicate that CBF and CMRO2 change near proportionately in the rat somatosensory cortex over a wide range of cortical activity. The results were fit to a model relating the efficiency of oxygen delivery in the capillary bed. It was found that the model, various limits of which have been proposed by several investigators, is best fit to the results when the diffusivity term changes linearly with perfusion. The relationship between CBF and D, expressed as a constant Ω, was determined in vivo to be 0.81 ± 0.23. These results support an important role for the ability of the capillary bed to modulate the efficiency of oxygen transport for the regulation of oxygen delivery in vivo.
APPENDIX A
The models proposed by Buxton and Frank (1997), Gjedde (1997), Hyder et al. (1998), and Hudetz (1999) are based on the premise that for a given microscopic capillary segment, the rate of oxygen delivery is proportional to the vessel-to-tissue P
In the models proposed by Buxton and Frank (1997) and Gjedde (1997), D is constant (i.e., Ω = 0) such that oxygen delivery may increase only through an increase in the arterial P
A qualitative but substantial validation of these models is the ability to predict the BOLD fMRI image contrast, which relies on physiologically induced alterations in the magnetic properties of blood. The fractional changes in CMRO2 and CBF observed during functional activation reflect a decrease in OEF from its basal value (i.e, ΔOEF/OEF < 0), which is equal to an increased venous blood oxygenation. An increase in BOLD fMRI signal change (ΔS/S) is consistent with a decrease in venous deoxyhemoglobin concentration, and ΔS/S > 0 can be predicted only with 1 > Ω > 0.
APPENDIX B
The oxyhemoglobin dissociation curve describes the oxygen carrying propensity of blood,

where Y is the blood oxygenation, and CHb(O2)n and CHb are the contents of oxyhemoglobin and deoxyhemoglobin, respectively. Based on mass transfer relations, the amount of oxyhemoglobin, CHb(O2)n > is equal to the sum of deoxyhemoglobin, CHb, and oxygen, CO2. Extraction of oxygen into the tissue from an infinitesimally thin blood bolus occurs all through transit. The temporal profile of the total oxygen content of blood (CT) can be described in relation to the oxygen content in the plasma (CP) by

where the CT is equivalent to CHb(O2)n > CP is equivalent to CO2, and the constant k is determined by the spatial gradients of oxygen tension radially around the bolus, and is the first-order rate constant of oxygen loss from the capillary. The main assumptions in Eq. B2 have been described (Hyder et al., 1998, 1999b). If it is assumed that through an elapsed time of Δτ the ratio of transient oxygen content values in plasma and blood is constant, i.e., r = CP/CT, then

which is equivalent to

where Δτ is the rath equivalent fraction of the circulation time (Tc) and [kr]net is the net kr product. Since r is determined by the relationship between hemoglobin fractional oxygenation and the average capillary oxygen tension, from Eq. B1 it can be shown that
where r varies with

where CT(0) > CT(TC), and given Eq. B4, OEFc also is equivalent to
The total oxygen extraction per capillary can be depicted by the summation of the effect of an infinitesimally thin blood bolus flowing down a capillary during transit as it deposits oxygen, and as a consequence of which the flowing blood goes through changing spatial gradients of oxygen tension between the traversing volume element and the albuminal side of the capillary endothelium. The changing values of CT and CP in the traversing bolus reflect the cooperative binding of oxygen by hemoglobin in whole blood within the capillary (Eq. B5). Since perfusion is assumed to be constant all through transit, Tc is related to flowing bulk (CBVc) and rate (CBFc) in the circulating blood by stationarity and linearity principles (Stewart, 1894; Meier and Zierler, 1954), then Eq. B7 leads to

where Dc is theoretically defined as the effective diffusivity for oxygen from the capillary to the mitochondria, which is the point of efficient consumption,
The macroscopic picture is derived through averaging across an ensemble of capillaries.
APPENDIX C
Division of both sides of Eq. 2 with ΔCBF/CBF results in

where Ψ = (ΔCMRO2/CMRO2)/(ΔCBF/CBF) and σ = (ΔCBF/CBF)−1. The Ω term can be expressed by rearrangement of Eq. C1 as follows:
where
where δσ and δϑ represent errors associated with each parameter.
Footnotes
Acknowledgments
The authors thank Drs. R.G. Shulman, E.J. Novotny, and N.R. Sibson for helpful discussions. The authors also thank engineers T. Nixon, P. Brown, and S. McIntyre for maintenance of the spectrometer and the RF probe design, and X. Ma, Y. Ping, and B. Wang for technical support.