
Abstract
Intravascular contrast agents are used in functional magnetic resonance imaging to obtain cerebral blood volume (CBV) maps of cortical activity. Cerebral blood volume imaging with MION (monocrystalline-iron-oxide-nanoparticles) increases the sensitivity of functional imaging compared with the blood oxygenation level-dependent (BOLD) signal (Leite et al, 2002; Mandeville et al, 1998; Vanduffel et al, 2001). It therefore represents an attractive method for obtaining detailed maps of cortical organization (Vanduffel et al, 2001; Zhao et al, 2005). However, it remains to be determined how the spatial profile of CBV maps of cortical activity derived with MION compares with the profile of BOLD activation maps under a variety of different stimulation conditions. We used several stimulation paradigms to compare the spatial specificity of CBV versus BOLD activation maps in macaque area V1 at 4.7 T. We observed that: (1) CBV modulation is relatively stronger in deep cortical layers compared with BOLD, in agreement with studies in cats (Harel et al, 2006) and rodents (Lu et al, 2004; Mandeville and Marota, 1999) and (2) surprisingly, under large surround stimulation conditions, CBV maps extend along the cortical surface to cover large (>10 mm) regions of the cortex that are devoid of significant BOLD modulation. We conclude that the spatial profiles of BOLD and CBV activity maps do not coregister across all stimulus conditions, and therefore do not necessarily represent equivalent transforms of the neural response. Cerebral blood volume maps should be interpreted with care, in the context of the particular experimental paradigm applied.
Keywords
Introduction
Functional magnetic resonance imaging (fMRI) with blood oxygen level-dependent (BOLD) signal can be used to generate detailed maps of cortical activity (Engel et al, 1994; Sereno et al, 1995). Intravascular paramagnetic agents, such as MION (monoamine iron oxide nanoparticles), provide a useful complement to BOLD imaging (Weissleder, 1991). Monocrystalline-iron-oxide-nanoparticles is superparamagnetic and is excreted by the kidney with a long half-life (~ 8.4 ± 1.4 h in the macaque) (Leite et al, 2002; Vanduffel et al, 2001) allowing its concentration to remain approximately constant during a typical fMRI experiment. Monocrystalline-iron-oxide-nanoparticles present intravascularly accelerates nearby proton relaxation and shortens T2* decreasing the magnitude of the MRI signal. Visual stimulation results in increased blood flow and consequently blood volume in activated brain areas decreasing the MRI signal below the MION postinjection baseline. The magnitude of this stimulus-dependent signal modulation depends chiefly on the magnitude of the induced cerebral blood volume (CBV) change as long as the MION concentration in the blood remains constant (Mandeville et al, 1998, 2001; Mandeville and Marota, 1999). In comparison with BOLD, CBV imaging with MION results in higher functional contrast-to-noise ratios (fCNR), which improves fMRI sensitivity particularly at low to moderate field strengths (Leite et al, 2002; Mandeville et al, 1998; Vanduffel et al, 2001). Monocrystalline-iron-oxide-nanoparticles therefore is an attractive option for obtaining detailed maps of cortical organization (Vanduffel et al, 2001; Zhao et al, 2005) and for monitoring changes in these maps as a result of learning or plasticity (Dijkhuizen et al, 2001).
BOLD functional activity patterns colocalize with multiunit activity patterns recorded by electrophysiology to within ~ 1 to 2 mm (Kim et al, 2004; Smirnakis et al, 2005), commensurate with estimates of the spatial spread of the BOLD signal derived from gradient echo studies (Engel et al, 1997). These estimates can be improved (Buxton, 2002) by applying alternative imaging sequences (spin echo), higher magnetic fields, or alternative stimulation paradigms (differential imaging). It should be noted, however, that for gradient-echo imaging at low to moderate magnetic fields, BOLD gradient-echo signal may arise from large, spatially nonspecific vessels that run along the cortical surface (Mandeville and Marota, 1999; Vanduffel et al, 2001). Under these conditions, CBV imaging with MION may improve spatial specificity because MION suppresses exponentially the signal arising in draining veins with large fractional blood volume, while preserving the signal arising from smaller, spatially more specific, parenchymal vessels (Mandeville and Marota, 1999; Mandeville et al, 1998).
Although MION may be superior to BOLD with respect to suppressing the signal arising in large draining surface veins, this is a rather special case that does not necessarily reflect what happens in most cortical regions, which are located away from large vessels. Here, we used gradient echo imaging in the anesthetized macaque preparation at 4.7 T (Logothetis et al, 1999) to compare directly the spatial specificity of BOLD imaging versus MION CBV imaging under different visual stimulation paradigms. We found that the visually driven CBV modulation is relatively stronger in deep versus superficial cortical layers compared with the BOLD modulation, in agreement with prior studies (Harel et al, 2006; Lu et al, 2004; Mandeville and Marota, 1999). Surprisingly, when stimulating a large area of V1 cortex surrounding a region deprived of direct visual stimulation (large surround stimulation conditions), the CBV modulation extends along the cortical surface to cover the unstimulated region, even though the latter remains devoid of significant BOLD modulation. We discuss possible mechanisms that could give rise to this disparity, and conclude that it is unlikely to be merely due to the increased sensitivity of CBV imaging for local neural responses. We argue that the main reason for the observed mismatch is hemodynamic in origin and may be mediated by an increase in venous afterload induced during large visual field surround stimulation.
Materials and methods
MRI Data Acquisition Parameters
Measurements were made on a vertical 4.7 T scanner (Biospec 47/40v, Bruker Medical, Ettlingen, Germany). The system was equipped with a 50 mT/m (180 ms rise time) actively shielded gradient coil (Bruker, B-GA 26) of 26 cm inner diameter. A radiofrequency surface coil with an inner diameter of 85 mm was placed over the monkey's occiput to acquire images from early visual areas. Using 8-shot gradient-recalled echoplanar imaging, 17 slices were collected, each with a field of view of 128 × 128 mm2 on a 128 × 128 matrix (voxel resolution: 1 × 1 × 2 mm3). The acquisition parameters were TE (echo time) of 20 ms, TR (repetition time between segments) of 750 or 806 ms, FA (flip angle) of 40°. Within-session anatomical images (0.5 × 0.5 × 2 mm3) were acquired using inversion recovery-rapid acquisition with relaxation enhancement.
High spatial resolution experiments (Figure 2, Supplementary Figure 2, Figure 3 and Figure 4) were conducted using a radiofrequency coil of 35 mm diameter. Five slices perpendicular to the cortex were collected using a 16-shot gradient-recalled echoplanar imaging sequence (FOV: 51.2 × 51.2 mm2, voxel resolution: 0.2 × 0.2 × 1 mm3, TE = 37, TR = 500 ms, FA = 35°). The GEFI (gradient-echo fast imaging) image (Figure 7C) was obtained after MION injection and was oriented approximately perpendicular to the V1 gray matter (FOV: 51.2 × 51.2 mm2, voxel resolution: 0.1 × 0.1 × 1 mm3, TE = 20, TR = 1800 ms, FA = 30°).
Intravascular Agent Monocrystalline-Iron-Oxide-Nanoparticles Administration
Monocrystalline iron oxide nanocolloid was obtained from the Center for Molecular Imaging Research, Massachusetts General Hospital (Boston, USA). We injected intravenously 8 mg/kg (iron dose) of citrate buffered MION, which dropped the MR signal in macaque V1 to ~ 50% of preinjection levels (near optimal; Mandeville et al, 1998). Signal-to-noise ratio reached steady state within 5 mins and remained stable throughout the course of a MION experiment (~ 3 h). We used the same MR parameters for CBV and BOLD imaging in all experiments, to compare MION and BOLD under conditions commonly employed in primate studies (Leite et al, 2002; Vanduffel et al, 2001). BOLD data were acquired before delivering the MION injection that started CBV imaging in each experiment.
Anesthetized Monkey Preparation
Four healthy adult macaca mulatta (E02, A01, E01, L02), older than 4 years, were used for the experiments. Sessions were in full compliance with the guidelines of the European community for the care and use of the laboratory animals (EUVD 86/609/EEC) and were approved by the local authorities (Regierungspräsidium). Experiments were performed under general anesthesia according to previously published protocols (Logothetis et al, 1999). The animal was intubated after induction with fentanyl (31 μg/kg), thiopental (5 mg/kg), and succinylcholine chloride (3 mg/kg), and anesthesia was maintained with remifentanyl (35 μg/kgh). Mivacurium chloride (5 to 7 mg/kg h) was used to assure complete paralysis of the eye muscles. Lactate Ringers with 2.5% glucose was infused at 10 ml/kg h throughout the experiment. The temperature was maintained at 38°C to 39.5°C. After achieving mydriasis with two drops of 1% cyclopentolate hydrochloride, each eye was fitted with hard contact lenses (Harte PMMA-Linsen, Wöhlk, Kiel, Germany) to bring it to focus on the stimulus plane (~ 2 diopters).
Visual Stimulation Paradigms Used
Visual stimuli were presented using an SVGA fiber-optic system (AVOTEC, Silent Vision, 60 Hz, 640 × 480 resolution). The field of view was 18.4° horizontal × 14.1° vertical. The center of the stimulus was aligned to the fovea. Stimulation was presented monocularly except in the experiments studying signal modulation as a function of cortical depth (Figure 2, Supplementary Figures 1, 4). The basic stimulus pattern was a rotating polar checkerboard (~ 3.5 Hz, 100% contrast) that reversed direction of rotation every 1.5 secs to avoid adaptation. Epochs of stimulation (ON) alternated with a background of low, uniform, illumination (OFF/blank).
Depth experiments: For assessing the fMRI signal distribution as a function of depth (Figure 2, Supplementary Figure 1), a ʻfull-field' (18.4 × 14.1°) rotating polar checkerboard pattern was displayed binocularly for 64 secs alternating with 64 secs of low-intensity background, for six cycles.
Direct stimulation experiments: For studying stimuli of limited spatial extent (Figure 3), we displayed the rotating checkerboard through a 3.7° diameter aperture centered on the horizontal meridian 3.7° away from the fovea (Figure 3A). This was displayed for 32 secs alternating with 32 secs of low-intensity background, for 12 cycles.
Large surround stimulation experiments: To examine the spatial spread of activation induced by large surround stimulation, we used a full field rotating polar checkerboard that had overlaid a 3.7° diameter dark occluder centered 3.7° away from the fovea along the horizontal meridian (Figure 4B). We refer to the retinotopic projection of the occluder in macaque area V1 as the occluder projection zone (OPZ); 32 secs of visual stimulation alternated with 32 secs of uniform dark background, 12 cycles per scan.
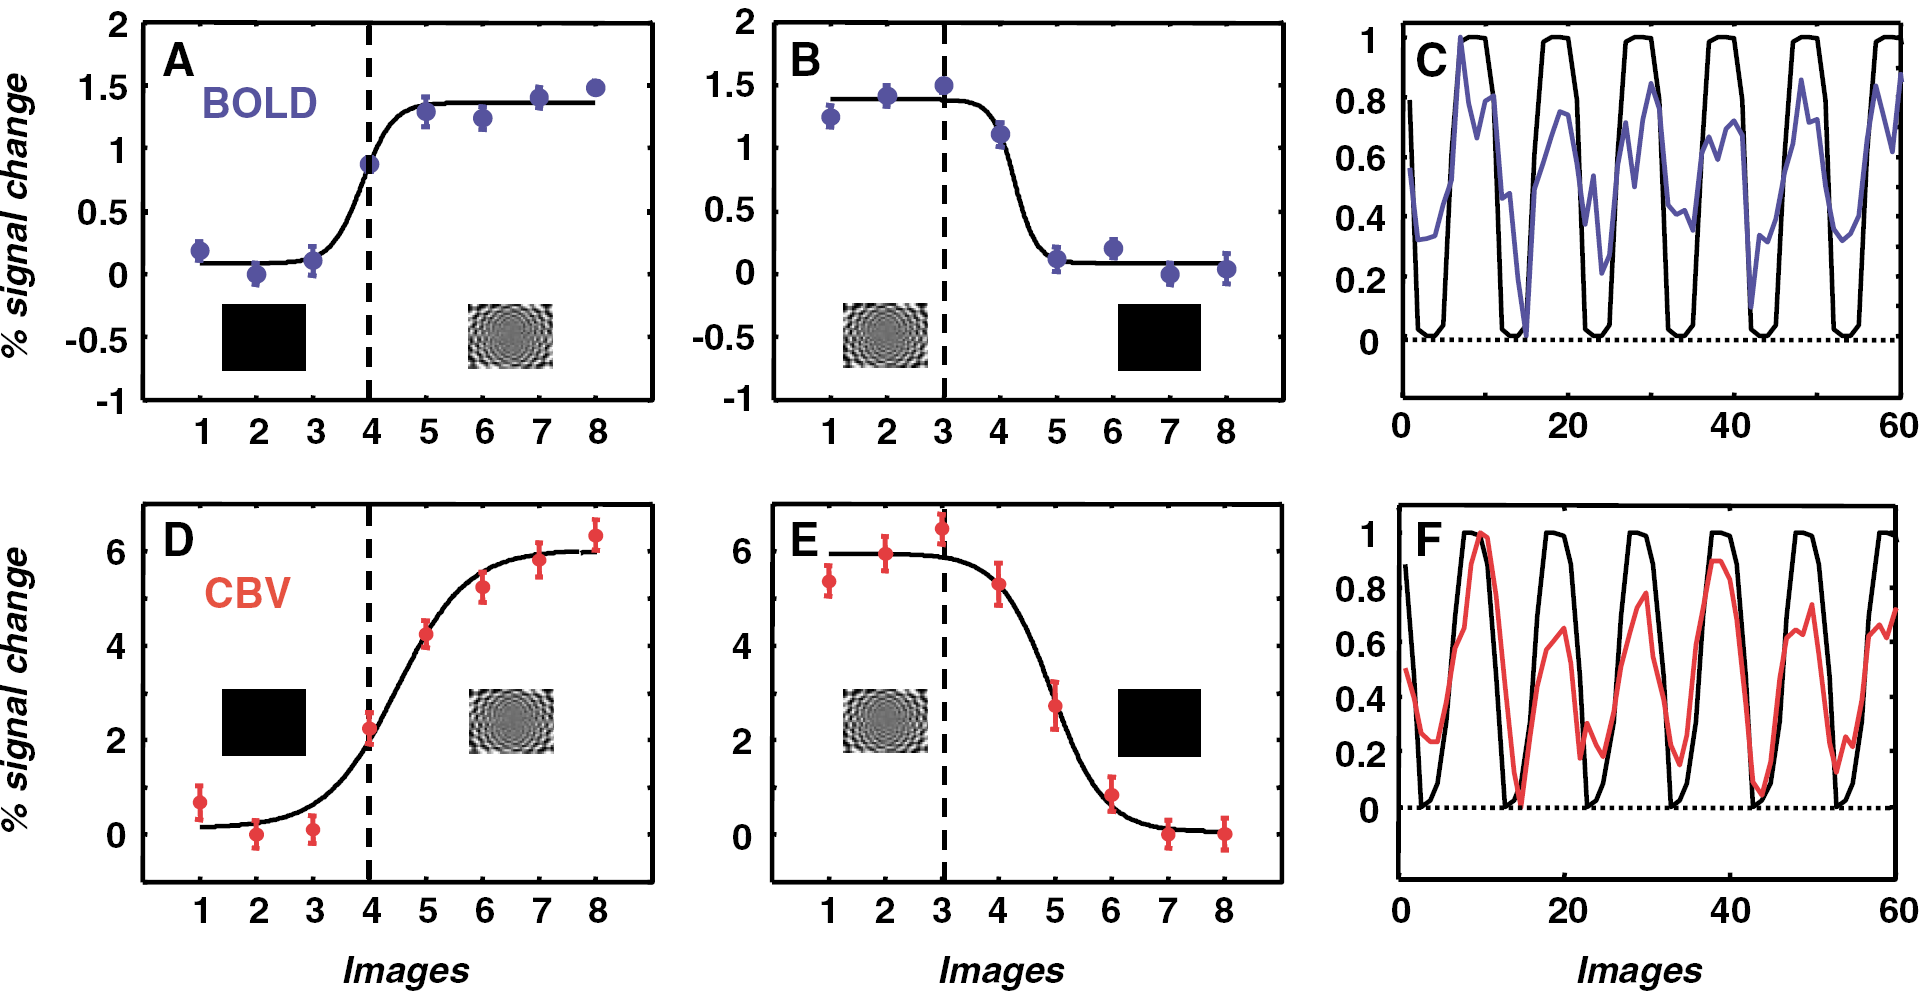
Generation of BOLD and CBV response models. (
Signal modulation as a function of cortical depth. The ʻFull field' stimulation paradigm was used (Figure 1, insets). The stimulus is the rotating polar checkerboard pattern (Materials and methods). For monkey E01, the stimulation paradigm consisted of six stimulus ON (64 secs)/OFF (64 secs) cycles per scan and for monkey L02 of 12 stimulus ON (40 secs)/OFF (40 secs) cycles per scan. (
Signal modulation for spatially restricted stimuli. (
Signal modulation for large surround stimulation. The stimulus is a rotating full-field polar checkerboard pattern that contains a 3.7° diameter occluder, that is, an area devoid of visual stimulation, centered at 3.7° along the horizontal meridian in the right visual field (see stimulus inset, the second panel in the middle line). The stimulation paradigm consisted of 12 stimulus ON (32 secs)/OFF (32 secs) cycles per scan. (
MRI Data Analysis
All data were temporally high-pass filtered (Matlab7, MathWorks, MA, USA) using an 8-order Butterworth-filter with threshold of three cycles per scan. Templates of the expected BOLD or CBV time course were derived using independent sigmoidal fits to the average rise and fall of the signal at stimulus onset and offset (Figure 1). Functional maps were obtained by correlating the signal time course with the derived BOLD or CBV template independently for each voxel. Activated areas were determined by selecting individual voxels whose correlation coefficient with the template rose significantly (P < 0.05) above a correlation coefficient threshold of 0.2 (corresponding to 2 standard deviations above the mean correlation coefficient in unstimulated areas). In the low-resolution experiments, a cluster criterion of having at least six activated voxels within two voxels' distance was also applied in plotting the statistical maps. No cluster criterion was applied in plotting the statistical maps in the high-resolution experiments (Figure 2B, Supplementary Figure 2). Functional contrast-to-noise ratios were obtained for each voxel (r) as independent samples t-tests between stimulus-on and stimulus-OFF conditions:
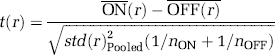
after rejecting the first two time points following each stimulus transition (12 to 16 secs) to allow the signal to approximately reach steady state.
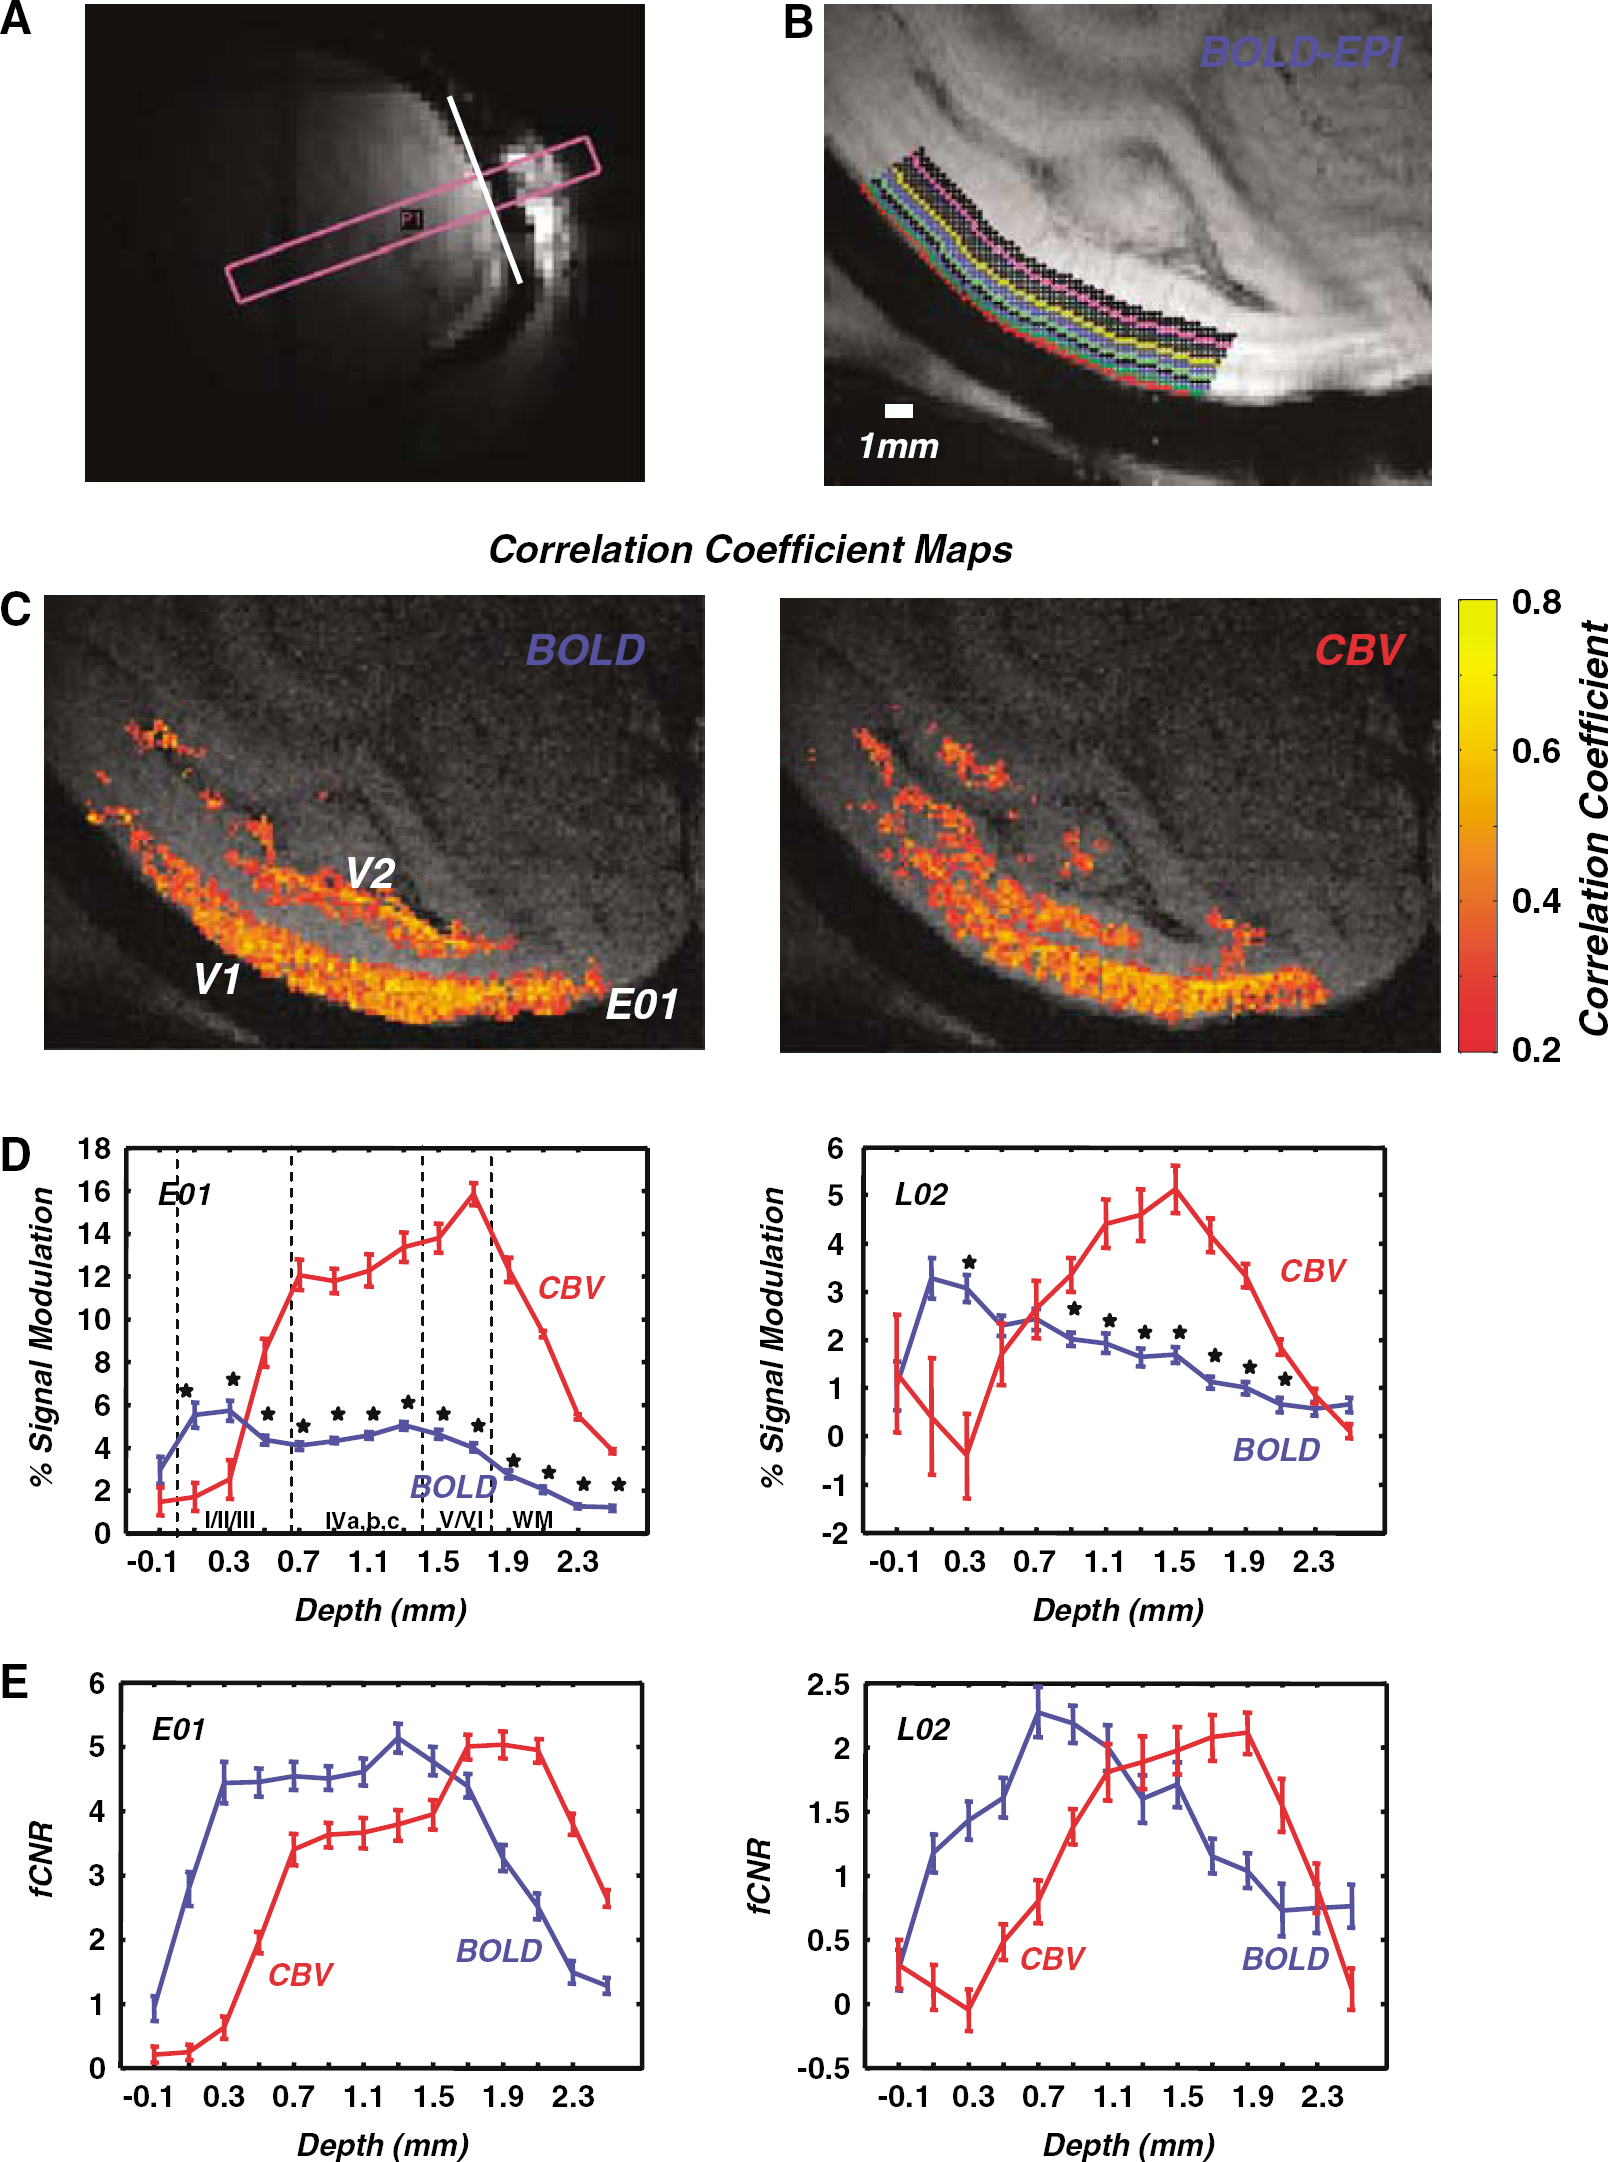
Depth experiments (two monkeys): Functional magnetic resonance imaging slices were acquired perpendicular to the cortex (Figure 2A). To examine the signal distribution as a function of depth, we selected ~200 μm wide regions of interest (ROIs) parallel to the V1 cortical surface (Figure 2B). For monkey E01 (L02) BOLD, CBV fCNRs and per cent signal modulation were calculated voxel by voxel from the average of four (two) BOLD and four (two) CBV scans, respectively. We then plotted the mean fCNR and percent signal modulation for BOLD, CBV averaged over all voxels belonging to each ROI as a function of distance (depth) from the cortical surface (Figures 2E and Figure 2D). To correct for the dependence of BOLD, CBV modulation on resting state blood volume, we divided the respective fCNRs by the corresponding vascular weighting factors (BOLD:
Spread of activity along the cortex: In Figure 3C, the profiles of signal modulation were plotted along the cortex. fCNR maps (1 × 1 mm2 in-plane resolution) were linearly interpolated to the anatomical image resolution (0.5 × 0.5 mm2) and the central slice through the cortical activation zone was selected for further analysis. Within this slice, fCNR was plotted as a function of distance from medial to lateral along the V1 cortex. Error bars represent standard errors of the mean. The size of the V1 region that was significantly modulated by the visual stimulus was plotted as a function of the significance threshold (Figure 3D). We manually selected contiguous voxels with correlation coefficients above statistical threshold and estimated cortical area as the ratio of total voxel volume divided by the cortical thickness of macaque area V1 (~ 1.8 mm).
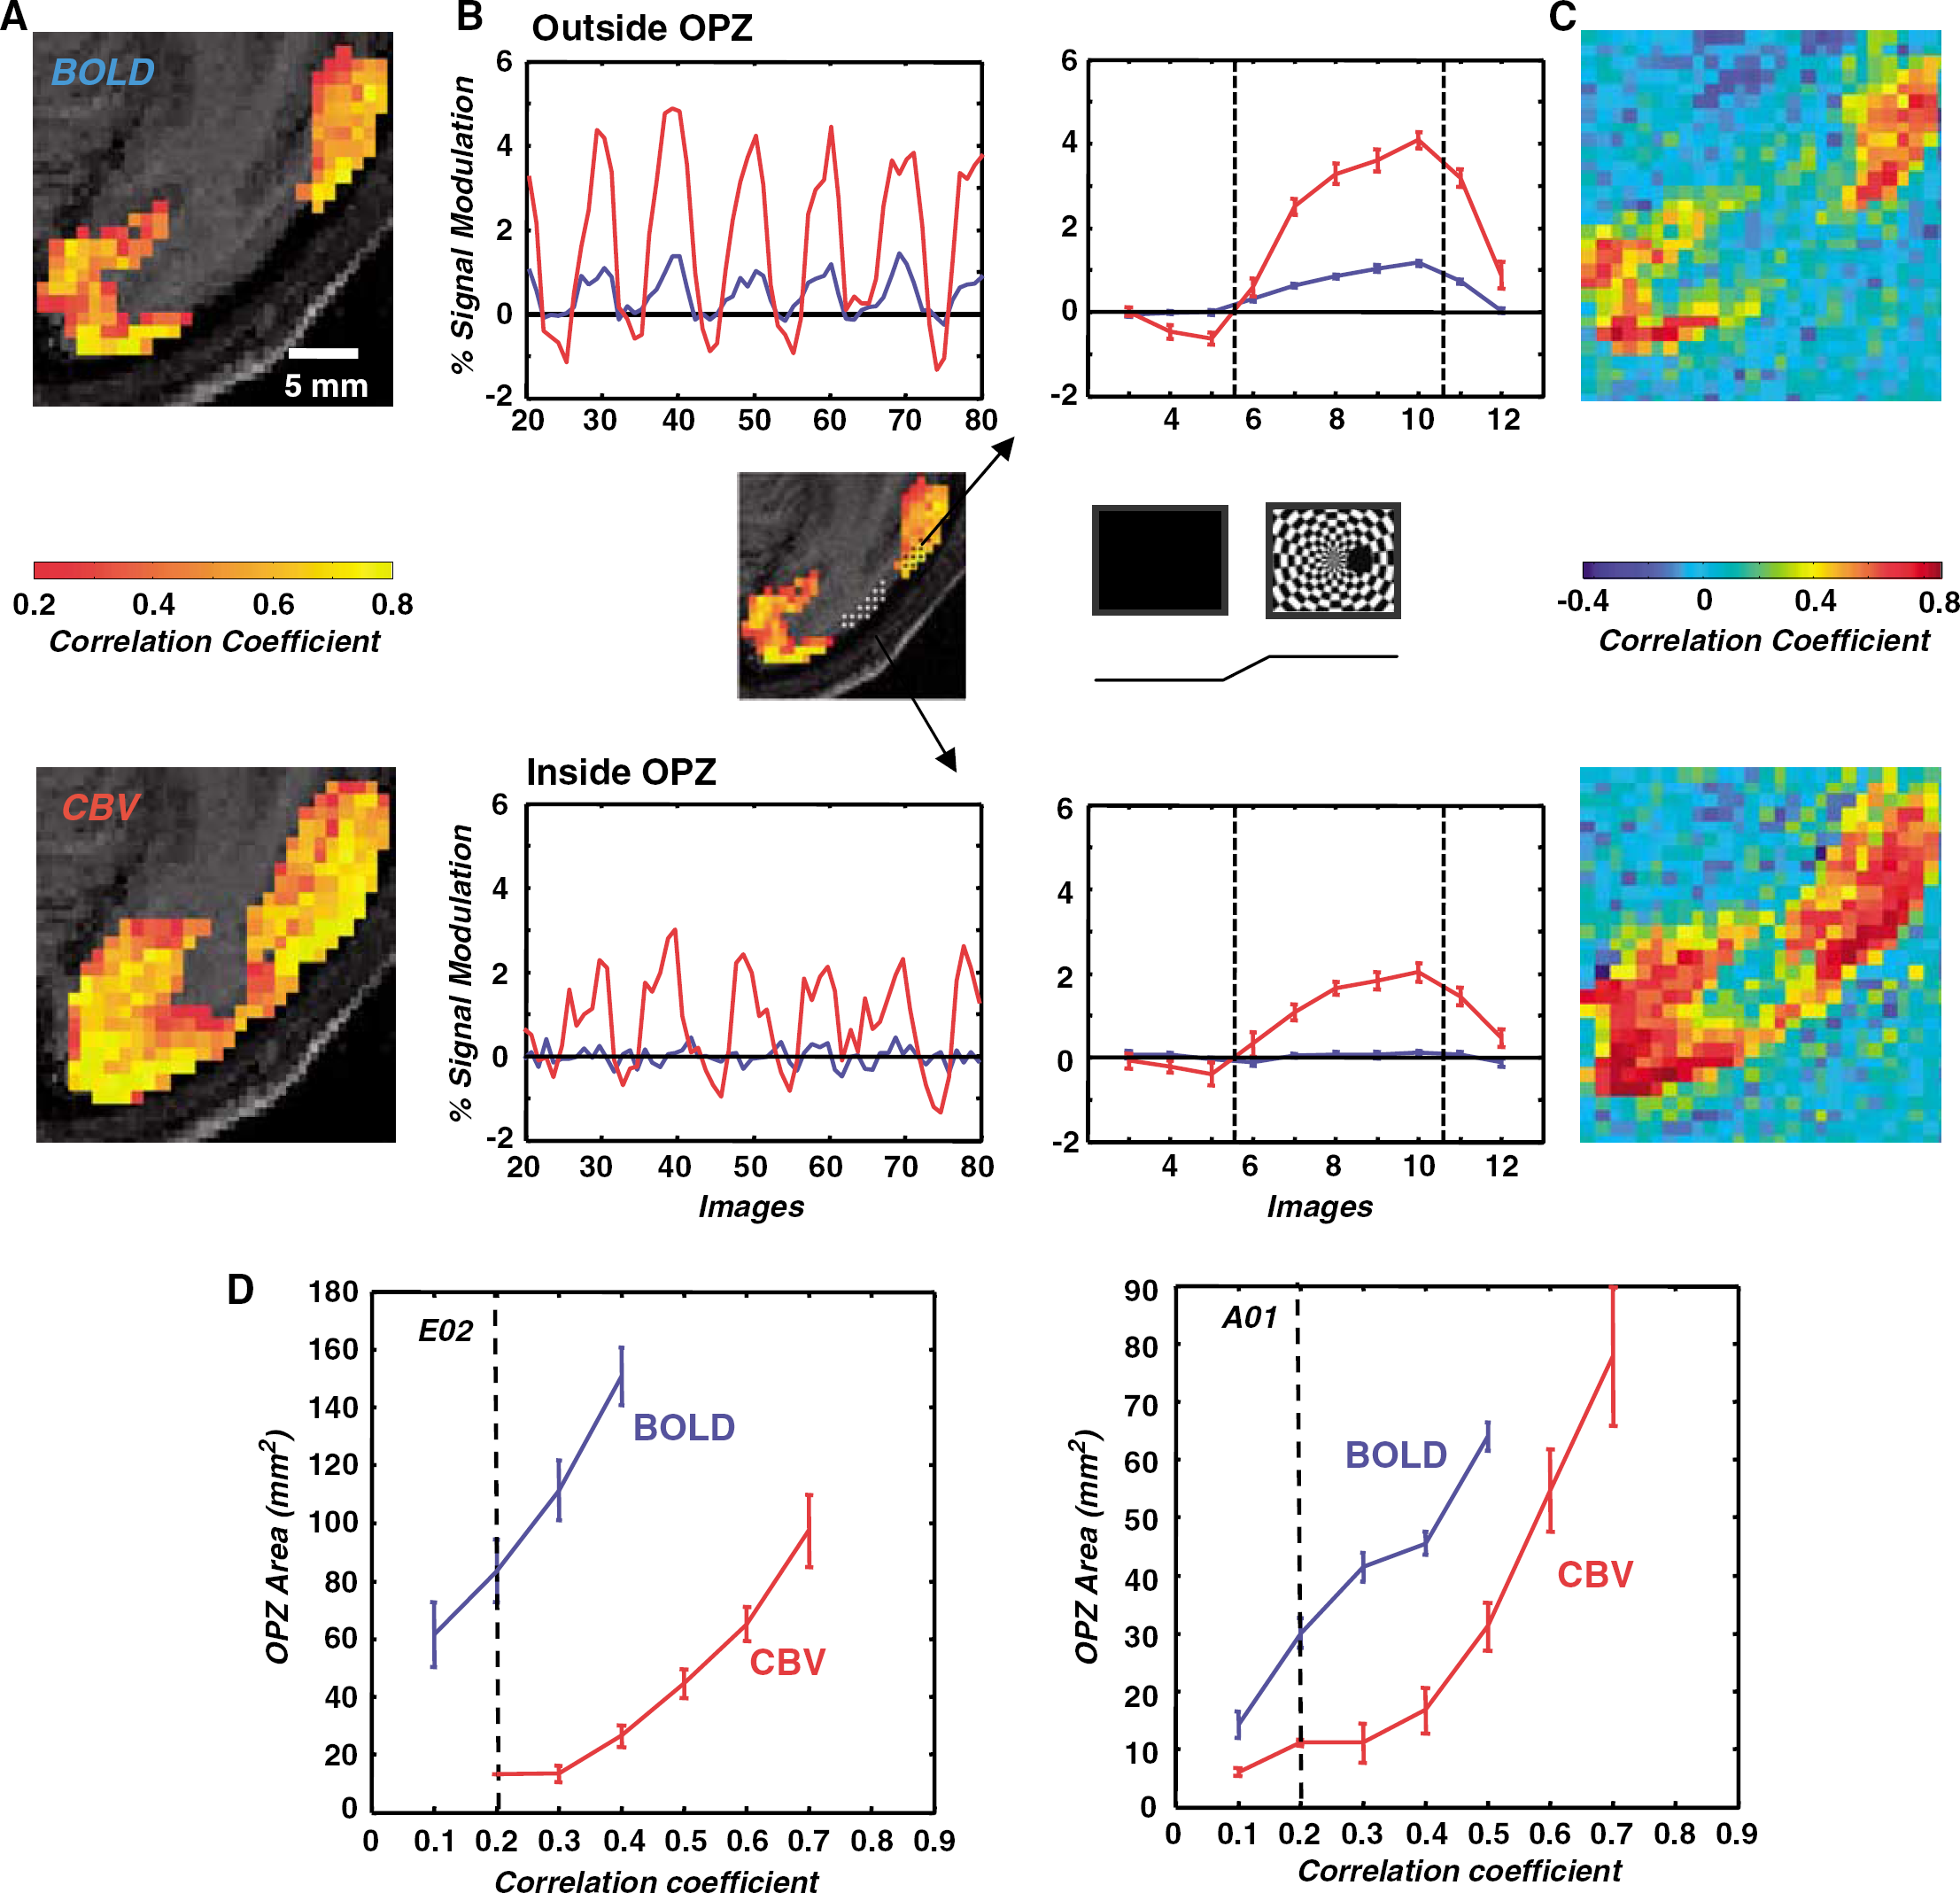
The size of the cortical representation of the OPZ (Figure 4D) was also plotted as a function of the statistical threshold. The area of the OPZ was estimated functionally as the volume of contiguous voxels whose correlation coefficients remained below a chosen threshold while being completely enclosed within the significantly activated surround, divided by the cortical thickness (~ 1.8 mm). This estimate depends on threshold: increasing the threshold increases the functional OPZ size until the OPZ borders lose their definition and the measurement becomes unreliable. Plotted data correspond to mean ± s.e.m. from eight BOLD and 11 MION scans for monkey E02, and from nine BOLD and 10 MION scans for monkey A01. Scans were acquired in two independent experiments per monkey.
For Figure 5, the BOLD, CBV scans obtained in each of four distinct experiments were averaged voxel by voxel, yielding one average BOLD, CBV scan, respectively, per experiment. The OPZ was defined as above from BOLD signal functional maps. The mean OPZ fCNR was calculated in the central slice through the OPZ. With the exception of one case, the same area (BOLD defined OPZ) was selected for calculating BOLD and CBV fCNR. In a single scan (E02-Exp2) owing to an eye drift, the OPZ had shifted medially by ~ 8 mm for CBV compared with BOLD. In this case, the CBV fCNR was calculated over the region where the CBV modulation had reached its minimum plateau (whose voxels were a subset of voxels belonging to the BOLD defined OPZ). Had we not performed this, we would have spuriously elevated the CBV fCNR by including voxels that were no longer in the OPZ because of the eye drift. A similar approach was used to compute percent CBV modulation inside and outside the OPZ (Figure 6). Percent CBV modulation in a given voxel was computed as: ΔV/V = ln(SON/SOFF)/ln(SOFF/SPRE) (Mandeville et al, 1998), where SON, SOFF represent MRI signal with stimulus ON, OFF, respectively, after the MION injection, and SPRE is the baseline signal before the MION injection.
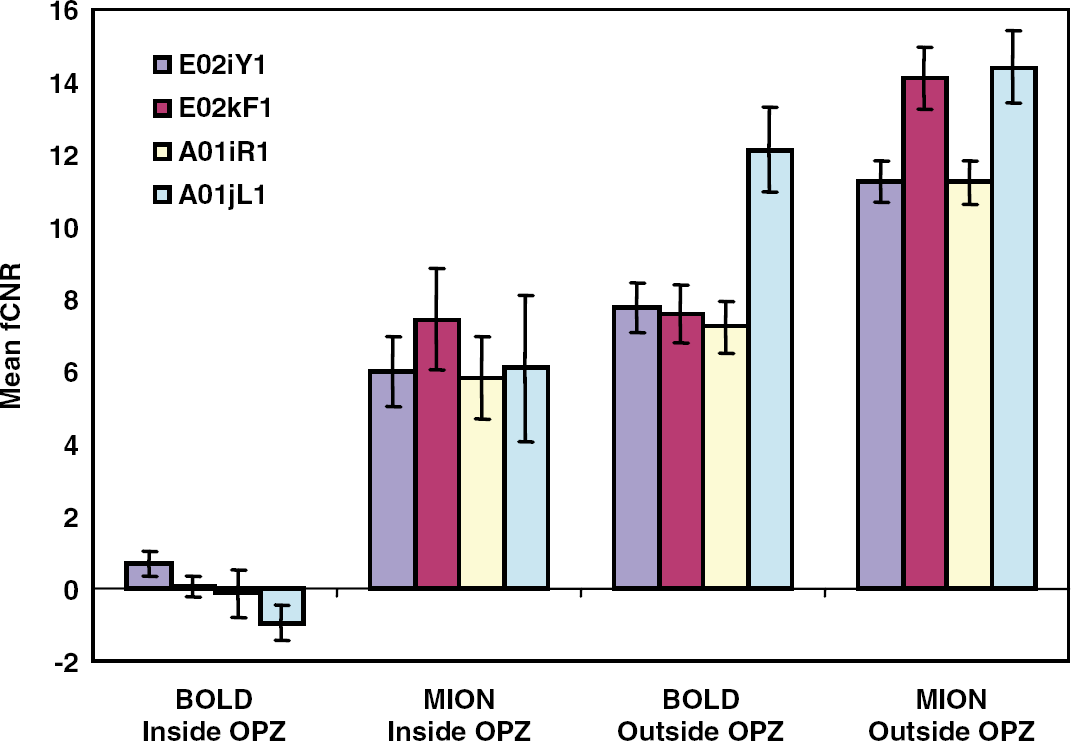
fCNR inside versus outside the OPZ. In four experiments involving two monkeys (E02, A01), the average fCNR was calculated for BOLD and CBV imaging from all voxels inside the OPZ, and in a nearby region of similar size located in normal V1 cortex. The area corresponding to the OPZ was defined as described in the Materials and methods using a BOLD correlation coefficient threshold 2 standard deviations above noise, and without applying a cluster criterion. It represents the area in the very center of the OPZ. Error bars represent s.e.m. BOLD fCNR is not significantly different from zero inside the OPZ in contrast to CBV (MION) fCNR.
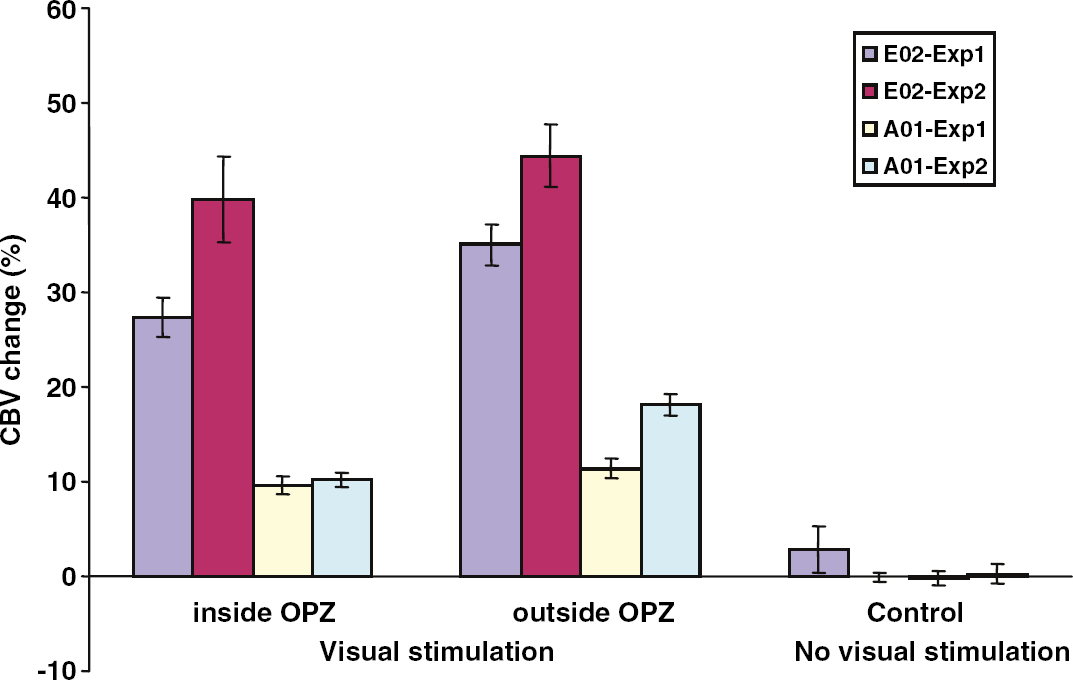
Percent CBV change inside versus outside the OPZ. In four experiments involving two monkeys (E02, A01), the average percent CBV change was calculated inside the OPZ, and in a nearby region of similar size located in directly stimulate V1 cortex (Materials and methods). The area corresponding to the OPZ was defined as described in the Materials and methods (same as in Figure 5). Percent CBV change is also computed for a nearby area of the visual cortex, peripheral to the extent of the visual stimulus (control). Error bars represent s.e.m. Note that percent CBV modulation is highest in areas of V1 that are directly stimulated outside the OPZ and decreases only slightly inside the OPZ where visual stimulation is not direct. In contrast, there is little, if any, CBV modulation in the control area (area V1 located peripherally to the area of visual stimulation).
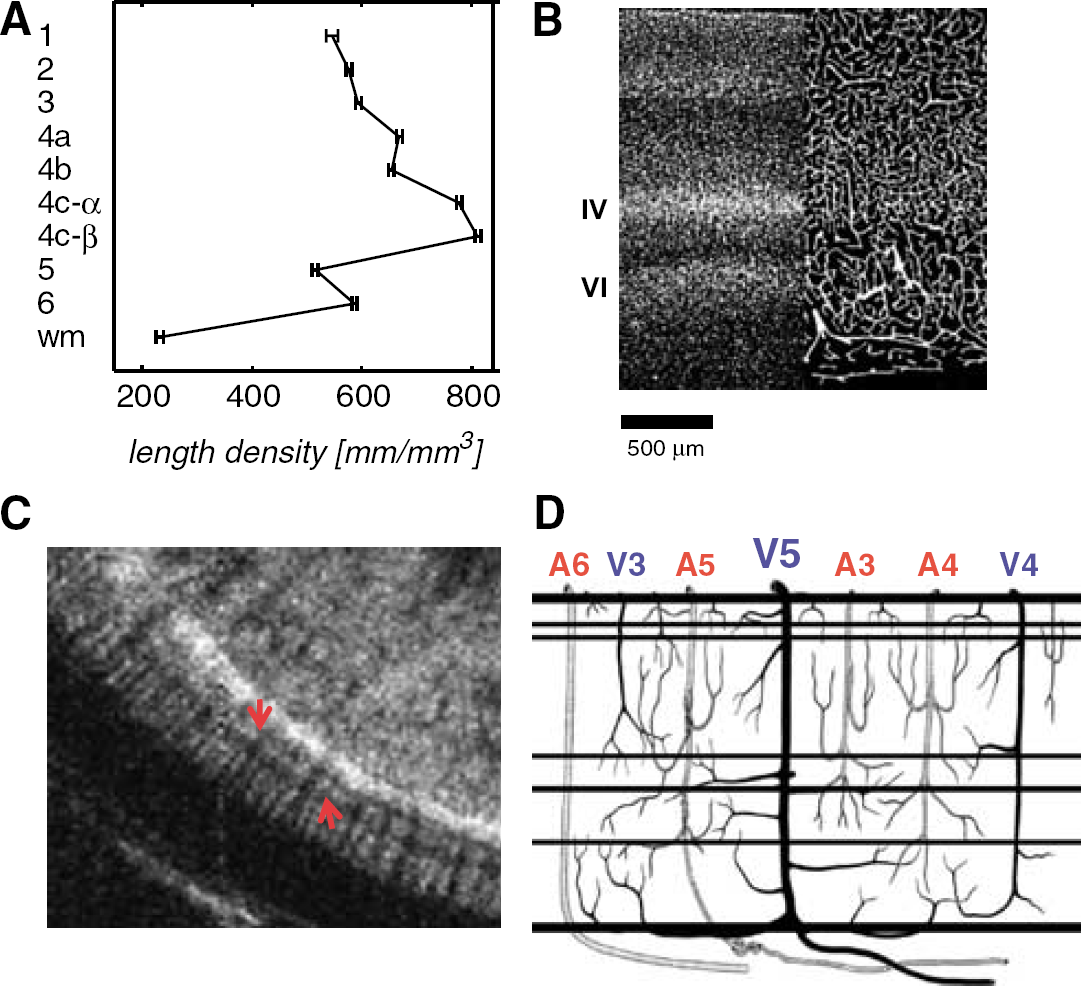
Vascular architecture of macaque V1. (
Vascular Density Analysis
Monkey E01 was euthanized according to standard protocol (Smirnakis et al, 2005) and the brain was extracted and post-fixed in formalin. Frozen sections (60 μm) from the operculum of area V1 were cut and processed. Free floating sections were incubated at 4°C with the primary monoclonal antibody anticollagen type IV (Sigma, St Louis, MO, USA) overnight and with the secondary Cy-3 antibody (Jackson, ImmunoResearch Inc., West Grove, PA, USA) for another 12 h. A 5-min incubation step with 4,6-diamidino-2-phenylindole (Sigma) was included during final washes to stain nuclei. The anticollagen image was median-filtered and thresholded to yield binary vessel projection images. The vessel-positive areas were skeletonized using digital image processing. From these line images, the total vessel length was determined and corrected for the mean projection shortening factor (π/4) assuming isotropic and uniform samples (Russ and Dehoff, 2000). The length density (mm/mm3) was then taken as a measure for the vascular density. The cortical laminae were determined on the basis of the 4,6-diamidino-2-phenylindole stain. A total of 74 locations in V1 were analyzed.
Results
Cerebral Blood Volume Versus Blood Oxygen Level-Dependent Signal as a Function of Cortical Depth
We measured the strength of the stimulus-dependent functional signal modulation as a function of cortical depth in macaque primary visual cortex (V1). We used the rotating polar checkerboard stimulus alternating with a field of uniform illumination (methods), a paradigm known to activate well early visual areas (Smirnakis et al, 2005). Correlation coefficients between the hemodynamically corrected stimulus template (Figure 1) and the signal time course were calculated independently for each voxel. Scans were obtained at 200 × 200 μm2 in-plane resolution, 1 mm slice thickness. Slices were oriented perpendicular to the cortex to accurately estimate depth (Figure 2A). Correlation coefficient maps for BOLD, CBV are displayed in Figure 2C for monkey E01. Voxels belonging to areas V1, V2 are seen to be strongly modulated by the stimulus, exhibiting high correlation coefficients. For CBV imaging, activated voxels lie deeper inside the cortical ribbon nearly bridging the white matter gap between areas V1 and V2. By selecting ~ 200 μm thick ROIs parallel to the cortical surface (Figure 2B), we plotted mean percent signal modulation (Figure 2D) and mean fCNR (Figure 2E) as a function of cortical depth. In superficial cortical layers, BOLD percent modulation is larger than CBV, whereas in deep cortical layers the reverse is true (Figure 2D). fCNRM (CBV, red curve) values start low close to the cortical surface, increase gradually to plateau at a depth of ~ 0.7 to 1 mm, and then decrease gradually starting at approximately 1.5 mm, near the transition to white matter (~ 1.8 mm). Interestingly, significant stimulus-driven CBV modulation persists deeper than 1.8 mm from the cortical surface, in regions dominated by white matter (Figures 2D and Figure 2E). In contrast, fCNRB (BOLD, blue) values reflecting the strength of the BOLD signal modulation increase fast to a plateau located closer to the cortical surface (~ 0.3 mm) and then decrease gradually starting at 1.1 to 1.5 mm, to reach a lower plateau inside the white matter. To examine whether changes in fractional blood volume as a function of depth explain the BOLD, CBV profiles, we normalized (divided) the fCNR by the corresponding vascular weighting factors (Mandeville and Marota, 1999) (Materials and methods). Both CBV and BOLD fCNR/W depth profiles start low close to the cortical surface and then rise with depth up to the gray—white matter junction (Supplementary Figure 1), with the CBV profile having a higher slope.
In summary, the CBV signal modulation is relatively stronger in deep versus superficial cortical layers compared with BOLD, in general agreement with prior studies in rodents (Lu et al, 2004; Mandeville and Marota, 1999; Silva and Koretsky, 2002) and cats (Harel et al, 2006). Normalizing fCNR by the vascular weighting factor (Supplementary Figure 1) did not correct this difference. This may reflect differences in underlying physiology or, alternatively, differences between the actual versus the theoretical vascular weighting factors used for implementing the vascular correction (Mandeville and Marota, 1999).
Spatial Specificity of Cerebral Blood Volume Versus Blood Oxygen Level-Dependent Imaging Along the Cortical Sheet
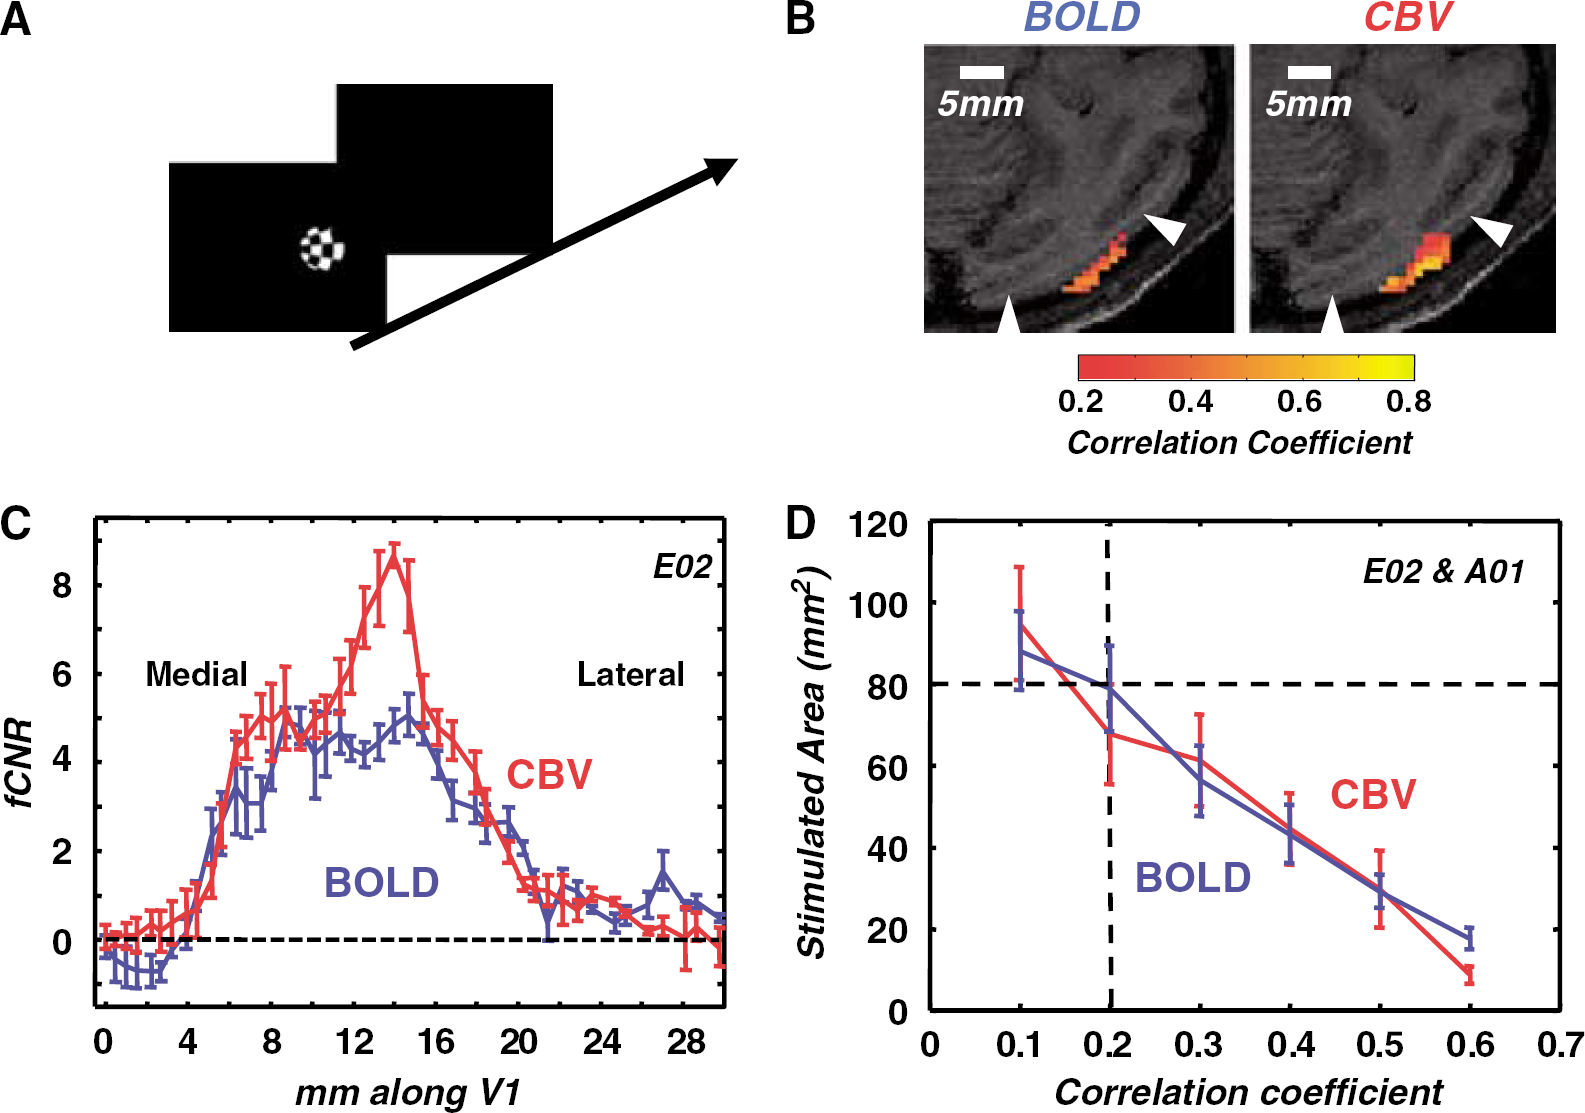
Spatially restricted stimulation: We measured the spatial extent of cortical activation elicited by a disk-shaped stimulus using BOLD versus CBV imaging. A rotating polar checkerboard pattern was displayed on dark background in the right visual field through an aperture of diameter 3.7° centered on the horizontal meridian at 3.7° eccentricity (Figure 3A). Stimulus epochs of 32 secs alternated with 32 secs of uniform background illumination (Materials and methods). Panel 3B shows a slice through the center of the resulting BOLD and CBV activation maps for monkey E02. Voxels with correlation coefficients greater than 0.2 (P < 0.05 uncorrected, cluster criterion 6) are superimposed on the anatomy. The area activated with BOLD has similar size to the area activated with CBV imaging. Panel 3C shows the profile of the contrast-to-noise ratios for BOLD and for CBV as a function of distance from medial to lateral along the cortical surface. The falling edges of the BOLD (blue) and the CBV (red) fCNR profiles overlap extensively confirming that, under these stimulus conditions, the spatial spread of CBV imaging with MION is commensurate to the spatial spread of BOLD imaging. The area of the cortex that was significantly activated as a function of the selected correlation coefficient threshold is illustrated in Figure 3D for both BOLD and CBV imaging. This is a cumulative plot pooling all data collected from two monkeys (Materials and methods). Note that the curves do not deviate significantly from each other. The cortical area expected to be activated by our stimulus is ~ 80 mm2 by retinotopic projection, and corresponds well (Figure 3D) to the activated area measured using a correlation coefficient threshold of 0.2 (2 standard deviations above noise). These data are in agreement with prior observations made in the rat cortex (Mandeville and Marota, 1999), suggesting that BOLD and CBV maps have comparable spatial specificity. Differential mapping experiments (Supplementary Figure 2) further confirmed that CBV maps can resolve cortical activity patterns separated by a distance ≤ 1.4 mm, in agreement with Zhao et al (2005).
In summary, in the paradigms investigated so far, the spatial specificity of CBV and BOLD maps along the cortical surface remain similar, neither having significantly better spatial resolution. However, this does not hold true under all stimulation conditions. In what follows, we compare the spatial specificity of BOLD versus CBV imaging using large visual field surround stimulation. We show that under large-surround stimulation conditions, CBV maps spread along the cortical surface to cover surprisingly large regions of cortex that are devoid of significant BOLD modulation.
Large surround stimulation: To examine the effect of surround stimulation on the spatial spread of BOLD versus CBV imaging, we used a 18.4° × 14.1° rotating polar checkerboard stimulus with a 3.7° diameter dark occluder centered on the horizontal meridian at 3.7° eccentricity (Figure 4B, middle line inset). This stimulus alternated with a condition of uniform illumination (dark) in a standard block design paradigm (Materials and methods). The region of V1 corresponding to the occluder (occluder projection zone, or OPZ) received no direct visual stimulation, whereas a large area of surrounding V1 was modulated strongly. By gauging the degree to which activity from the surrounding cortex spread inside the OPZ, we could assess the spatial specificity of BOLD versus CBV imaging.
Figure 4 illustrates the correlation coefficient maps (Materials and methods) obtained with BOLD and CBV imaging under large surround stimulation conditions. Voxels of 1 × 1 mm2 in-plane functional resolution were interpolated to the resolution of the anatomical scan (0.5 × 0.5 mm2). Note the large (10–13 mm) gap devoid of significant functional activation that is present along V1 in the case of BOLD imaging (Figure 4A, top). The gap is easy to appreciate in Figure 4A (top) where only correlation coefficients larger than 0.2 (P < 0.05, cluster criterion 6) are superimposed on the anatomical scan, but is also clearly evident in Figure 4C (top), which illustrates the full, unthresholded, BOLD correlation coefficient map. This gap in BOLD signal modulation corresponds to the area of V1 that is not directly stimulated because of the presence of the occluder (OPZ). This contrasts with panels 4A, C (bottom), which show that significant stimulus-induced CBV modulation persists throughout the same cortical region (OPZ). The spread of functional activity inside the OPZ, which receives no direct visual stimulation, is therefore markedly greater for CBV than for BOLD imaging. Figure 4B (bottom) plots percent signal modulation as a function of time for the average BOLD (blue) and CBV (red) signal in an ROI selected inside the OPZ (Figure 4B, middle row). No significant modulation is evident in the BOLD signal, whereas CBV is strongly modulated with amplitude measuring ~ 2% per stimulus cycle. Figure 4B (top) plots percent signal modulation from a nearby V1 region receiving direct visual stimulation, and shows, as expected, good visual modulation for both CBV and BOLD. Figure 4D plots the functional estimate of the OPZ area versus the threshold for both BOLD (blue) and CBV (red) imaging (Materials and methods). The CBV curves (red) are shifted to the right and lie well below the corresponding BOLD curves (blue) confirming that the extent of functional activity inside the OPZ is larger with CBV imaging at all thresholds tested.
Figure 5 plots the average BOLD (fCNRB) and CBV (fCNRM) functional contrast to noise ratio values observed inside the OPZ (Materials and methods) and contrasts them with values obtained from nearby, directly stimulated, cortical regions of comparable size. The bar plots illustrate four experiments (two animals). The mean fCNRB (BOLD) obtained inside the OPZ is not significantly different from zero for any experiment, whereas the mean fCNRM (CBV) remains high inside the OPZ for all experiments. The ratio of | fCNRM | to | fCNRB | outside the OPZ agrees well with expectations at 4.7 T (Mandeville et al, 1998) (i.e., | fCNRM | / | fCNRB | ≈ 1.5).
In summary, when using large surround stimuli encircling a region devoid of direct visual stimulation, we observed substantial differences in the spatial profiles of BOLD versus CBV functional activity maps. BOLD activity gaps that extend for more than 10 mm along the cortex were completely bridged across in CBV maps (Figure 4). This contrasts with the results obtained using spatially restricted stimuli. In the section that follows, we discuss potential reasons for this disparity and formulate a simple qualitative hypothesis that may explain our findings.
Discussion
The spatial pattern of BOLD functional activation is thought to faithfully reflect underlying synaptic activity and, under ordinary circumstances, multiunit firing (Logothetis et al, 2001; Mathiesen et al, 1998; Smirnakis et al, 2005). BOLD imaging can resolve human ocular dominance columns (~ 1 mm) (Cheng et al, 2001) and can be used to obtain high spatial resolution (~ 1 mm) cortical maps (Engel et al, 1997). Zhao et al (2005) have recently used CBV imaging to reliably image iso-orientation columns in cat visual cortex at 9.4 T, confirming that high spatial specificity is possible with CBV imaging. Functional magnetic resonance imaging studies in rat and monkey (Leite et al, 2002; Mandeville and Marota, 1999; Mandeville et al, 1998; Vanduffel et al, 2001) suggest that, under certain conditions, CBV imaging may improve spatial specificity as it suppresses signal from large draining veins at the cortical surface and increases contrast to noise ratio compared with BOLD gradient-echo imaging. We note that the choice of experimental parameters, including stimulation paradigm used (differential versus single-condition imaging), MRI sequence used (gradient versus spin-echo), part of the vascular response analyzed (early versus late responses), can play an integral role in determining spatial specificity (Buxton, 2002). Here, following recent studies (Leite et al, 2002; Mandeville and Marota, 1999; Vanduffel et al, 2001), we focused on comparing the spatial patterns of activity elicited by the late component of the BOLD and the CBV response to visual stimulation using gradient recalled echo imaging (Materials and methods). By analyzing primary visual cortical regions away from large draining surface veins, we avoided large-vessel-related imaging artefacts. We measured BOLD, CBV modulation profiles as a function of cortical depth in macaque V1, and found them to be in general agreement with prior studies from rats (Lu et al, 2004; Mandeville and Marota, 1999) and cats (Harel et al, 2006; Zhao et al, 2004). Surprisingly, although the spatial specificities of gradient-echo BOLD and CBV imaging are generally thought to be comparable along the cortical sheet, our results show that there can be large differences between the two that depend strongly on the characteristics of the stimulus.
Spatial Specificity in Depth
BOLD versus CBV contrast to noise ratio profiles were computed as a function of cortical depth, for the first time in the rhesus macaque. CBV fCNR signal modulation was relatively stronger in deep versus superficial cortical layers compared with the BOLD fCNR. This agrees with studies in rat (Lu et al, 2004; Mandeville and Marota, 1999; Silva and Koretsky, 2002) and cat (Harel et al, 2006; Zhao et al, 2004) neocortex that report a shift of BOLD fCNR to superficial cortical layers compared with CBV fCNR (Lu et al, 2004; Mandeville and Marota, 1999). Lu et al (2004) argued that CBV modulation reflects more accurately than BOLD the location of neural activity because the laminar distribution of CBV responses in rat whisker barrel cortex correlated well with neuronal activity localized by Fos expression. 14C-2-deoxy-d-glucose studies in rhesus macaques (Tootell et al, 1988) suggest that sustained neuronal activation is highest in deeper cortical layers (IVc and VI), roughly corresponding to the location of strongest CBV modulation (Figure 2D, Supplementary Figure 4). However, significant CBV modulation is also seen to spread into the white matter where metabolic activity is significantly lower. Therefore, it is not likely that the laminar modulation of the CBV or the BOLD response reflects exclusively local neuronal activity arising from the same lamina, under the conditions of our experiment. More likely it represents a weighted average of neuronal activity along an approximately vertical strip of cortex supplied by perpendicularly penetrating vascular units. Imaging paradigms with higher spatiotemporal resolution designed to be selective for parenchymal capillary vessels as well as for the earliest part of the hemodynamic response will be required to image neural activity specific to individual cortical laminae.
Spatial Specificity Along the Cortical Sheet
We found that that the degree of concordance between visually driven BOLD and CBV activity maps obtained along the cortical surface depends strongly on the visual stimulation paradigm used. For spatially restricted (focal) stimuli, BOLD and CBV imaging have comparable spatial specificity (in areas devoid of large pial vessels) in agreement with prior results from rat and monkey (Leite et al, 2002; Mandeville and Marota, 1999; Mandeville et al, 1998; Vanduffel et al, 2001) (Figure 3). However, under large-surround stimulation conditions, fMRI CBV maps extend along the cortical surface to cover surprisingly large (> 10 mm) regions of cortex devoid of significant BOLD modulation (Figure 4 and Figure 5). Two main hypotheses may potentially explain this disparity: (1) the CBV modulation inside the OPZ reflects neural activity to which BOLD is not sensitive or (2) the CBV modulation inside the OPZ reflects a long-range nonlocal component of the hemodynamic response which is present only with large surround stimulation and which does not induce BOLD signal. We discuss these possibilities below.
Is Neural Activity the Source of the Disparity between Blood Oxygen Level-Dependent and Cerebral Blood Volume Maps?
The balance between excitatory and inhibitory extraclassical receptive field effects may result in increased neural activity inside the OPZ in the absence of direct visual stimulation (Knierim and van Essen, 1992). Such extraclassical synaptic activity could, in principle, be the origin of the CBV modulation we observed inside the OPZ. The puzzle remains, however, why this activity is apparently not reflected in the BOLD fCNR, which remains not significantly different from zero inside the OPZ (Figure 5). A comparison between studies of contrast sensitivity that use the BOLD signal (Boynton et al, 1996; Logothetis et al, 2001) and electrophysiological recordings (Sclar et al, 1990) indicates that under stimulation conditions similar to ours, the BOLD signal is sensitive to small increases in multiunit activity (~ 5% of the response elicited by the high contrast checkerboard stimulus we use here). Moreover, BOLD colocalizes with neuronal activity to an accuracy on the order of ~ 1 to 2 mm (Kim et al, 2004; Logothetis et al, 2001; Mathiesen et al, 1998; Smirnakis et al, 2005). Therefore, the absence of significant BOLD activity in the center of OPZ (Figure 4 and Figure 5) suggests that neural activity there, if present, would be relatively weak (<5% of the firing rate elicited by the checkerboard stimulus). This is supported by prior experiments (Smirnakis et al, 2005), where we found that the multiunit firing rate modulation induced inside a retinal lesion projection zone by stimulating the surrounding V1 was weak (1.3% ± 4%), if present. These observations suggest that the strong CBV modulation seen inside the OPZ (Figure 4 and Figure 5) is not likely to result from the metabolic demands of a local increase in neuronal firing, but may, in part, represent a vascular response propagated to the interior of the OPZ from the stimulated surround.
The above argument is suggestive but not conclusive. A significant portion of the neural activity inside the OPZ may represent synaptic events (Lauritzen, 2005), which can be modulated at a subthreshold level without producing significant multiunit activity thereby avoiding a direct conflict with the multiunit activity observations quoted in the previous paragraph. However, the puzzle remains why there is no significant BOLD modulation inside the OPZ. At 4.7 T, the BOLD percent modulation is approximately proportional to (1–vm/f), where v is the relative CBV change (CBVON/CBVOFF), f is the relative cerebral blood flow (CBF) change (CBFON/CBFOFF), and m is the relative change in the cerebral metabolic rate of oxygen utilization during activation (CMRO2ON/CMRO2OFF). The fact that BOLD modulation remains approximately zero inside the OPZ implies that the relative CBF change during activation (f) satisfies f ≈ mv there. Using the approach taken by Mandeville et al (1998) (Materials and methods), we compared mean percent CBV modulation inside and outside the OPZ (Figure 6). Figure 6 shows that during surround stimulation, the CBV change inside the OPZ ranged from ~ 10% to ~ 40% (v ≈ 1.10 to 1.40) depending on animal and experiment. This amount of CBV increase is commensurate with CBV changes reported in human (Ito et al, 2001) and rat (Mandeville et al, 1999, 1998; van Bruggen et al, 1998) cortex during direct visual or somatosensory stimulation, both of which elicited a strong BOLD response. Remarkably, in directly stimulated cortex outside the OPZ that shows a strong BOLD response, the CBV increase was only slightly higher ranging from ~ 11% to 44% (v ≈ 1.11 to 1.44), respectively (Figure 6). Using the commonly assumed relationship (Grubb et al, 1974) between CBV and CBF (v = f0.4), we estimate that, for BOLD to be approximately zero (f ≈ mv) inside the OPZ, ΔCMRO2 there should be increased by ≈ 15% to ≈ 65%, respectively, during surround stimulation. Although this is in principle possible, it is hard to imagine a metabolic demand of this magnitude inside the OPZ, particularly when a similar calculation in directly stimulated cortex limits the ΔCMRO2 increase there from ≤18% to ≤74%, respectively. Because ΔCMRO2 is roughly proportional to the increase in neuronal firing during stimulation of the neocortex (Shulman et al, 2002), the above measurements imply that neuronal activity should be very similar inside and outside the OPZ. This is implausible because it contradicts evidence from electrophysiology, which suggests that neuronal activity inside the OPZ is considerably weaker than neuronal activity in directly stimulated cortex outside the OPZ (De Weerd et al, 1995; Smirnakis et al, 2005).
In addition, the | fCNRM/fCNRB | ratio is very high inside the OPZ, defying the prediction that | fCNRM/fCNRB | ~ 1.5 for directly activated cortex at 4.7 T (Mandeville and Marota, 1999; Mandeville et al, 1998) (Figure 5). This could be explained if | fCNRM/fCNRB | rises with a sharp nonlinearity at low levels of neuronal activity (similar to the weak neural activity produced inside the OPZ by extraclassical surround stimulation). This type of nonlinearity, if present, would confer an extra advantage to CBV over BOLD imaging under weak stimulation conditions. However, no evidence for such a nonlinearity has been conclusively demonstrated to date, to our knowledge. We therefore conclude that the CBV modulation seen inside the OPZ is not likely to be due to the underlying local neural activity and proceed to investigate hemodynamic hypotheses that may explain our observations.
Can Vascular ʻCrossTalk' Cause the Disparity in Blood Oxygen Level-Dependent Versus Cerebral Blood Volume Maps?
One possibility is that the CBV modulation inside the OPZ primarily reflects nonlocal vascular contributions originating from the hemodynamic response in the cortical surround, which is stimulated directly. Stimulus-driven CBV modulation spread of comparable extent has been reported in optical imaging studies using the single-condition stimulation paradigm (Malonek and Grinvald, 1996; Vanzetta et al, 2004) and has been attributed to a nonlocal component of the CBV (and the BOLD) signal thought to originate in noncapillary surface vessels (Vanzetta et al, 2004). In our experiments, the CBV modulation was strongest in the deep cortical layers (Figure 2D), which, apart from capillaries, contain a rich network of venules, cortical arteries, and branching principal veins (Duvernoy et al, 1981) (Figure 7).
To relate our observations to the underlying vascular anatomy, we stained blood vessel walls in histological slices taken from macaque area V1 with anticollagen antibodies (Materials and methods) and measured vascular density as a function of depth (Figure 7A and Figure 7B). The rich capillary network in layer IV (Zheng et al, 1991) (Figure 7B) is evident, as is the presence of relatively large vessels along the border of layer VI and white matter, corresponding primarily to Duvernoy principal cortical vein (V5) branches, which extend for considerable distances parallel to the gray—white matter junction before penetrating the cortical ribbon on their way to the pial surface (Duvernoy et al, 1981) (Figure 7B and Figure 7D). The vascular density function (Figure 7A) has two peaks at the corresponding cortical layers. High-resolution post-MION injection GEFI images of macaque area V1 confirmed that the richly vascularized layers IV and VI have higher fractional blood volume (decreased signal) compared with other cortical layers (arrowheads, Figure 7C). Blood diverted into the OPZ through these vascular networks during stimulation of the surrounding cortex may potentially result in the observed CBV modulation. At least two potential hypothetical mechanisms could account for this:
Extensive surround stimulation may lead to opening of nonspecific arterial channels that feed not just the area of the surround but also the region of the OPZ itself. Thompson et al (2004) report that increasing the spatial extent of neural activation enhances CBF out of proportion to CMRO2 and, because CBF is less spatially specific (Thompson et al, 2004), this may provide a mechanism by which CBF (and CBV) increases inside the OPZ. This is unlikely to be the whole story however, as arterial flow diverted inside the OPZ, where neural activity is at best weak, should have led to a measurable increase in BOLD fCNR (fCNRB). Instead, the mean fCNRB inside the center of the OPZ remained not significantly different from zero (Figure 5). Therefore, redundant arterial flow supplying the OPZ from the surround is unlikely to provide the sole explanation of the CBV modulation seen inside the OPZ. There is, however, a slight variation on this scheme that may work. This occurs if the vessels responsible for the CBV modulation inside the OPZ consist primarily of ʻbypassing' arteries that do not directly drain into the OPZ capillary network, but instead bypass it, to feed the activated surround. Because arterial hemoglobin saturation is near 100%, increased CBF in ʻbypassing' arteries would increase CBV but would not be expected to change the concentration of deoxy-hemoglobin inside the OPZ. Therefore, BOLD would remain unchanged while CBV would increase. Although this is theoretically possible, the anatomical arrangement (Figure 7D) of arterial feeding channels (Duvernoy et al, 1981; Zheng et al, 1991) in primate area V1 (i.e., perpendicular to the cortex and of limited lateral extent) argues against the ʻbypassing' artery explanation.
A second possibility is that CBV modulation is mediated primarily through venous collateral channels inside the OPZ. During direct visual stimulation of the OPZ surround, venous outflow increases there because of the neurally coupled hemodynamic response, leading to superficial pial vein engorgement. Because the OPZ is drained through spatially nonselective veins that pass through the surrounding cortex, it is subjected to an increase in afterload during surround stimulation, which could result in the observed CBV modulation inside the OPZ (Figure 4). This would potentially be most evident in deep cortical layers which, we have argued, may be more compliant (Supplementary Figure 1). The BOLD signal may be suppressed depending on the relation between the change in CBV and CBF inside the OPZ during surround stimulation. In particular, assuming CMRO2 does not change much with surround stimulation inside the OPZ (m ~ 1), for BOLD to be zero the observed CBV increase inside the OPZ should be accompanied by a commensurate increase in CBF, satisfying approximately a modified Grubb's relationship v = fα with α ~ 1 (rather than ~ 0.4). Under these conditions, the increase in venous CBV may be compensated by the decrease in [dHb] owing to the washout effect of inflowing well-oxygenated blood through collateral arterial channels and BOLD could remain unchanged.
In summary, as expected (Leite et al, 2002; Mandeville et al, 1998; Vanduffel et al, 2001), the intravascular contrast agent MION used for CBV imaging improved contrast to noise ratio at 4.7 T. We confirmed that both MION and BOLD imaging are capable of mapping the cortex with high spatial resolution (~ 1 mm), particularly when using spatially restricted stimuli in a differential mapping paradigm (Supplementary Figure 2). However, it would be misleading to assume that CBV maps are simply high-gain equivalents of BOLD activation maps in all situations. Our results in macaque V1 showed, in accordance with prior studies (Harel et al, 2006; Lu et al, 2004; Mandeville and Marota, 1999), that CBV modulation is relatively stronger in deep versus superficial cortical layers compared with BOLD (Figure 2). Surprisingly, we also showed that large (>10 mm in diameter) area V1 regions surrounded by stimulated cortex can exhibit strong CBV modulation in the absence of significant BOLD modulation (Figure 4 and Figure 5). We discussed possible etiologies for this discrepancy and argued that the most plausible one is hemodynamic in origin, perhaps mediated by an increase in venous afterload owing to stimulation of the cortical surround. The alternative hypothesis, that CBV functional contrast-to-noise ratio has a nonlinear advantage over BOLD functional contrast-to-noise ratio at low levels of neural stimulation, may also merit further investigation. Overall, our findings suggest that CBV and BOLD maps of cortical organization should not necessarily be viewed as equivalent to each other up to a multiplicative gain adjustment, but should be interpreted with care, in the context of the particular experimental paradigm employed.
Footnotes
Acknowledgements
We thank Anna Lena Keller for help with the histological processing. We are also grateful to Christoph Juchem, Joe Mandeville, Kamil Uludag, Wim Vanduffel and our laboratory colleagues for many insightful comments and suggestions.
References
Supplementary Material
Please find the following supplemental material available below.
For Open Access articles published under a Creative Commons License, all supplemental material carries the same license as the article it is associated with.
For non-Open Access articles published, all supplemental material carries a non-exclusive license, and permission requests for re-use of supplemental material or any part of supplemental material shall be sent directly to the copyright owner as specified in the copyright notice associated with the article.