
Abstract
In the traumatic brain injury (TBI) the initial impact causes both primary injury, and launches secondary injury cascades. One consequence, and a factor that may contribute to these secondary changes and functional outcome, is altered hemodynamics. The relative cerebral blood volume (CBV) changes in rat brain after severe controlled cortical impact injury were characterized to assess their interrelations with motor function impairment. Magnetic resonance imaging (MRI) was performed 1, 2, 4 h, and 1, 2, 3, 4, 7, and 14 days after TBI to quantify CBV and water diffusion. Neuroscore test was conducted before, and 2, 7, and 14 days after the TBI. We found distinct temporal profile of CBV in the perilesional area, hippocampus, and in the primary lesion. In all regions, the first response was drop of CBV. Perifocal CBV was reduced for over 4 days thereafter gradually recovering. After the initial drop, the hippocampal CBV was increased for 2 weeks. Neuroscore demonstrated severely impaired motor functions 2 days after injury (33% decrease), which then slowly recovered in 2 weeks. This recovery parallelled the recovery of perifocal CBV. CBV MRI can detect cerebrovascular pathophysiology after TBI in the vulnerable perilesional area, which seems to potentially associate with time course of sensory-motor deficit.
Introduction
Traumatic brain injury (TBI) is complex, devastating pathology with the incidence rate estimated to be 150 to 250 cases per 100,000 population per year (Graham et al, 2000). The primary impact-related mechanical injury is superimposed by secondary injury pathways, such as progressive neurodegeneration (Dixon et al, 1991; Dietrich et al, 1994; McIntosh et al, 1989), persistent inflammation, glial hypertrophy and proliferation (Soares et al, 1995), and cerebrovascular dysfunctions (Overgaard and Tweed, 1974; Dietrich et al, 1998).
Hemodynamic changes may exacerbate the TBI. The initial impact may locally generate contusional damage to the vasculature, blood clots causing occlusions or other conditions where the blood supply to tissue is seized or hindered. Thus, one consequence of traumatic impact has been shown to be local ischemic state of the tissue where the oxygen and glucose delivery is impaired causing disturbances in energy metabolism, mitochondrial function, and brain functionality (Dietrich et al, 1994, 1998). However, in TBI the concepts of lesion ‘core’ and surrounding ‘penumbra’ and their temporal evolution clearly differ from those in the ischemic stroke. In TBI the focal lesion develops into the contusion site, tissue deteriorates, and cyst is formed—as it is in ischemic stroke as well—but in TBI the lesion cavity continues thereafter to expand for several months (Immonen et al, 2008). The fate of the penumbra in ischemia is dictated in relatively acute phase, depending if the blood flow is restored or not, whereas in TBI the tissue surrounding the focal lesion, called perilesional area, suffers from delayed pathologic processes that keep worsening over following months (Immonen et al, 2008). Thus, the mechanisms of the destructive and recovery cascades in ischemic stroke and TBI differ in many parts, but most likely the perfusion and blood supply deficits have an essential role also in TBI as well and contribute to the damage.
Cerebral autoregulation has been found to be impaired in severely brain injured patients (Overgaard and Tweed, 1974). Three distinct cerebral hemodynamic phases in severe head trauma patients have been characterized based on cerebral blood flow (CBF) changes (Martin et al, 1997): hypoperfusion (decreased CBF during the day of the injury), hyperemia (i.e., the increased amount of blood in the tissue/tissue vasculature during the next 3 days), and vasospasm (including fall in the CBF, lasting the next 2 weeks/thereafter). Cerebral blood volume (CBV) reduction has been reported in subacute phase after severe TBI (Marmarou et al, 2000); however, even patients with symptomatic mild TBI but without any other abnormal magnetic resonance imaging (MRI) findings have shown persistent regional hypoperfusion (Bonne et al, 2003). In the primary contusion site there is often hemorrhagic focus of necrosis, blood–brain barrier (BBB) disruption, vasogenic edema, and decrease in regional blood flow (Graham et al, 2000). There are also recovery processes, such as angiogenesis known to take place in the later postinjury phase (Dunn et al, 2004).
In the experimental studies of TBI, hypertension and hypoperfusion have been found to worsen the severity of histopathologic damage (rat model for lateral fluid percussion-induced brain injury, Dietrich et al, 1994, 1998). Marked decrease in CBV and CBF has been found 3 to 4 h after injury in the rat model of closed head injury (Prat et al, 1997; Thomale et al, 2002). Local CBF has been found to decrease 15 mins after injury and remain decreased up to 4 h in lateral fluid percussion rat models (Ginsberg et al, 1997) and similar patter of CBF has been found in humans (Martin et al, 1997; Kelly et al, 1996, 1997). Interestingly, in experimental models transient hypoperfusion has also been detected in the contralateral hemisphere (Pasco et al, 2007).
In the rat model of controlled cortical impact (CCI) injury, which uses pressurized air as the source of the mechanical energy for driving impact to the brain (Dixon et al, 1991), the blood pressure response has been shown to depend on injury levels; a moderate impact produced a hypotensive response whereas a severe impact injury produced an immediate brief hypertensive response followed by hypotension (Dixon et al, 1991). The CBF studies in this rat model report acute hypoperfusion followed by hyperperfusion up till 48 h (Thomale et al, 2002). However, the temporal patterns of CBV alterations starting on acute phase after injury and extending to the subacute phase, i.e., several days/weeks after injury have not been studied.
One way to estimate the importance of the post-TBI hemodynamic changes and evaluate their possible value as surrogate marker for disease progression is to study the correlations between these changes and functional outcome measures. However, only a few such studies currently exist. Henninger (Henninger et al, 2007) has previously correlated the basal hypoperfusion (diffusion values normal) with dysfunction with forepaw placement after mild experimental closed-head TBI. In head injury patients, the CBF decrease during the first 24 h (relative oligemia) together with other hemodynamic parameters have been also correlated with poor functional outcome (Soustiel et al, 2005).
In this study, we hypothesized that not only the primary contusion site but also the perifocal and hippocampal regions show disturbed hemodynamics for several weeks after onset of TBI and that these disturbances are linked to the functional deficits and possible recovery. The hypothesis was tested in rat model of CCI using high spatial resolution CBV MRI and behavioral Neuroscore testing.
Materials and methods
Animals
Adult male Sprague Dawley rats weighting 250 to 350 g were used (n = 79, Charles River Laboratories, Sulzfeld, Germany). The animals were housed in individual cages and kept under controlled laboratory conditions (12 h light/12 h dark cycle with lights on at 07:00 a.m., temperature 22 ± 1°C, air humidity 50% to 60%, ad libitum access to food and water). All animal procedures were approved by the Animal Care and Use Committee of the University of Kuopio, and conducted in accordance with the guidelines set by the European Community Council Directives 86/609/EEC.
Controlled Cortical Impact Injury
Controlled cortical impact was first described in the ferret (Lighthall, 1988), and later adapted for use in the rat (Dixon et al, 1991). In this study, unilateral TBI was induced as follows: halothane-anesthetized (1% in 30/70 O2/N2) rats were placed in a stereotaxic frame. The rectal temperature was maintained at 37.0 ± 1.5°C using a homeothermic blanket system. Controlled cortical pneumatic impact device (AmScien Instruments, Richmond, VA, USA) was used to induce severe grade TBI. Craniectomy of 6 mm in diameter was performed unilaterally in the midway between the bregma and the lambda (1 mm lateral to the midline). The dura was kept intact and care was taken not to cause any injury to vascular structures. Rats were injured by a CCI device, which has a 5-mm diameter tip traveling at a velocity of 3 m/secs. The impactor tip entered the brain for 50 ms and created a 2.0-mm deep deformation. Thereafter, the exposed cortex was covered with the previously removed piece of skull and sealed with Spongostan (Ferrosan, Soeborg, Denmark) soaked in sterile saline, and the wound was closed and disinfected.
Experimental Protocol
The study design is outlined in Figure 1. Rats were divided into eight experimental TBI groups imaged at different time points (in total for TBIs N = 61), and a control group (N = 12). We studied the relative CBV changes in rat brain after cortical impact injury to find out more about the hemodynamics in different brain areas in acute (1 to 4 h) and subacute (1 to 14 days) phase after TBI. MRI with iron oxide contrast agent was performed at 1 h (n = 6), 2 h (n = 12), 4 h (n = 13), 1 day (n = 6), 2 days (n = 6), 3 days (n = 6), 4 days (n = 6), 7 days (n = 6), and 2 weeks (n = 14) after injury. The eight groups were each imaged once in 1 h to 7 days time points, and for the 2 weeks postinjury data 14 of the same animals that had first been imaged at day 1 (4/7), day 2 (6/6), or day 3 (4/6) were imaged for the second time. For these animals the first imaging took place 11 to 13 days earlier and is not assumed to have any effect on the results of the day 14. Behavioral Neuroscore testing was performed before and 2 days, 7 days, and 14 days after the TBI induction to follow the impairment and recovery of motor functions after injury. In the Neuroscore, subgroup of 29 animals were tested repeatedly (subgroup included the animals imaged 1 to 7 days after injury, except for two that were imaged at day 2).
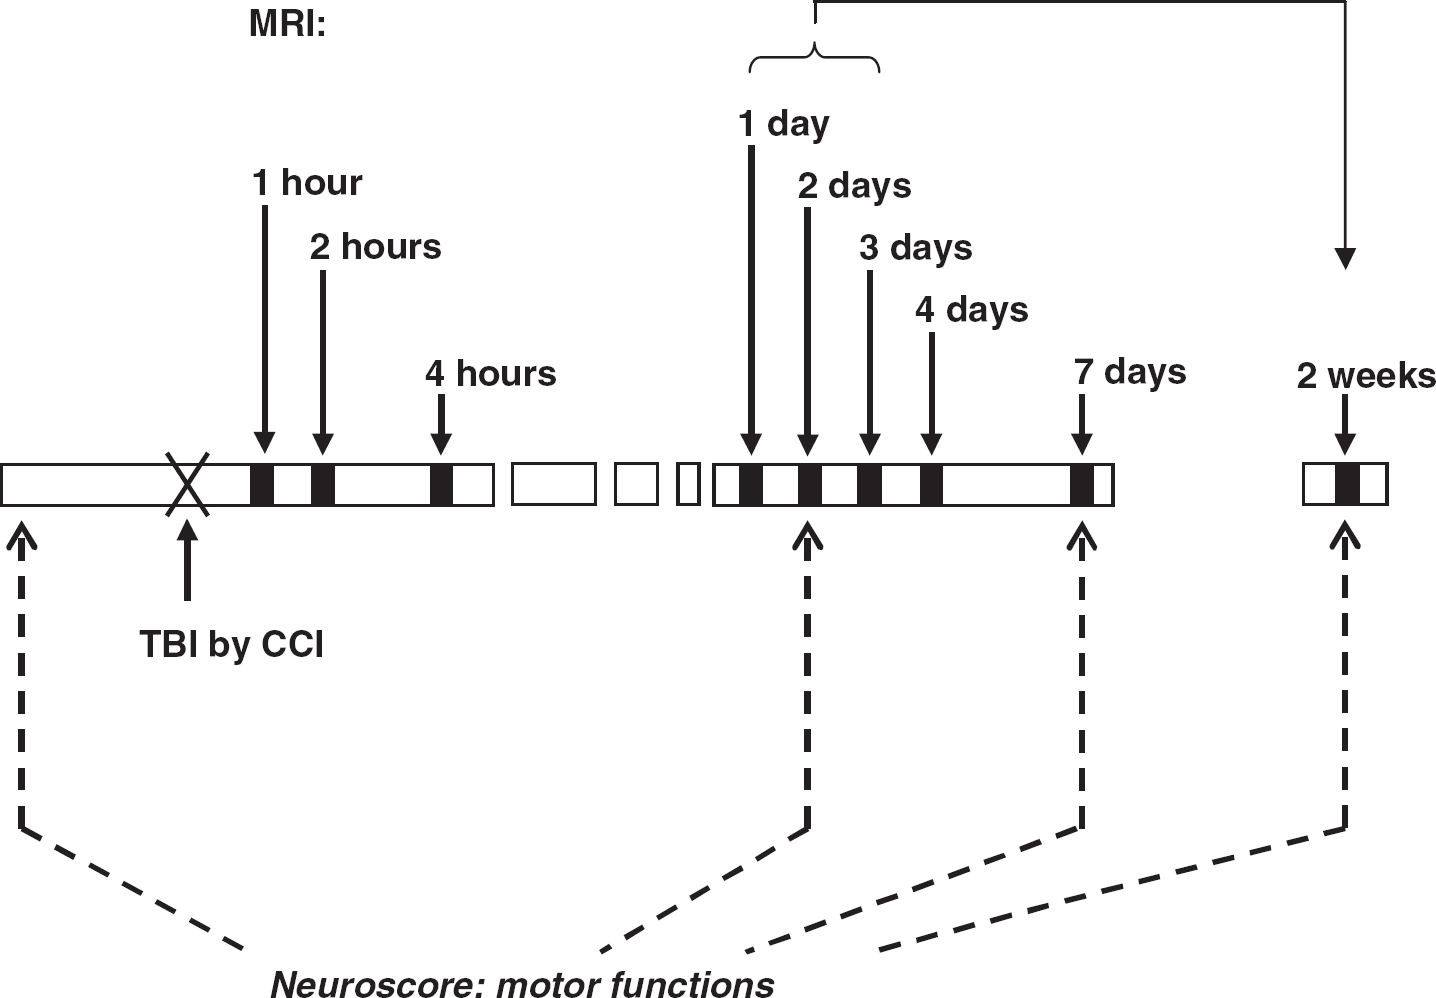
The study design. After the induction of TBI the MRI to measure CBV was performed 1 h, 2 h, 4 h, 1 day, 2 days, 3 days, 4 days, 7 days, and 14 days after injury, different groups of animals were imaged at each timepoint, except for the 14 days measurements the imaging was performed for the second time to the animals in 1 to 3 days groups. Neuroscore tests for motor functions were performed before and 2 days, 7 days, and 14 days after the TBI (subgroup of 29 animals was tested).
Our methodological approach was dictated by the fact that the main regions of interest (ROI) were the relatively small volume of tissue surrounding the primary contusion site and hippocampus, both of which we have previously shown to suffer from slowly progressive neurodegenerative processes (Immonen et al, 2008), and which vulnerability we hypothesize to be partially because of blood circulation deficits after the initial injury. The measurement of CBV with intravascular contrast agent was a method of choice because of high spatial resolution, simple multislice acquisition and general robustness of the approach. Furthermore, we measured water diffusion in all studied brain regions, lesion volumes, and the presence of intracerebral hemorrhages.
To monitor the blood gases and blood pH during measurement protocol and halothane anesthesia, one reference group (N = 6) was added. This group went through identical CCI operation and cannula implantation, whereas the anesthesia corresponding to the time spent in the magnet was mimicked with bench test. Blood samples were withdrawn and analyzed (i-Stat Co, East Windsor, NJ, USA) at the time points corresponding the midpoint of prior contrast agent measurement and the midpoint of postcontrast agent measurement at 2 h and 2 weeks after TBI (N = 3), and at 1 day and 4 days after TBI (N = 3). The body temperature was monitored by rectal probe and maintained close to 37.5°C by warm water circulation in a heating bed placed under the animal.
MRI Methodology
Rats were imaged under isoflurane anesthesia (carrier gas of O2 30% and N2O 70%). The breathing rate of the animal was continuously monitored with a pressure probe under them and the isoflurane level was adjusted accordingly keeping the anesthesia level relatively light (isofluorane between 1.3% and 1.7%) during the imaging. Animals were kept warm with water circulating heating bed under them and the bed temperature was maintained at +38.5°C. MRI data were acquired using a horizontal 4.7 T magnet (Magnex Scientific Ltd, Abington, UK) with actively shielded imaging gradients (Magnex) interfaced to a Varian (Palo Alto, CA, USA) UNITYINOVA console and using an actively decoupled volume transmission coil and quadrature surface receiver coil (Rapid Biomedical, Würzburg, Germany). T2 weighted imaging was performed before and after iron oxide contrast agent (ultrasmall superparamagnetic iron oxide, Sinerem, 3 mg/kg) injection into the femoral vein cannula (injection time was about 1 mins, after the infusion 5 mins delay before starting the postcontrast imaging sequence allowed the contrast agent to reach the target area; the animal was not moved in between premeasurements and after measurements). T2 weighted images were measured using spin echo sequence (TE = 70 ms, TR = 2500 ms, 128*256 pts). In addition, T2* weighted images were measured using a gradient echo sequence (TE = 15 ms, TR = 1500 ms, flip = 70°, 128*256 pts) to detect hemorrhages. Both T2 and T2* weighted images had an FOV of 4.0*4.0 cm2, 17 coronal slices, slice thickness = 1.0 mm and two averages per phase encoding step. Diffusion data were assessed from all rats as a first measurement of the MRI setup before the contrast agent administration. Diffusion map, Dav = 1/3 of the trace of the diffusion tensor, was quantified using a spin echo sequence (b-values = 0, 700, 1,000*10−3 mm2/secs, TE = 60 ms, TR = 2 secs, and 64*128 pts, FOV of 4.0*4.0cm2, seven coronal slices, slice thickness = 1.0 mm).
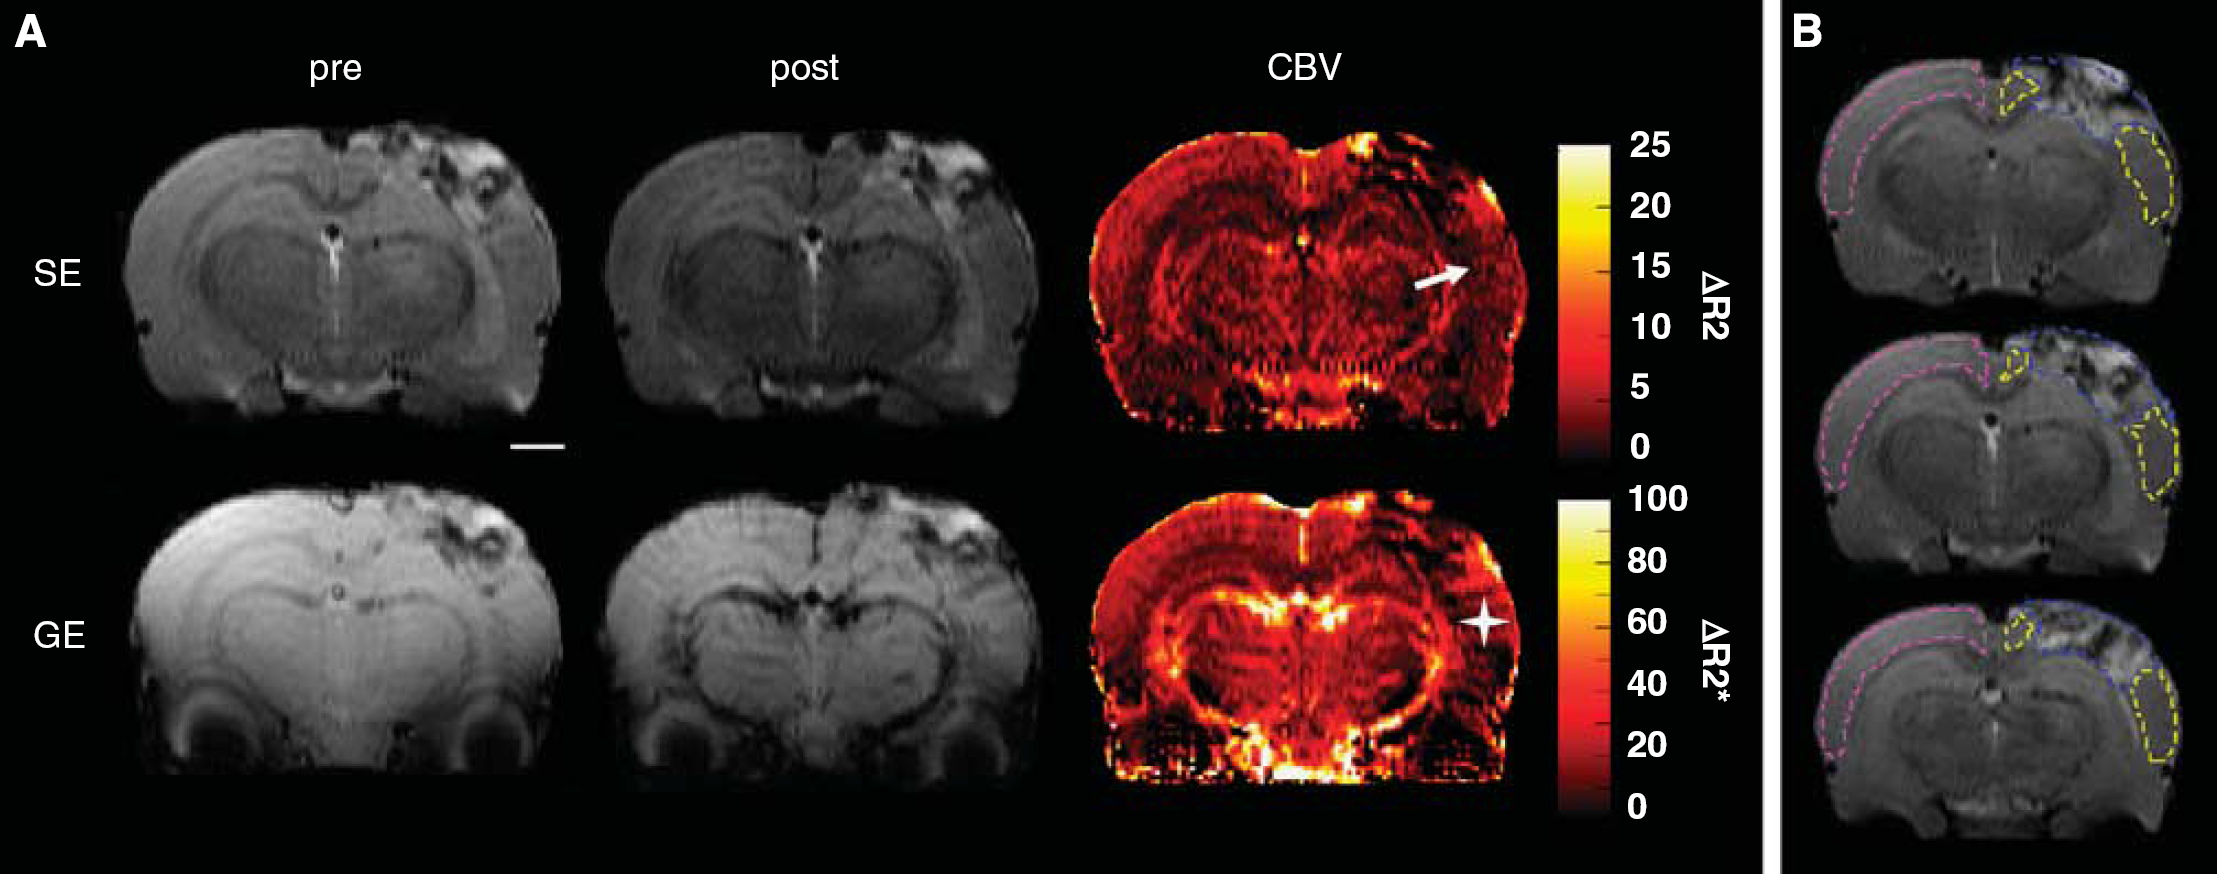
All analyses were performed using an in-house written program in Matlab 7.1 (Math-Works, Natick, MA, USA). The ΔR2 maps were calculated by subtracting images taken postcontrast and precontrast agent administration and using a formula of a standard monoexponential T2 decay function with the assumption that the measured signal intensity drop was caused only by increased R2 because of intravascular contrast agent. The ΔR2 is here assumed to be directly proportional to CBV (as previously described by Wu (Wu et al, 2003)) with a contribution of only small vessels (diameter 8 to 12 μm). The ROIs were manually outlined in T2 weighted images and overlaid on top of the quantitative maps thereafter. The lesion volume was determined through 17 slices. The CBV and diffusion values were quantified in the lesion, perifocal cortical area surrounding the lesion, both ipsilateral and contralateral hippocampus, and contralateral cortex as an average of three consecutive 1 mm slices around the lesion epicenter (see Figure 2A). The absolute ΔR2 values were assessed, and in addition, to eliminate the effect of differences in the background iron oxide level, normalized values were calculated. ΔR2 data were normalized animal by animal to a reference area by dividing the ROI value by the average pixel value of the reference ROI and presenting these relative values. The reference area was a muscle area outlined in the most frontal slices distant from the operation site (visually corresponding the level of +1.00 mm from Bregma in Paxinos rat atlas) as it appeared to be unaffected by the impact.
(
Neuroscore
A subgroup of 29 rats in MRI follow-up were tested with composite Neuroscore procedure with small modifications to the previously described procedure (Maegele et al, 2005; McIntosh et al, 1989). Briefly, the rats were scored on a 0 (severely impaired) to 3 to 4 (normal) integral scale for several motor performance test protocols: circling (scoring 0 to 4) and motility (0 to 3) when placed on the floor, general condition (0 to 3), paw placement back to the bench when taking each paw one by one over the edge of the bench (0 to 4), righting reflex when placed to lie on its back (1 score for successful righting), the ability to climb up when placed hanging on a ribbed horizontal bar by its forepaws (0 to 3), the ability to turn around on an 45° inclined plane when placed face ‘downhill’ (0 to 3), the ability to swivel around contralaterally to the rotation when rotated by the base of the tail clockwise and then anticlockwise (1 score for each side), visual forepaw reaching on suspension by the tail with vibrissae next to a bench top (score per each paw if the animal archs and places forepaws on the bench), contralateral reflex when animal is hold by the base of the tail (1 score for no reflex, 0 for a reflex), and finally, a grip strength onto bars on cage when dragged by the tail (score 0 to 2). A composite score (0 to 28) was generated by combining the scores for each of these tests. The motor functions of the animals were tested before and 2 days, 7 days, and 14 days after the TBI induction. Total animal number in Neuroscore tests was 29 and all these animals were tested in all four time points. From the tested rats six belonged into the group imaged at day 1, four in the group imaged at day 2, six in the group imaged at day 3, six in the group imaged at day 4, and six in the group imaged at day 7.
Statistics
Statistical analysis was performed using SPSS for Windows software (Chicago, IL, USA, version 14.0). Differences between groups were analyzed with Kruskal–Wallis followed by post hoc analysis with Mann–Whitney U-test both for MRI data (because of low animal number) and for nonparametric Neuroscore data. Results are expressed as mean ± standard deviation (s.d.).
Results
The Lesion Extent, Structural Damage and Intracerebral Hemorrhages
The primary injury was evidently detectable in T2 weighted images at the site of the impact in every animal as a hyperintense cortical contusion (referred hence as lesion), which in some cases extended into subcortical structures. The T2 contrast in the lesion appeared heterogenous (Figure 2) indicating the presence of both severely edemic tissue and hematomas. The inspection of the T2* weighted images verified the presence of intracerebral hemorrhages in each animal either inside the lesion or further away in between the cortex and the hippocampus, in the white matter structures of corpus callosum, fimbria, and alveus of hippocampus. The lesion covered the ipsilateral parietal cortex, extended over 4 to 11 slices (i.e., 4 to 11 mm) in rostro-caudal direction, caused mild shape deformation of ipsilateral hippocampus, and in 17 out of 61 cases hippocampal structures below the lesion were severely damaged by primary impact as well. Lesion volumes ranged from 25 to 320 mm3. The temporal development of lesion was not determined, because different animals with large interanimal variations were imaged at different time points. The lesion volume for those animals that were imaged twice (both at days 1, 2, or 3 and for the second time at day 14) decreased in 10/14 animals (38 ± 23 mm3 decrease indicating the alleviation of the edema seen as hyperintensity in T2 weighted images) and increased in 4/14 animals (30 ± 46 mm3 increase).
The CBV and Diffusion Changes After TBI
The CBV alterations after TBI were determined by assessing the relaxation time changes because of the contrast agent administration and estimating that those changes were directly proportional to the blood volume within the voxel. The absolute ΔR2 appeared to measure the CBV consistently with small inter animal variation. The blood samples drawn from additional TBI reference group showed that the partial pressures of blood CO2 and O2 did not change between premeasurements and after measurements (P > 0.63) and that in each time point checked, i.e., 2 h, 1 day, 4 days, and 2 weeks after TBI, the group averages of blood CO2 remained below 50.5 mmHg and O2 above 93.5 mmHg (average values over all measurements were 48.7 ± 3.6 mmHg for CO2 and 114.7 ± 19.9 mmHg for O2). These observations eliminated the possibility that increase in blood CO2 would have been the underlying cause of observed CBV changes.
Diffusion changes were quantified to estimate tissue damage. Diffusion decreased in acute phase in all studied regions, including contralateral cortex, indicating cytotoxic edema, and the magnitude of the diffusion increase thereafter differentiated the irreversibly damaged primary lesion from the adjacent tissues at risk, i.e., the perifocal area and the hippocampus (Figures 3 and 4). As pathology-related diffusion changes were observed also in the contralateral cortex, muscle area was chosen as reference area for the relative CBV values.
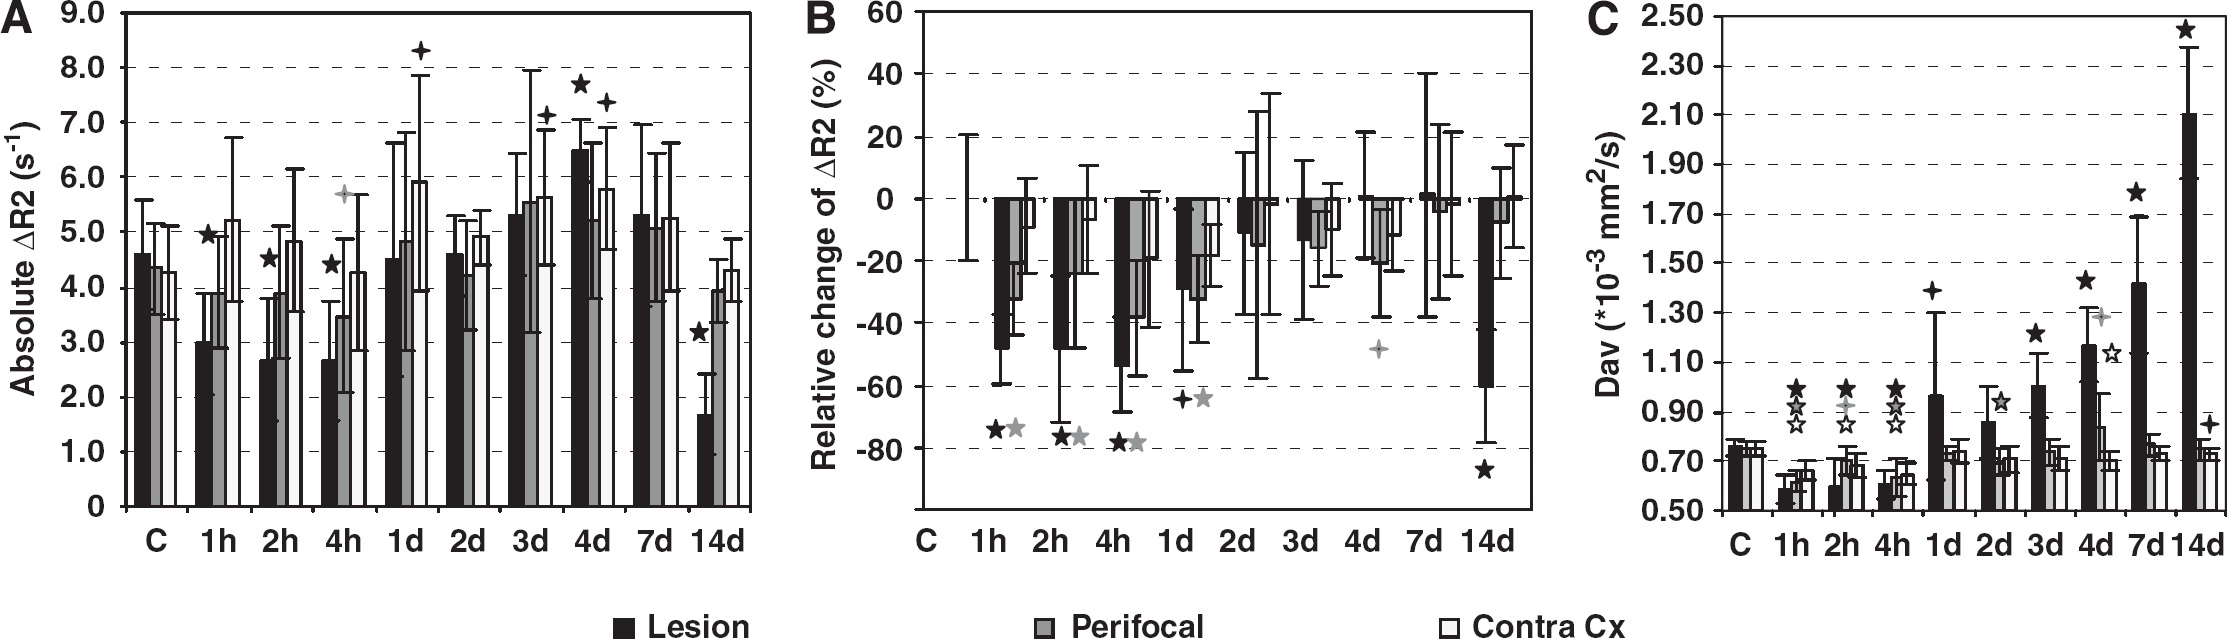
Cerebral blood volume and diffusion changes after TBI in the hyperintense lesion area, perifocal area, and contralateral cortex. (
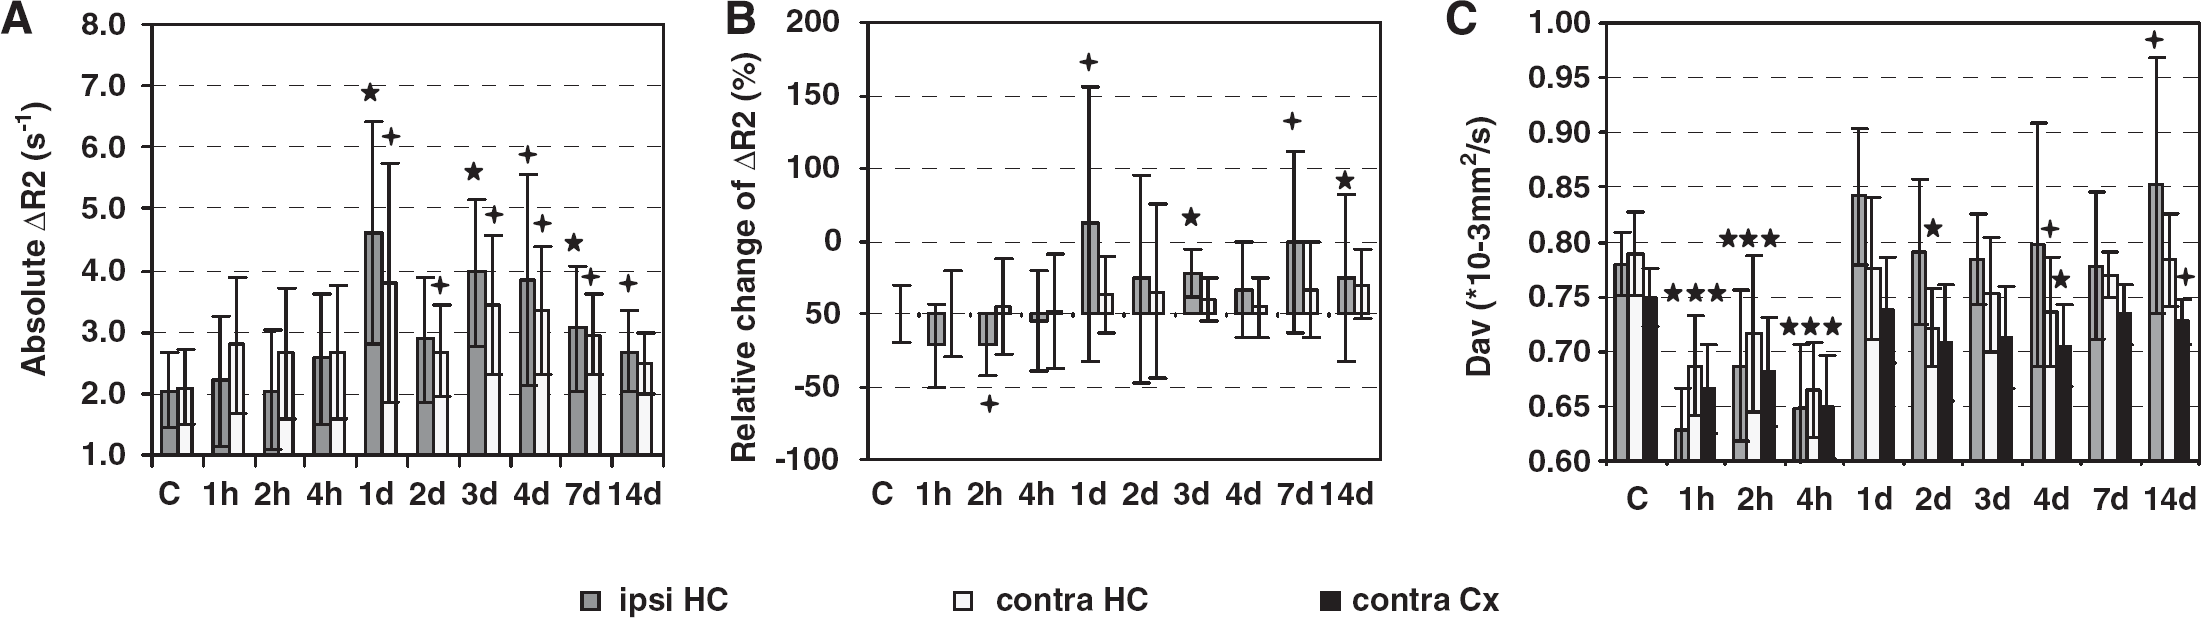
Cerebral blood volume and diffusion changes after TBI in the ipsi- and contralateral hippocampus. (
The Lesion Area Displays Decreased CBV Values and Severe Diffusion Abnormalities
Figure 3 shows the temporal changes in the CBV and in average diffusion in the lesion, as compared with the perifocal region and contralateral cortex. ΔR2 is shown as absolute values and as normalized to the reference muscle area, and the statistical significances of the changes are given as compared with the control group. The CBV measurements show that both ΔR2 values decreased acutely 1 to 4 h after injury in the lesion site. Thereafter, absolute ΔR2 showed return to the control level, overshoot at day 4 after injury and drastic drop of 63% (as compared with controls) at 2 weeks after injury. Normalized ΔR2 showed slower recovery, remaining significantly decreased for 1 day, it returned close to the control level 2 to 7 days after injury (with no overshoot) and the drop 2 weeks after injury was 61%.
In the primary lesion area the acute diffusion drop 1 to 4 h after injury was followed by distinct progressive increase of diffusion after day 2 (P < 0.01). Two weeks after injury, the diffusion values in the primary contusion site were 2.8-fold higher than in the cortex of controls approaching diffusion values of free water and indicating irreversible damage.
In the Perifocal Area CBV Was Acutely Decreased and Recovered Thereafter
The temporal changes in the CBV and diffusion in the perifocal area surrounding the lesion are shown in Figure 3. The diffusion characteristics of the perifocal area were a moderate diffusion decrease in the acute phase (P < 0.01 at 1 to 4 h after injury) and diffusion increase of 11% by day 4 (as compared with controls, P < 0.05).
The CBV in the perifocal area dropped acutely after TBI indicating decreased CBV in the capillaries in that area. The absolute ΔR2 values showed significant decrease at 4 h after injury, thereafter they appeared to recover. Although normalized CBV values remained decreased until day 4, even though they did start to recover toward the control values already 2 days after injury (see Figures 3A and 3B). After 2 weeks the CBV in the perilesional area appeared normal.
In the Hippocampus the Acute CBV Drop Is Followed by CBV Increase in Capillaries That Persists for the Rest of the 2 Weeks Follow-Up
The hippocampus directly below the impact site suffered severe damage in 28% of the TBI rats directly because of the mechanical force of the primary impact. In those animals the CBV and diffusion values were analyzed in the regions of normal appearing (in T2 weighted images) hippocampal tissue. Figure 4 shows the temporal changes in the CBV and diffusion in the hippocampi ipsilateral and contralateral to the lesion. The ΔR2 values are shown both as absolute values and as normalized to those in the reference muscle area. Diffusion in hippocampus, also contralaterally, showed acute drop 1 to 4 h after TBI. In the ipsilateral hippocampus, diffusion was increased by 8% in the first day after injury, showed trend of elevated values during the next week, and was again increased by 9% 2 weeks after injury (Figure 4C). The diffusion trend in the hippocampus resembled the diffusion trend in the perifocal area. Interestingly, however, the CBV changes in hippocampus were distinctively different from those in the perifocal area. In the ipsilateral hippocampus, CBV (both absolute and normalized ΔR2 values) became elevated starting at day 1 after injury and lasting for the rest of the 2 weeks follow-up period (for absolute changes P < 0.05 at days 4 and 14 and P < 0.01 at days 1, 3, and 7, see Figures 4A and 4B for details). In the acute phase only the normalized ΔR2 values (not the absolute values) displayed an acute drop 1 to 2 h after injury by 21% (at 2 h after TBI P < 0.05). Importantly, also the CBV values in the contralateral hippocampus showed a delayed subacute increase. The absolute ΔR2 was elevated by 46% to 119% (as compared with controls, P < 0.05) between the first and 7th day after injury. However, the simultaneous increase in the ipsilateral hippocampus was more evident in all time points.
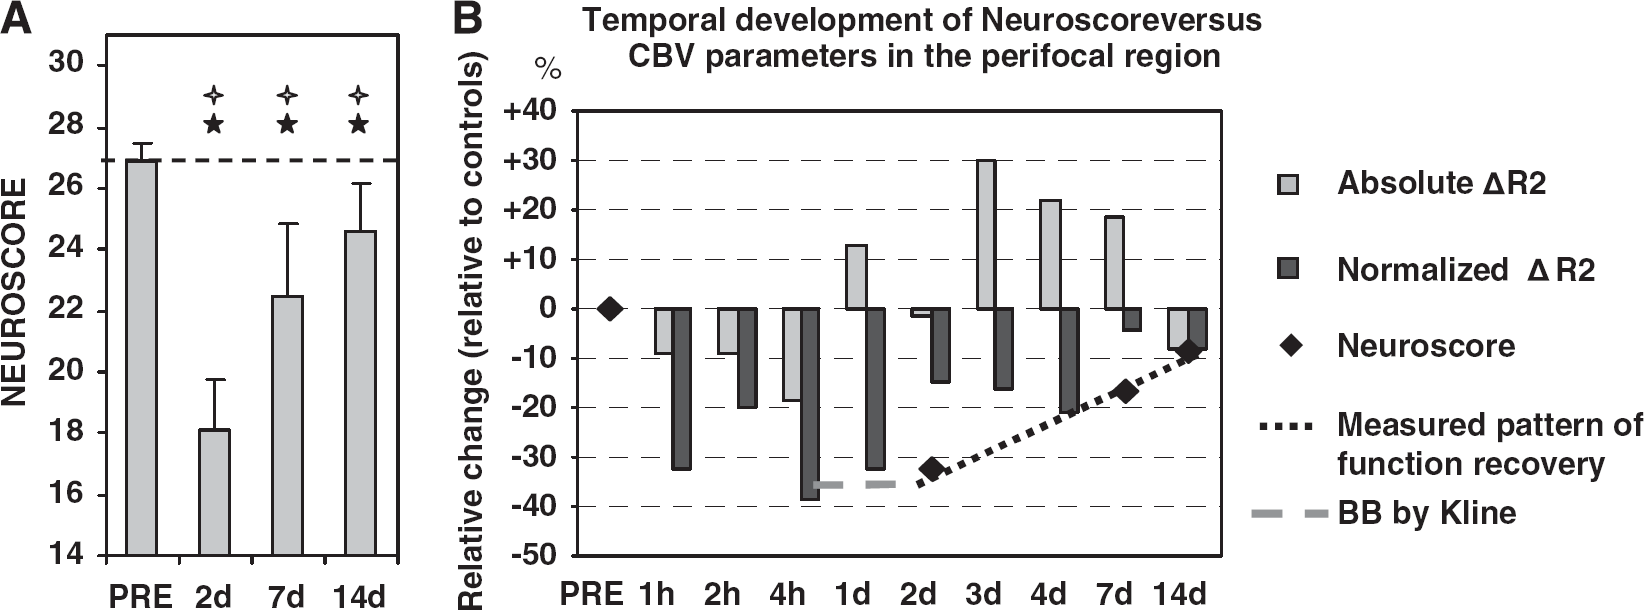
The Recovery of Motor Functions Follows the Recovery of CBV in the Perifocal Area
To investigate if the hemodynamic disturbances are associated with functional impairment, the Neuroscore test was used to evaluate the motor function impairment after TBI. Neuroscore revealed severe motor deficit after the injury. Figure 5 shows the temporal development in the performance of the rats. The impairment was most severe 2 days after injury (33% drop in performance) and started to recover thereafter (Neuroscore was 16% below the control level 7 days after injury and 8% below the control level 2 weeks after injury). There was significant (P < 0.01) improvement from 2 to 7 days and again from 7 days to 2 weeks. Yet, the score 2 weeks after injury remained below the control level. Importantly, the recovery of ΔR2 in the perifocal area appeared to precede the recovery of motor functions (Figures 5A and 5B).
(
Discussion
The disturbances in the cerebrovascular functions after TBI affect the extent of the secondary injury (Kelly et al, 1997; Dietrich et al, 1998; Soustiel et al, 2005). We characterized CBV changes after TBI in several time points with the special emphasis on perifocal areas surrounding the lesion and the hippocampus. ΔR2 caused by injection of intravascular contrast agent MION is sensitive to the CBV in capillary size vasculature. We have four main findings in this study. First, in all studied brain regions there was marked acute decrease in CBV, seen as decreased ΔR2, and acute diffusion drop lasting several hours after the TBI induction. Second, in the subacute phase both the perifocal area and the primary lesion showed slow recovery of CBV values, but after 2 weeks perilesional values were close to normal whereas the values in the primary lesion area dropped drastically. Third, in the ipsilateral hippocampus the CBV in capillaries was increased from the day 1 onward. Fourth, the recovery of motor functions in the behavioral Neuroscore test seemed to occur in parallel with the recovery of CBV values in the perifocal area.
The First Response to TBI Was CBV Drop and Diffusion Decrease
In cortical brain regions ΔR2 decreased in acute phase (1 to 4 h) after injury most likely indicating acute hypoperfusion. In the ipsilateral hippocampus the normalized ΔR2 values suggested similar decrease, but were not supported by the absolute data. This acute hypoperfusion has been reported in both experimental (Prat et al, 1997) and human (Martin et al, 1997) studies (in contusional and pericontusional areas). A simultaneous phenomena, cytotoxic edema, was also observed as acute diffusion drop (Moseley et al, 1990), and it has been shown to take place after TBI in several experimental imaging and histologic studies (Pasco et al, 2007; Albensi et al, 2000; Obenaus et al, 2007; Van Putten et al, 2005). Importantly, these both acute phenomena seem to be reversible, and the diffusion and CBV values normalize within days or weeks at least in perilesional areas. Pasco and coworkers have studied the transient cytotoxic edema both in trauma patients and in experimental TBI, and even in severe TBI patients the cytotoxic edema-related diffusion decrease normalizes by 14 days (Pasco et al, 2007).
CBV Features in the Irreversibly Damaged Lesion and the Perilesional Areas at Risk
In the lesion, we found decreased ΔR2 at 2 weeks after injury. The marked decrease in ΔR2 in this relatively late stage could result from the fact that the contrast agent does not reach/penetrate into the central parts of the lesion any longer, because the irreversibly damaged lesion volume becomes encapsulated by glia and the vascular supply to that region is seized. However, this delayed decrease in ΔR2 could also indicate dramatically reduced circulation in the capillary bed consistent with vasospasm phase seen in humans 4 to 15 days after injury (Martin et al, 1997). The anatomic precontrast MRI data show severely damaged tissue and thereby severely damaged vascular structures in this primary contusion, (bright spots in the maps also suggest possible extravasation in the lesion edges). Further support is provided by the fact that sparse hemorrhages were observed inside the lesion. In the cellular studies, vasculature has found to be damaged and BBB leaking after experimental TBI (Beaumont et al, 2000). Actually, the opening of BBB has been shown to last for days after injury (Onyszchuk et al, 2008). Interestingly, after the acute drop during the first day after injury, ΔR2 seemed to recover to the control level during the first week after injury before the decrease again at final 2 weeks time point. In any case, as the lesion tissue is very severely damaged, heterogenous and hemorrhagic, the clearance of hematomas, seized leaking of BBB, and healing of the possible ruptures in larger vessels must all be considered when drawing conclusions based on intravascular contrast agent.
In the perifocal area, the ΔR2 was decreased acutely after injury and then recovered indicating reestablishment of capillary blood circulation in the perifocal tissue after the acute hypoperfusion effect. Normalized ΔR2 values showed slower trend of recovery than the absolute values. Normalized ΔR2 remained persistently decreased for 4 days after injury before the recovery. There are only few previous studies of the subacute (2 days or more after TBI) hemodynamic changes and they report contradictory findings: laser Doppler flowmetry and orthogonal polarized spectral imaging study reports hyperperfusion at 24 to 48 h in the pericontusional cortical zone of CCI animals (Thomale et al, 2002) and the other studies have not seen changes in CBF 7 days after injury (Kochanek et al, 1995). Cellular studies have shown increasing neutrophils lining the vasculature spreading into the perifocal tissue (Soares et al, 1995) and a loss of endothelial cells demonstrating the damage in the microvasculature (Lin et al, 2001). Angiogenesis-related processes, such as the upregulation of vascular endothelial growth factor and its receptors, have been reported to peak already 4 to 6 days after TBI (Skold et al, 2005). These observed acute-deficiency and recovery process are likely to have a major impact to the survival of the perifocal tissue. Thus, in vivo detecting of the CBV changes reflecting these processes may aid the potential interventions.
In the ipsilateral hippocampus, we found that CBV in capillaries was increased markedly from day 1 after injury onward for 2 weeks. Previous experimental studies of the hemodynamics in the ipsilateral hippocampus after TBI have only reported acute hypoperfusion (Plesnila et al, 2003; Bryan et al, 1995) within the first day after injury or chronic hypoperfusion 1 year after TBI (Kochanek et al, 2002) but not sufficient data about this subacute phase are currently available. The cellular studies have shown neurodegeneration, gliosis, and inflammation in the hippocampus in the corresponding time period after experimental TBI (Soares et al, 1995; Pierce et al, 1998; Kharatishvili et al, 2006). Importantly, our observation of increased ΔR2 could at this stage indicate angiogenesis (Dunn et al, 2004), or higher metabolic demand caused by other plasticity processes, suggesting the usefulness of CBV imaging in monitoring of the recovery processes.
In the contralateral hippocampus, we found a subacute increase in ΔR2 as compared with control animals, which is in line with previous findings of hyperperfusion in the distant brain not affected by delayed cell death (Plesnila et al, 2003). From the day 1 after injury onward the contralateral hippocampus showed increase in ΔR2, which, however, was less pronounced than the simultaneous ipsilateral increase and could indicate either compensatory flow into the uninjured hemisphere or spreading of hemodynamic disturbances from the ipsilateral hippocampus to the contralateral side.
Interrelationship Between the Recovery of Motor Functions and Changes in CBV Values in the Perifocal Area
We found that the relative CBV changes in the perifocal cortical area surrounding the lesion preceded the similar changes in the Neuroscore test performance. The motor function performance is known to drop immediately after injury. In previous studies using corresponding CCI rat model, the impairment of gross and fine motor function (both beam balance and beam walk tests) was found to be virtually as bad or worse during the first day after injury than at day 2 (Kline et al, 2007), (the motor impairment assessed with beam balance during day 1 was 35% which is in line with our findings at day 2). Another report using composite Neuroscore test, but assessing the motor deficit after moderate level lateral fluid percussion TBI, demonstrated a ∼50% drop in perfomance 24 h after injury (Maegele et al, 2005). Therefore, we here assume that also for the animals in this study the performance during the first day after injury is equally bad, or worse, than at day 2. Thus, the performance coinsides with the CBV drop during the first hours and the first day as well. However, the absolute ΔR2 changes do not follow exactly the same path than the normalized changes, and 2 days after injury the absolute CBV in perifocal area was already normal in spite of the massive functional impairment still present. This would suggest that the CBV changes actually precede the changes in the motor performance. However, the data of this study do not allow calculation of direct correlations, and further studies are needed to verify the possible interrelation between perifocal CBV changes and motor function deficits. Two days after injury the motor functions were severely impaired but close to normal CBV values in the perifocal region indicated resolving of the hypoperfusion. At 7 days, CBV showed an increase trend of recovery toward the control level whereas Neuroscore showed progressive recovery of motor functions. This is in line with previous findings in experimental settings (Henninger et al, 2007) and in humans (Soustiel et al, 2005). This observation further elucidates the importance of in vivo detection of hemodynamic changes in perilesional areas, where the subacute recovery of hemodynamics seems to be associated with functional recovery and may serve as a surrogate marker for it.
Methodological Considerations
Both absolute and normalized ΔR2 values were reported thorough the study aiming to eliminate the errors from possible systemic blood pressure alterations and possible contrast agent dose differences, respectively.
The imaging approach using CBV mapping was chosen to achieve sufficient spatial resolution to study the perifocal cortical region and both the hippocampi. In healthy brain tissue, CBF and CBV are tightly coupled (Leenders et al, 1990). However, the interrelation between CBV and CBF may not necessarily hold under pathophysiologic state in the acute phase after injury. Interpretation of decreased CBV as a hypoperfusion immediately after TBI seems reasonable, because the CBV and CBF have been shown to be linked in experimental studies of TBI in acute phase (Prat et al, 1997; Thomale et al, 2002). Furthermore, we observed CBV drop during the first hours after head trauma, at the time when decrease in perfusion (CBF) has been well documented by several research groups (Prat et al, 1997; Thomale et al, 2002; Ginsberg et al, 1997; Bryan et al, 1995). Similarly, we attributed the increased CBV in the hippocampus in subacute phase to increased CBF. Alternative but unlikely explanation could be created based on data from stroke studies showing that increased CBV can be a compensatory response that reduces vascular resistance under conditions of low perfusion pressure preceding the flow decline (Grohn et al, 2000). Furthermore, on interpretation of the results and their physiologic explanation, the presence of edema needs to be accounted for. Diffusion data reveal edematic effects (first increase in intracellular water and later the increase in extracellular water) in the perifocal region and in the ipsilateral hippocampus. Tissue edema can compress microvessels and hence impair perfusion.
Conclusions
This study shows how CBV imaging with intravascular contrast agent is able to detect acute and subacute hemodynamic changes with high spatial resolution in the vulnerable brain regions adjacent to the lesion, which may provide a potential target for developing novel drugs for treatment of TBI. Importantly, these results show a temporal association between hemodynamic disturbances in the perilesional area and the manifestation of sensorymotor disabilities, which may pave way for using imaging of hemodynamic changes as a surrogate marker for functional recovery after TBI.
Footnotes
Acknowledgements
We thank Tiina Konu for technical assistance and Nick Hayward for revising the language of the manuscript.
The data have been collected as a part of contract-based study by Cerebricon Ltd, funded by Solvay Pharmaceuticals.