
Abstract
Functional magnetic resonance imaging (fMRI) techniques are based on the assumption that changes in spike activity are accompanied by modulation in the blood oxygenation level—dependent (BOLD) signal. In addition to conventional increases in BOLD signals, sustained negative BOLD signal changes are occasionally observed and are thought to reflect a decrease in neural activity. In this study, the source of the negative BOLD signal was investigated using T2*-weighted BOLD and cerebral blood volume (CBV) techniques in isoflurane-anesthetized cats. A positive BOLD signal change was observed in the primary visual cortex (area 18) during visual stimulation, while a prolonged negative BOLD change was detected in the adjacent suprasylvian gyrus containing higher-order visual areas. However, in both regions neurons are known to increase spike activity during visual stimulation. The positive and negative BOLD amplitudes obtained at six spatial-frequency stimuli were highly correlated, and negative BOLD percent changes were approximately one third of the postitive changes. Area 18 with positive BOLD signals experienced an increase in CBV, while regions exhibiting the prolonged negative BOLD signal underwent a decrease in CBV. The CBV changes in area 18 were faster than the BOLD signals from the same corresponding region and the CBV changes in the suprasylvian gyrus. The results support the notion that reallocation of cortical blood resources could overcome a local demand for increased cerebral blood flow induced by increased neural activity. The findings of this study imply that caution should be taken when interpreting the negative BOLD signals as a decrease in neuronal activity.
Keywords
Understanding the precise relationship between blood oxygenation level—dependent (BOLD) and spike activity is vital for accurate interpretation of fMRI data. The common observation in functional magnetic resonance imaging (fMRI) studies is the increase in the BOLD MRI signal during increased neural activity, which results from elevated oxygen saturation levels (and reduced paramagnetic deoxyhemoglobin contents) of capillary and venous blood (Ogawa et al., 1990). These positive signal changes may reflect an increase in spike activity that, as measured over many years by single and multiunit electrophysiologic studies, is the basis for the functional organization of the brain. Rees et al. (2000) and Heeger et al. (2000) explored the quantitative relationship between single-neuron spike activity in monkeys and BOLD fMRI in humans in homologous areas, and found that the BOLD fMRI signal is linearly correlated with spike activity. Recently, Logothetis et al. (2001) simultaneously measured BOLD fMRI and multi-unit electrophysiologic signals in monkey V1. Again, a monotonic relationship was observed between the fMRI signal and an increase in spike activity. These studies validated the hypothesis that an increase in spike activity is followed by an increase in cerebral blood flow (CBF) and thus an increase in the fMRI signal.
A less common but important observation in fMRI studies is the prolonged negative BOLD signal change found in some brain regions during stimulation (Allison et al., 2000;Fransson et al., 1999;Huang et al., 1996;Rauch et al., 1998;Smith et al., 2000). The prolonged negative change differs from the early negative BOLD signal (commonly referred to as an “initial dip”), which has a transient negative signal change followed by a positive signal change. The source of the negative BOLD signal change is considered to be an increase in deoxyhemoglobin content during neural activity following a similar biophysical logic used for the positive fMRI signal. However, the actual physiologic mechanism of the reduction in venous oxygenation level is currently unknown. This reduction can be due either to a larger fractional increase in cerebral metabolic rate of oxygen (CMRo2) compared with CBF, or to a larger fractional decrease in CBF compared with CMRo2. More importantly, the prolonged negative signal change has been suggested to reflect inhibition or suppression of neuronal firing patterns (Raichle, 1998). Although experimental confirmation of this assumption is extremely important because of the wide impact on neural interpretation of the negative BOLD signal and, thus, brain function, it has not yet been investigated.
We measured BOLD responses in cat primary and higher-order visual areas during visual stimulation. As expected, an increase in BOLD fMRI signal was observed in the primary visual cortex. However, in neighboring areas containing higher-order visual fields, a signal decrease (negative BOLD) was observed even though the stimulus is known to increase spike activity in these visual areas (Dreher et al., 1993;Dreher et al., 1996;Morley and Vickery, 1997;Tardif et al., 1996;Wimborne and Henry, 1992;Zumbroich and Blakemore, 1987). Additional experiments with contrast agents showed that the positive BOLD signal change is due to increased CBF, while the negative BOLD signal is induced by decreased CBF.
MATERIALS AND METHODS
Animal preparation
A total of 17 cats were studied, including 7 animals for the combined BOLD/CBV measurement and 4 animals for BOLD dependency on the spatial frequency. All animal procedures were performed within the standards of care of the local animal care committee and received institutional review board approval. Cats were prepared as described previously (Duong et al., 2000;Duong et al., 2001;Kim et al., 2000). Briefly, the animals were initially anesthetized intramuscularly with a ketamine (10–25 mg/kg) and xylazine (2.5 mg/kg) cocktail. The animals were intubated and artificially ventilated with isoflurane anesthesia throughout the experiment (1.0–1.3% in a 7:3 N2O:O2 mixture). Body temperature and blood pressure were maintained at normal levels. Physiological variables included Pco2 (28.5 ± 2.5 mm Hg), Po2 (175.8 ± 34.6 mm Hg), and pH (7.43 ± 0.06). To maximize the BOLD signal amplitude, the end-tidal CO2 (ETco2) was maintained at approximately 30 mm Hg (see Discussion). This physiologic condition is considered to be normal in cats (Wei and Kontos, 1982). The animal's eyes were refracted and focused on the stimulus using corrective contact lenses. The animal was placed in a cradle and restrained in normal postural position using a custom-designed stereotaxic frame.
Visual stimulation
For all studies, a binocular 10-second square-wave high-contrast moving grating pattern (0.15 cyc/deg, 2 cyc/sec) of horizontal and vertical orientations was used. This stimulus was optimized to elicit responses from neurons in Brodmann areas (BA) 18 of the cat visual cortex (Movshon et al., 1978), and is known to increase spike activities of neurons in higher-order visual areas (Dreher et al., 1993;Dreher et al., 1996;Morley and Vickery, 1997;Tardif et al., 1996;Wimborne and Henry, 1992;Zumbroich and Blakemore, 1987). For the spatial frequency study, a set of six 10-second square-wave high-contrast moving gratings with spatial frequencies of 0.02, 0.047, 0.1, 0.15, 0.3, and 0.47 cyc/deg (2 cyc/sec) were presented in a pseudorandom fashion. During the control periods, a stationary grating pattern of identical spatial frequency and orientation was presented. A video projector (Resonance Technology, Northridge, CA, U.S.A.; resolution, 640 × 480 pixels) was used to project the visual stimuli onto a screen positioned 15 cm from the animal's eyes. The screen covered approximately 37° of the animal's visual field.
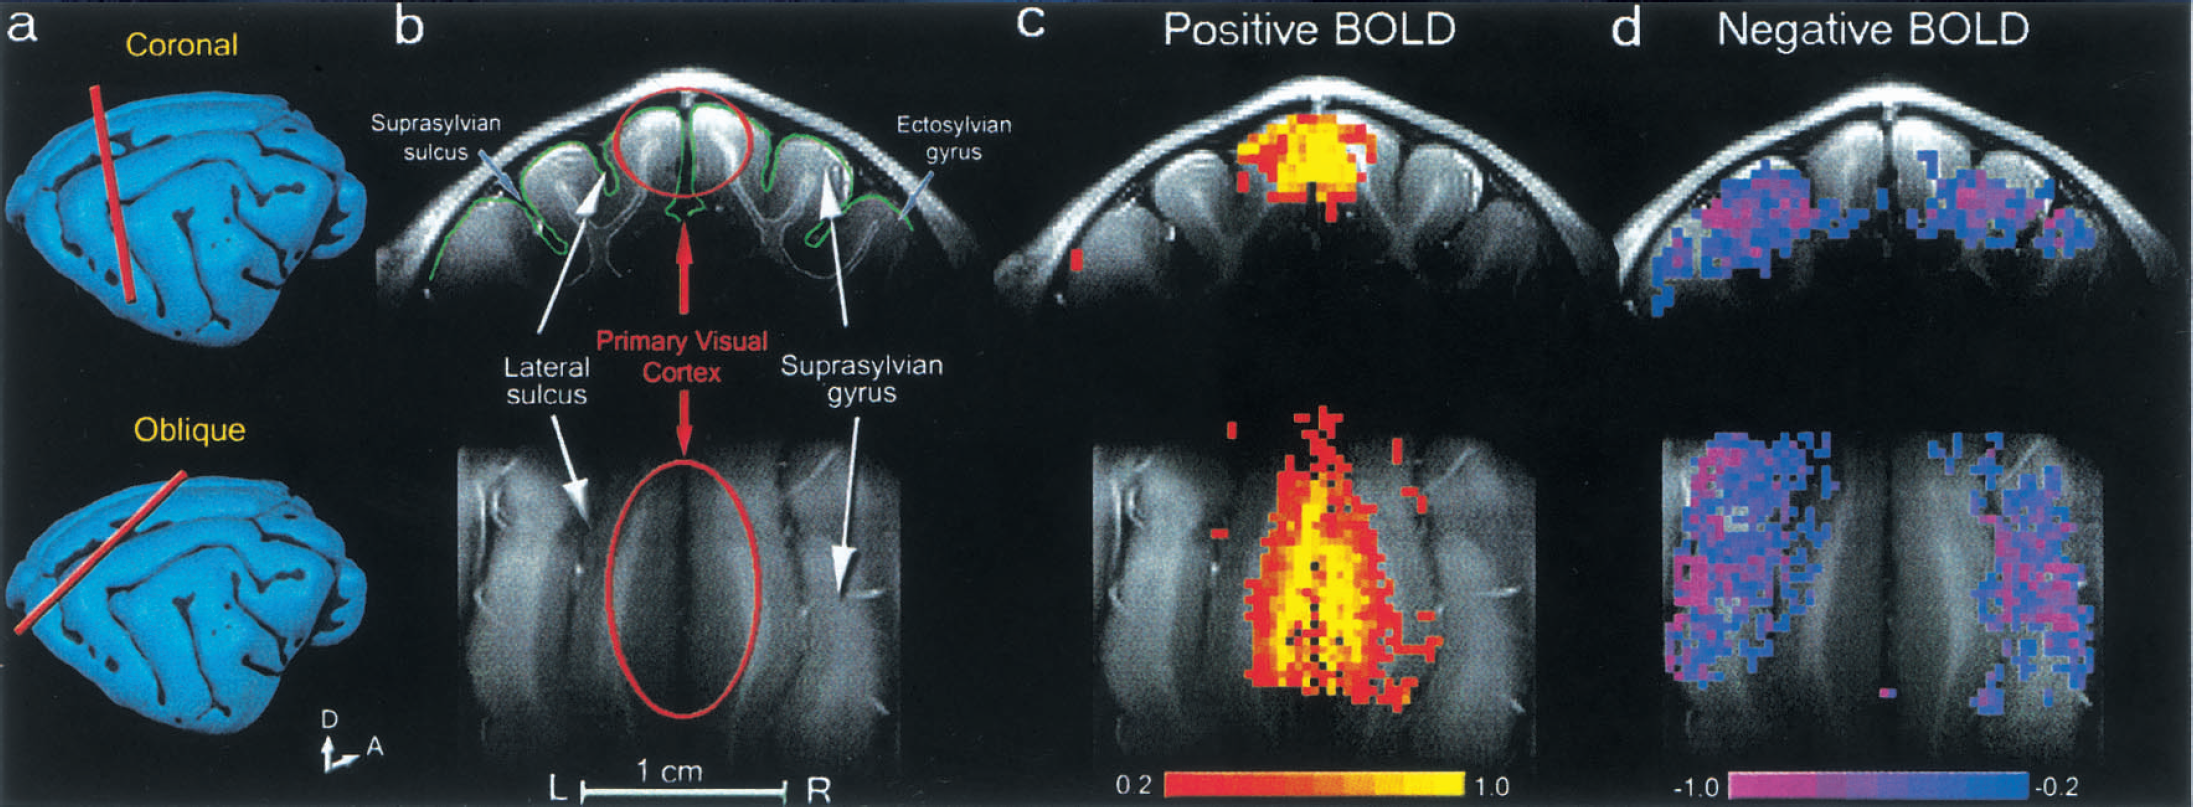
Functional MRI
All fMRI experiments were performed on a 4.7-T, 40-cm bore MR imaging system (Oxford Magnet; console by Varian Inc., Palo Alto, CA, U.S.A.) with a home-built 15-G/cm gradient set. After placing the animal in a cradle, a surface coil (2-cm diameter figure-eight loops) was positioned on top of the animal's head corresponding approximately to Horsley-Clark AP3. Anatomic images were obtained using a TurboFLASH technique (Haase et al., 1986). From these images, two 2-mm thick planes were selected for functional imaging (Fig. 1): an oblique plane parallel to BA 18, and a coronal slice perpendicular to BA 18 (crossing at Horsley-Clark AP2). In all scans T2*-weighted functional MR images were obtained using a gradient-echo single-shot echo-planar imaging technique. The MR parameters used were data matrix (64 × 64), FOV (3 × 3 cm2), slice thickness (2 mm), and TR (0.5 seconds). The flip angle of a radio-frequency pulse was approximately 40 degrees, which maximizes MRI signal intensity in the primary visual cortex in the steady-state condition. At the Ernst flip angle, contribution of inflow effect to T2*-weighted images is minimal (Kim et al., 1994). For CBV-weighted imaging, a bolus injection of a dextran-coated monocrystalline iron oxide nanoparticle (MION) contrast agent (10mg Fe/kg body weight) was administered intravenously. The fMRI images acquired before injection of the MION agent are conventional BOLD-weighted images, while those collected after the MION injection are weighted for CBV changes (Kennan et al., 1998;Mandeville et al., 1998;van Bruggen et al., 1998). The echo time was set to 30 milliseconds for BOLD images and 20 milliseconds for CBV images for signal optimization. For each fMRI measurement, a total of 160 images were acquired (60 images before stimulation, 20 images during stimulation and 80 images after stimulation). Images obtained for the same experimental condition within a single fMRI session were averaged for improvement of the signal-to-noise ratio (SNR).
Positive and negative blood oxygenation level—dependent (BOLD) signals in cat visual cortex.
Data analysis
Spatial smoothing and global scaling were not applied. Active pixels were detected by cross-correlating the functional image time series with an ideal boxcar function that emulated the stimulus protocol (Bandettini et al., 1993) using the Stimulate software (Strupp, 1996). The cross-correlation coefficient was chosen to be greater than 0.2, yielding a confidence interval greater than 95%. A minimum cluster size of four pixels was imposed. A resulting P value with a Bonferroni correction was 0.04 (Forman et al., 1995). Activation maps were overlaid on corresponding anatomical images acquired using the TurboFLASH technique. Two BOLD time courses were generated for each subject by averaging over active pixels within two defined regions of interest (ROI): one encompassing area 18 of both hemispheres, and another including the suprasylvian gyri of both hemispheres. To compare BOLD and CBV time courses, the CBV-weighted time course was generated by using the same pixels used for the BOLD time course, within the corresponding ROIs. Then, the time-to-peak (TTP), onset time (defined as the time to reach 10% of peak amplitude), and peak amplitude were calculated after smoothing the time courses using a cubic spline function (Matlab, Mathworks). Due to poor SNR at the suprasylvian gyrus, the precise onset time of BOLD and CBV changes within this region could not be reliably determined and thus was not included here. All values were reported by means and their standard deviations.
RESULTS
Observations of positive and negative blood oxygenation level—dependent signals
To investigate the characteristics of BOLD signal change in the primary visual cortex and higher-order visual areas, functional images were obtained during stimulation with a moving gratings pattern (0.15 cyc/deg, 2 cyc/sec) that is known to increase spike activity in BA 17 and 18 and in high-order visual areas (Dreher et al., 1993;Dreher et al., 1996;Morley and Vickery, 1997;Movshon et al., 1978;Tardif et al., 1996;Wimborne and Henry, 1992;Zumbroich and Blakemore, 1987). Oblique and/or coronal imaging slices were used in 17 animals to examine the consistency of experimental data. Figure 1 shows BOLD activation maps from one animal, superimposed on coronal (Fig. 1C top, Horsley—Clark AP2) and oblique (bottom row) anatomical images. Anatomical areas were defined according to the criteria of Palmer et al. (1978) and Dreher et al. (1993). In response to the visual stimuli presented, an increase in BOLD signal shown in red/yellow was observed in the primary visual areas, BA 17 and 18 (Fig. 1C). A few active pixels detected outside of the primary visual cortex are located on large draining veins embedded in the sulcus. In contrast, in the surrounding areas, a decrease in BOLD signal was observed, shown in blue/purple (Fig. 1D). Areas with negative BOLD signals include suprasylvian and parts of ectosylvian gyri, which contain BA 21a and 7, the posteromedial lateral suprasylvian (PMLS), and posterolateral lateral suprasylvian (PLLS) areas. Although a few statistically significant pixels (blue) were observed near the primary visual cortex, no negative BOLD signal change was observed within the gray matter area in the primary visual area. Similar patterns of positive and negative BOLD changes were observed in all 17 animals.
Relationship between negative blood oxygenation level—dependent signal and cerebral blood volume change
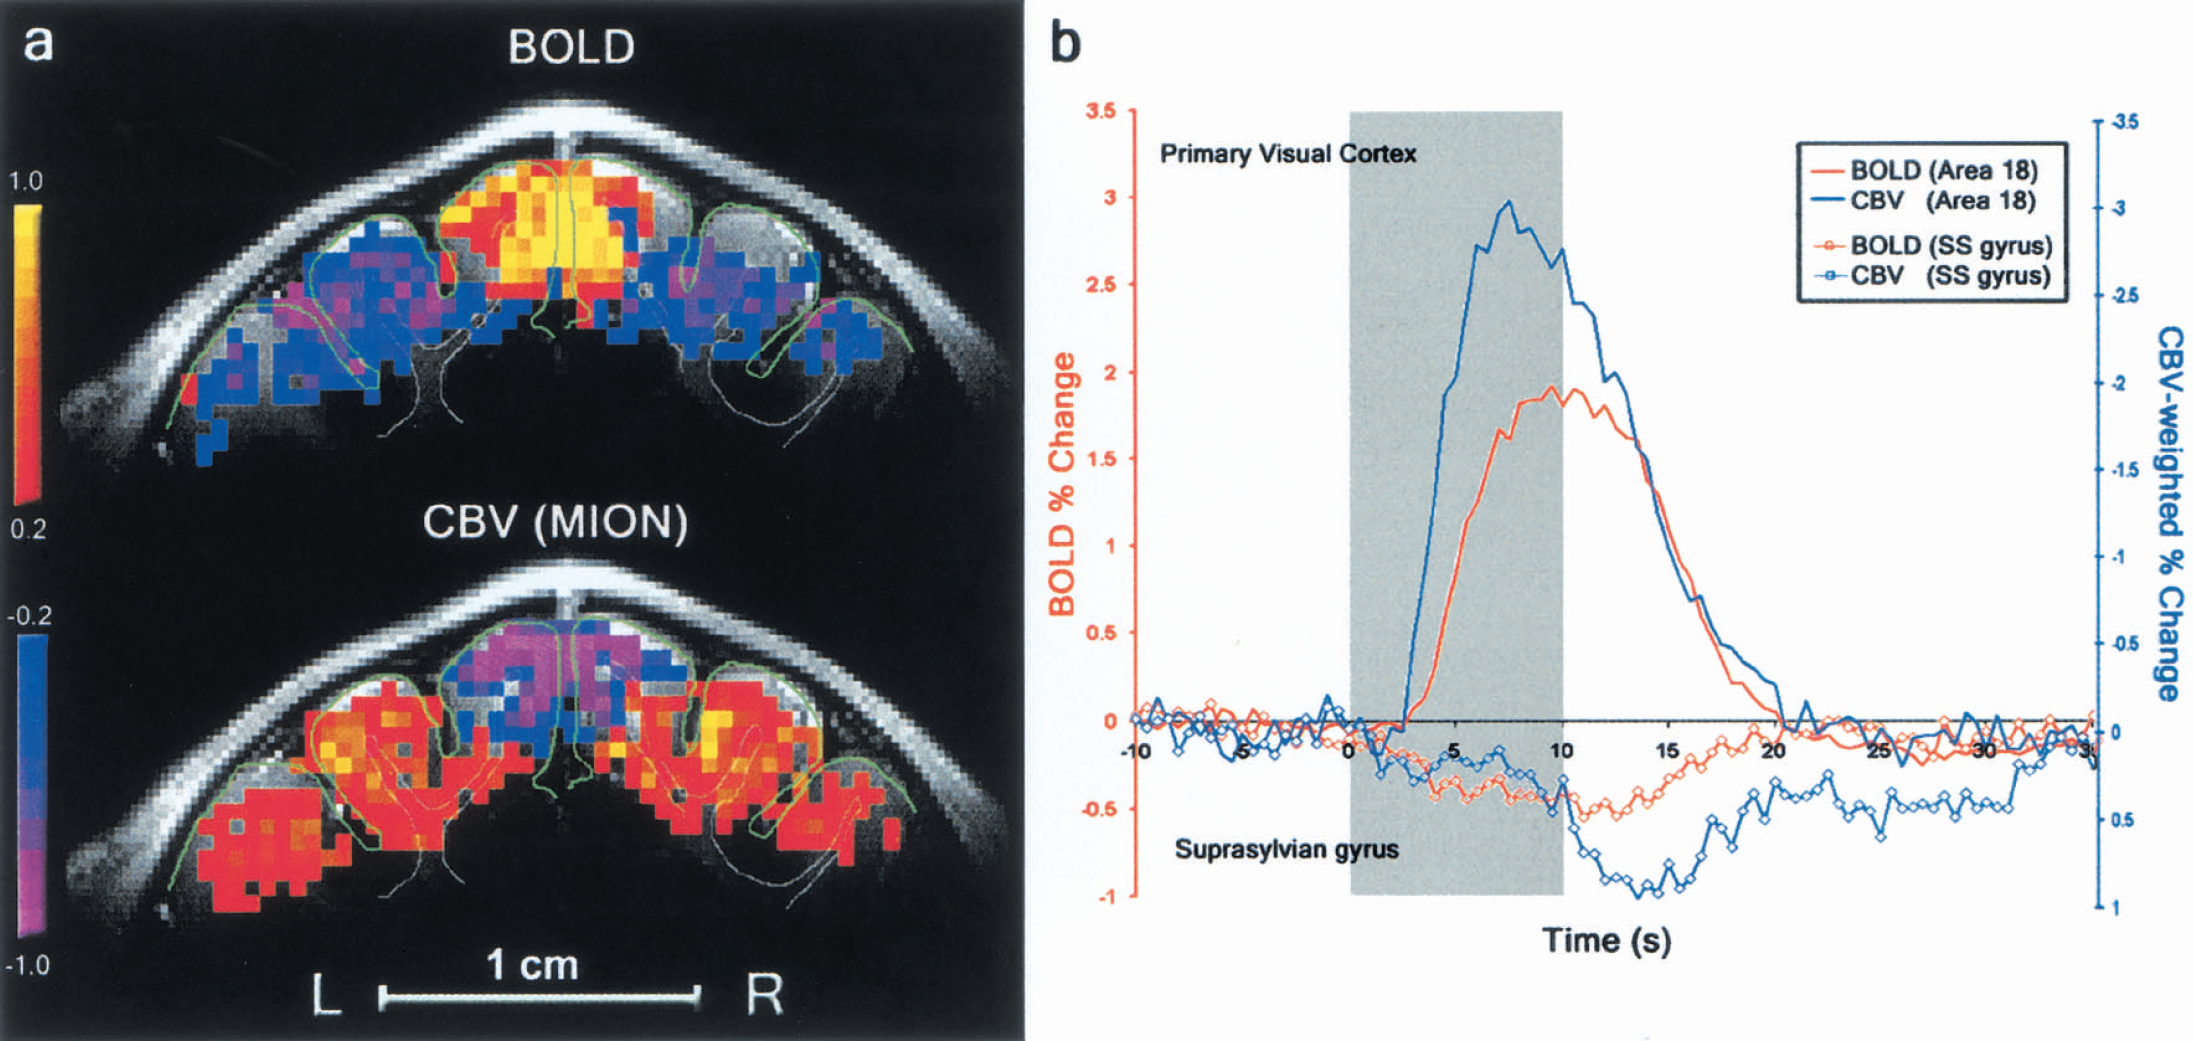
Since the BOLD contrast is dependent on various physiologic parameters including CBF, CBV, and CMRo2, it is important to determine the relationship between negative BOLD and CBV changes. Thus, we measured local changes in regional CBV in seven animals by using MION, an intravascular magnetic resonance contrast agent, which imparts sensitivity to changes in CBV (Kennan et al., 1998;Mandeville et al., 1998;van Bruggen et al., 1998). An increase in the intravoxel amount of MION, which is induced by an increase in CBV, causes a decrease in the T2*-weighted MRI signal. Therefore, negative or positive changes in T2*-weighted MRI signals during neural stimulation following an injection of MION indicate an increase or decrease in CBV, respectively (Kennan et al., 1998;Mandeville et al., 1998;van Bruggen et al., 1998). Figure 2A shows activation maps of BOLD (top) and CBV (bottom) obtained from one representative subject during visual stimulation. The primary visual cortex with the increased BOLD signal exhibits the expected increase in blood volume (negative MRI signal change after MION injection). In adjacent areas where the negative BOLD signal was observed, a decrease in blood volume (positive MRI signal change after MION injection) was detected. These observations were consistent in all seven animals in which BOLD and CBV were measured. Although a slight mismatch between the conventional anatomic and EPI functional images was detected due to spatial distortion in EPI images (i.e., the right suprasylvian gyrus in Fig. 2), it is apparent from the BOLD and CBV activation maps that the highest signal changes were predominantly observed in the gray matter areas (yellow and purple). Due to limited spatial resolution of fMRI, statistically significant signal changes were also detected in the white matter area.
Spatial and temporal characteristics of blood oxygenation level—dependent (BOLD) and cerebral blood volume (CBV) activation maps.
To characterize the hemodynamic responses of the BOLD and the CBV-weighted signals, averaged time courses from the seven animals and quantitative analyses of hemodynamic characteristics are shown in Fig. 2B and Table 1, respectively. The average positive BOLD signal change was 1.9% and reached peak amplitude 9.1 seconds following the stimulus onset (Fig. 2B, red line). The negative BOLD signal amplitude was smaller (−0.5%) and reached peak amplitude 10.8 seconds after stimulus onset (Table 1). Time-to-peak and peak amplitudes remained consistent (no statistical difference) when data from all 17 subjects were considered (see Table 1). Although SNR was greater than 240:1 in a single EPI image, fluctuation of the baseline T2*-weighted MRI signal is a more important parameter for the detection of MRI signal change. Average pixel-by-pixel signal fluctuation (standard deviation divided by its mean) during a control period for an individual fMRI scan was 1.5% ± 0.2% in the primary visual cortex and 3.8% ± 0.8% for the suprasylvian gyrus. These high fluctuations can be due to physiologic motions including cardiac pulsation, cerebrospinal fluid pulsation, and breathing. Therefore, extensive signal averaging was necessary to adequately resolve these small negative BOLD signals, and thus, it is presumably not difficult for these minute negative BOLD changes to go undetected, especially at low magnetic fields.
Onset time, time-to-peak, and peak amplitude of blood oxygen level—dependent and cerebral blood volume-weighted fMRI signal changes in primary visual cortex and suprasylvian gyrus
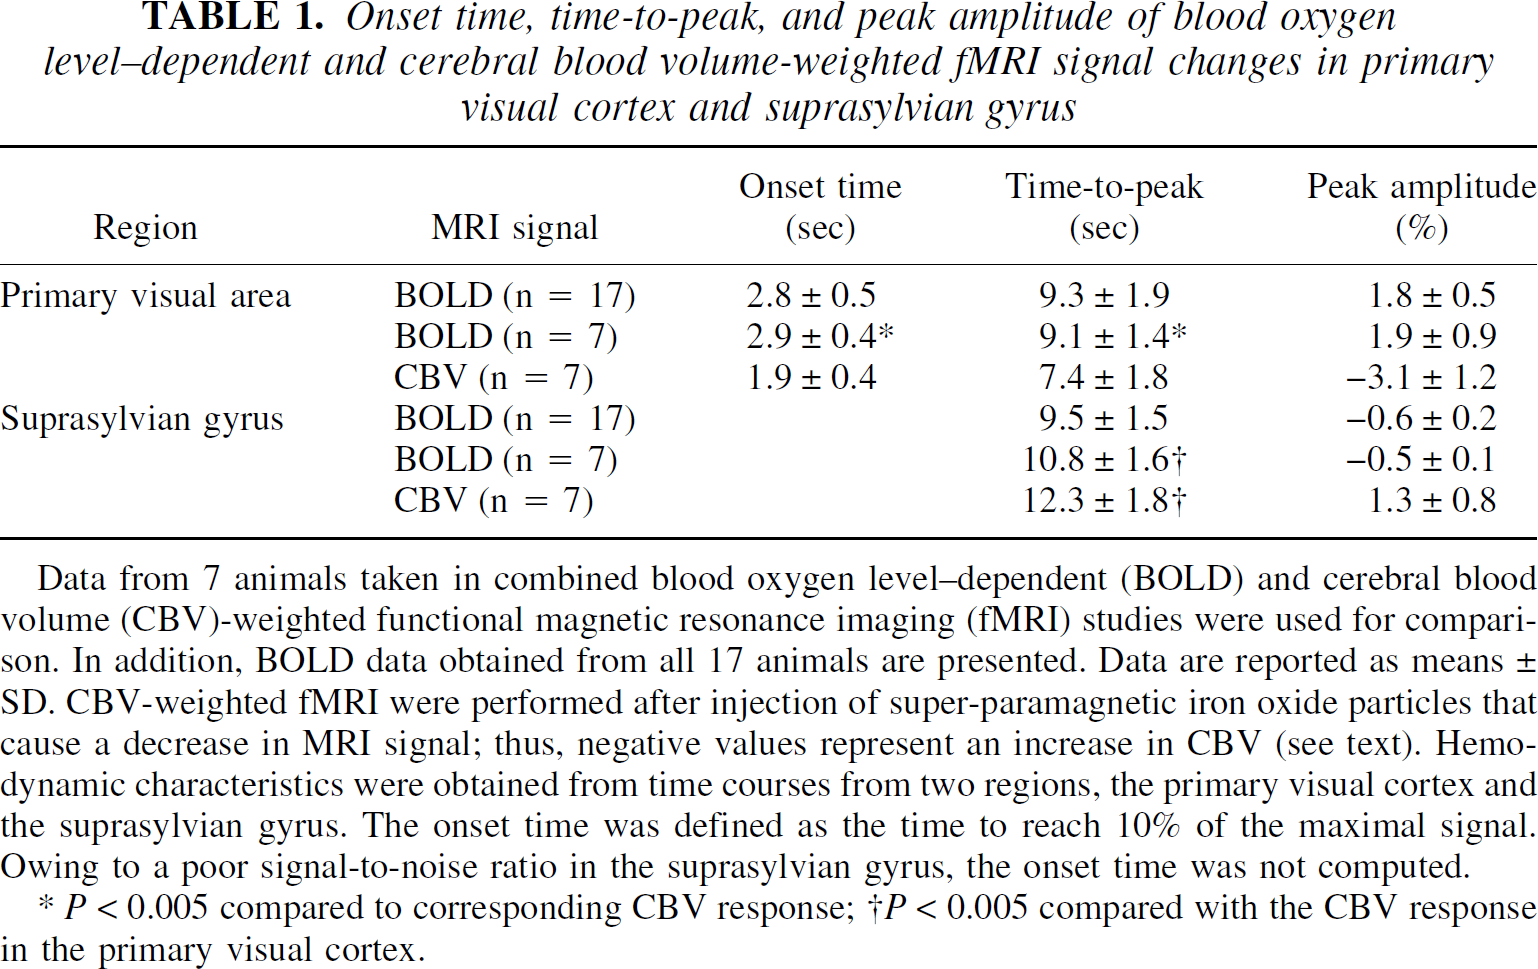
Data from 7 animals taken in combined blood oxygen level—dependent (BOLD) and cerebral blood volume (CBV)-weighted functional magnetic resonance imaging (fMRI) studies were used for comparison. In addition, BOLD data obtained from all 17 animals are presented. Data are reported as means ± SD. CBV-weighted fMRI were performed after injection of super-paramagnetic iron oxide particles that cause a decrease in MRI signal; thus, negative values represent an increase in CBV (see text). Hemo-dynamic characteristics were obtained from time courses from two regions, the primary visual cortex and the suprasylvian gyrus. The onset time was defined as the time to reach 10% of the maximal signal. Owing to a poor signal-to-noise ratio in the suprasylvian gyrus, the onset time was not computed.
P < 0.005 compared to corresponding CBV response;
P < 0.005 compared with the CBV response in the primary visual cortex.
In the CBV-weighted MRI experiments (Fig. 2B; blue lines), the signal amplitude in primary visual areas was −3.1%, while in the suprasylvian gyrus the signal increase was 1.3% (n = 7). The ratio between the two signals was similar to that found in the BOLD experiments (Table 1). However, the CBV signal changes from the primary visual area reached peak amplitude (7.4 seconds) following the stimulus onset, which was significantly faster than the signal changes (12.3 seconds) in the adjacent suprasylvian gyrus (P < 0.001). The onset time of the CBV change in the primary visual cortex (1.9 seconds) was significantly shorter than that of the BOLD signal (2.9 seconds) from the same region (P = 0.001).
Amplitude of the blood oxygenation level—dependent signal as a function of stimulus spatial frequency
Since positive and negative signals were observed in neighboring areas, a question arises whether the amplitude of the negative BOLD signal is related to that of the positive signal. This question was investigated in four animals by using moving gratings of different spatial frequencies (Movshon et al., 1978). Figure 3A shows the tuning curves of the positive and negative BOLD signal responses as a function of stimulus spatial frequency. As the amplitude of the positive BOLD increased, the amplitude of the negative signal increased. Both signals reached peak amplitude for a 0.15-cyc/deg stimulus. A linear correlation between positive and negative BOLD amplitudes was found (y = −0.2× − 0.1;R2 = 0.95) (Fig. 3B).
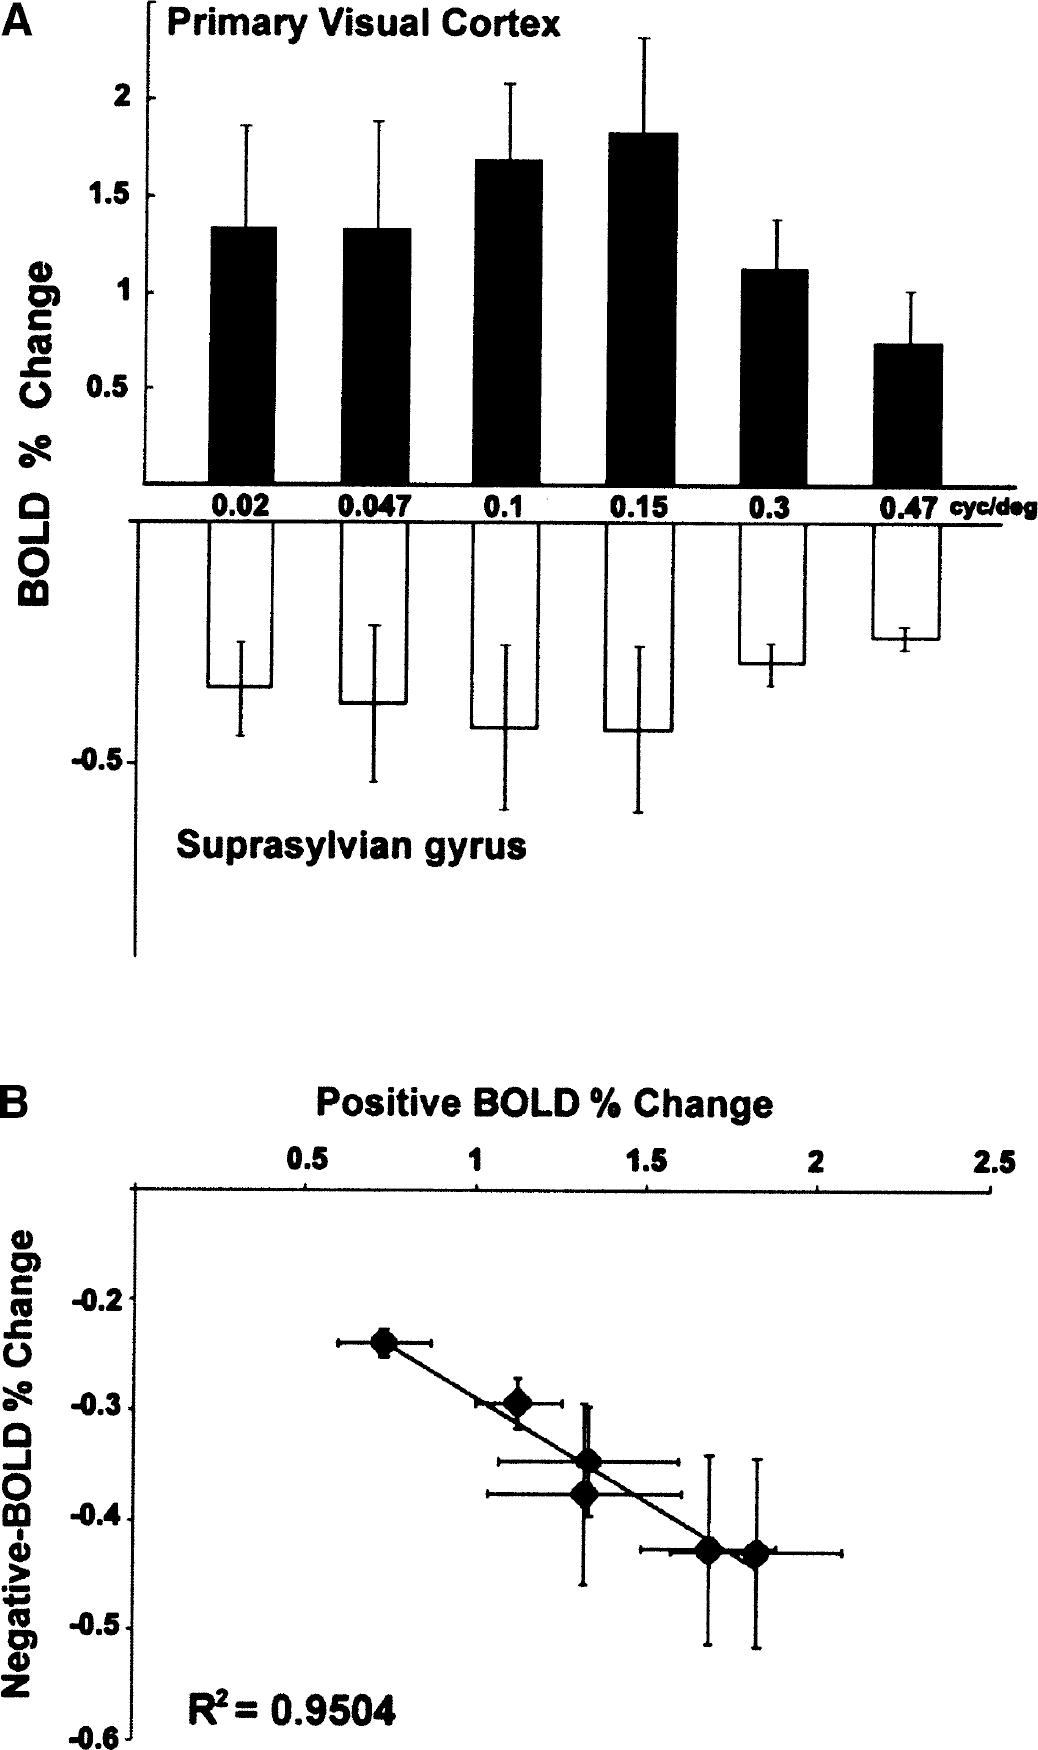
Amplitudes of blood oxygenation level—dependent (BOLD) signals as a function of stimulus spatial frequency.
DISCUSSION
Observation of prolonged negative blood oxygenation level—dependent signals
In a similar animal model, the initial dip—a transient negative BOLD signal change following the onset of stimulus—was previously observed (Duong et al., 2000;Kim et al., 2000). The initial dip is thought to reflect a local increase in oxygen consumption that exceeds the increase in CBF (Malonek et al., 1997;Vanzetta and Grinvald, 1999). However, the initial dip was not consistently observed in this study (Fig. 2B). The major difference between the current and previous studies is the use of different ETco2 levels (approximately 28–30 mm Hg vs. 35–40 mm Hg). Physiologic parameters in the previous studies (Duong et al., 2000;Kim et al., 2000) were optimized to enhance the early dip, while those in the current study were optimized to maximize the BOLD percent change. It has been shown that the dynamics and amplitude of the BOLD signals in humans are strongly affected by the Pco2 levels (Cohen et al., 2002;Kemna and Posse, 2001). There was a linear decrease in the amplitude of the BOLD response to visual stimulation when the ETco2 level in humans was increased, whereas the dynamics of the response became slower (Cohen et al., 2002). Similar findings were also observed in our preliminary study in the cat (Fig. 4). With a Pco2 level of 35 to 40 mm Hg, the initial dip was observed in the primary visual cortex with a sluggish BOLD response. However, with the lower Pco2 level used in this study (30 mm Hg), the dip was not detected and a rapid BOLD response with a higher-magnitude change was observed. This preliminary observation can explain the elusive nature of the initial dip. The exact relationship between ETco2 level and hemodynamic response needs further investigation. With both Pco2 levels, the prolonged negative BOLD was observed in the suprasylvian gyrus (data not shown). Clearly, the prolonged negative BOLD reported in this study and the early negative BOLD response have different anatomical origins and dynamic characteristics.
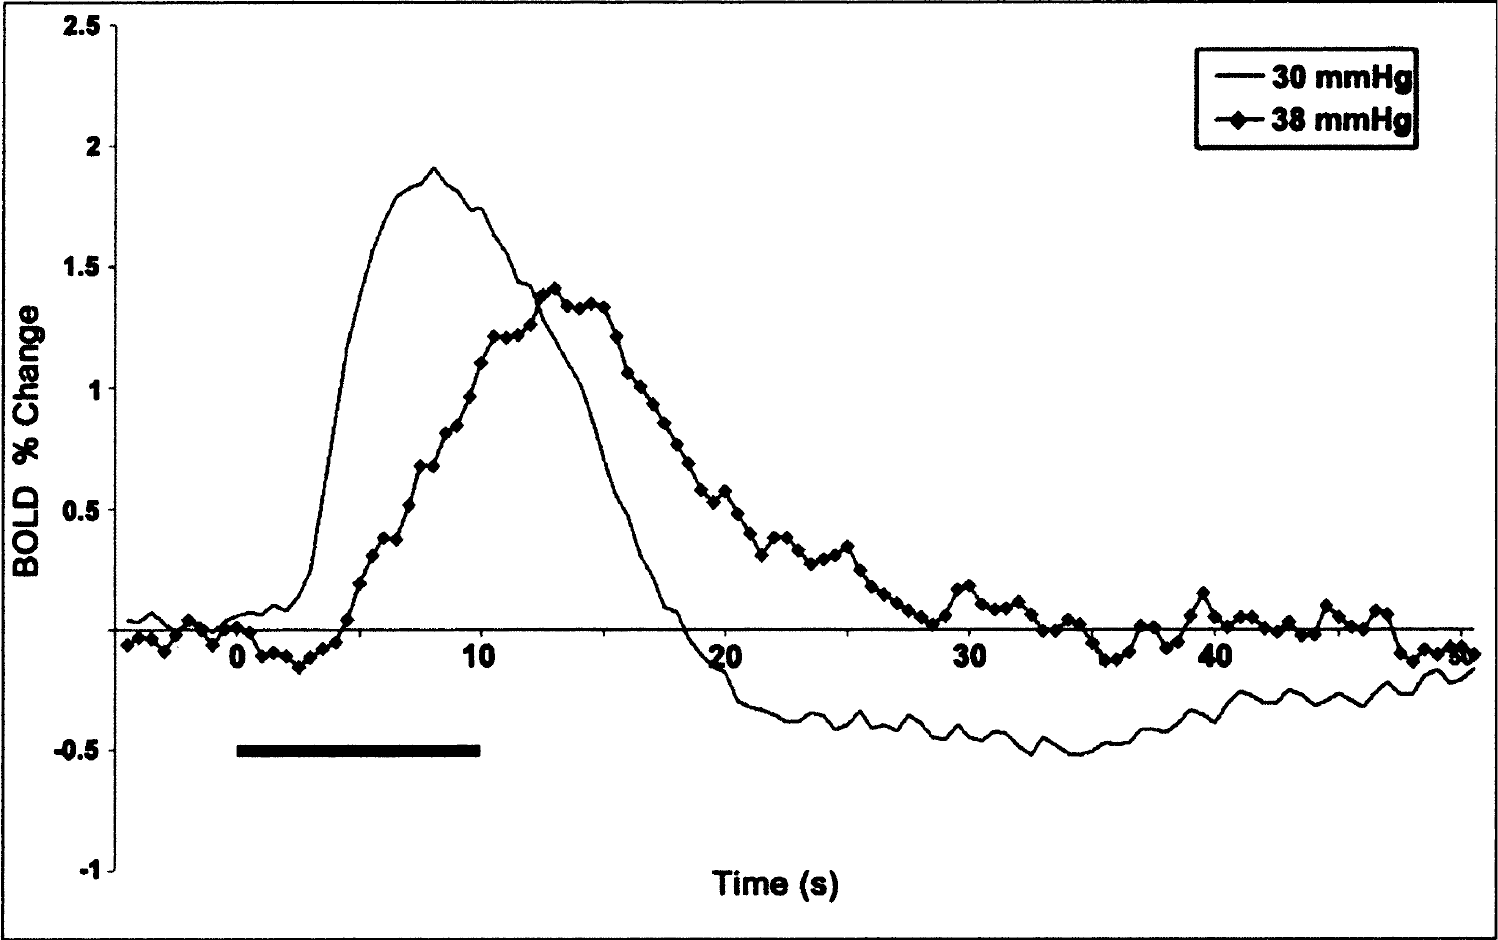
Dependence of blood oxygenation level—dependent (BOLD) signal dynamics on Pco2 levels. To determine dynamic BOLD characteristics at different end-tidal CO2 levels, Pco2 levels were altered between 30 and 38 mm Hg by adjusting the volume and rate of ventilation. The BOLD time courses were obtained from the entire area 18 in a representative animal. Clearly, the time course (solid line) for a Pco2 level of 30 mm Hg exhibits a fast response and high magnitude change, while for a Pco2 level of 38 mm Hg (line with diamonds), a time course from the same region in the same animal has biphasic characteristics with a sluggish response. Bar, 10-sec stimulation period.
In the case of a poor contrast-to-noise ratio, it is possible to falsely observe a negative BOLD signal change due to a low statistical threshold. However, systematic experiments and careful examination of the data have excluded the possibility that the prolonged negative BOLD data originated from MR artifacts, low statistical threshold, or poor SNR. By using intravascular contrast agents, we have demonstrated that areas exhibiting the sustained negative BOLD signal change during stimulation underwent an actual decrease in CBV. Furthermore, the positive and negative BOLD signals were confined to specific anatomical locations as demonstrated by two orthogonal functional images. Thus, the observed decrease in the MR signal is indeed derived from a genuine local physiologic event.
The BOLD contrast is indicative of changes in the local magnetic field induced by deoxyhemoglobin iron (Ogawa et al., 1990). In the conventional positive BOLD signal, an increase in CBF exceeds the increase in CMRo2, resulting in an elevated oxygen saturation level of venous blood and a concomitant decrease in deoxyhemoglobin content. Conversely, a negative BOLD signal should reflect an increase in deoxyhemoglobin contents. This can be achieved by an increase in CMRo2 that exceeds the increase in CBF, or by a decrease in CBF with a CMRo2 increase, no CMRo2 change, or a smaller CMRo2 decrease, if any.
Although we did not measure CBF change directly, measured CBV changes are monotonically correlated to CBF changes (Grubb et al., 1974;Ito et al., 2001;Lee et al., 2001). Therefore, the mechanism of the negative BOLD signal shown here originates from a hemodynamic effect reflecting a decrease in CBF. A decrease in CBF or CBV can be explained by two neurophysiologic mechanisms. The first is due to a reduction or suppression of neuronal activity resulting in decreased CBF, as has been previously suggested (Buckner et al., 2000;Hutchinson et al., 1999;Shulman et al., 1997). The second is a purely hemodynamic “stealing” effect in which blood is diverted or allocated to the most active areas while adjacent areas exhibit a reduced blood flow (Woolsey et al., 1997).
Does the prolonged negative blood oxygenation level—dependent signal reflect a decrease in neuronal activity?
In cats, the primary visual cortex consists of cytoarchitectonic BA 17 and 18, since both areas receive their principal thalamic input from the dorsal lateral geniculate nucleus. These cortical regions exhibit an increase in BOLD signal during moving gratings stimulation. While the tuning curve of the positive BOLD signal in area 18 (Fig. 3) is broader than that reported by electrophysiologic recordings (Fig. 4, Movshon et al., 1978), our fMRI data agree with similar spatial frequency tuning curves obtained using optical imaging (Issa et al., 2000;Shoham et al., 1997). The preferred spatial frequency measured by BOLD fMRI in area 18 is 0.15 cyc/deg, similar to that reported by electrophysiologic recordings (Movshon et al., 1978). This shows that the positive BOLD signal is proportional to spike activity, as previously demonstrated (Heeger et al., 2000;Logothetis et al., 2001;Rees et al., 2000).
Sustained negative BOLD signals were detected in suprasylvian gyrus, corresponding to approximately BA 21a, 7, 5, and PMLS, which are considered extrastriate cortical regions, and partly from the ectosylvian gyrus that contains a broad band of association cortex (Bowman and Olson, 1998). Recent studies have investigated the responses of cells in area 21a and found them to be predominantly binocular with a strong orientation selectivity (Mizobe et al., 1998;Wimborne and Henry, 1992). Also, neurons in area 21a tune to visual gratings with a mean optimum spatial frequency of 0.26 cyc/deg and a median distribution of 0.17 cyc/deg (Morley and Vickery, 1997;Tardif et al., 1996). Furthermore, PMLS neurons were found to resemble cat striate complex cells in their responses to drifting gratings (Zumbroich and Blakemore, 1987).
While the stimulus used in this study may not be optimized for eliciting neuronal responses in higher-order visual areas, these visual areas do exhibit an increase in spike activity to moving gratings (Morley and Vickery, 1997;Zumbroich and Blakemore, 1987;Tardif et al., 1996). However, a decrease in blood flow occurs during the task period in these regions. Based on our experimental data and those of previous spike activity studies (Morley and Vickery, 1997;Tardif et al., 1996;Zumbroich and Blakemore, 1987), the assumption that areas with an increase in spike activity are characterized by an increase in CBF may not hold in all cases. Other factors may contribute, such as the local distribution of flow within the vascular network (Harrison et al., 2002). Thus, the negative BOLD signal change cannot be explained simply by a decrease in spike activity.
All of the previously mentioned electrophysiologic data were obtained by single-unit recordings. Since the investigators were searching for neurons that responded to the specific task, data sampling is somewhat biased and may not necessarily represent the entire population of neural responses. More importantly, increased neuronal firing may not require a substantial CBF increase, and the evoked field potential is more closely related to the CBF response (Mathiesen et al., 1998). Similarly, the BOLD fMRI signal can be more accurately predicted by changes in local field potential than by a direct increase in the firing rates or spike activity per se of individual neurons (Logothetis et al., 2001). Therefore, measurement of local field potentials under our experimental conditions is needed for further elucidation of the neurophysiologic source of the negative BOLD signal.
Hemodynamic effects of the prolonged negative blood oxygenation level—dependent signal
Since the negative BOLD signal is accompanied by a vigorous increase in spike activity in primary visual areas, “stealing” of blood from less active regions into the most CBF-demanding area is an attractive theory (Raichle, 1998). This stealing effect could overwhelm a local demand of an increased CBF induced by an increased neural activity in the high-order visual areas, resulting in an actual decrease in CBF. In the case that the total blood flow remains constant under various conditions (Busija and Heistad, 1984), it is expected that an increase in blood flow in one region would be accompanied by a compensatory decrease in blood flow in other regions. This mechanism, whether actively or passively controlled, can be achieved if blood flow is redirected by constricting one branch of a feeding artery and dilating another, as has been suggested for the barrel cortex of rodents (Woolsey et al., 1996). If an increase of blood flow in one region causes a decrease of blood flow in a neighboring area, it is expected that the latter dynamics will be somewhat slower than the former. While we could not determine the onset time of the signals from the suprasylvian gyrus with high confidence because of poor SNR, a clear delay in the TTP of the decreased CBV relative to the increased CBV was observed. This finding supports the hemodynamic source of the negative BOLD signal.
The CBV response in the primary visual area is faster than the corresponding BOLD response. The discrepancy between the BOLD and CBV data could reflect mechanistic factors. The BOLD signal is the convolution of several components such as CMRo2, CBF, and CBV (Ogawa et al., 1990), while the MION measurement predominantly reflects changes in CBV (Kennan et al., 1998;Mandeville et al., 1998;van Bruggen et al., 1998). Increase in CMRo2 causes a delayed positive BOLD response. Additionally, stimulus-evoked CBV increases have been shown to originate mainly on the arterial side of the circulation, presumably due to active dilation of blood vessels (Lee et al., 2001), whereas the BOLD signal is derived passively from elevated oxygenation saturation levels of blood on the venous side (Ogawa et al., 1990). Our finding of a faster onset time of the CBV signal relative to the BOLD signal can be easily explained by an offset between dynamic arterial and venous hemodynamic changes (Buxton et al., 1998) and by a rapid increase in CMRo2 in the primary visual cortex. Note that our observation is in contrast to previous CBV reports that the BOLD signal precedes the CBV signal by many seconds (TTP > 20 seconds;Mandeville et al., 1998;Palmer et al., 1999). The difference may be due to different species (cat vs. rat), different anesthesia (isoflurane vs. α-chloralose), different stimulation durations (10 seconds vs. >30 seconds), and/or different cortical areas (V1 vs. S1).
Relevance to human blood oxygenation level—dependent fMRI studies
The observation of a decrease in fMRI signals is by no means a novel finding (Raichle, 1998;Raichle et al., 2001). In previous fMRI studies (Allison et al., 2000;Buckner et al., 2000;Huang et al., 1996), negative BOLD regions were located in different cortical lobes, separated by several centimeters in humans. For example, a positive BOLD signal was measured in visual areas while a negative BOLD signal was observed in prefrontal areas (Buckner et al., 2000). Similarly, in mice, a negative BOLD change was observed in areas distant from areas exhibiting a positive change (see Fig. 4 in Huang et al., 1996). However, our observed negative BOLD signals occurred in visual cortical areas adjacent to visual regions that exhibited positive BOLD changes. Therefore, our observation is different from previous reports. It is likely that the negative BOLD signals observed in this study are of a different origin than those previously reported.
Recently, sustained negative BOLD signal changes in human visual areas have been observed that are analogous to our results (Harel et al., 2001;Shmuel et al., 2001;Smith et al., 2000). However, it is not straightforward to compare our anesthetized cat studies with awake human studies. The major difference between our study and the human studies is the use of anesthesia. The isoflurane used in this study can modulate spontaneous activity and reduce evoked responses in visual areas. In anesthetized human studies, a negative BOLD signal change was observed in the primary visual cortex during visual stimulation (Martin et al., 2000), which suggests that anesthesia can modulate the CBF response induced by neural activity. Therefore, our findings in anesthetized animals cannot be readily correlated with results from awake human studies until further neural validation is performed. Nonetheless, negative fMRI signal change observed in the human visual cortex during visual stimulation may be related to the previously described stealing effect and/or to a reduction in neural activity, such as attention or other higher-order cognitive functions (Smith et al., 2000).
CONCLUSIONS
Prolonged negative BOLD signal change was observed in high-order visual cortex, areas that are known to increase spike activities during the task used in this study. The negative BOLD signal reflects a decrease in CBF, which is likely induced by a reallocation of blood flow from the less demanding areas to the most CBF-demanding regions. Thus, caution should be taken when interpreting these negative BOLD signals as a decrease in spike activity.
Footnotes
Acknowledgments
The authors thank C. Iadecola, H. Sherk, B. Payne, F. Zhao, and E. R. Cohen for helpful discussions.