
Abstract
Neuronal loss in the basal forebrain cholinergic structures and frontotemporal hypometabolism are two characteristics of Alzheimer's disease, but their interrelations still are unsettled. We previously reported that unilateral electrolytic lesions of the nucleus basalis of Meynert in baboons were associated with marked but transient cortical hypometabolism. The current study reevaluates this issue using improved methodology. Baboons with unilateral ibotenic acid lesion of all three basal forebrain cholinergic structures (IBO group) were compared with sham-operated animals. The CMRglc was measured with high-resolution coronal positron emission tomography scanning coregistered with magnetic resonance imaging, before surgery and serially between 4 and 72 days afterward. Severe histologic basal forebrain damage and a decrease of more than 50% in cortical choline acetyltransferase activity were found postmortem in the IBO group. Transient and nonspecific hypometabolism was found in the needle track area in both groups. Compared with the sham-operated group, only marginally significant decreases in ipsilateral–contralateral CMRglc ratios were observed in the IBO group, affecting only 1 of 14 neocortical areas investigated (the anterior temporal cortex) at a single postsurgical time (day 14), and the posterior hippocampal region at days 14 and 38. Furthermore, there was no consistently significant correlation between ipsilateral–contralateral CMRglc ratios and cortical choline acetyltransferase activity values in any of the four regions analyzed. These results suggest that cholinergic deafferentation play at best a marginal role in the brain hypometabolism observed in Alzheimer's disease.
Damage to the basal forebrain (BF) cholinergic structures is among the most severe and consistent features of Alzheimer's disease (AD) (for review see Geula and Mesulam, 1994). In AD, neuronal loss affects all three BF structures (Whitehouse et al., 1982; Lehéricy et al., 1993), namely the nucleus basalis of Meynert (NB), the diagonal band of Broca (DB), and the medial septum (MS), resulting in marked reductions in cholinergic markers, such as choline acetyltransferase (ChAT) activity, in their corresponding targets (i.e., the neocortex and amygdala for NB, and the hippocampus for DB and MS) (Davies and Maloney, 1976; Perry et al., 1978). It has been postulated that this cholinergic denervation is largely involved in the clinical symptoms of AD. Both neuronal loss in the BF structures and cortical ChAT activity depletion are significantly correlated with the degree of dementia (Perry et al., 1978; Wilcock et al., 1982; Lehéricy et al., 1993), and treatment by acetylcholinesterase inhibitors is beneficial in some patients with early AD (Gamzu et al., 1990).
Positron emission tomography (PET) studies have shown that the early stages of AD also are characterized by metabolic declines that affect initially the posterior association (parietotemporal and lateral temporal), and, secondarily, the prefrontal neocortices (Frackowiak et al., 1981; Benson et al., 1983; Cutler et al., 1985; Haxby, 1990). Significant, albeit mild, hypometabolism in the parietal association cortex already is present in presymptomatic mutation carriers in familial AD (Kennedy et al., 1995). The mechanisms for this early hypometabolism are unknown. Although it may reflect local neurodegeneration (DeCarli et al., 1992; Mielke et al., 1996), alternatively it may result from cholinergic deafferentation disrupting neocortical synaptic activity (Geaney et al., 1990); indeed, a similar pattern of decline in neocortical ChAT and CMRglc has been argued (Palmer et al., 1988). This is an important issue to resolve, since if the marked cholinergic neuronal loss that exists in AD is able to induce such synaptic dysfunction in the projection areas, then early therapy aiming at restoring cholinergic function or preventing further death of the BF neurons might slow or reverse the pathologic process in the neocortex itself.
Several autoradiographic studies in the rat report significant, although generally transient, declines in neocortical CMRglc after lesioning the nucleus basalis magnocellularis (NBM) (London et al., 1984; Orzi et al., 1988; Soncrant et al., 1992; Ouchi et al., 1996). However, the marked differences in both the neuroanatomical organization of the BF cholinergic cells and the density of intrinsic cholinergic cells within the neocortex between rats and primates would make extrapolation of these findings to the human uncertain. Only two studies, both from our group, have previously investigated this issue in nonhuman primates (Kiyosawa et al., 1989; Yamaguchi et al., 1990). In both, unilateral electrolytic lesions of the NB in young adult baboons were found to induce marked CMRglc declines in the ipsilateral, and, to a lesser extent, contralateral frontal and temporal neocortex, as assessed by sequential PET imaging. This metabolic effect was transient, being maximum in the early days after lesioning, and followed by an exponential and almost full recovery by 3 months. The early metabolic effects were significantly correlated with the severity in ChAT reductions in the neocortical areas found postmortem (i.e., 2 ½ months later), which was taken as strong evidence that the observed neocortical hypometabolism was specific to the cholinergic deafferentation. However, their transient nature, despite enduring ChAT activity depletions, was left unexplained in relation to AD.
In retrospect, these early primate experiments would be criticized in many respects, as follows: (1) the lesion was restricted to the NB, with the DB and MS not being targeted; (2) extra damage or incomplete damage occurred because of the use of a stereotaxic atlas rather than individual magnetic resonance (MR) imaging for the coordinates of the target sites; (3) the damage was necrotic as a result of the electrolysis, and thus, not only the cell bodies but, at variance with what is found in AD, also the fibers passing through the BF were destroyed (in addition, some necrosis along the thick electrode tracks had occurred); (4) the first-generation PET device that was used had a coarse spatial resolution, resulting in serious partial volume effects; and (5) no control group was used, but only a single sham-operated animal that showed milder, albeit still present, metabolic changes, which were discounted as marginal. Because of these limitations, the observed neocortical hypometabolism may have been nonspecific and thereby transient, despite sustained cholinergic denervation.
To reevaluate this issue, we have carried out a new investigation in baboons in which ibotenic acid was targeted to the entire BF cholinergic system using a MR imaging–guided stereotaxic approach (Aigner et al., 1990; Le Mestric et al., 1993). In the current investigation about the mechanisms of brain hypometabolism in AD, ibotenic acid was selected as the only neurotoxin usable in nonhuman primates that induces both significant cortical ChAT depletions and cognitive deficits (Robbins et al., 1989; Markowska et al., 1990), as well as both cholinergic and noncholinergic neuronal loss, as occurs in AD (Wilcock et al., 1982; Rasool et al., 1986). A sham-operated group was used as control, and both the lesioned and sham-operated animals were subjected to serial measurements of CMRglc over 2 to 3 months using high-resolution, coronal PET scanning coregistered with individual MR imaging to ensure adequate imaging of both neocortical and limbic structures. Finally, ChAT activity measurements were obtained postmortem in approximately the same brain areas, and the brain was processed for extensive and detailed histologic analysis.
METHODS
Surgical procedure and magnetic resonance imaging
Nine male Papio anubis baboons (8.5 to 16 kg) were divided into two groups and used in this study: (1) baboons with unilateral ibotenic acid lesion of all three BF cholinergic structures (IBO group, n=6, named IBO1 to IBO6); and (2) a sham-operated group (n = 3, named SHI to SH3). Each baboon underwent a presurgical MR examination for individual stereotaxic localization of the target sites, followed by a unilateral operation and an early postsurgical MR examination to assess the accuracy of lesion emplacement. For both MR imaging and surgery, the head of the baboon was placed in a nonferromagnetic stereotaxic frame with the animal in the sphinx position. Adequate head positioning was controlled by an anteroposterior skull x-ray performed before each procedure. This protocol was approved both by the INSERM Bureau of Animal Experimentation and by the INSERM Neurosciences Board.
Magnetic resonance imaging before surgery
Magnetic resonance imaging was performed under ketamine–xylazine (3.2–0.32 mg/kg/40 min, intramuscularly, respectively), enflurane (0.5% to 1.5%) and N2O:O2 (2:1 v/v), using a GE Signa 1.5 T scanner with a 12.7-cm (5-inch) general-purpose receive-only surface coil, as previously described in detail (Le Mestric et al., 1993). T1-weighted images were obtained in coronal and sagittal planes using the inversion-recovery technique (time of inversion=600 msec, time of echo=25 msec, time of repetition = 2000 msec). Seventeen target sites, aimed at the MS, the DB, and the NB, were determined on the MR images with the help of both anatomical atlases (Riche et al., 1968; Satoh and Fibiger, 1985) and a set of coronal MR images with corresponding histologic preparations of normal baboon brains prepared in our laboratory (unpublished data). Stereotaxic coordinates of the targets then were determined using skull implants as landmarks. In this method, three MR imaging–visible implants, made of small sections of venous catheter filled with a paramagnetic contrast agent, are anchored onto the skull before the MR examination (Le Mestric et al., 1993).
Surgery
The IBO group underwent a right-sided unilateral neurotoxic lesion. Each animal was premedicated with a mixture of ketamine (6 mg/kg, intramuscularly) and xylazine (0.6 mg/kg, intramuscularly), intubated, and then ventilated with isoflurane (0.8% to 1.5%) and N2O:O2 (2:1 v/v) under conditions of muscular relaxation (atracurium 0.75 mg/kg/h, intravenously). Heart rate, arterial pressure, body temperature, and end-tidal CO2 were continuously monitored. A small craniotomy and an opening in the dura above the target area then were performed. Excitotoxic lesions were made by injecting 1 μL of ibotenic acid (12 to 15 μg/μL dissolved in phosphate-buffered saline), at pH 7.4, into each of the 17 predetermined target sites of the BF area using a 10-μL Hamilton syringe fitted with a 30-gauge needle. After each injection, which lasted 2 to 5 minutes, the needle was left in place for 1 minute to prevent back-flow along the needle track. After all injections were completed, the dura was sutured, the skull window was packed with dental cement, and the connective tissue and skin were sutured. An antibiotic (cefamandole 15 mg/kg, intramuscularly) was administered once a day for 3 days, and the baboon was observed daily until total recovery.
The sham-operated baboons underwent the same surgical procedure, except that the needle was lowered either in the lateral ventricle (for the three most medial sites) or 3 mm above the BF sites (for the other targets), and no injection was performed. In doing this, we avoided damaging the BF structures as a result of needle insertion or vehicle injection.
Magnetic resonance imaging after surgery
Two to 10 days after surgery, MR imaging was performed using a T1-weighted three-dimensional volume scan (spoil gradient: time of echo=9 msec, time of repetition=24 msec, flip angle=35°) and a T2-weighted three-dimensional volume scan (steady state free precession: time of echo=50 msec, time of repetition=30 msec, flip angle = 35°) (Le Mestric et al., 1993).
Positron emission tomography procedure
To facilitate imaging of brain areas such as the limbic structures and to reduce partial volume effects, PET scanning was performed in the coronal plane (Le Mestric et al., 1993). The same stereotaxic frame and positioning procedure as that described for the MR imaging and surgical procedures were used. Each baboon underwent one presurgical (baseline) and four sequential postsurgical PET studies, on average, around days 6 (range 5 to 8 days), 14 (12 to 19), 38 (33 to 41), and 72 (66 to 88) after surgery.
The PET scans were performed with the four-ring (seven-slice) LETI TTV03 device (Laboratoire d'Etudes et de Techniques Industrielles) (intrinsic resolution in full-width at half-maximum 5.5 × 5.5 × 9 mm, x, y, z) (Mazoyer et al., 1990) with the baboon under conditions of muscular relaxation and light dissociative anesthesia–analgesia (phencyclidine: 7 μg/kg/min, intravenously; N2O:O2, 2:1 v/v), as in our prior experiments (Kiyosawa et al., 1989; Yamaguchi et al., 1990); the effects of this dissociative regimen on cerebral metabolism have been shown to be negligible (Fitch et al., 1978). The baboon's head was placed in the stereotaxic frame, which ensured excellent intrasubject and intersubject positioning reproducibility, and was positioned in the field-of-view of the PET camera, taking into account two landmarks previously identified on sagittal MR imaging: the posterior edge of the anterior commissure (pAC) and the auditory meatus. Because of our specific interest in deep-seated areas such as the limbic structures and BF, the pAC was placed in the center of the third anterior plane of our PET device using the auditory meatus as an external landmark (Le Mestric et al., 1993). The whole brain was sampled in five coronal planes located from pAC plus 12 mm anteriorly to pAC minus 36 mm posteriorly, which allowed imaging of the neocortex of the four lobes, the hippocampal regions, the thalamus, the BF, the cerebellar hemispheres, and the basal ganglia (Fig. 1 and Fig. 2).
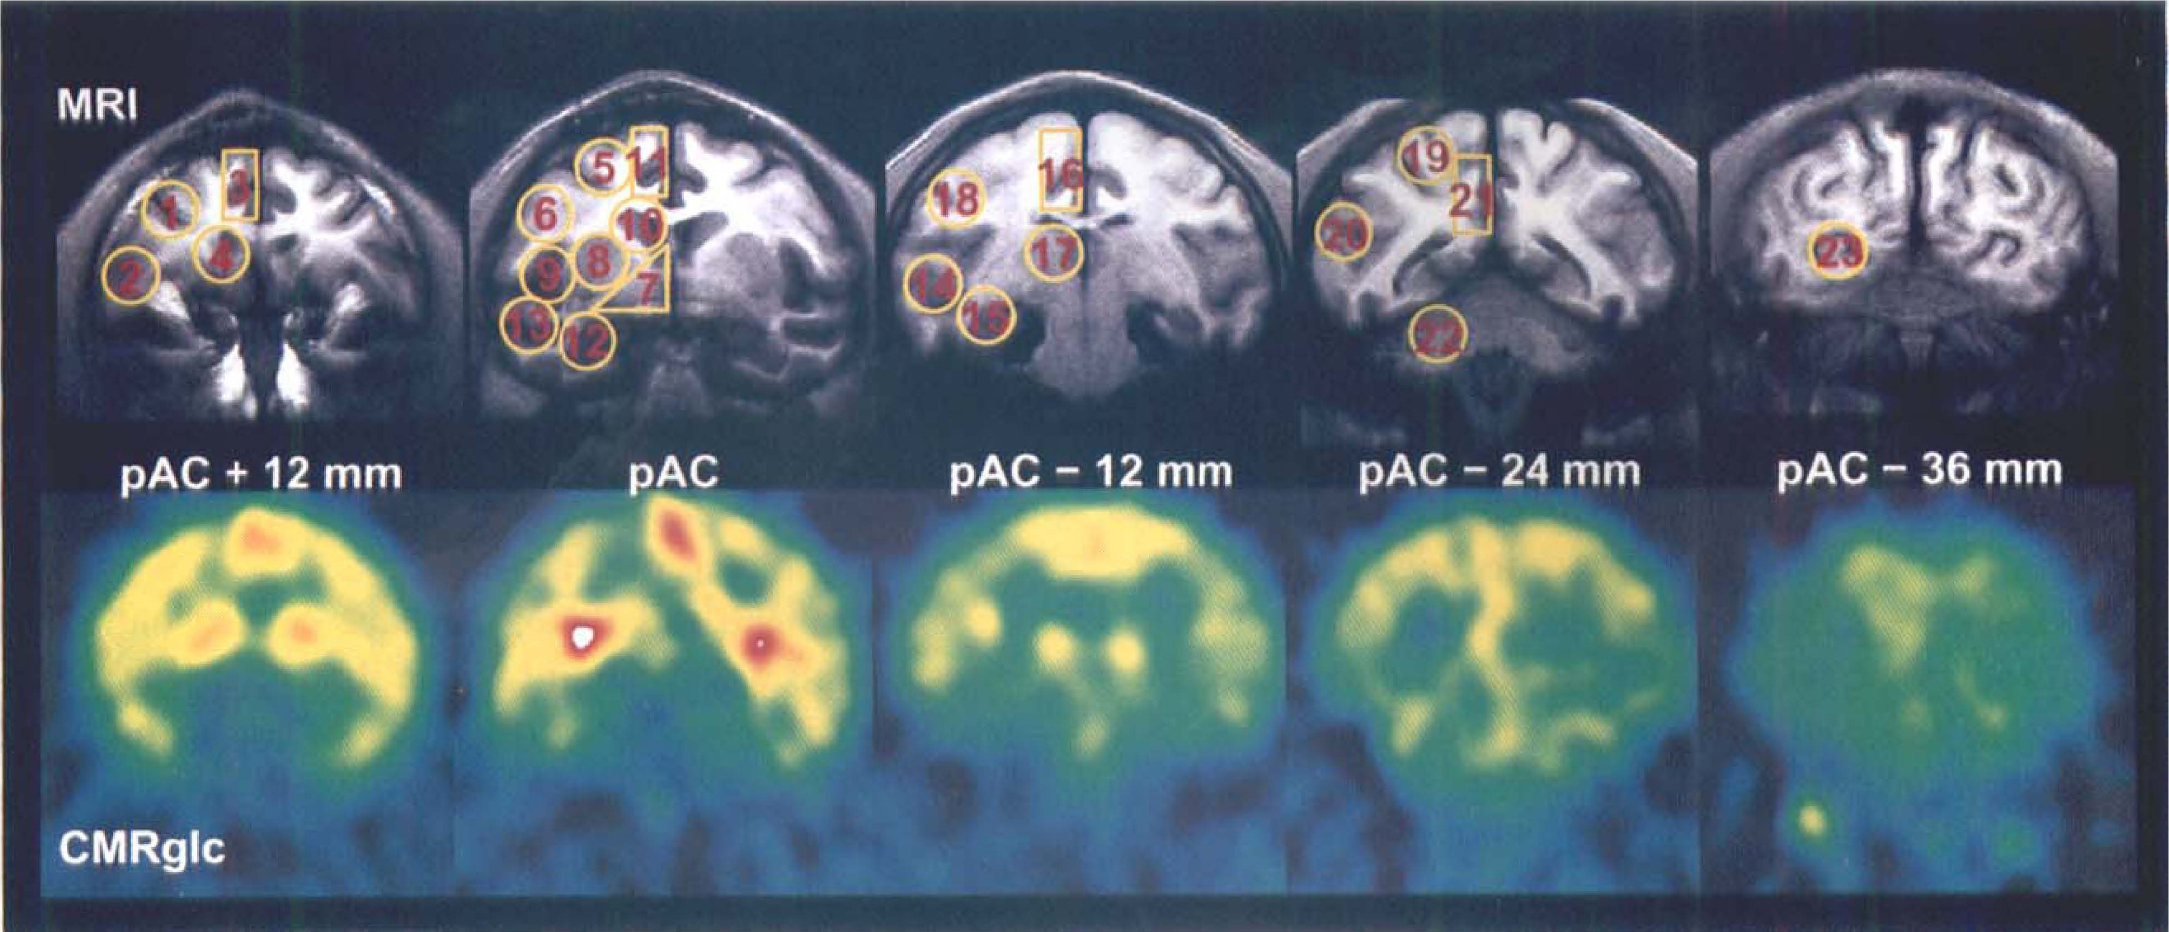
The regions of interest (ROI) used for CMRglc measurements were selected for their metabolic involvement in Alzheimer's disease, their cholinergic implication, and their imageability with our positron emission tomography (PET) device. They were defined on individual coronal magnetic resonance (MR) imaging (top row) and projected onto the coregistered coronal PET images (bottom row). Optimal alignment of MR imaging and PET was ensured at the time of PET data acquisition by means of a specially designed, nonferromagnetic stereotaxic frame (see Methods). The centers of each PET plane relative to the posterior edge of the anterior commissure (pAC) are defined by pAC + 12, pAC, pAC - 12, pAC - 24, and pAC - 36 mm. 1, dorsolateral prefrontal; 2, orbitolateral prefrontal; 3, anterior part of the anterior cingulate; 4, anterior caudate (mainly the anterior part of head of caudate nucleus); 5, premotor; 6, anterior motor; 7, basal forebrain (BF); 8, putamen; 9, insular; 10, posterior caudate (mainly head of caudate nucleus); 11, posterior part of the anterior cingulate; 12, anterior hippocampal (includes the head of hippocampus and parts of amygdaloid complex); 13, anterior temporal (containing superior and inferior temporal cortices); 14, posterior temporal (also containing superior and inferior temporal cortices); 15, posterior hippocampal (includes both the body of hippocampus and part of the parahippocampal cortex); 16, posterior motor; 17, thalamus; 18, inferior parietal (mainly Brodmann's area 7); 19, posterior parietal (including parts of Brodmann's areas 5 and 7); 20, associative occipital; 21, posterior cingulate; 22, cerebellar lobe; 23, primary occipital.
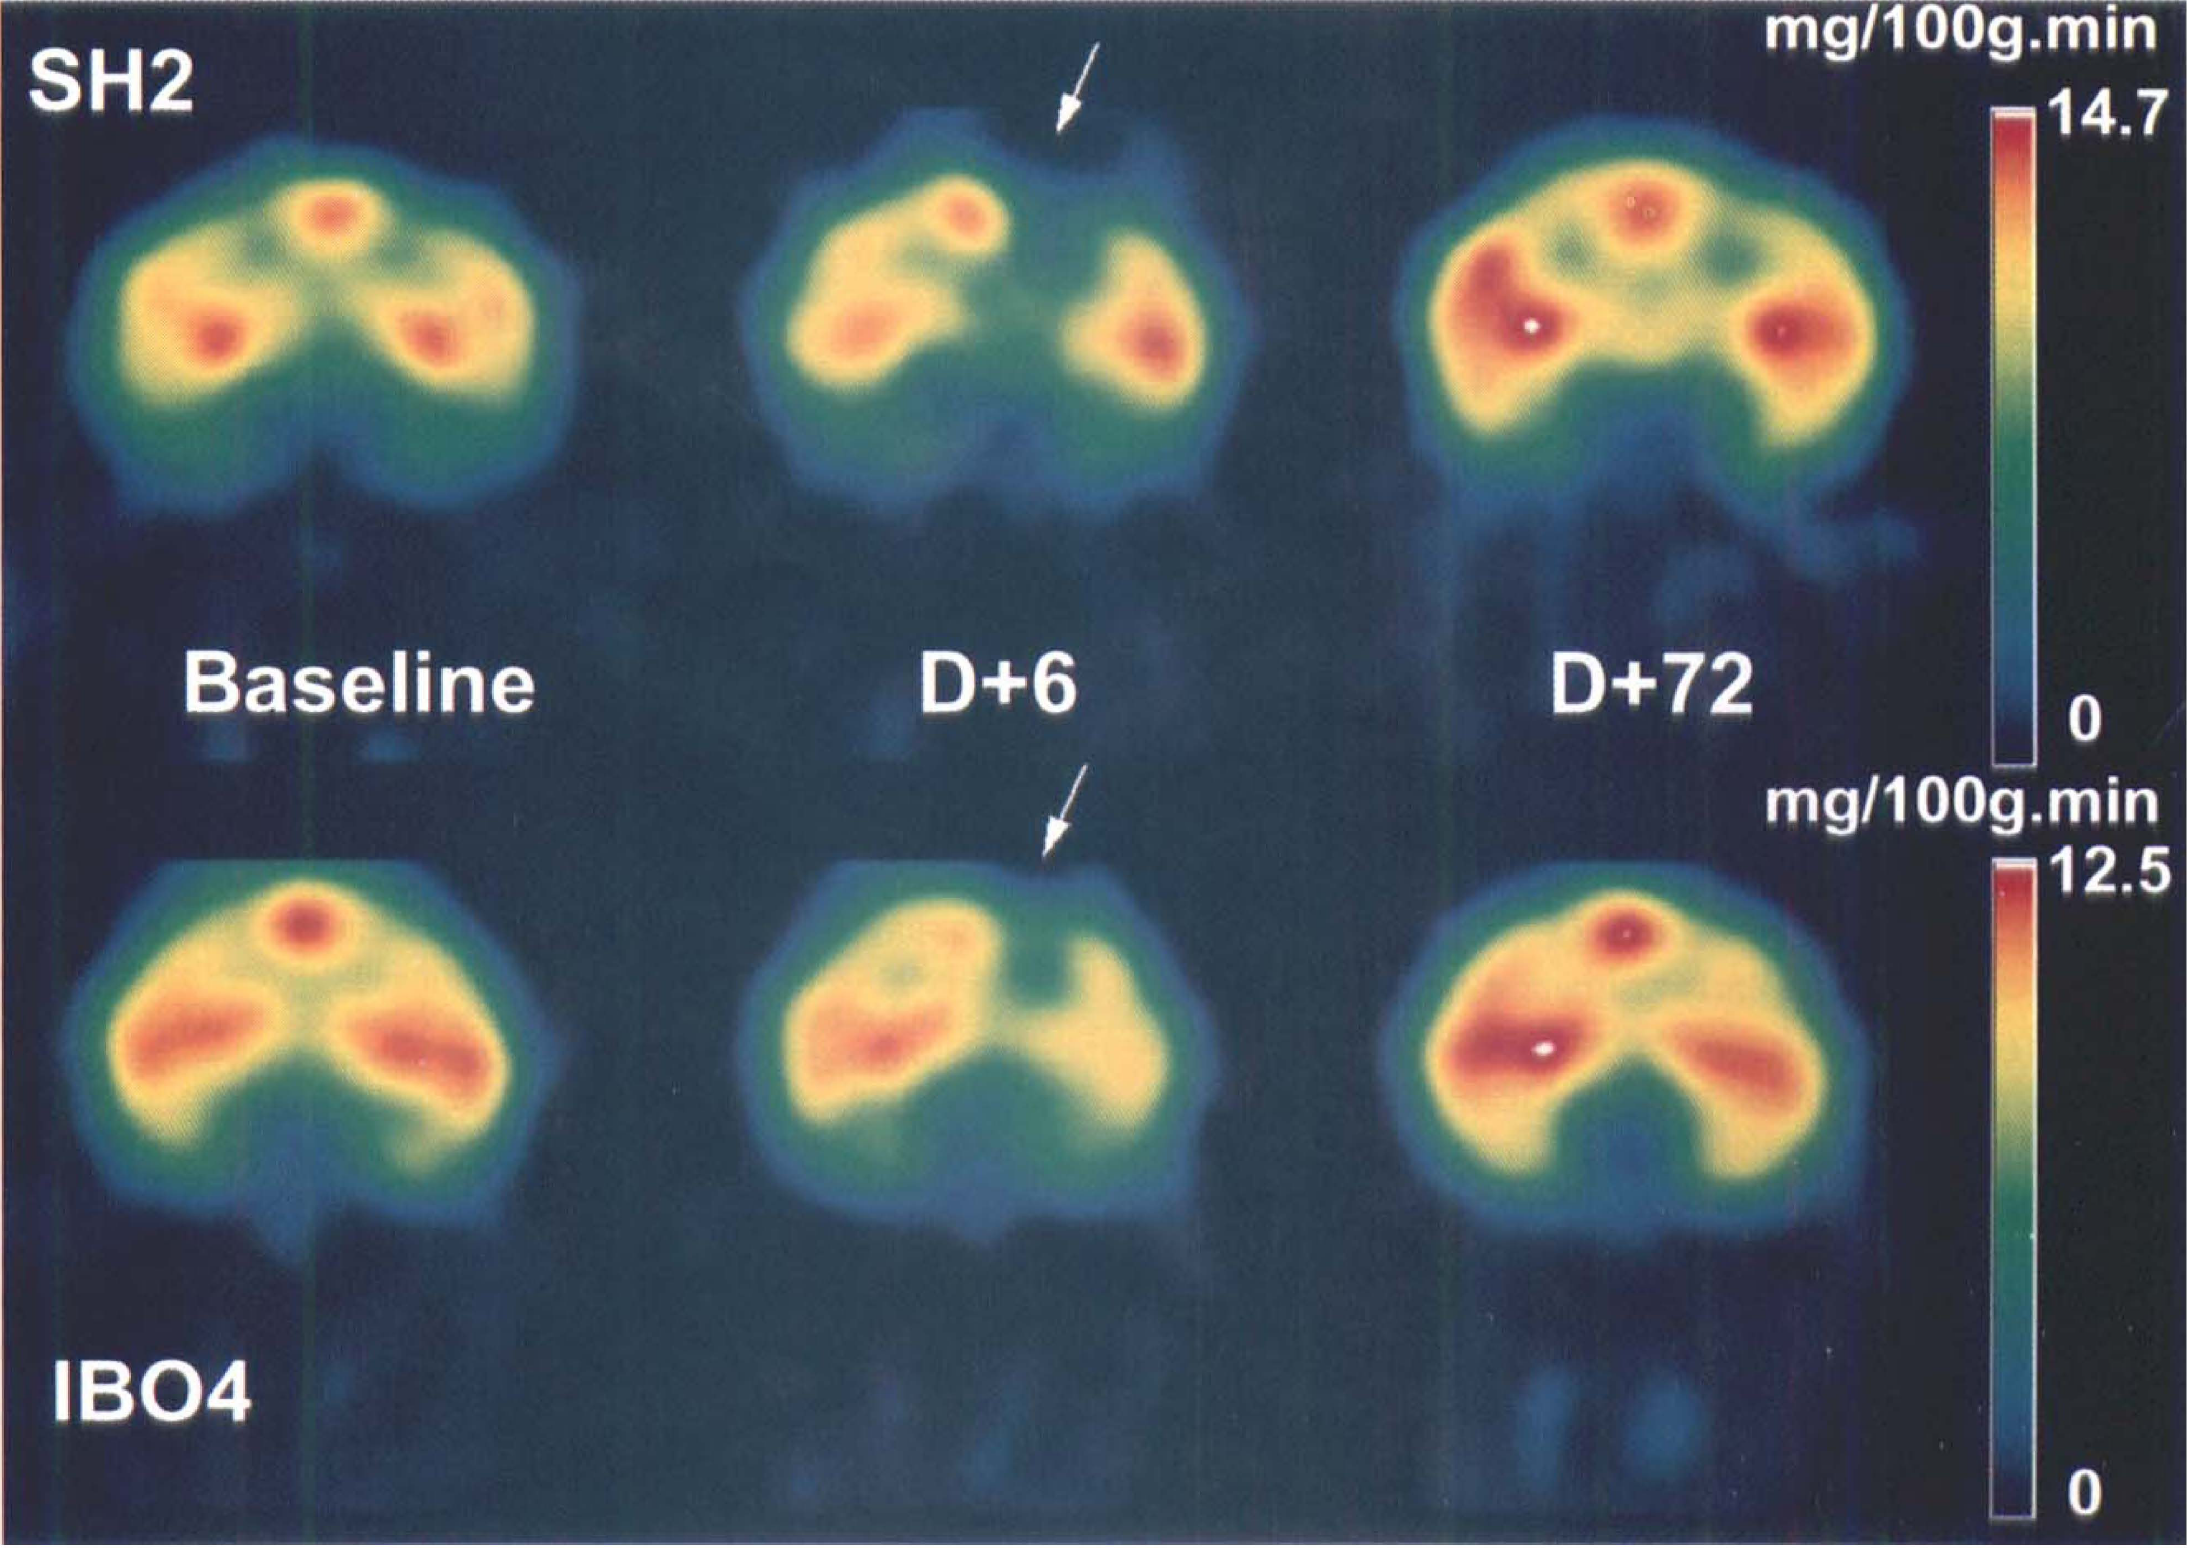
Sequential coronal PET images of CMRglc in the pAC plane after a right-sided basal forebrain lesion compared with a sham-operation. These PET images were obtained before surgery (baseline) and at the first (D + 6) and last (D + 72) postsurgical PET studies in SH2 (top images) and in IBO4 (bottom images) baboons. The pseudocolor scales represent pixel CMRglc values as indicated, with the maximum value being adjusted to the range of each of the two baboons. The pAC plane, which is centered on the posterior edge of the anterior commissure (see Fig. 3 for orientation of this plane, and Fig. 1 for detail of the brain structures imaged), corresponds to the plane through which the needles were inserted. Notice the similar nonspecific effects of the needle tracks at early postsurgical times in both animals, visible as reduced CMRglc relative to the contralateral side (arrows).
After completing a transmission scan with a 68Ga–68Ge source, an intravenous bolus of 1.4 to 3.5 mCi of more than 99% pure 18F-fluoro-2-deoxy-D-glucose, synthesized with the method of Hamacher and others (1986), was injected. During PET data acquisition, which lasted up to 2 hours (see later), 30 sequential arterial blood samples were obtained to determine the plasma 18F time–activity course and the mean plasma glucose content over the first hour. Finally, PET images were reconstructed with the same field of view as that used for MR imaging; a filter was used to smooth the data to an effective resolution of about 6 × 6 × 9 mm.
Parametric images of CMRglc (in mg/100 g·min) were obtained by applying the three-compartment autoradiographic model of Phelps et al. (1979), onto the 50- to 60-minute PET frames, on a pixel-by-pixel basis, using the time course of 18F radioactivity concentration in the arterial plasma from time of injection until 60 minutes, the average plasma glucose content over this interval, a set of “standard” fluoro-2-deoxy-D-glucose rate constants (k*1–4), and a lumped constant. For the latter, which is only a global scaling factor unknown in the baboon, we deliberately used one value widely used in man (i.e., 0.42). As for the rate constants, we used those measured by us in the same species and with the same anesthesia regimen and experimental conditions, from dynamic PET data obtained over 120 minutes after injection (K1* = 0.139, k2* = 0.212, k3* = 0.1, k4* = 0.0097) (Miyazawa et al., 1993). The “in vivo autoradiographic” model has been designed so that the calculation of CMRglc in the 50- to 60-minute interval becomes insensitive to even wide changes in the k*1–4 values within the physiologic range (Huang et al., 1980). Nevertheless, to rule out major changes after the surgical procedure, we have estimated the individual k*1–4 values in six baboons from the current study (three in each group), using our published procedure (Miyazawa et al., 1993), which samples a large temporal region of interest (ROI) from a dynamic 2-hour PET data acquisition. Compared with the standard set of values, there was no significant difference in any of the rate constants for any time point after surgery in either group (data not shown).
Analysis of the positron emission tomography data
A total of 23 ROI per side were determined on the five planes (Fig. 1). To match the shape of the studied structures and thus reduce the partial volume effects, the ROI were either circular (diameter 10 mm), triangular or rectangular, depending on the brain structure. The ROI were defined on the five coregistered coronal MR images with characteristics similar to the five PET slices (thickness 9 mm, interslice 3 mm). The ROI then were projected onto the corresponding CMRglc images for calculation of regional CMRglc, as previously reported (Le Mestric et al., 1993). Both ipsilateral and contralateral raw CMRglc values, as well as ipsilateral–contralateral (I/C) ratios (with ipsilateral being on the side of the lesion), were used.
Postmortem studies
Biochemical assays
After completing the experiment (70 to 91 days after surgery; 33 days for IBO1 because of technical problems), the animal was deeply anesthetized with enflurane (0.5% to 2%) and N2O:O2 (2:1 v/v), and perfused transcardially with cold heparinized saline. The brain then was quickly removed, and nine tissue samples (about 20 mm2 each) were taken in prespecified areas (i.e., anterior cingulate, perirhinal, entorhinal, parahippocampal, posterior parietal, inferior temporal, dorsolateral prefrontal, and orbitofrontal cortices, and hippocampus) in each hemisphere (Fig. 3). These areas were selected both for their potential implication in AD and for their anatomical connections with the BF cholinergic system; among this set, the following five samples were intended to be included within selected PET ROI: the dorsolateral prefrontal, posterior parietal, inferior temporal, and parahippocampal cortices and the hippocampus (see later, data analysis, for the matching between brain samples and ROI). The samples were immediately frozen at -80°C until processed for ChAT activity assay, according to the method of Fonnum (1975). To match CMRglc data, both raw ChAT values and I/C ratios were used.
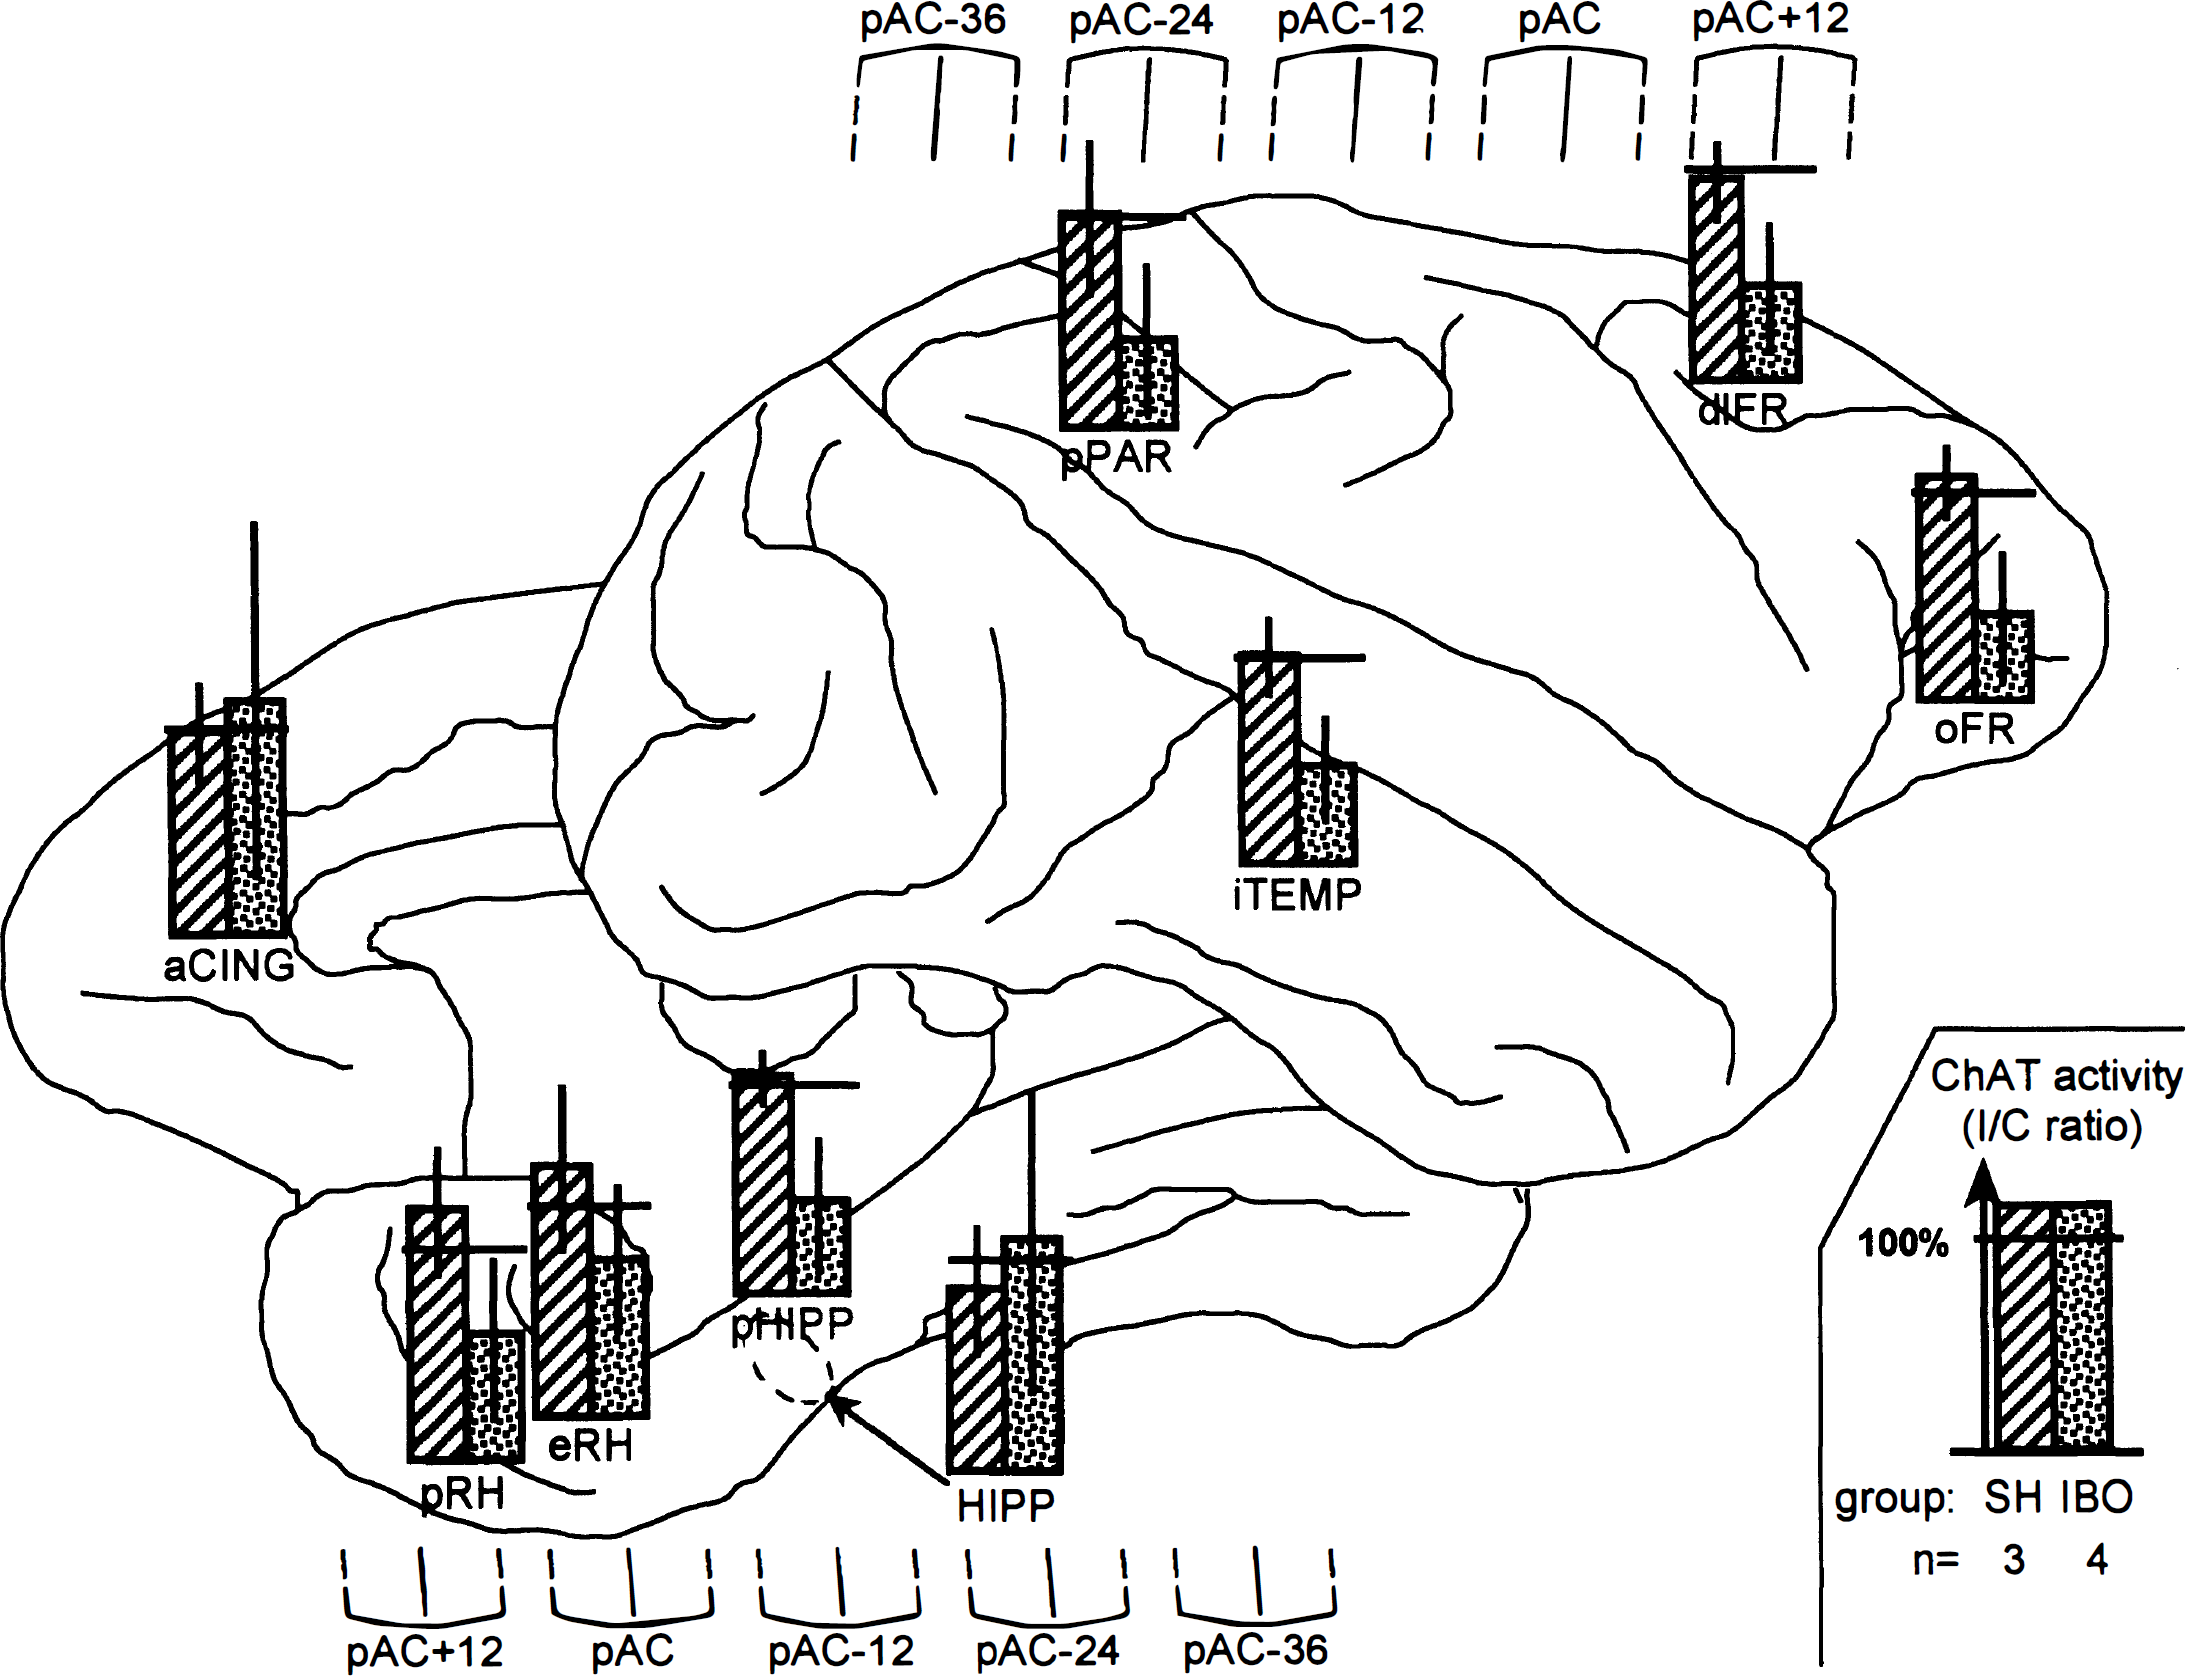
Ipsilateral–contralateral (I/C) choline acetyltransferase (ChAT) activity ratios (mean ± SD) in the sham-operated (SH) and the lesioned (IBO) groups (n=3 and n = 4, respectively). The bar graphs, displayed on a lateral and a medial views of a typical baboon brain, show the mean values of the I/C ChAT activity ratios in each group and each brain area sampled, with vertical and horizontal whiskers depicting the standard deviation and 100% ratio, respectively (see insert on the bottom right). To show the matching between ChAT and PET samples, the location of the five coronal PET planes of interest is displayed above and below the lateral and medial view, respectively (see Fig. 1 for the PET regions of interest). Each PET plane is named in reference to the posterior edge of the anterior commissure (pAC) defined by means of coregistered coronal MR imaging (see Methods), with the distance to pAC expressed in millimeters, and is represented by both its center and its full-width half-maximum boundaries (solid and dashed lines, respectively). aCING, anterior cingulate; pRH, perirhinal cortex; eRH, entorhinal cortex; pHIPP, parahippocampal cortex; HIPP, hippocampus; pPAR, posterior parietal cortex; iTEMP, inferior temporal cortex; dIFR, dorsolateral prefrontal cortex; oFR, orbitofrontal cortex.
Histology
After sampling for biochemistry, the brain was fixed with zinc–formaldehyde solution for 1 week; a coronal block containing the entire BF then was embedded in paraffin and cut in 10- to 20-μm coronal sections, which were stained every 500 μm with cresyl violet, and every 1500 μm with glial fibrillary acidic protein antibody; in addition, a few brain sections were stained with Luxol fast blue/hematoxylin to assess axon integrity. The extent of the lesion was estimated semiquantitatively on each section by consensus of two examiners (C. C. and F. C.), blind to PET and ChAT data, using microscopic examination for evidence of loss of neurons and gliosis. This was done by comparing the lesioned side to both the unlesioned side and sham-operated brains on each section and for each neuronal subdivision of the BF cholinergic structures, based on the anatomical nomenclature of Mesulam and associates (1983). Eight subdivisions thus were considered: MS, vertical and horizontal limbs of the DB (DBv and DBh, respectively), and five subdivisions of NB. The latter subdivisions consisted of two anterior neuronal groups, one medial and one lateral (here named NBam and NBal, respectively), two intermediate groups, one dorsal (NBid) and one ventral (NBiv), and a posterior group (NBp); we used the general terminology of NB rather than Mesulam's Ch4 field terminology, since ChAT immunocytochemical study was not performed and ibotenic acid was deliberately used here to nonselectively destroy both cholinergic and noncholinergic neurons. For a given BF neuronal subdivision, the approximate percentage of neuronal loss was determined as the mean percentage from all sections containing this subdivision, which finally was rounded to the nearest ten.
Data analysis
Group analyses. Statistical analyses were performed on both raw values and I/C ratios of either regional ChAT activity or CMRglc data using one-way analysis of variance (ANOVA) with repeated measures, as follows: concerning the ChAT data, “group” was used as the between factor and “region” as the repeated measure; concerning the metabolic data, the ANOVA were done ROI by ROI, with time as repeated measure. Post hoc analyses testing the group effect were computed with two-tailed t tests.
Correlative analyses. Correlations between damage (expressed as percentage of neuronal loss) in the eight BF subdivisions (defined earlier) on one hand, and either the ChAT or the CMRglc data (ipsilateral values and I/C ratios) on the other hand, were tested for each region using the Pearson test. Correlations between ChAT and CMRglc data were assessed only for the brain regions where both measurements were available, and after taking into account the resolution of the PET device relative to the ChAT sampling procedure (see earlier and Fig. 3). There were four such regions: the dorsolateral prefrontal cortex, the posterior parietal cortex, the temporal cortex (corresponding to the posterior temporal ROI on PET and the inferior temporal sample for ChAT), and the hippocampal region (corresponding to the posterior hippocampal ROI on PET and the average of hippocampal and parahippocampal samples for ChAT). These correlations were carried out region by region on the I/C ratios at each postsurgical time and across all animals (both SH and IBO), using Pearson tests. The use of the I/C ratios assumed that no significant contralateral effect occurred (see Results).
RESULTS
None of the animals showed major or long-lasting postoperative difficulties except IBO5, which showed severe hemiparesis lasting more than 3 days.
Analysis of the lesion
Magnetic resonance imaging
In IBO1 and IBO2, the MR study, performed 9 to 10 days after the lesion, did not reveal brain signal alterations. All subsequent baboons were therefore studied earlier after lesioning (i.e., from D + 2 to D + 5). In IBO4 and IBO6, a clear-cut hypersignal (reflecting edema) was visible on T2-weighted images in the targeted area (Fig. 4); no obvious signal alteration was found on T1-weighted images. In IBO3, the T2 hypersignal affected mainly the striatum. In these three animals, a lesser hypersignal also was observed in the needle tracks area. In IBO5, T2-weighted images were not available but T1 images showed a large hypointense area with patchy hyperintensities in the frontoparietal region, which reflected a subcorticocortical hemorrhage with herniation and loss of cerebral tissue in the needle descent area that occurred during surgery.
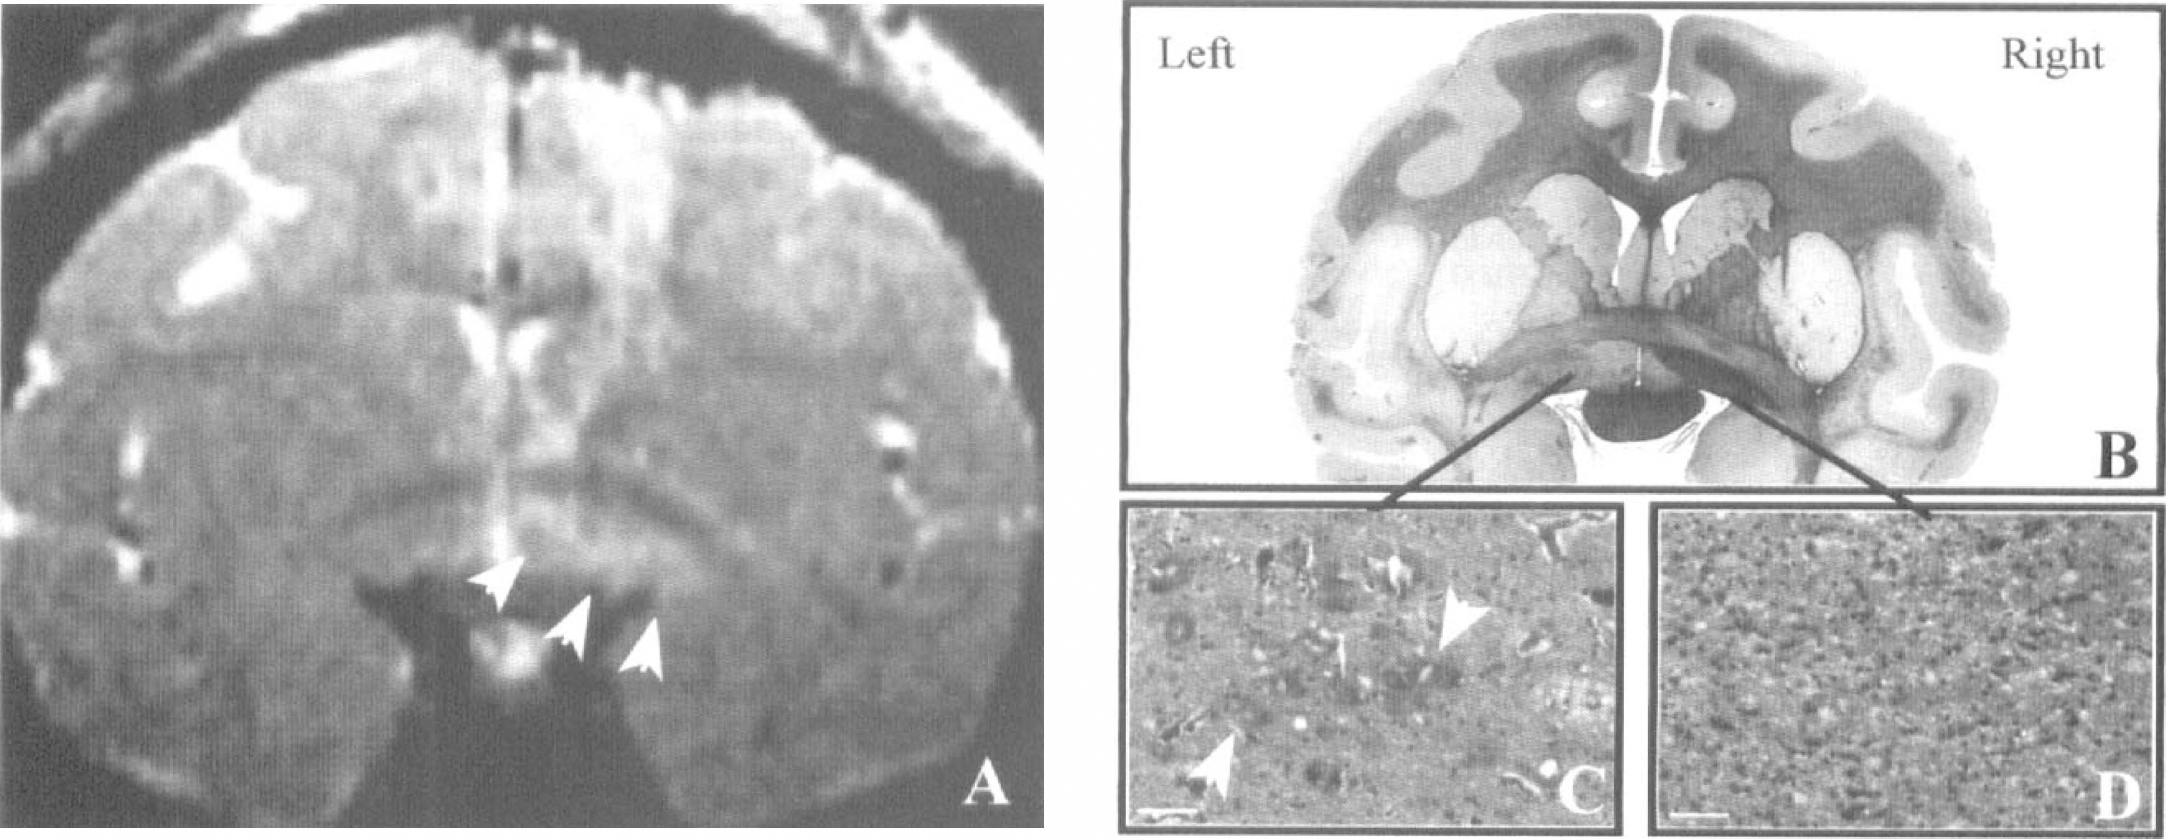
Confirmation of the BF lesion by MR imaging and histologic study. The T2-weighted volume MR scan (
In SH baboons, only a slight increase in signal on the T2-weighted images was observed in the white matter surrounding the needle tracks.
Histologic analysis
In the three SH baboons, the only changes were a few retracted neurons, observed bilaterally in the BF area, the hippocampus, and in the supraoptical and paraventricular hypothalamic nuclei.
Regarding the IBO group, neuronal loss in the BF is shown in Fig. 5 and Table 1. Major extra damage was found in IBO3 and IBO5 (Table 1), consistent with the MR imaging findings (see earlier). In IBO3, the lesion was misplaced in the basal ganglia because of bubbles in the needle resulting in ibotenate back-flow during its retraction, with the targeted structures being largely spared. In IBO5, the latter were accurately and extensively destroyed, but there was a large hematoma in the frontoparietal cortex. These two baboons were therefore excluded from further analyses.
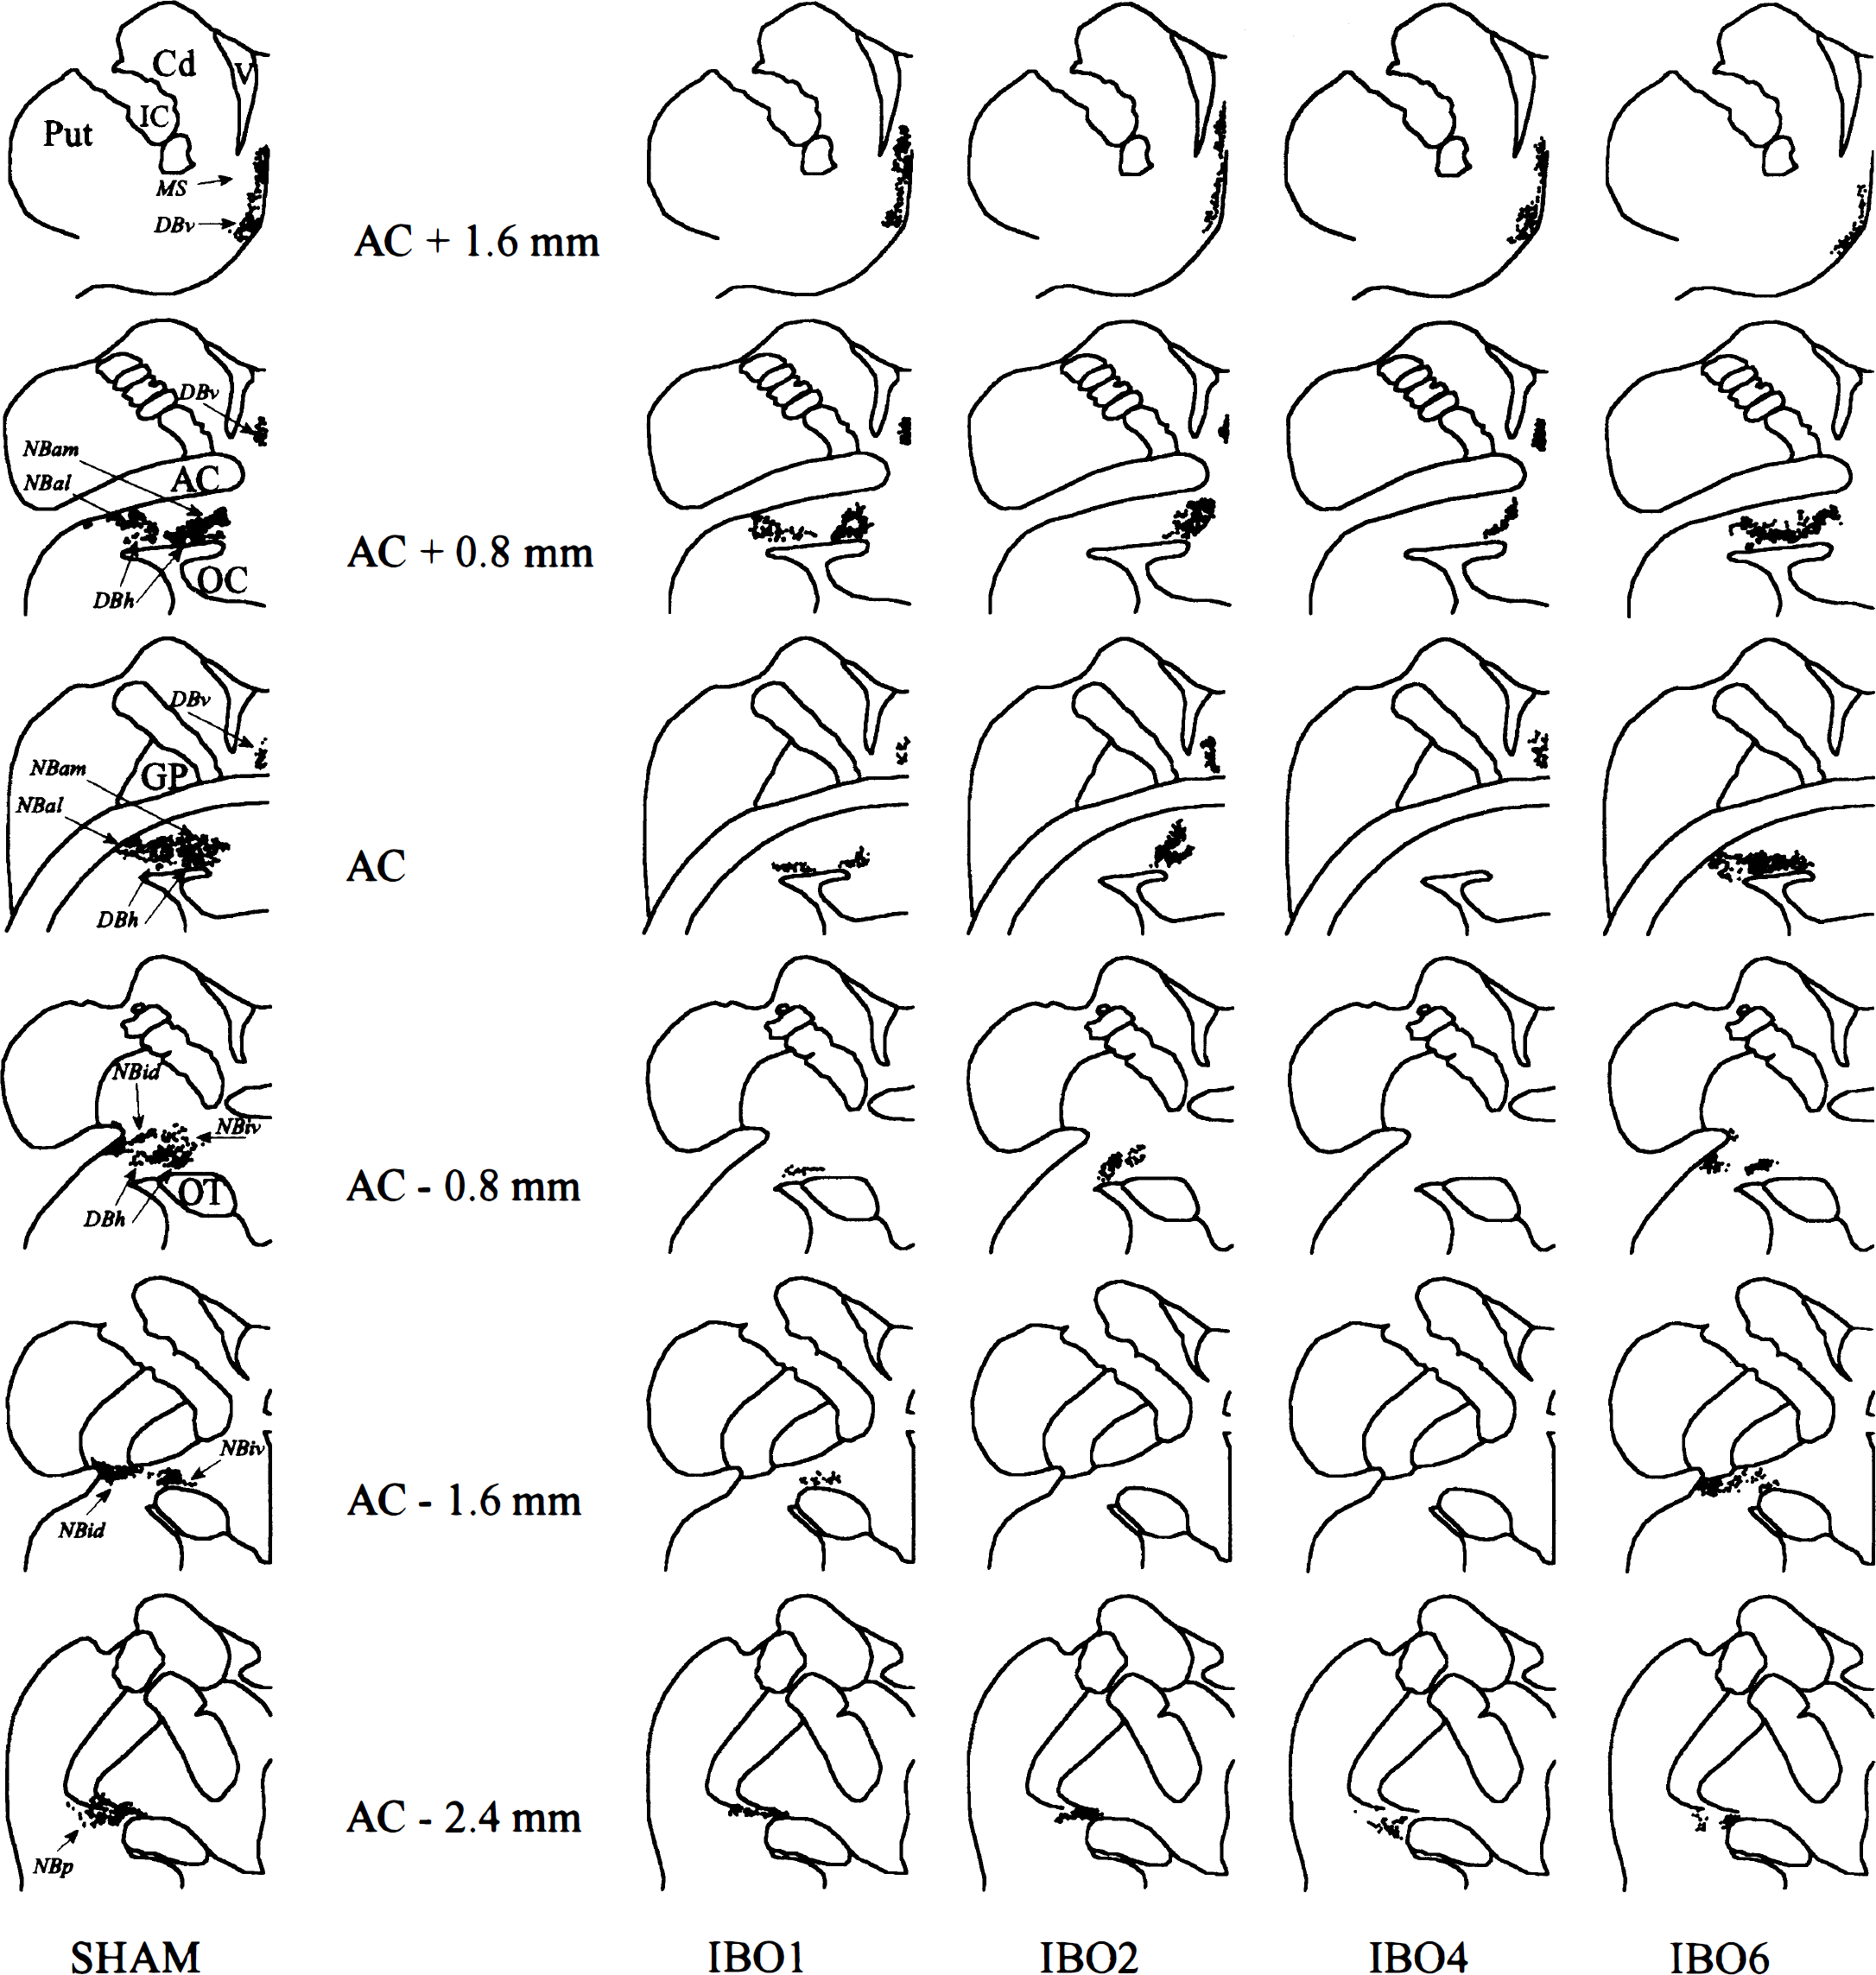
Illustration of the neuronal loss at six coronal levels in each of the four IBO baboons compared with a typical sham-operated animal. The magnocellular neurons of the BF area were plotted on a set of brain section drawings for each animal using a camera lucida; from this set, six representative sections were selected and normalized to match six standard anatomical sections of the BF area drawn from a sham-operated Papio anubis baboon. According to this representation, the more severe the lesion, the fewer the dots. The sections are about 0.8 mm apart, the most anterior section is at the top, and their position is located in reference to the anterior commissure (AC) on histologic slices. The eight subdivisions used for the BF area (see Methods) are shown on the standard brain sections. MS, medial septum; DBv, vertical limb of diagonal band of Broca; DBh, horizontal limb of diagonal band of Broca; NBam, NBal, NBid, NBiv, NBp: nucleus basalis of Meynert anteromedial, anterolateral, intermediate dorsal and ventral, and posterior parts, respectively (Mesulam et al., 1983); AC, anterior commissure; Put, putamen; Cd, caudate; GP, globus pallidus; IC, internal capsule; OC, optic chiasm; OT, optic tract; V, lateral ventricle.
Neuronal loss (%) in the basal forebrain cell groups, and other major histologic damage, in the lesioned baboons
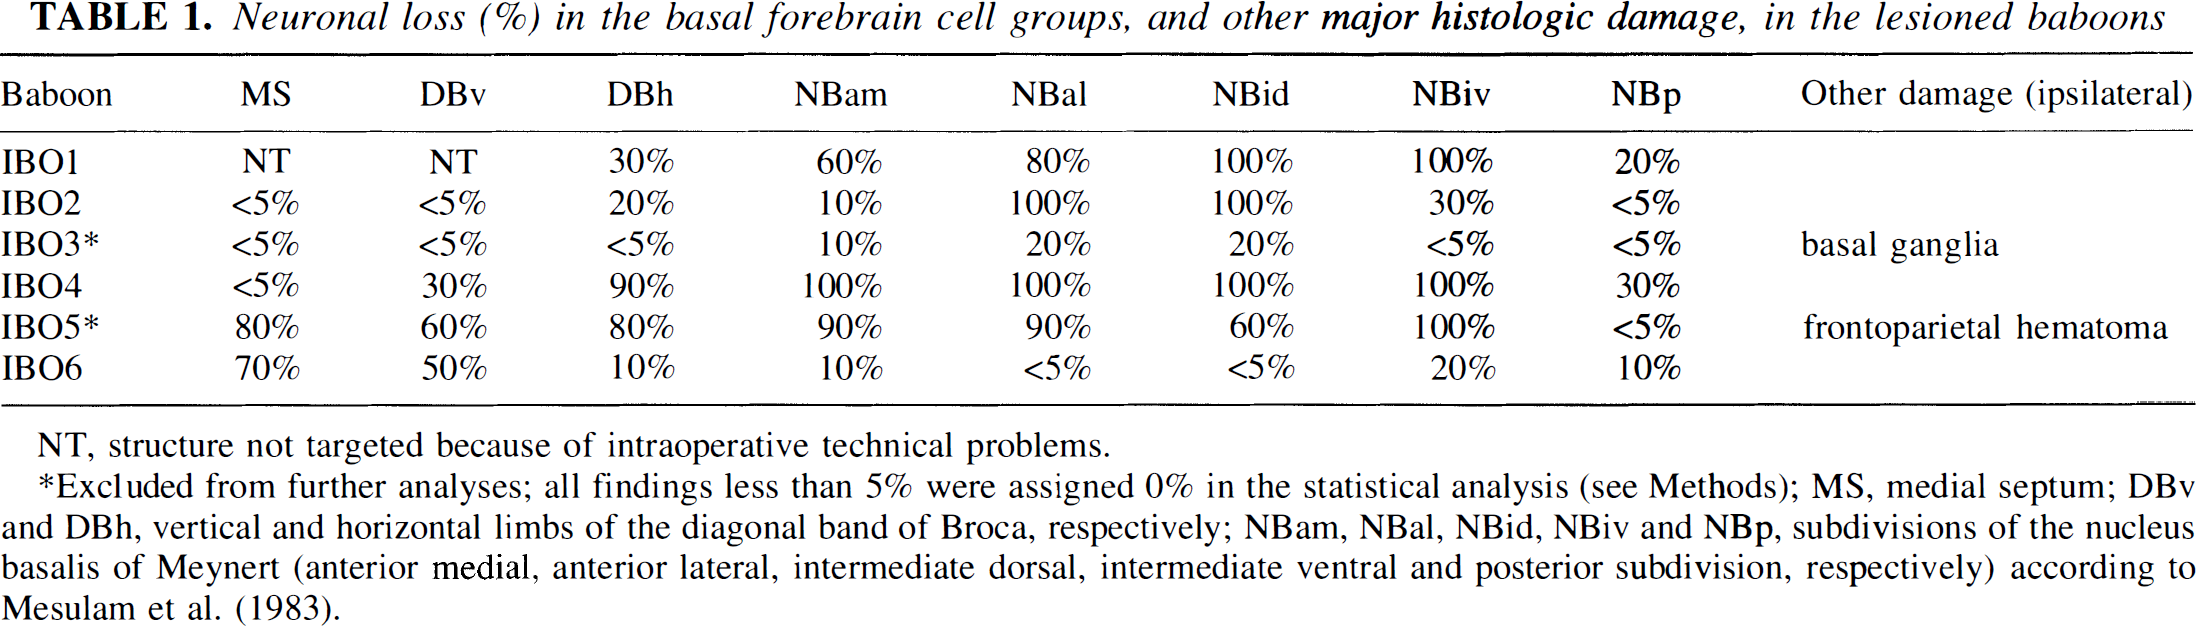
NT, structure not targeted because of intraoperative technical problems.
Excluded from further analyses; all findings less than 5% were assigned 0% in the statistical analysis (see Methods); MS, medial septum; DBv and DBh, vertical and horizontal limbs of the diagonal band of Broca, respectively; NBam, NBal, NBid, NBiv and NBp, subdivisions of the nucleus basalis of Meynert (anterior medial, anterior lateral, intermediate dorsal, intermediate ventral and posterior subdivision, respectively) according to Mesulam et al. (1983).
In the remaining four baboons, BF damage was consistently found, although with different distribution and severity between animals: substantial damage to MS and DBv was found in IBO4 and IBO6 only; neuronal loss in DBh, of variable degree, was present in all four baboons; finally, the NB was severely and extensively damaged in IBO1, IBO2, and IBO4 (Fig. 4), but the NBp subdivision consistently was little affected. Apart from the BF damage, these four baboons showed mild neuronal loss in the ventral pallidum, and (to a lesser degree), in the ventral part of the nuclei accumbens and caudate. Occasional retracted neurons were seen in the same areas as in the SH animals, and in the amygdala and most cortical regions (layers III and V). Needle tracks in the frontal cortex and subcortical structures were clearly visible in most IBO baboons. Finally, Luxol staining did not show any lesion of the axons de passage through the BF structures.
Measurement of choline acetyltransferase activity
In the four eligible IBO baboons, the ChAT activity was, as expected, markedly decreased on the side ipsilateral to the lesion, compared with the SH group; on the contralateral side of IBO1 and IBO2, the ChAT value appeared to be decreased relative to the SH group, although less so than ipsilaterally. The ipsilateral reductions in ChAT activity affected all regions of the IBO group (with decreases averaging 56% to 72% in cortices and 22% in hippocampus compared with the SH group). This is illustrated in Table 2 for the temporal cortex and the hippocampal region. The ANOVA with repeated measures on the raw values revealed significantly lower ipsilateral ChAT activities in the IBO than in the SH group [F(1,5) = 9.793; P = 0.03], with a region effect [F(8,40) = 10.336; P<0.001] and a “group × region” interaction [F(8,40) = 2.218; P<0.05]. Post hoc tests (uncorrected for multiple tests) revealed significant group differences for the posterior parietal (P = 0.01), inferior temporal (P = 0.02), orbitofrontal (P = 0.02), parahippocampal (P = 0.03), perirhinal (P = 0.03), and entorhinal (P = 0.02) cortices.
Individual ipsilateral and contralateral ChAT activities (nmol/mg protein·h) and CMRglc values (mg/100g·min) in the temporal cortex and the hippocampal region in the sham-operated (SH) and the four eligible lesioned (IBO) baboons (see Results)
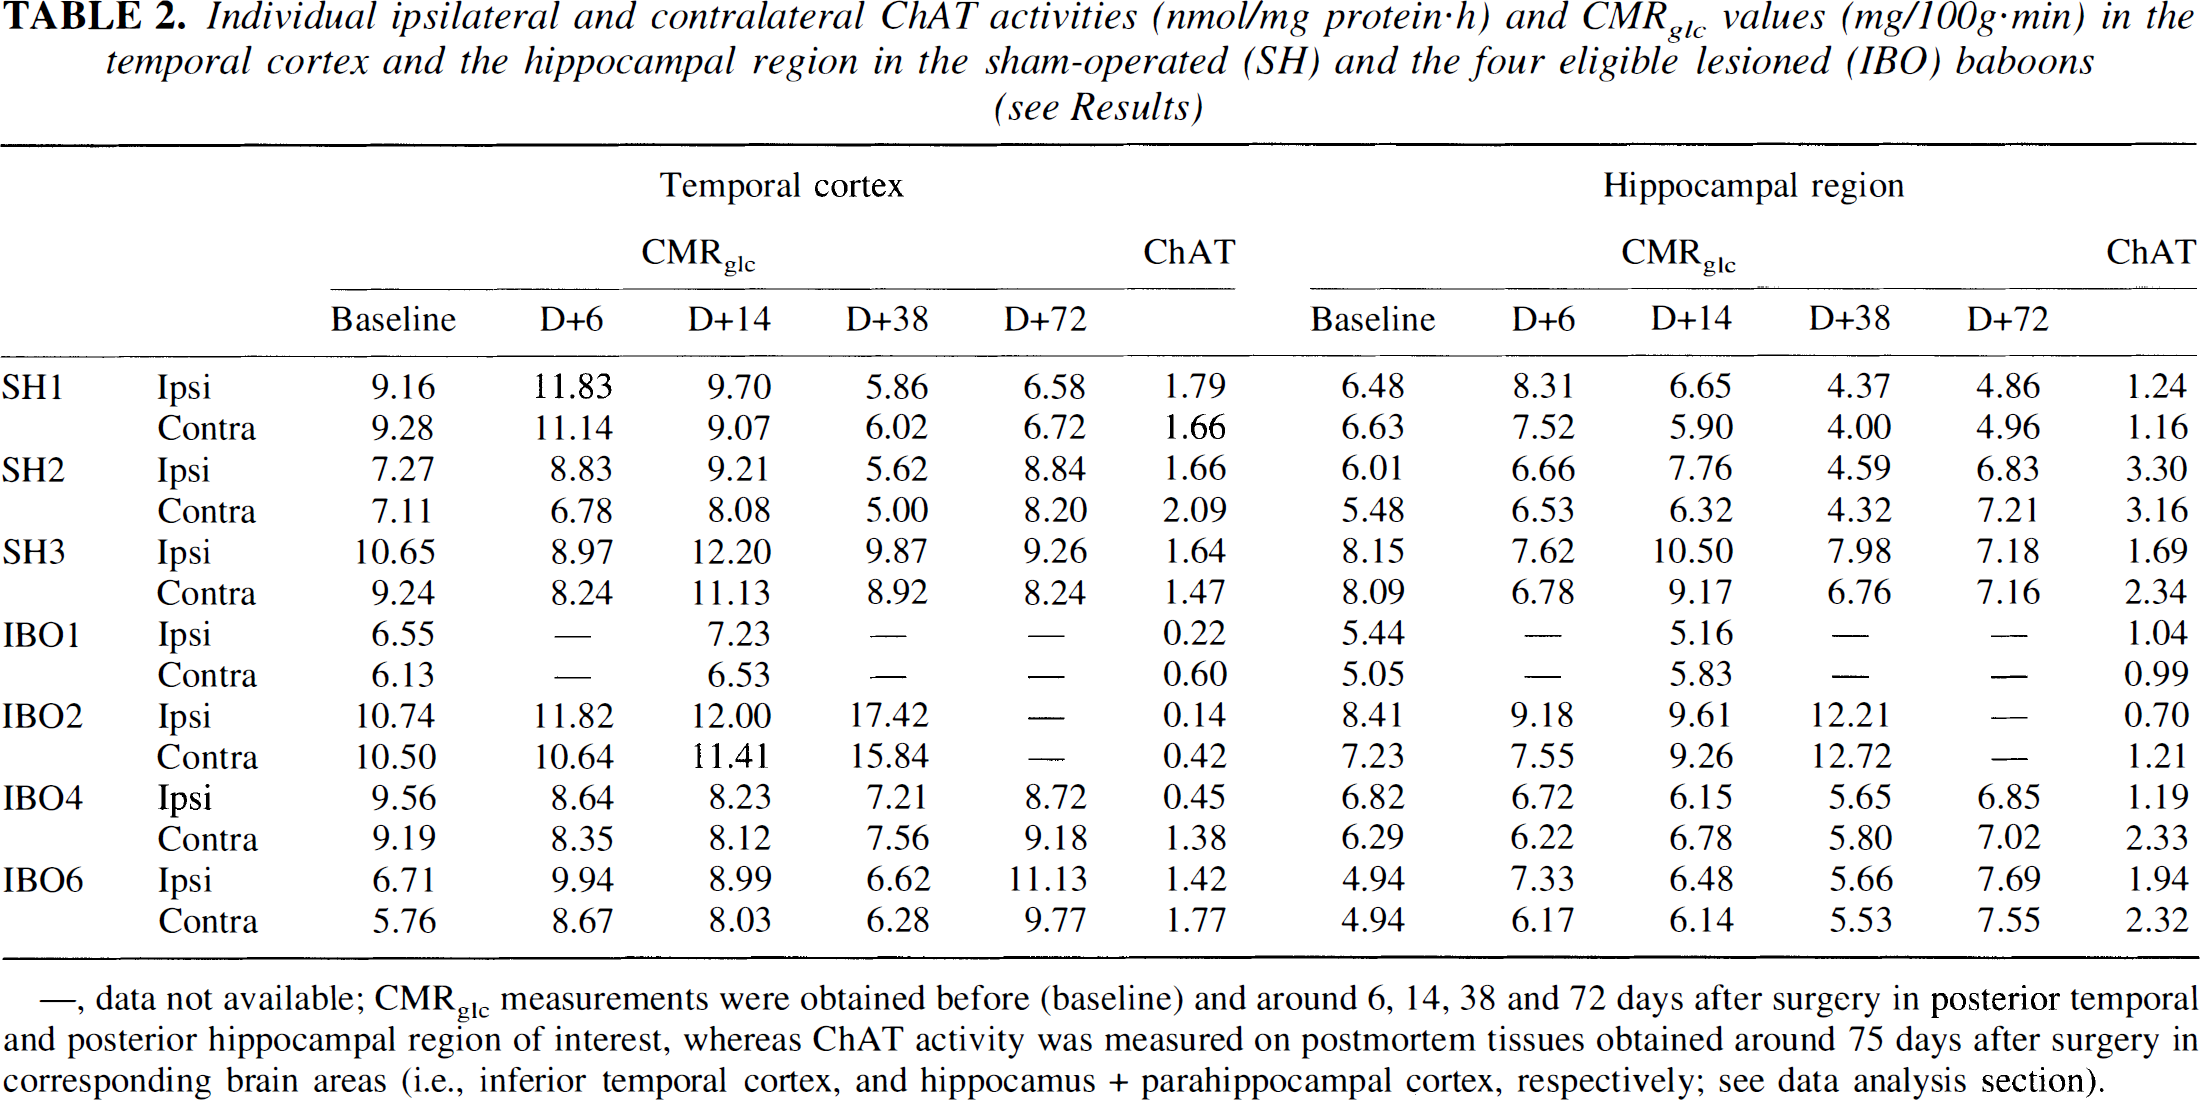
,data not available;
CMRglcmeasurements were obtained before (baseline) and around 6, 14, 38 and 72 days after surgery in posterior temporal and posterior hippocampal region of interest, whereas ChAT activity was measured on postmortem tissues obtained around 75 days after surgery in corresponding brain areas (i.e., inferior temporal cortex, and hippocamus + parahippocampal cortex, respectively; see data analysis section).
Regarding the contralateral hemisphere, the ANOVA did not reveal any significant group effect or group × region interaction, allowing the use of I/C ChAT activity ratios in subsequent analyses. As illustrated in Fig. 3, these mean ratios were consistently close to 100% in the SH group but markedly reduced in the IBO group, except in the anterior cingulate cortex and hippocampus. However, these latter two regions displayed considerable variance, presumably as a result of variability in lesion topography (see the section on histologic analysis) and contamination by white matter, especially so for the hippocampus. These two regions aside, the average reduction in ChAT ratios ranged from 38% (entorhinal cortex) to 60% (parahippocampal cortex) relative to the SH group. The ANOVA performed on all ratio values showed a significant group effect [F(1,5) = 12.717; P = 0.04] without significant group × region interaction.
Relations between choline acetyltransferase data and damage to the cholinergic cell subdivisions
Regarding the MS and DBv subdivisions, no significant correlation was found between ChAT activities and damage estimates. Concerning the NB subdivisions, there were significant correlations in both the expected topography and expected direction, with similar results with ipsilateral raw values and I/C ratios of ChAT activities. For example, damage in the NBid subdivision was correlated with ChAT data in the inferior temporal cortex (r = -0.98 and -0.94 for raw values and I/C ratios, respectively; P<0.005), and damage in the NBal with those in the orbitofrontal cortex (r = -0.96 and -0.89 raw values and I/C ratios respectively; P<0.01); however, anterior cingulate ChAT values did not show the expected correlation with damage to the NBam (possibly because of the sampling problems referred to earlier). Less expected significant correlations also were observed, reflecting the strong intercorrelations within both the regional ChAT values and the neuronal loss estimates (data not shown). Significant intercorrelations also were observed between damage to DBh and to neighboring NB subdivisions, explaining unexpected correlations between neuronal loss in DBh and some cortical ChAT data. Nevertheless, the expected lack of correlation was observed in several instances, such as ChAT values in the dorsolateral prefrontal cortex and damage to NBp.
Metabolic data
CMRglc results
As expected, there was no significant difference in baseline CMRglc values between SH and IBO groups for any of the 46 ROI (23 per side) but one, the left orbitolateral prefrontal ROI (P = 0.03; t test not significant if corrected for multiple tests).
Concerning the postsurgical PET data, for technical reasons, only those at D + 14 were available for IBO1, whereas the D + 72 PET data for IBO2 were limited to the pAC plane. Thus, for the entire set of 46 ROI, only two time points (i.e., before surgery and 14 days after surgery) were available for analysis in all seven baboons. However, the PET data for the nine ROI of the pAC plane were available across all five time points in six animals (all but IBO1), and the PET data for the entire set of ROI were available for four time points (i.e., all but D + 72) in these same six baboons. To take into account these available data, the statistical analyses were performed on three different PET data arrangements: (1) all seven baboons—46 ROI and two time points (baseline and D + 14) (Analysis I); (2) all 46 ROI—six baboons and four time points (baseline to D + 38) (Analysis II); and (3) all time points—six baboons and nine ROI (pAC plane) (Analysis III).
Concerning the ipsilateral CMRglc values and regardless of the analysis used, the ANOVA on the absolute values did not show any significant effect for any ROI. Nevertheless, as illustrated in Fig. 2 (also see later), a metabolic depression was evident early after surgery in the needle passage (i.e., near the anterior cingulate cortex, basal ganglia, and thalamus) in both groups.
Concerning the contralateral CMRglc values, two significant effects were found, but only with Analysis I (baseline and D + 14 in all animals), as follows: (1) a group effect in the orbitolateral prefrontal ROI (P = 0.03), caused by the significant difference at baseline reported earlier; and (2) a “time effect” (P<0.05) in the primary occipital, posterior cingulate, posterior motor, and inferior parietal ROI, with a mild metabolic increase after surgery in both groups. Thus, whatever the analysis considered, there was no group effect on the postsurgical absolute CMRglc values. This is illustrated in Table 2 for the posterior hippocampal and posterior temporal ROI.
This lack of significant effect of BF lesion on contralateral CMRglc values allowed us to calculate the I/C CMRglc ratios for further analyses. The ANOVA on the I/C ratios disclosed a few significant findings (Fig. 6). For the sake of clarity, they are first presented according to early postsurgical effects (i.e., Analysis I), and then to the entire time course (i.e., Analyses II and III). With Analysis I (baseline and D + 14 in all animals), time effects without significant group effect were found for the
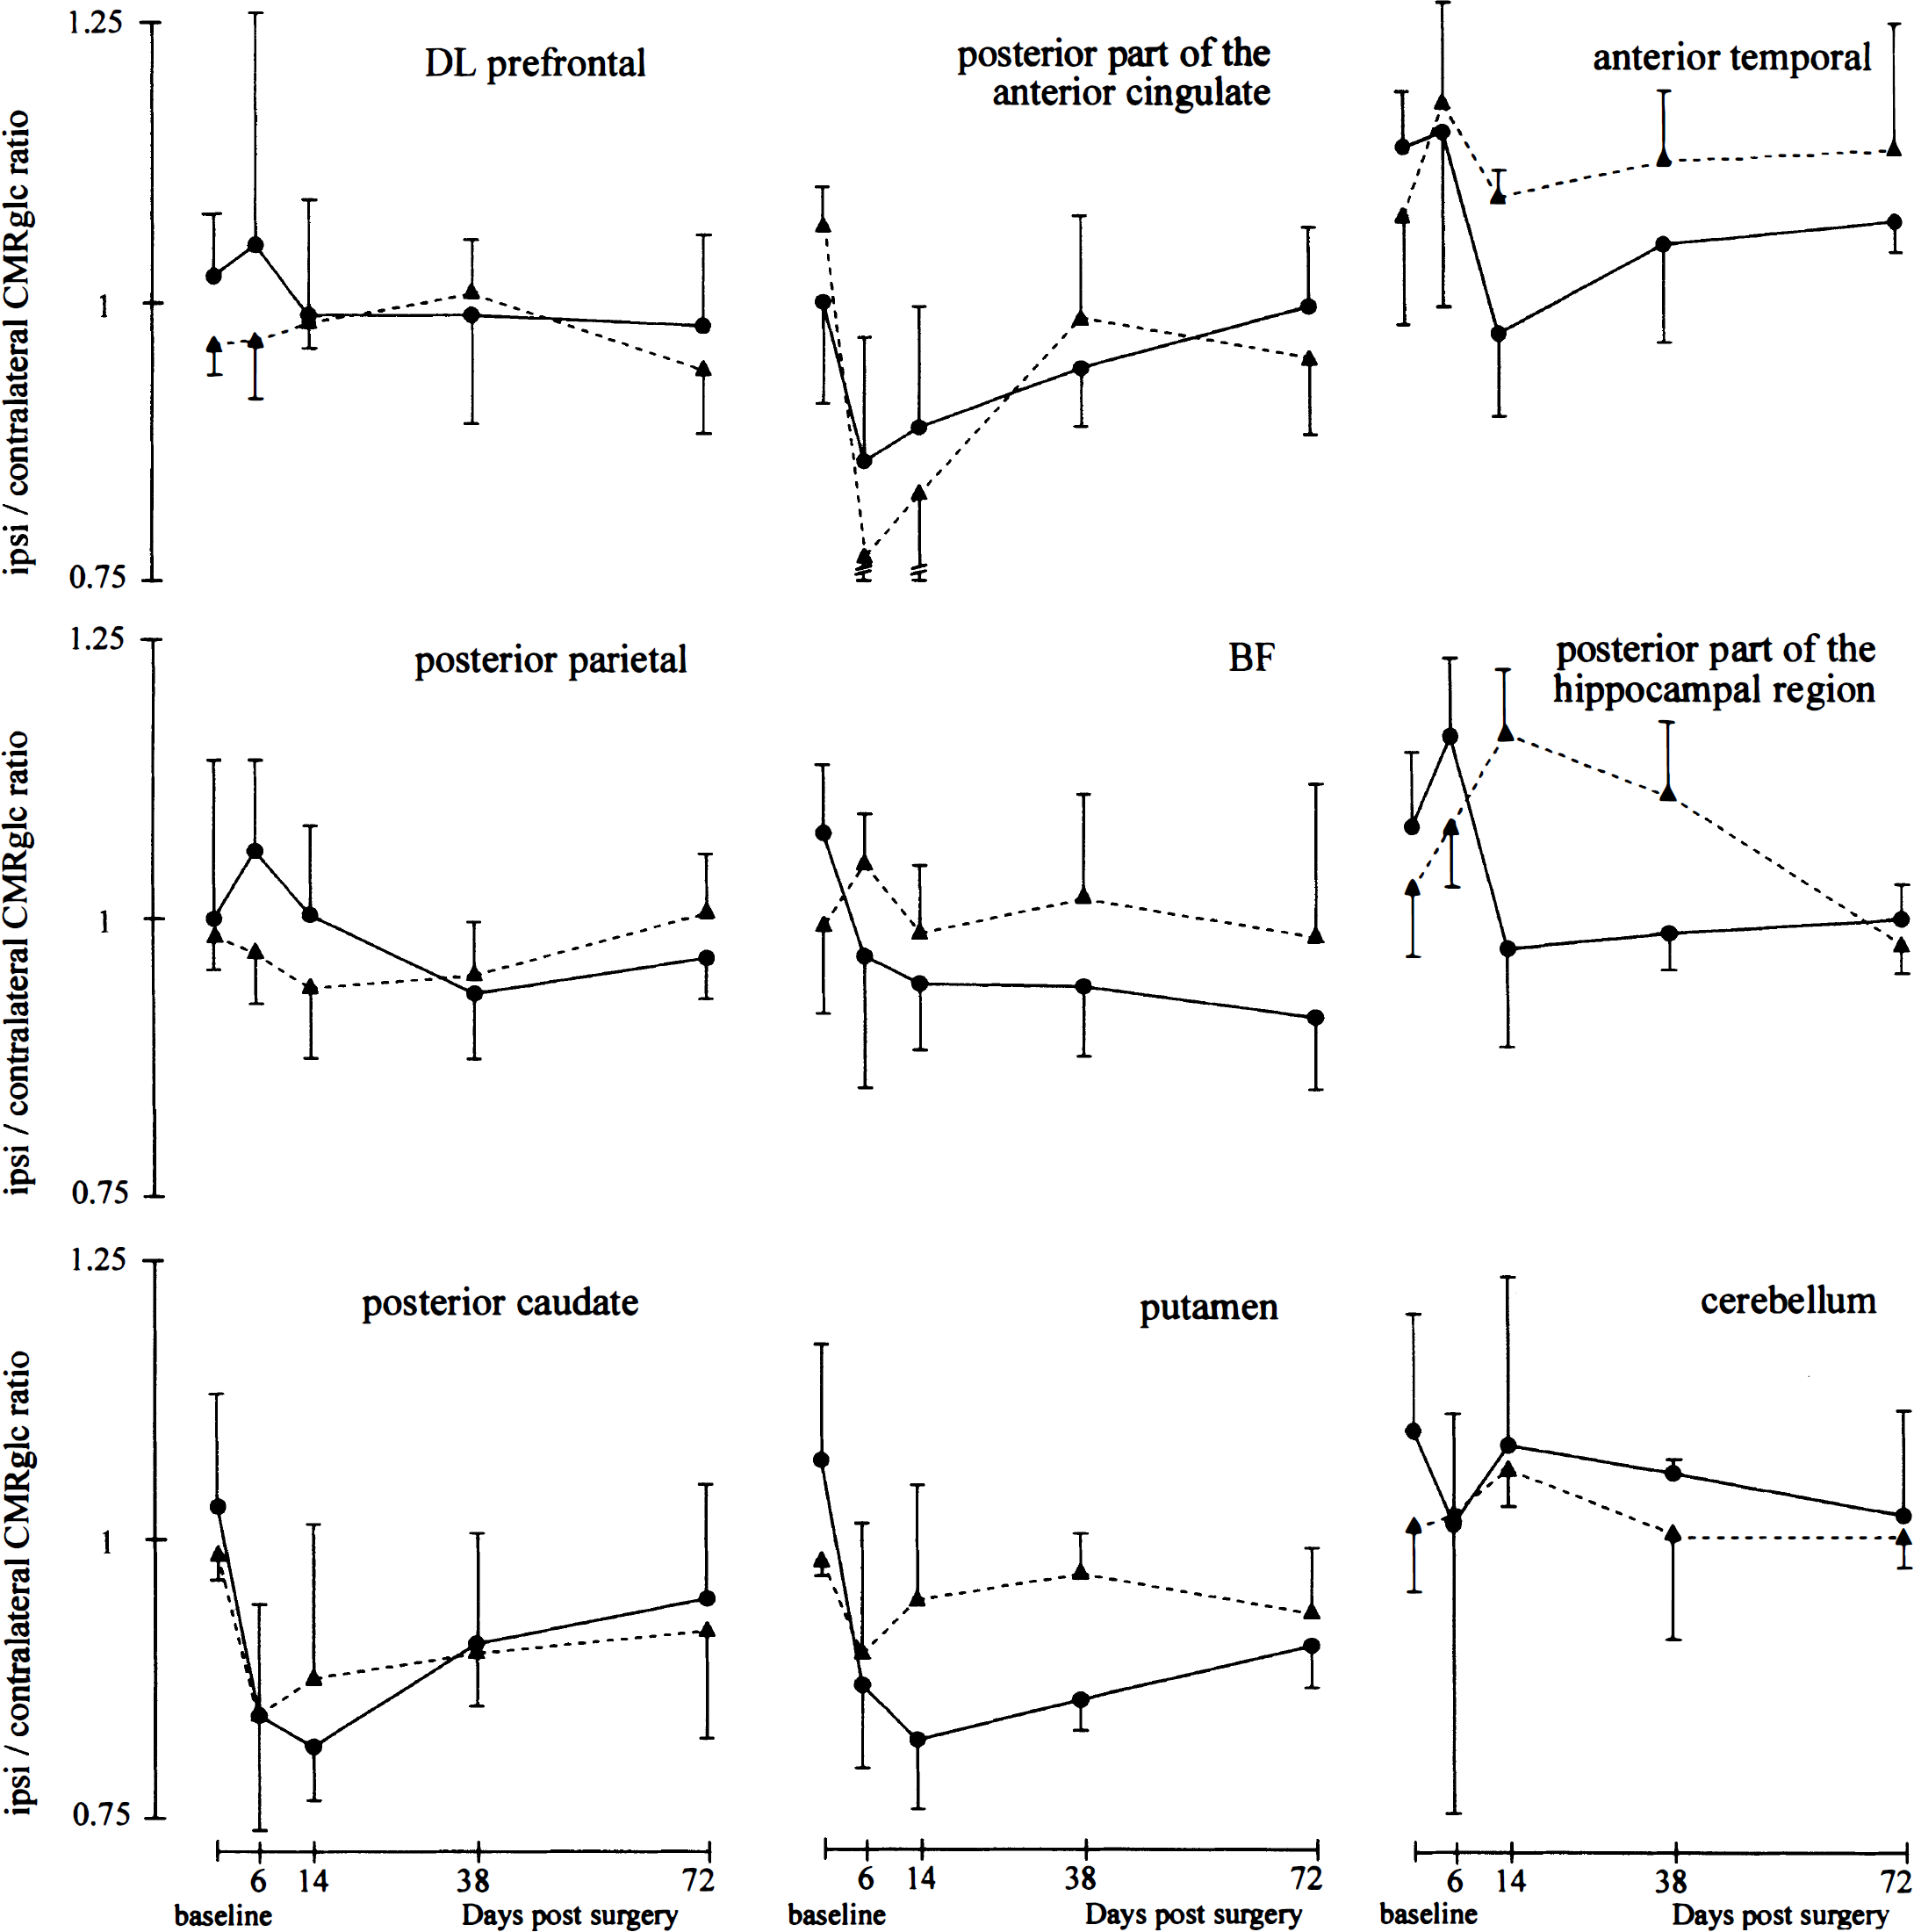
Time course effects of a right-sided basal forebrain lesion on ipsilateral–contralateral CMRglc ratios. This graph illustrates the time–activity course of CMRglc, expressed as ipsilateral–contralateral ratios (mean ± SD) obtained in the IBO (•–•) and the SH (▴–▴) baboons in nine illustrative ROI. The error bars are shown here only for illustration (the SD being used only for post hoc tests). IBO group: n=4 for the PET studies at baseline, and n=3, 4, and 3 at days 6, 14, and 38 after surgery, respectively; at day 72, the sample size by ROI was n=3 for the posterior part of the anterior cingulate, anterior temporal, BF, posterior caudate, and putamen, and n=2 for dorsolateral (DL) prefrontal, inferior parietal, and posterior hippocampal (data not used in the ANOVA, see Results); SH group: n = 3 for all ROI and all times.
With Analyses II (baseline to D + 38 in all 46 ROI) and III (all time points in one plane only), and consistent with Analysis I, there was no significant group effect in any ROI. Several significant findings with Analysis I were replicated with Analysis II (i.e., those concerning the posterior caudate, BF, putamen, and posterior hippocampal ROI), but others were not, such as that for the anterior temporal ROI. There also were additional findings (see Fig. 6 for the descriptive aspects):
Posterior ROI of the anterior cingulate and premotor ROI: Time effect (P = 0.002 and 0.01, respectively); early CMRglc decline with progressive recovery in both groups
Putamen ROI: Besides the time effect (P = 0.006) already observed with Analysis I, there was significant group × time interaction (P = 0.03; post hoc: group difference at D + 38; P = 0.01, still significant with Bonferroni correction); early CMRglc decline in both groups with a trend for slower recovery in the IBO group
Posterior hippocampal ROI: Besides the group × time interaction (P = 0.01) with significant post hoc group difference at D + 14 (P = 0.04) already noted with Analysis I, a post hoc group difference, not significant with Bonferroni correction, was found at D + 38 (P = 0.04); reverse time course between the two groups from D + 6, with lower I/C CMRglc ratios for the IBO group.
These results were largely confirmed with Analysis III, which did not reveal additional findings.
CMRglc–damage correlations
There was no significant correlation between the percentage of neuronal loss in the BF subdivisions and CMRglc (either raw ipsilateral values or I/C ratios) for any region.
CMRglc–ChAT correlations
There was no significant correlation between corresponding I/C ratios of ChAT and CMRglc in any region, and for any postsurgical time considered.
DISCUSSION
In this controlled study performed in baboons, and contrary to our expectations, unilateral neurotoxic damage to the BF cholinergic structures did not meaningfully alter brain glucose use over the 70 postsurgical days investigated. Thus, despite severe histologic BF damage and marked and enduring cholinergic denervation, as documented by ChAT activity depletions, there was no major remote metabolic effect in the projection association neocortex specifically related to the BF lesion. Based on significant group effects and post hoc tests, only marginally significant and transient postoperative differences between the IBO and the SH groups were observed, affecting only the putamen, the anterior temporal cortex, and the posterior hippocampal region, with lower I/C CMRglc ratios the IBO group. Metabolic changes also existed in four other areas (posterior caudate, posterior part of the anterior cingulate, premotor cortex, and thalamus), but they consisted of a transient hypometabolism of similar amplitude in both groups (reflected as significant time effects only) and thus can be seen as nonspecific. Overall, these results rule out a cholinergic basis for the neocortical hypometabolism observed in patients with early AD, and conflict not only with our previous studies, which reported in the same species a marked (but temporary) glucose hypometabolism affecting both cerebral hemispheres after unilateral electrolytic necrosis of the NB (Kiyosawa et al., 1989; Yamaguchi et al., 1990), but also with most investigations in the rat (London et al., 1984; Orzi et al., 1988; Soncrant et al., 1992; Ouchi et al., 1996).
In this section, we successively discuss first the nonspecific metabolic effects, then the marginally significant specific effects, and finally, the overall lack of significant effects in the associative neocortical areas.
Nonspecific effects in the form of significant and transient (i.e., at the earliest two time points) decreases in I/C metabolic ratios, with similar time course in both groups, were observed in the
Before discussing the specific effects of the lesion, let us consider the damaged area itself, namely the basal forebrain. This area exhibited a progressive CMRglc ratio decline in the IBO group (Fig. 6) without significant group effect, which may be explained not only by partial volume effects from surrounding regions, but also by early infiltration by inflammatory cells within the damaged tissue. Because these cells use glucose anaerobically, the expected reductions in synaptic activity caused by neurotoxicity may have been transiently masked (Frey and Agranoff, 1983).
Specific effects were found in the putamen ROI, but tangled with an early nonspecific metabolic reduction, already mentioned. The latter was followed by recovery in the SH group but not in the IBO group, resulting in a significantly lower metabolism in the latter at D + 38. This effect may be attributed to the substantial neuronal loss affecting the ventral part of the globus pallidus (an area included in this ROI) and observed histologically in all IBO baboons. In the posterior hippocampal ROI (which also included some parahippocampal cortex), the metabolic ratios diverged between the two groups with significantly lower ratios for the IBO group at D + 14 and D + 38. Examination of Fig. 6 shows, however, that whereas the I/C ratios declined slightly below 1 in the IBO group, they increased above 1 in the SH group. Although these statistically significant but atypical findings might represent a false-positive result, they are briefly discussed because of the status of this brain region. We believe that cholinergic deafferentation of the parahippocampal cortex rather than that of the hippocampus per se may explain these findings. Indeed, ChAT decrease was marked in the former, but only mild and highly variable in the latter, reflecting severe and limited damage to NBid and MS, respectively (see later). This interpretation is consistent with the lack of metabolic changes found in the hippocampus after unilateral damage restricted to the NBM in rats (Lamarca et al., 1984; London et al., 1984; Orzi et al., 1988; Soncrant et al., 1992). The only significant effect of the BF lesion on neocortical CMRglc was a decrease in the I/C ratio of the anterior temporal cortex in the IBO group at D + 14 with analysis I (baseline and D + 14 only). Because this finding was not confirmed with analyses II (baseline to D + 38) and III (baseline to D + 72), its neurobiologic significance is questionable, even though this neocortical area is largely involved in both AD and visual memory.
Overall, the lack of statistically meaningful hypometabolism in the neocortex in the current study conflicts with our earlier findings (Kiyosawa et al., 1989; Yamaguchi et al., 1990). The degree of neuronal loss in the BF does not seem to explain this discrepancy. Because of our rigorous methodology (individual MR imaging–guided stereotaxic surgery using skull implants as landmarks), damage to the BF in the current study—as assessed by histology and ChAT activity—was at least as severe and extensive as that previously achieved in both our earlier studies and other comparable investigations in primates (Ridley et al., 1985; Struble et al., 1986; Aigner et al., 1991; Roberts et al., 1992; Voytko et al., 1994). Concerning lesion topography, we were able to damage most BF subdivisions in a way similar to that seen in patients with AD (for review see Geula and Mesulam, 1994) with, however, lesser neuronal loss in the MS, DBv, and NBp subdivisions. Furthermore, since neuronal loss in these three subdivisions was highly variable between our four baboons (MS: 0% to 70%; DBv: 0% to 50%, and NBp: less than 5% to 30%), our correlative analysis between damage and CMRglc dealt with this problem. Notice that lesioning MS and DBv in primates is extremely difficult because of both their medial position and their narrow shape; however, in NBp, neurons are sparsely and variably distributed, so that to completely destroy this subdivision would necessarily entail major extra damage. Although suboptimal NBp damage might explain the only limited metabolic changes in the temporal cortex, its main projection area (Mesulam et al., 1983), significant decline in ChAT activity was nevertheless found there. As for the parietal and frontal cortices, they were not hypometabolic in our baboons—at variance with what is found in AD—despite severe damage to the NBid and NBiv subdivisions, their main source of afferences (Mesulam et al., 1983). Accordingly, the cholinergic deafferentation was massive there (Fig. 3) and actually larger than that reported in macaques (Struble et al., 1986; Aigner et al., 1990; Voytko et al., 1994) and marmosets (Ridley et al., 1985; Roberts et al., 1992) with neurotoxic lesions, as well as in baboons with electrolytic lesions in which significant declines in parietal and frontal CMRglc did occur (Kiyosawa et al., 1989; Yamaguchi et al., 1990). Finally, the validity of our entire lesional procedure is supported by the significant correlations observed between neuronal loss in NB subdivisions and ChAT activity in their projection areas, reported here for the first time.
Since we used adolescent baboons, it could be argued that partial reinnervation of the deafferented neocortex may have occurred, especially from the contralateral NB, which is known to have a few crossed-hemispheric projections (Mesulam et al., 1983), and possibly also from the relatively spared ipsilateral MS and DBv subdivisions. The cortical ChAT activity was, however, markedly reduced on the lesioned side, which implies that any such reinnervation would have been limited at best. Furthermore, both the neocortical ChAT depletion and the neuronal loss in the NB were within the ranges reported in AD (average neocortical ChAT depletion and NB damage in our model, 68% and 53%, respectively, compared with an usual range of 50% to 70% and about 50% in AD, respectively [for review see Geula and Mesulam, 1994]). This suggests that the neocortical hypometabolism characteristic of AD may not be caused only by cholinergic deafferentation from NB damage.
If the lack of meaningful hypometabolism in the neocortex can be explained neither by extent nor by degree of BF damage, could it be caused by some methodologic flaw? Although the small samples inherent to studies in nonhuman primates obviously hinder sensitivity, use of a longitudinal design largely compensated for this. Furthermore, to improve intrasubject and intersubject anatomical reproducibility in the brain areas analyzed, a MR imaging–guided method that combined the use of a stereotaxic frame and intracerebral landmarks was applied to the coronal PET imaging (Le Mestric et al., 1993). Finally, the statistical analysis of the data was designed in such a way as to compensate both for missing values (with three differently arranged data sets) and for the well-known variability in global CMRglc (by the use of side-to-side ratios), so that any meaningful neocortical metabolic effect should not have gone undetected.
Other factors related to the experimental design also should be considered. First, the CMRglc was measured in baboons in a dissociative state. Although our dissociative anesthetic (phencyclidine), at the doses used, has been shown to little affect brain metabolism (Fitch et al., 1978; Miyazawa et al., 1993), we cannot rule out that this may have masked subtle metabolic changes. However, cholinergic manipulation recently was shown not to affect the CMRglc response to somatosensory stimulation, even in unanesthetized monkeys (Tsukada et al., 1997); furthermore, we recently detected significant cerebral hypometabolism in baboons under the same dissociative anesthetic regimen but with neurotoxic lesion targeted to the rhinal cortex (Blaizot et al., 1997). Second, the BF lesion was unilateral, and our study spanned only a few postsurgical weeks. Yet none of these features would easily explain the discrepancy with previous reports. Thus, in the rat, a marked cortical hypometabolism has been repeatedly observed early after unilateral excitotoxic NBM lesion (London et al., 1984; Orzi et al., 1988; Ouchi et al., 1996), with normalization from 1 week onward in all (Lamarca et al., 1984; London et al., 1984; Soncrant et al., 1992; Ouchi et al., 1996) except for one study (Orzi et al., 1988). These discrepancies between our results and those in rodents might be caused by species differences. In the rat, the magnocellular cholinergic cells are more diffusely organized and embedded within both the dorsal and the ventral globus pallidus, so that lesioning the NBM disrupts ventral and dorsal pallidal efferents to the thalamus and brain stem (Dunnett et al., 1991), unavoidably leading to extra damage; furthermore, the existence of a cortical network of cholinergic interneurons (Kása, 1986) presumably explains why pharmacologic manipulations of the cholinergic system in this species leads to cerebral metabolic changes in the direction opposite to that seen in primates (Blin et al., 1994). Thus, a meaningful comparison of our findings can be made only with comparable studies in nonhuman primates.
Based on the current findings, the transient and bilateral hypometabolism reported in the two earlier baboon studies (Kiyosawa et al., 1989; Yamaguchi et al., 1990) in retrospect probably reflected essentially nonspecific effects. As suggested at the beginning of this article, this misinterpretation could have been caused by (1) the lack of a sham-operated group; (2) the use of electrolytic atlas-directed rather than neurotoxic MR imaging–guided lesions; and (3) the low resolution of the PET device. However, if the metabolic effects previously reported in baboons reflected nonspecific damage, we need to explain the significant correlations observed between the metabolic and ChAT activity decreases in the neocortical regions, a finding taken as strong evidence for the specificity of the metabolic changes (Kiyosawa et al., 1989; Yamaguchi et al., 1990). In fact, if the data from the current study are analyzed in the same way (i.e., lumping together in the correlation analysis all four brain regions from the lesioned animals only), a similar significant positive correlation emerges between the percent CMRglc (%CMRglc) change at day 14 (relative to baseline) and the percent decrease in ChAT activity (relative to the contralateral side), since %CMRglc=0.378% ChAT - 9% (N = 16 data pairs, r = +0.529, P<0.05). This regression line is, however, biologically meaningless, since no ChAT activity change would correspond to a 29% increase in CMRglc, and a zero ChAT activity to a 9% CMRglc decline only. We favor the idea that such correlations between CMRglc and ChAT in both series of experiments would reflect concomitant and proportional, but causally unrelated, effects of the lesion, the cortical ChAT decreases reflecting damage to the BF cholinergic cells, and the metabolic effects being nonspecific and reflecting damage to noncholinergic fiber tracks and cell bodies.
CONCLUSION
Unilateral excitotoxic BF cholinergic lesions in baboons induced only mild and questionable CMRglc declines in the posterior hippocampal region and anterior temporal cortex. The earlier reports of marked neocortical hypometabolism after unilateral NB electrolytic lesions probably were the result of nonspecific effects from both electrode descents and necrotic damage in the NB itself. This lack of meaningful CMRglc changes in the neocortical associative areas despite marked cholinergic denervation suggests that damage to the BF cholinergic structures does not disrupt metabolic activity, which would be consistent with the small density of cholinergic terminals in the neocortex (Richardson, 1981) and with the lack of effect of NBM electrical stimulation on neocortical CMRglc in the rat (Vaucher et al., 1997). It also is in agreement with a recent investigation (reported in abstract form) that shows no specific and significant metabolic effect in the neocortical association areas 7 days after a specific cholinergic lesion of the NBM with 192 IgG saporin in rats (Bassant and Poindessous-Jazat, 1997); this latter finding would rule out the idea that in the current study, where a nonselective cholinergic toxin was used, the lack of metabolic changes would be caused by compensatory effects from damage to the noncholinergic neurons. Likewise, Tsukada and others (1997) found that cholinergic mechanisms were not involved in the coupling of neuronal activity and CMRglc, but rather in that of neuronal activity and perfusion.
With respect to AD, our study suggests that damage to the BF at best plays a marginal role in the neocortical hypometabolism observed in this neurodegenerative process. This view is supported by a PET study showing discrepant reductions in CMRglc and cholinergic terminal density in AD (Kuhl et al., 1996), which contradicts earlier suggestions based on postmortem data (Palmer et al., 1988); accordingly, neocortical CMRglc declines in AD appear to be related to cortical neuronal loss and neurofibrillary tangle density (McGeer et al., 1986; DeCarli et al., 1992). Thus, the classic correlations between postmortem ChAT activity declines and dementia severity in AD may reflect only the coincidence of these two features as a result of the pathologic process. An alternative hypothesis, which deserves further investigation, would involve predominant damage to brain areas endowed with a more crucial anatomical position in the cortical circuitry than the BF itself, such as the rhinal cortex (Braak et al., 1996; Blaizot et al., 1997).
Footnotes
Acknowledgments
The authors thank Dr. K. Benali for statistical assistance; C. Videau (INSERM U. 159) for performing the ChAT activity measurements; Dr. A. Young, A. Brocquehaye, G. Huguet and D. Luet for technical support; the PET camera and cyclotron teams; Dr. L. Barré and the radiochemistry technicians; G. Debled for making the stereotaxic frame; and M. Huguet, A. Gomez, and M. H. Anselme for typing the manuscript. The authors especially thank Drs. E. T. MacKenzie, C. Fallet-Bianco and A. Jobert for their valuable help in the setup of the experimental procedures.