
Abstract
The authors previously reported that excitotoxic lesions of both the perirhinal and entorhinal cortices in baboons induce remote neocortical and hippocampal hypometabolism reminiscent of that observed in Alzheimer disease (AD), suggesting that disconnection may play a role in AD. Because the cerebral metabolic rate of glucose (CMRglc) was preferentially correlated with perirhinal damage, the area first affected by neurofibrillary tangles in both AD and normal aging, the present series of experiments aimed at assessing the specific metabolic effects of perirhinal lesions. Using PET, CMRglc was measured before surgery and sequentially over the ensuing 10 months. Compared with sham-operated baboons, perirhinal lesions induced significant—albeit late and transient—CMRglc decreases in several brain regions, which significantly correlated with histologic damage for some of these regions. Among them, the temporal and hippocampal regions are metabolically affected after extensive rhinal lesions, in early AD, and aging, while the prefrontal region is affected in aging only. Furthermore, in contrast to AD and rhinal lesions, the posterior cingulate cortex was spared. Both the progressive but significant metabolic effects and specific hypometabolic pattern after perirhinal lesions were confirmed by direct comparisons with previous data obtained after combined lesions of both rhinal areas. Thus, although perirhinal damage appears in itself insufficient to induce sustained CMRglc decreases, it may contribute to the hypometabolic profile of both AD and normal aging, most likely with a stronger contribution in the latter.
Positron emission tomography (PET) studies have shown that the early stages of Alzheimer disease (AD) are characterized by metabolic declines that initially affect the posterior cingulate cortex (Minoshima et al., 1997) and the temporoparietal association neocortex, and subsequently, the prefrontal association neocortex (Benson et al., 1983; Cutler et al., 1985; Frackowiak et al., 1981; Minoshima et al., 1997). The reduction in neocortical cerebral metabolic rate of glucose (CMRglc) is correlated with the severity of cognitive impairment (Desgranges et al., 1998; Haxby et al., 1990). Among possible mechanisms of this hypometabolism, of particular interest are the remote effects from neuronal loss in the rhinal cortex (i.e., perirhinal and entorhinal cortices), a brain area with a crucial anatomic position in the cortical circuitry. By means of selective excitotoxic lesions in baboons, we previously reported that, in contrast to cholinergic deafferentation (Le Mestric et al., 1998), neuronal loss in the rhinal cortex severely and durably affected the resting cerebral metabolism with a similar pattern to that found in AD (Meguro et al., 1999). As also observed in AD, baboons with rhinal lesions also exhibited impairment in declarative memory (Chavoix et al., 2002), the degree of which significantly correlated with CMRglc in areas such as the posterior temporal cortex and the hippocampal region (Blaizot et al., 2002). Because the CMRglc decline was preferentially correlated with the severity of neuronal loss in the perirhinal cortex, damage to the perirhinal cortex was thought to play a particularly important role in the cerebral dysfunction of AD (Meguro et al., 1999).
The perirhinal cortex (Brodmann areas [BAs] 35 and 36) is located in the anteroventral part of the temporal lobe, lateral to the entorhinal cortex. It receives its main cortical input from the associative visual areas and provides the major part of the cortical input to the entorhinal cortex (Suzuki, 1996a). The perirhinal cortex is therefore the source of most visual inputs to the hippocampus, mainly via the entorhinal cortex. One functional expression of this key neuroanatomic position is the prominent role played by the perirhinal cortex in visual recognition memory (Brown and Aggleton, 2001; Murray and Richmond, 2001; Suzuki, 1996b), as especially demonstrated by both lesions (Màlkovà et al., 2001; Meunier et al., 1993; Millien et al., 1999) and single-unit recording (Fahy et al., 1993; Miller et al., 1991; Miyashita and Chang, 1988; Sobótka, 2000) in nonhuman primates. More recently, this role has received strong direct support from functional brain mapping in both humans (Köhler et al., 2000) and baboons (Blaizot et al., 2000).
The transentorhinal cortex, a portion of the perirhinal area 35 (Braak and Braak, 1985), is the region earliest affected by neurofibrillary tangles (NFTs) in AD, which remain particularly dense in that region throughout the disease course (Braak and Braak, 1991; Delacourte et al., 1999; Van Hoesen et al., 2000). The density of NFTs has been shown to correlate with dementia severity (Arriagada et al., 1992; Nagy et al., 1996). Even in mild AD, atrophy of the perirhinal cortex is marked and correlates well with the severity of cognitive impairment (Juottonen et al., 1998).
Several pieces of evidence indicate that the perirhinal cortex is also affected by NFTs in nondemented elderly subjects, though less severely so than in AD (Price et al., 1991). In normal aging, NFTs subsequently reach the entorhinal cortex and, eventually, the hippocampus (Braak and Braak, 1991; Delacourte et al., 1999), as in the early stages of AD. The metabolic profile of healthy aging, however, differs from that observed in AD. In contrast to AD, the decline preferentially affects the dorsolateral prefrontal cortex and largely spares the posterior cingulate cortex (Baron and Godeau, 2000; Hoffman et al., 1989). Nonetheless, other areas such as the parietal and temporal cortices, including the perirhinal cortex, and hippocampus are affected in both AD and normal aging (Baron and Godeau, 2000; Hoffman et al., 1989).
These findings suggest that, in addition to its established role in visual declarative memory impairment, perirhinal cortex damage may be involved in both the cerebral hypometabolism typical of AD and that observed in normal aging. To test this hypothesis, the present study assessed the effects of bilateral excitotoxic perirhinal damage on CMRglc in the baboon in brain regions previously reported to be hypometabolic and/or in which the CMRglc values were significantly correlated to the perirhinal damage after combined entorhinal and perirhinal lesions (Meguro et al., 1999). Of note: the baboons with selective perirhinal lesions used in the present investigation showed severe visual recognition memory impairment (Millien et al., 1999). A sham-operated group was used as control, and both the lesioned and sham-operated animals were subjected to serial measurements of CMR glc over a period of 10 months by means of high-resolution PET scanning coregistered with individual magnetic resonance (MR) images. Whenever possible, the metabolic data will be further compared with those that we obtained earlier using a similar protocol (Meguro et al., 1999). Thus, we shall compare the effects of perirhinal and rhinal lesions at two time points after surgery, assuming that the latter would have greater metabolic effects than perirhinal damage alone. Some comparisons between perirhinal, rhinal, and sham-operated animals pooled from the present and the Meguro et al. (1999) studies will also be performed. Preliminary reports of the current work, approved by the INSERM Bureau of Animal experimentation and by the INSERM Neurosciences Board, have been published in abstract form (Millien et al., 2000).
MATERIALS AND METHODS
Subjects
Ten young-adult male Papio anubis baboons (7 to 15 kg) were divided into two groups that received either bilateral excitotoxic lesions of the perirhinal cortex (PR group; n = 5, named PR1-PR5) or sham operations (SPR group; n = 5, named SPR1–SPR5).
Baboons with either bilateral excitotoxic lesion of the entire rhinal cortex (RH group, n = 5) or sham rhinal operations (SRH group, n = 5) are those previously described in Meguro et al. (1999) (RH1–RH4 and SRH1–SRH4) and in Blaizot et al. (1999) (RH5, SRH5).
Surgical and magnetic resonance imaging procedures
Similar procedures, which have been previously reported in detail (Blaizot et al., 1999; Meguro et al., 1999), were applied to all 20 baboons. Only the main methodological points and the major differences between the present and previous studies (subsequently called perirhinal and rhinal studies, respectively) will be described here.
During both surgical and MR imaging procedures, the head of the anesthetized baboon was placed in a nonferromagnetic stereotaxic frame, and the physiologic parameters were continuously monitored. Target sites were individually determined within the entorhinal and/or perirhinal cortices, with the help of MR T1-weighted images and MR angiography. There were 22 target sites per side for the RH and SRH baboons (11 each for the entorhinal and perirhinal cortices, with two sites per millimeter in the anteroposterior direction) and 11 sites targeting the perirhinal cortex for the PR and SPR baboons (one site per millimeter). Concerning the perirhinal study, however, a detailed cytoarchitectonic study performed as the project had already begun reported that the perirhinal cortex in the baboon is closer to the human than the macaque species, in that it extends more anteriorly than previously thought (Blaizot et al., 2001). To account for this novel data, we added three rostral target sites in the last five animals (PR3–PR5, SPR4, and SPR5). Bilateral lesions either of both rhinal areas or of the perirhinal cortex alone were performed in two stages (right hemisphere first), with an interval of 5 to 14 days. Excitotoxic lesions were made by injecting 1.2 μL ibotenic acid into each predetermined target site. The sham-operated baboons underwent the same surgical procedure except that needle descents were lowered to a point 3 mm above the target sites without any injection. Accurate location of the damage and lack of hemorrhage were confirmed early in each baboon using MR images obtained 1 to 11 days after each surgery (Le Mestric et al., 1993).
Positron emission tomography
As described in detail by Le Mestric et al., (1993, 1998) and Meguro et al. (1999), coronal PET scans were performed with baboons under light dissociative anesthesia/analgesia (7-μg·kg−1·min−1 intravenous phencyclidine, 2:1-v/v N2O to O2); the effects of this regimen on cerebral metabolism have been shown to be negligible (Fitch et al., 1978). Briefly, following a 68Ge transmission scan, an intravenous bolus of 1.4 to 2.4 mCi >99% pure 18F-fluoro-deoxyglucose (18FDG) was injected. Each baboon underwent presurgical (baseline) and four to five sequential postsurgical CMRglc measurements at approximately 1, 1.5, 2.5, 4.5, and 10 (perirhinal study only) months after surgery. In the rhinal study (Meguro et al., 1999), PET scans were always performed with the four-ring (seven-slice) LETI TTV03 device (intrinsic resolution 5.5 × 5.5 × 9 mm, x, y, z), whereas two PET devices had to be used in the perirhinal investigation: the previous LETI TTV03 device and the high-resolution (63-slice, 3D volume acquisition) ECAT HR+ device (isotropic resolution 4.6 × 4.2 × 4.2 mm), which was installed in our institute after the start of this investigation. In order to compare the performance of these two devices in terms of CMRglc measurements in the baboon, we were able to obtain a number of dual measurements in the same animals before the HR+ device became the sole operational device on site. As shown in Table 1, baseline PET scans were performed with both devices in all PR and SPR baboons except the last four. In these two groups, PET data at 1.5 months was consistently obtained with the HR+ tomograph, whereas for the remaining postsurgical PET scans, the LETI TTV03 was used as long as it was available in the institute, and the HR+ thereafter.
Sequential use of the two positron emission tomographs for sham-operated and perirhinal-lesioned baboons
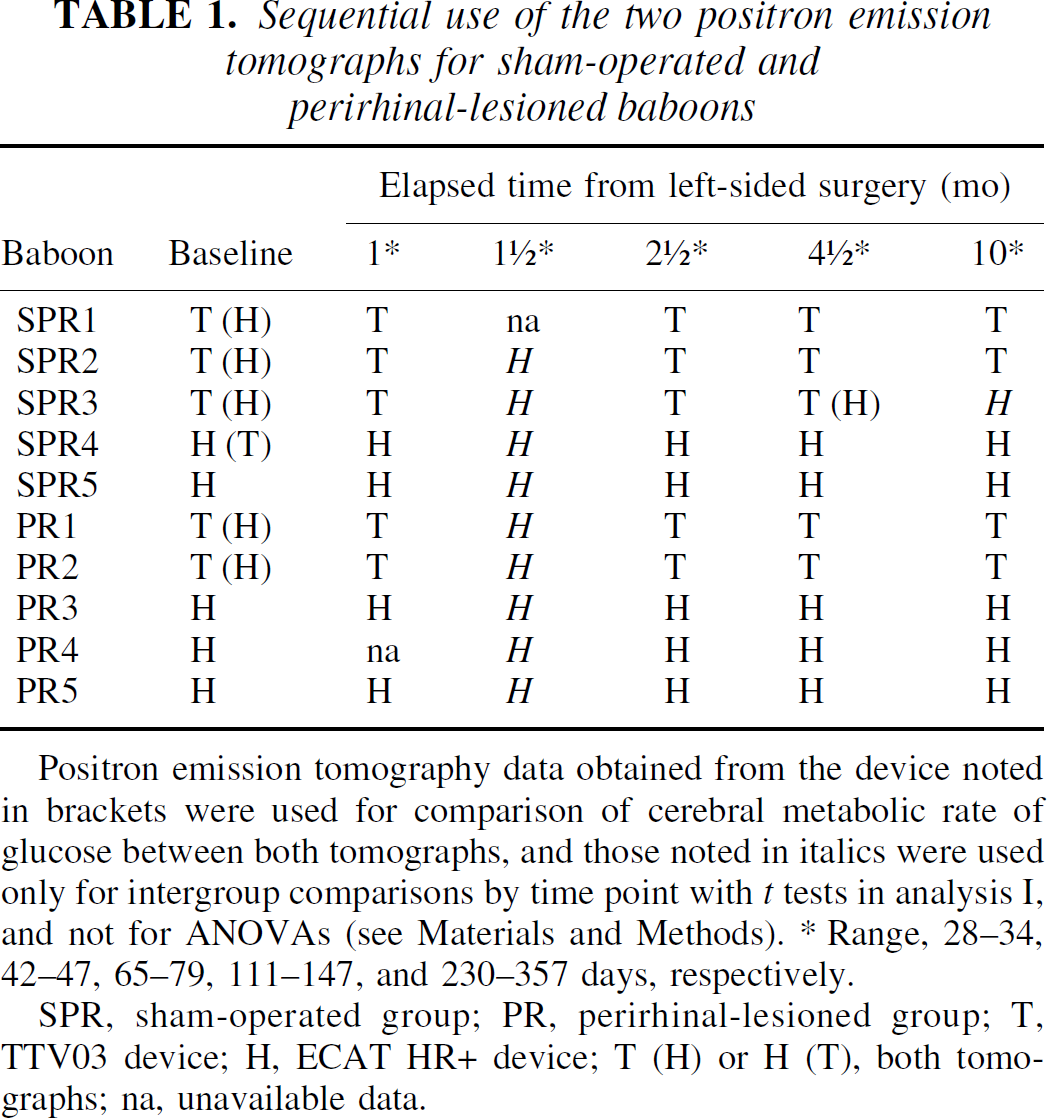
Positron emission tomography data obtained from the device noted in brackets were used for comparison of cerebral metabolic rate of glucose between both tomographs, and those noted in italics were used only for intergroup comparisons by time point with t tests in analysis I, and not for ANOVAs (see Materials and Methods). * Range, 28–34, 42–47, 65–79, 111–147, and 230–357 days, respectively.
SPR, sham-operated group; PR, perirhinal-lesioned group; T, TTV03 device; H, ECAT HR+ device; T (H) or H (T), both tomographs; na, unavailable data.
The PET images obtained with TTV03 (i.e., six coronal planes located from pAC + 24 mm anteriorly to pAC - 36 mm posteriorly, with pAC corresponding to the posterior edge of the anterior commissure) were reconstructed with the same field of view as that used for MR imaging (Le Mestric et al., 1993). Acquired HR+ PET volumes (i.e., with septa retracted) were reconstructed in 63 coronal slices with an x, y zoom of 3.5 (final voxel size: 1.45 × 1.45 × 2.425 mm, x, y, z). Parametric images of CMRglc (mg·100 g−1·min−1) were obtained by applying, on a pixel-by-pixel basis, the three-compartment autoradiographic model of Phelps et al. (1979) onto the 50- to 60-minute PET frames, using the rate constants previously determined in our laboratory (Miyazawa et al., 1993), and a lumped constant of 0.42.
Positron emission tomography data analysis
Positron emission tomography data analysis was performed for the 10 brain areas that were significantly hypometabolic or in which the CMRglc values were significantly correlated to the perirhinal damage in the Meguro et al. (1999) study (see set I of Table 2 for complete list). Note that the hippocampal region and the temporal cortex were both divided into anterior and posterior regions of interest (ROIs) so that CMRglc was measured in a total of 12 ROIs, defined with identical template and on each side for both the present perirhinal and the previous rhinal studies (see Le Mestric et al., 1998 for precise location).
Regional cerebral metabolic rate of glucose values in the 16 brain regions in perirhinal-lesioned and sham-operated groups at the six time points, and corresponding t tests results (analysis I)
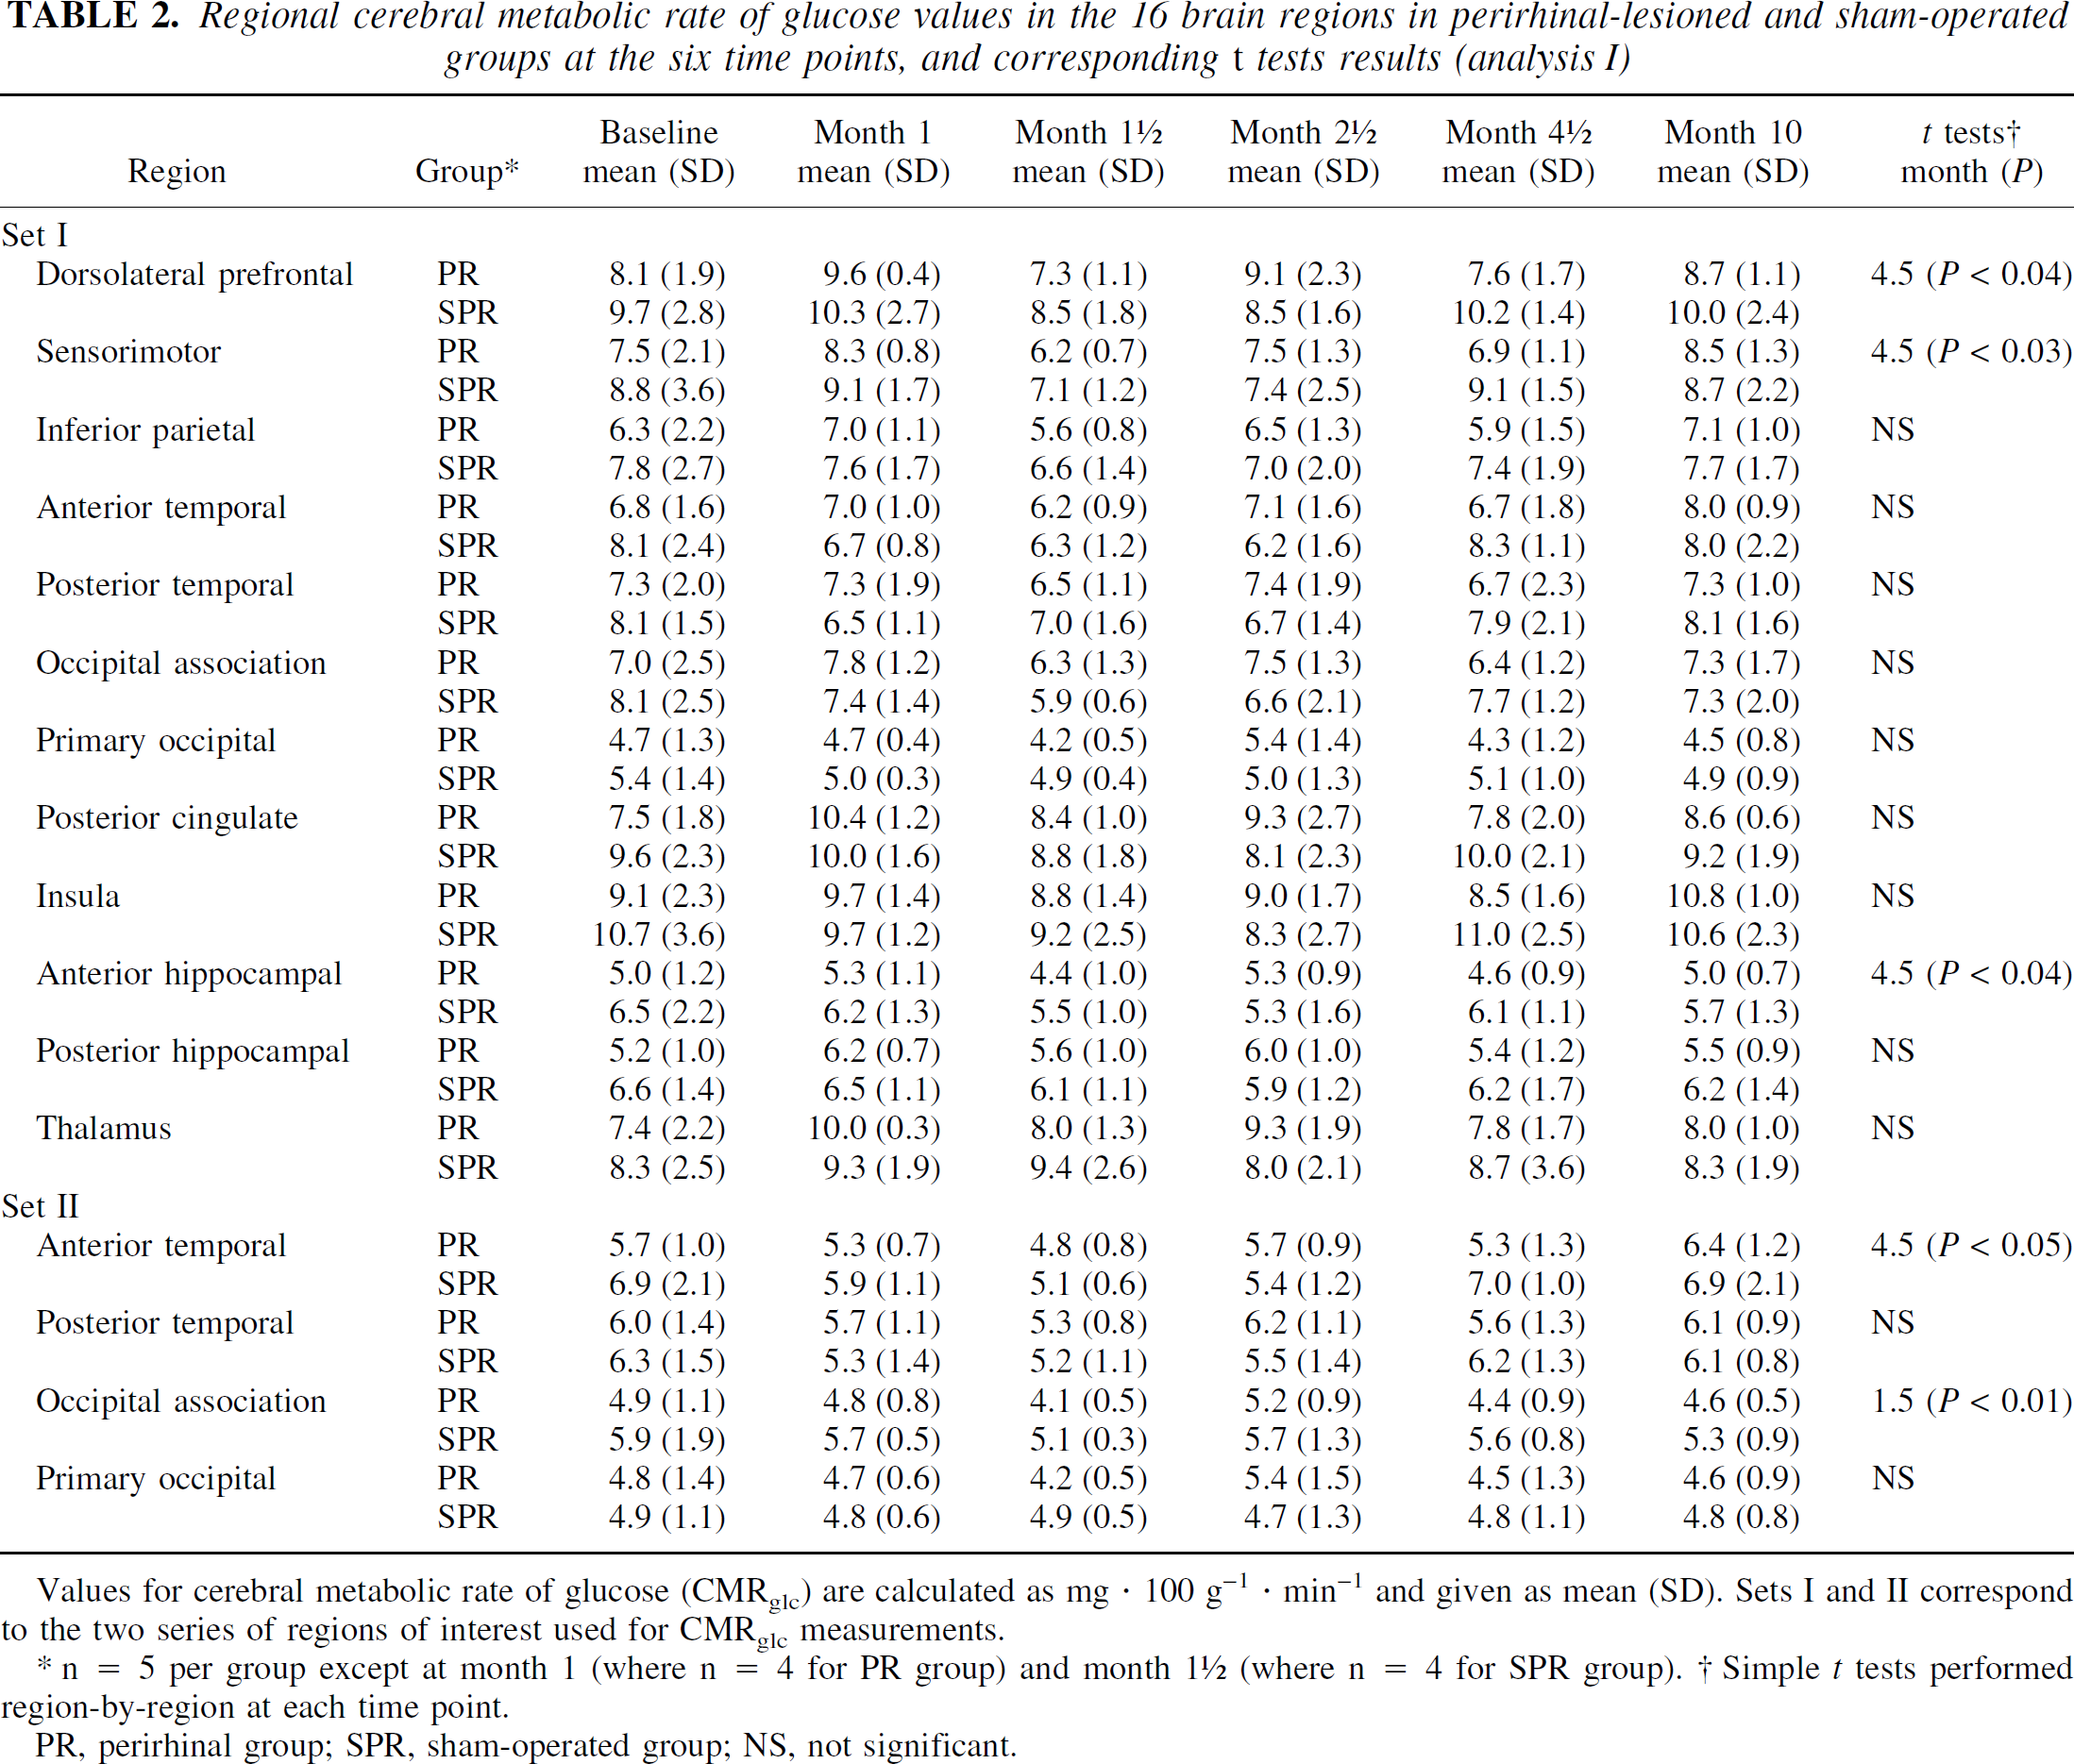
Values for cerebral metabolic rate of glucose (CMRglc) are calculated as mg · 100 g−1 · min−1 and given as mean (SD). Sets I and II correspond to the two series of regions of interest used for CMRglc measurements.
n = 5 per group except at month 1 (where n = 4 for PR group) and month 1 ½ (where n = 4 for SPR group). † Simple t tests performed region-by-region at each time point.
PR, perirhinal group; SPR, sham-operated group; NS, not significant.
In the perirhinal study, a second set (set II) was designed to obtain a precise anatomic delineation of the anterior and posterior temporal cortices and primary and association occipital cortices, which consisted of four ROIs. These were ellipses or rectangles (instead of circles for set I) placed manually so as to match precisely each animal's anatomy as determined on individual MRI (see Fig. 1 for comparative location of these ROIs between both sets).
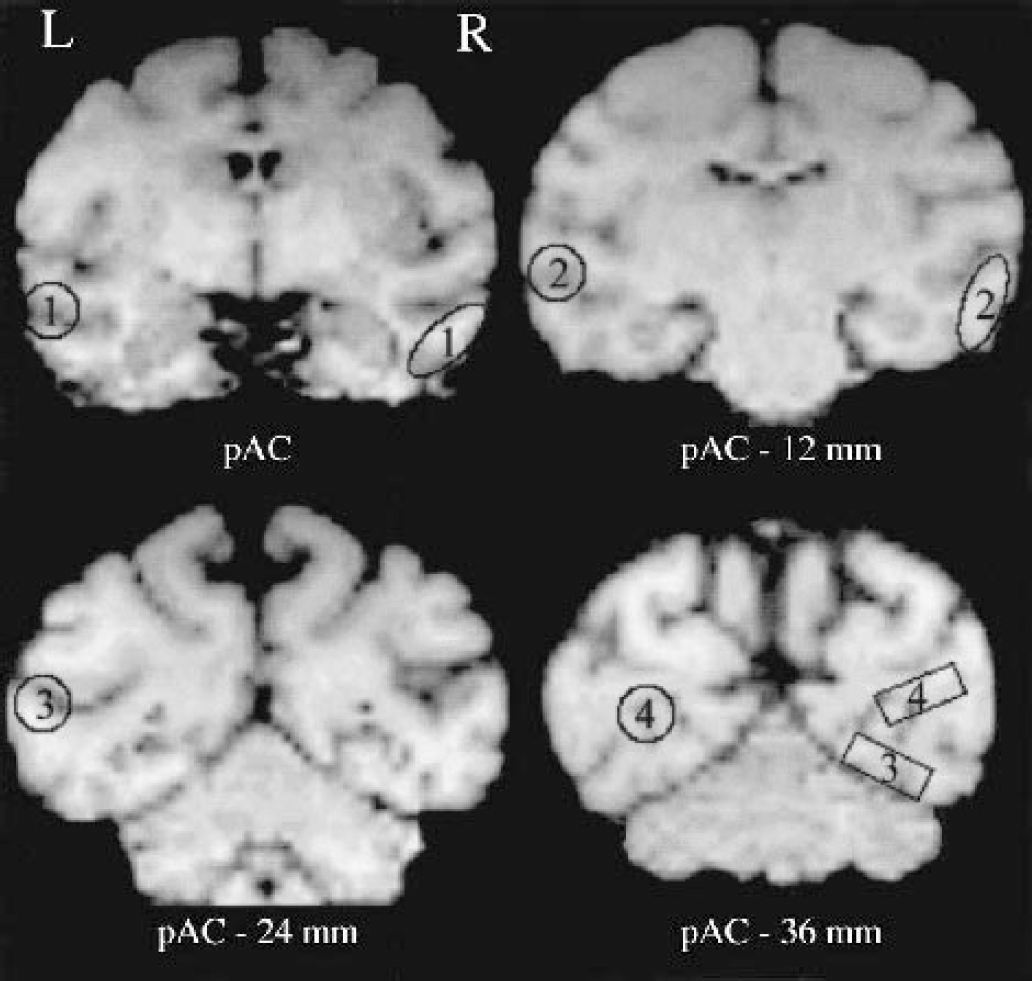
Location of the four regions of interest (ROIs), common to both sets, used to assess the temporal and occipital neocortices on presurgical T1-weighted magnetic resonance images, illustrated here for one baboon. The ROIs for set I—that is, as used in Meguro et al. (1999)—and set II are shown on the right and left sides, respectively. Set II ROIs were delineated so as to limit partial volume effects. For each structure, the set II ROIs were placed on the same coronal plane as that used for set I except for the occipital association ROI, which was displaced posteriorly and, consequently, ventrally. 1, anterior temporal; 2, posterior temporal; 3, occipital association; 4, primary occipital; pAC - x mm, plane centered x mm caudal to the posterior edge of the anterior commissure; R, right; L, left.
The PET data collected with TTV03 in both the perirhinal and rhinal studies were processed with six coregistered coronal T1-weighted MR images, as previously described (Le Mestric et al., 1993; Meguro et al., 1999). Regarding the HR+ PET data (perirhinal study only), coronal MR images were first obtained by interpolation from the sagittal three-dimensional T1-weighted MR imaging scan (spoil gradient; time of echo = 9 milliseconds, time of repetition = 48 milliseconds, flip angle = 29°, number of scans = 124, thickness = 0.7 mm) and then coregistered with the baseline PET images of the same animal using the AIR software (Woods et al., 1993). Using the same software, the postoperative HR+ PET images were aligned with the baseline HR+ images, and the ROIs were defined so as to match the TTV03 ROIs as much as possible. However, given the difference of slice thickness between the two tomographs (i.e., 9 mm for TTV03 vs. 2.425 mm for HR+), three contiguous HR+ slices (total thickness: 3 × 2.425 ≅ 7.3 mm) were summed to match the corresponding TTV03 slice. Therefore, the position, shape, and area (∼100 mm2) of these ROIs were consistent for both devices while their volume was slightly lower for the HR+ analysis. Finally, for a given area, the CMRglc HR+ values of the three contiguous ROIs that sampled this area were averaged separately for each side of the brain.
Histologic analysis
After completion of the experiment (i.e., about 3–7 and 8–12 months after surgery, depending on the behavioral protocol, for RH-SRH and PR-SPR groups, respectively), the animal was deeply anesthetized and perfused transcardially with cold heparinized saline. The brain was quickly removed and fixed in formalin. A coronal block containing the entire temporal lobe was embedded in paraffin and cut into 15-μm coronal sections, which were stained every 500 μm with thionin and every 1,500 μm with glial fibrillary acidic protein antibody.
Regarding the rhinal study, a semiquantitative assessment of damage was performed within both the rhinal cortex and adjacent areas (i.e., hippocampus, amygdala, and area TE). As previously described in detail (Blaizot et al., 1999; Meguro et al., 1999), severe neuronal loss in both entorhinal and perirhinal cortices was found in all RH baboons with a mean individual percent cell loss in the rhinal cortex ranging from 50% to 75% on both sides, and minimal damage to the neighboring structures. In the SRH group, only minimal gliosis was noted along the needle tracts.
A more meticulous histologic analysis with a quantitative assessment of damage was used for the perirhinal study. This analysis was performed on 18 brain slices stained with thionin, comprising 16 slices from the beginning of the rhinal sulcus to the posterior boundary of the perirhinal cortex, as in Meguro et al. (1999), and 2 slices from the more recently defined anterior boundary of the perirhinal cortex in baboons (Blaizot et al., 2001) to the beginning of the rhinal sulcus. Neuronal loss within the perirhinal cortex was estimated by means of the
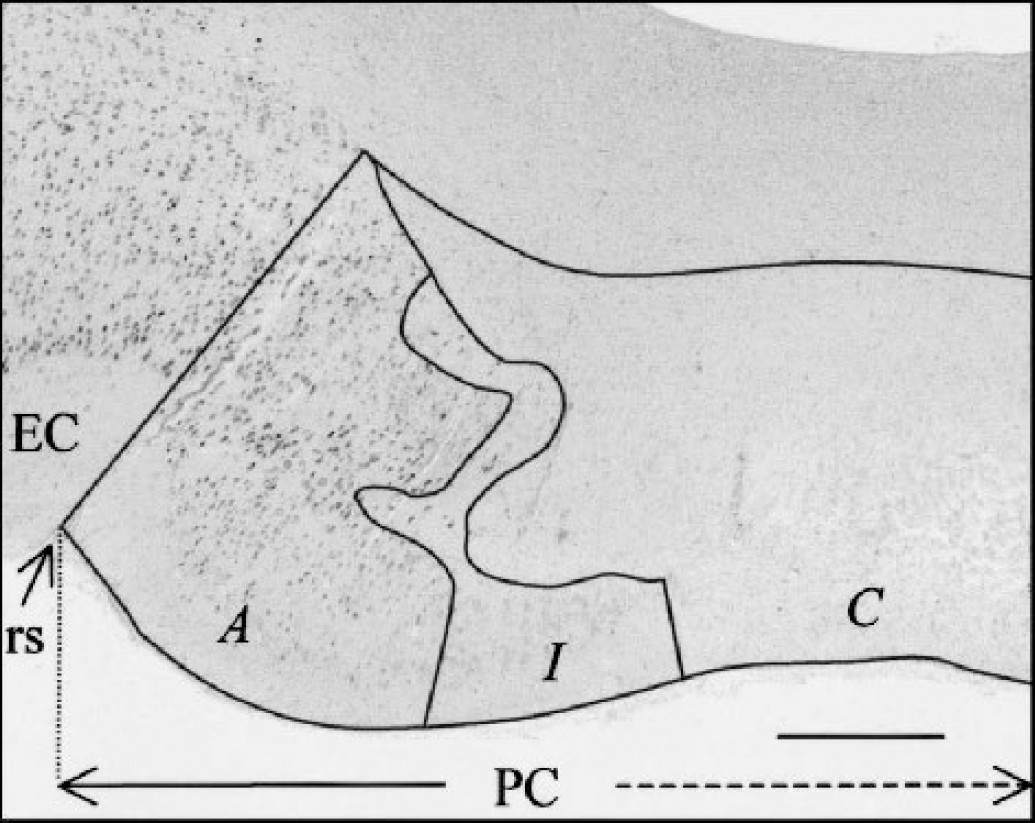
Delineation of the three tissue categories for damage quantification, as illustrated on a coronal thionin-stained histologic section in a lesioned baboon (PR1): complete (C), incomplete (I), or absent (A) neuronal loss (see Materials and Methods). This section, which passes through the left perirhinal cortex (PC), is located approximately 1.8 mm posterior to the anterior commissure. EC, entorhinal cortex; rs, rhinal sulcus. Scale bar = 0.46 mm.
Table 3 shows the damage index per perirhinal area and adjacent structures and per side, in each PR animal. Damage distribution is illustrated for two PR baboons in Fig. 3. In all five PR baboons, each perirhinal area was effectively damaged on both sides with only mild and inconsistent damage to the neighboring structures, except for the CA1 field of the rostral hippocampus and area TE at the borderline with area 36, which were partially damaged in most animals. Baboon PR5 showed the best lesion (damage indices of 42 and 51 for the right and left sides, respectively) with minimal extra damage, while PR2 had both the least extensive perirhinal cortex damage and the largest extra damage (Table 3). Within each perirhinal area, the deep neuronal layers were more damaged than the superficial layers, although the difference was minimal (see Fig. 2 for illustration). Globally, complete neuronal loss represented about 81% of the damaged volume (range, 55% to 90%). The average damage index across both sides for the entire perirhinal cortex was 28 (range, 8 to 47). This relatively limited damage is mainly due to the fact that, in PR1 and PR2, intended lesions did not include the most rostral perirhinal portion, which represents about 40% of the perirhinal cortex (range, 33% to 47%), and in the other baboons, this rostral portion was only slightly damaged (mean, 17; range, 0 to 32) because the rich vascularization in the rostral temporal cortex hindered many of the planned descents (see comments of analysis I for additional explanations). Comparison between perirhinal damage achieved in the rhinal and the present studies indicate that, except for the very rostral part of the perirhinal cortex, which was severely damaged, the remaining rostrocaudal part was slightly less damaged in the present investigation than in the Meguro et al. (1999) study.
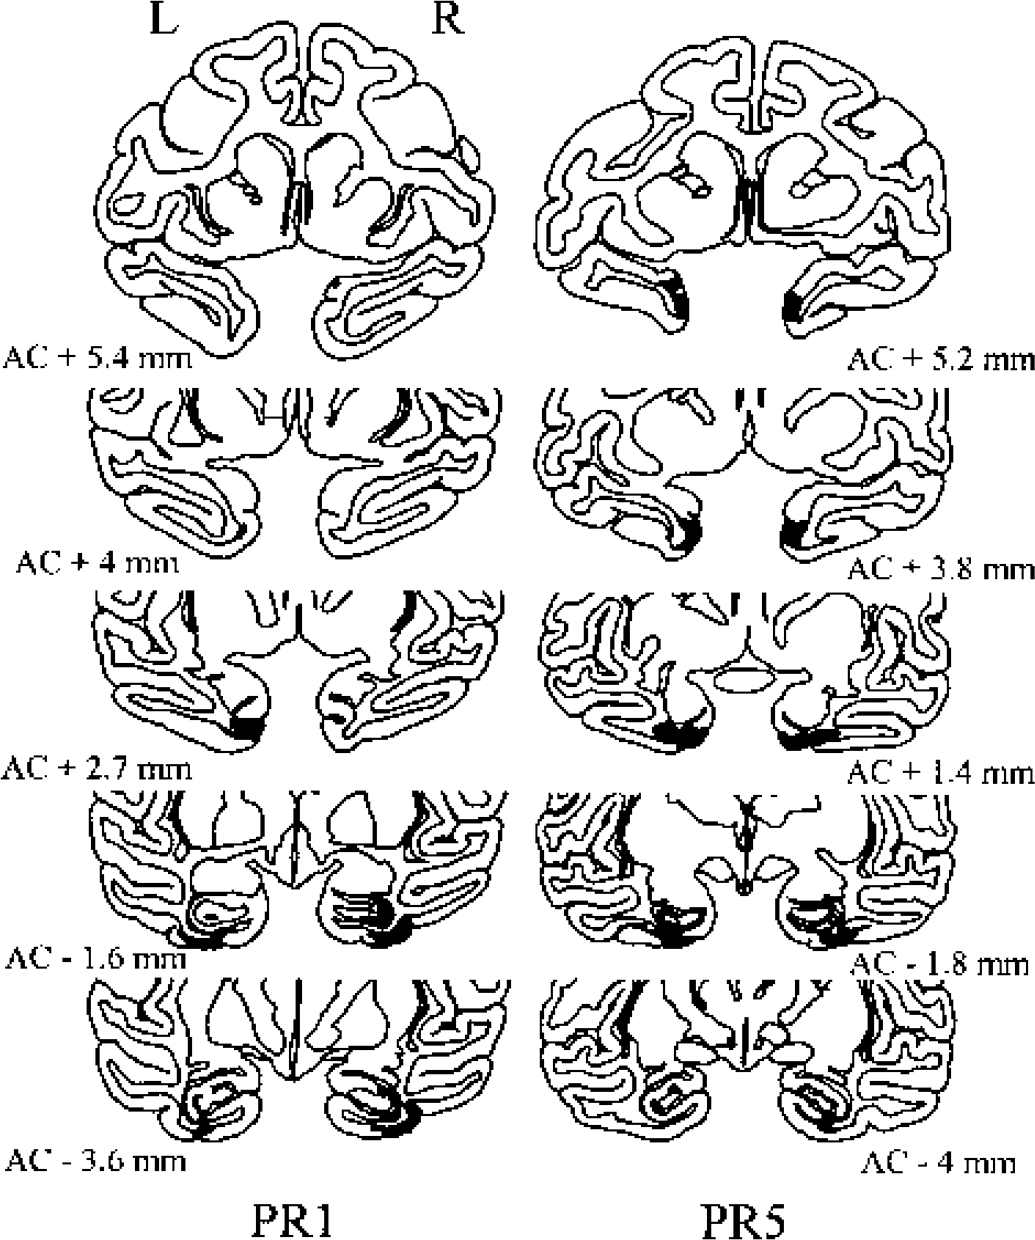
Illustration of damage extent on selected coronal sections of two baboons with excitotoxic perirhinal lesions (PR1 and PR5). The most rostral part of the perirhinal cortex was targeted and not targeted in PR5 and PR1, respectively. Darkened areas correspond to both complete and incomplete neuronal loss sectors (see Materials and Methods). The rostrocaudal level is indicated in millimeters from the anterior commissure (AC); R, right; L, left.
Damage indices for the perirhinal cortex (Brodmann areas 35 and 36) and nontargeted areas in the five perirhinal-lesioned baboons
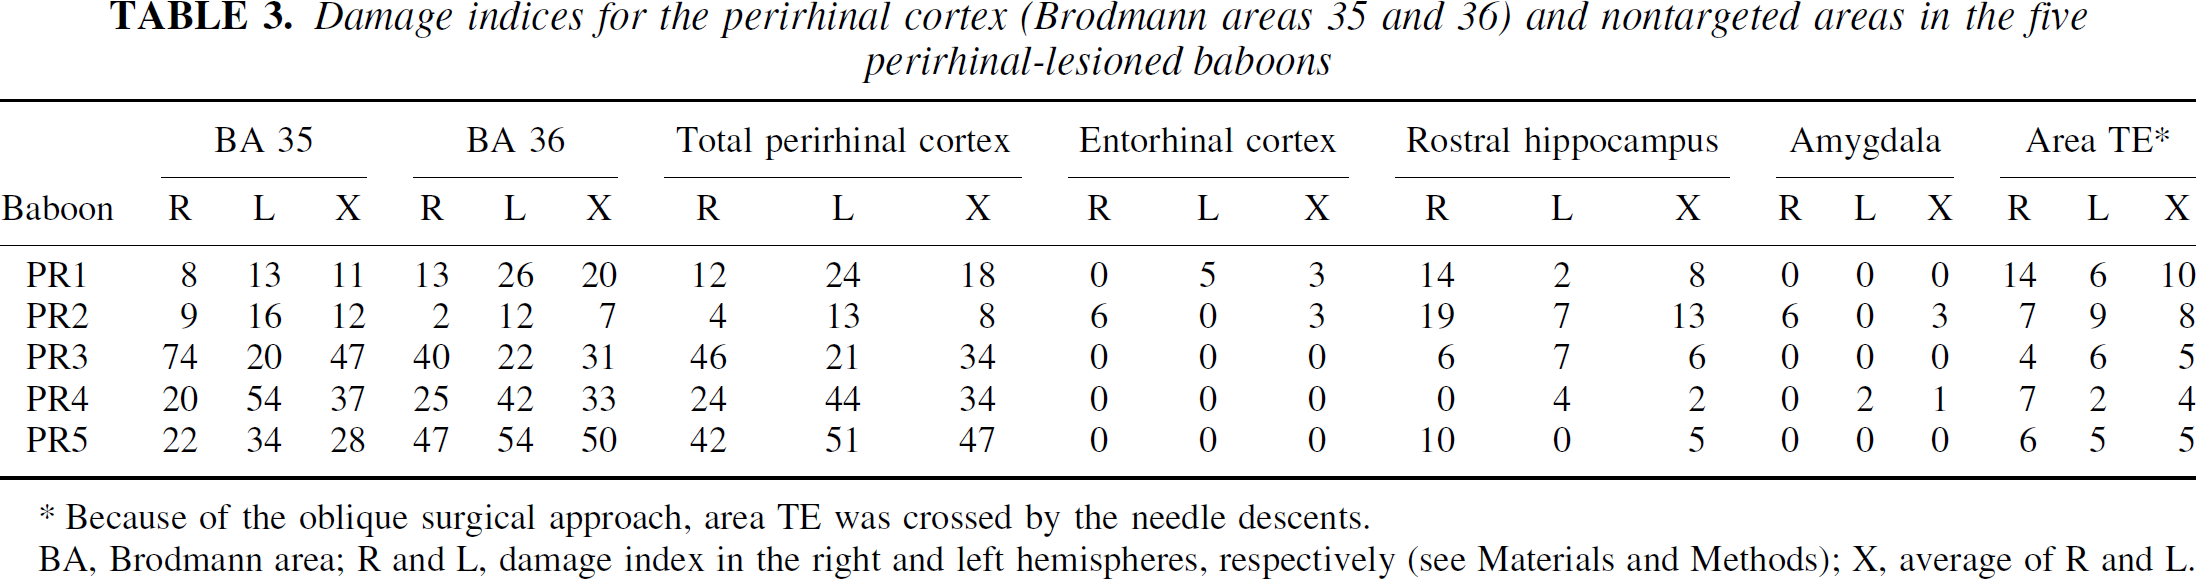
Because of the oblique surgical approach, area TE was crossed by the needle descents.
BA, Brodmann area; R and L, damage index in the right and left hemispheres, respectively (see Materials and Methods); X, average of R and L.
Statistical analyses
The statistical analyses were performed region by region on the absolute CMRglc values, which were averaged over both sides for the 16 bilateral ROIs (i.e., 12 and 4 for sets I and II, respectively). Statistical tests specific to each analysis (i.e., analysis I: PR vs. SPR baboons; analysis II: PR vs. RH baboons; and analysis III: PR vs. RH vs. SPR + SRH baboons) will be described later.
RESULTS
Analysis I: PR versus SPR baboons—the present perirhinal study
Specific statistical analyses
Firstly, a comparison of CMRglc values between the two PET devices was performed, by means of paired t-tests, across the PR and SPR groups on both presurgical data and on PET 4.5-month data in SPR3 (Table 1). Since this did not reveal any significant difference, the data from both PET devices were merged in all subsequent intergroup and correlative analyses. The global effects of perirhinal lesion were then assessed using region-by-region 2 × 6 (group x time) analyses of variance (ANOVAs) with time (i.e., baseline and postsurgical months 1, 1.5, 2.5, 4.5, and 10) as repeated measure. To maximize the data set, the CMRglc values for a given animal used in these ANOVAs were those obtained with the same PET device (see Table 1 for details), which occasionally resulted in missing values so that whole time points across animals or the entire data set for a given animal were excluded from the ANOVAs. Comparisons between the PR and SPR groups were also tested for each region and each time point by means of simple t-tests. The baseline CMRglc values used for this intergroup comparison were those obtained with the same PET device as that used for the ANOVAs.
Correlations between CMRglc values for each ROI on one hand, and damage index in each perirhinal area and the four adjacent structures on the other hand, were tested with Spearman tests across the five baboons of the PR group, this time differentiating the two sides of the brain to match histologic data. For each ROI, therefore, the correlation between CMRglc data and damage in a particular structure was conducted on 10 data pairs, two each per baboon (i.e., right-sided damage vs. right-sided CMRglc value, and left-sided damage vs. left-sided CMRglc value).
Cerebral metabolic rate of glucose results
Table 2 shows the mean ± SD CMRglc data for all regions, both sets and both PR and SPR groups, together with the results of t-tests (see Fig. 4 for an illustration of the time course of CMRglc in three typical ROIs). As expected, there was no significant difference in baseline CMRglc values between the PR and SPR groups for any of the regions investigated.
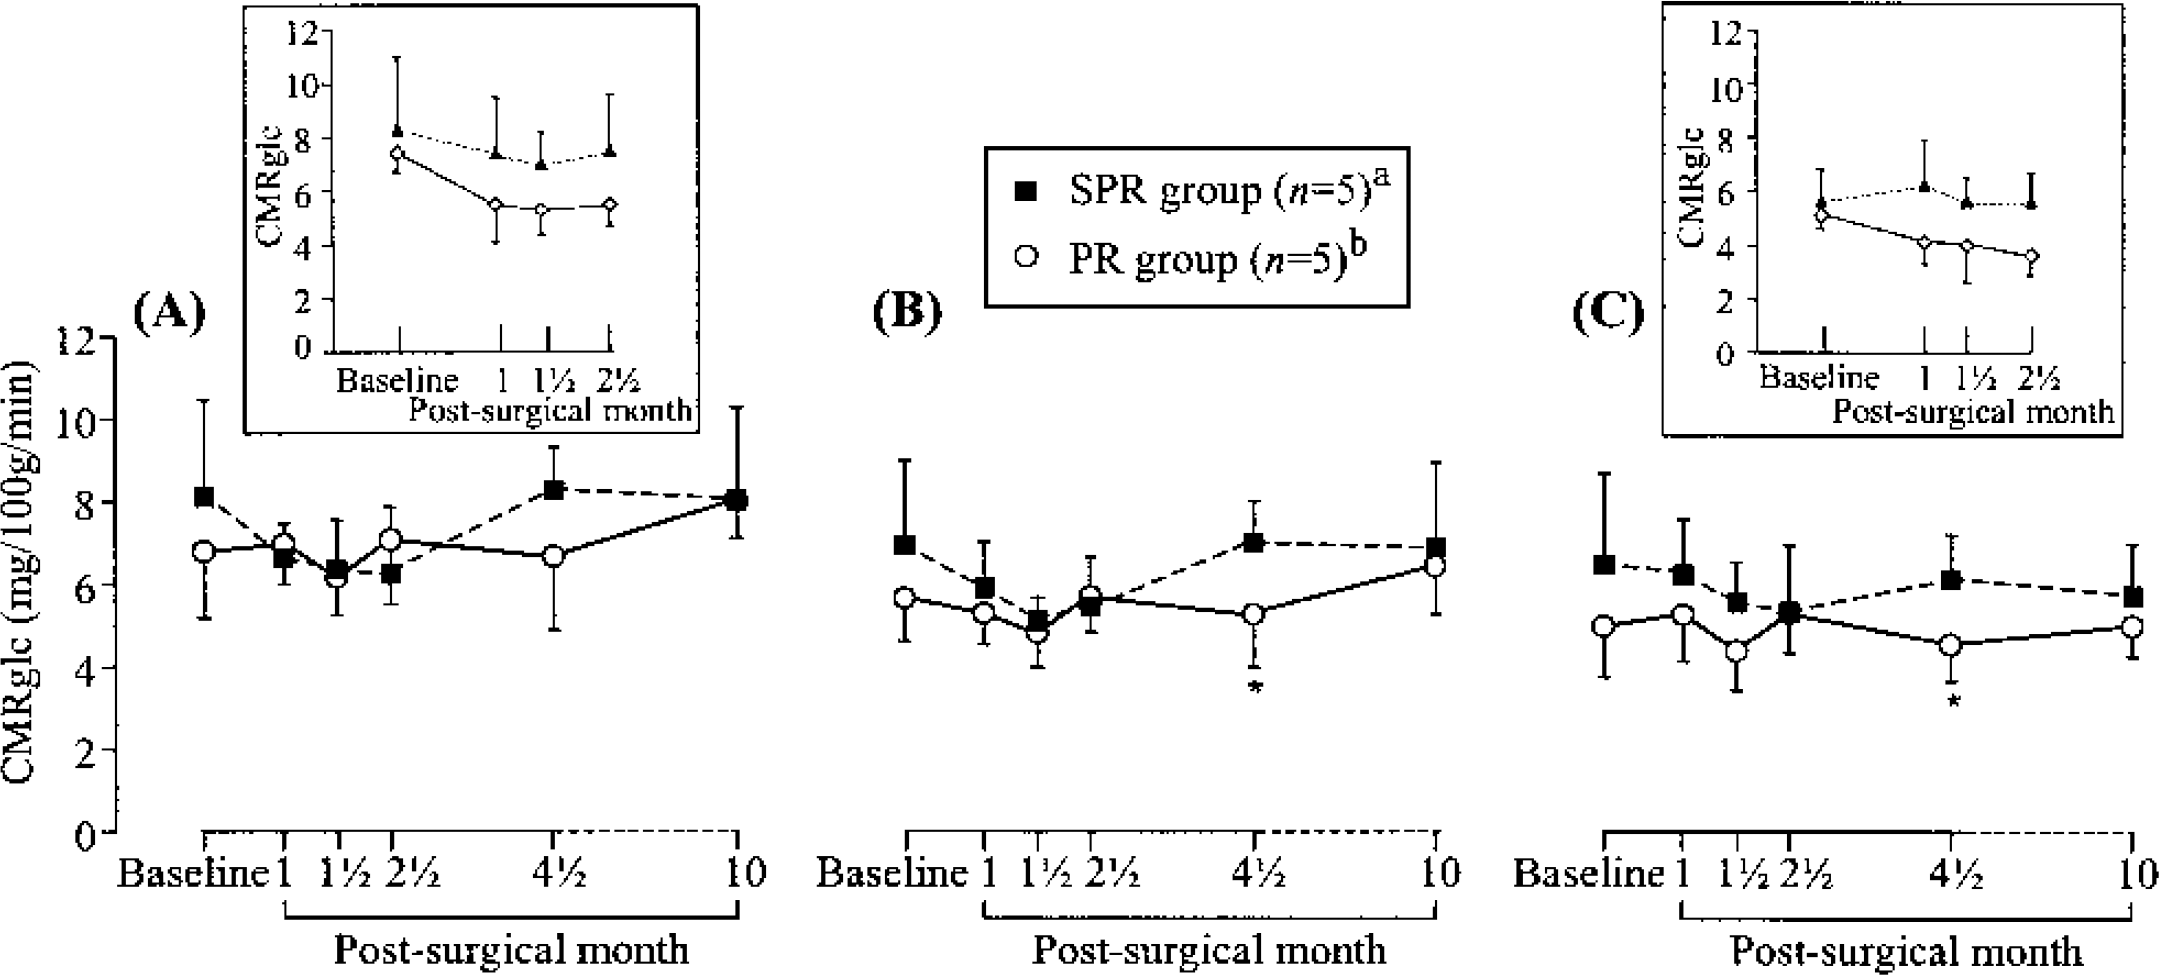
Time course of cerebral metabolic rate of glucose (CMRglc; mean ± SD), from baseline to month 10, in the anterior temporal cortex (
For technical reasons, two postsurgical CMRglc data sets were unavailable: month 1 for PR4 and month 1.5 for SPR1. According to our statistical plan, the region-by-region ANOVAs with time as repeated measure were thus performed on two different data set arrangements: (1) all 10 animals (two groups of five animals) and three time points (baseline, months 2.5 and 4.5; analysis Ia); and (2) five time points (baseline, months 1, 2.5,4.5, and 10) in eight baboons (PR1–PR3, PR5, SPR1, SPR2, SPR4, and SPR5; analysis Ib).
These ANOVAs (analyses Ia and Ib) revealed no significant effect of lesion and no significant interaction regardless of the ROI considered. However, as shown in Table 2, for set I, simple t-tests by region (n = 12) and time point (n = 5) revealed significant CMRglc declines in the PR group in 3 regions (out of the 60 tests; i.e., 5%) at 4.5 months, which concerned the dorsolateral prefrontal (P < 0.04) and sensorimotor (P < 0.03) cortices, as well as the anterior hippocampus (P < 0.04). For set II, significant CMRglc declines in the PR group were found in two out of the four regions investigated, namely the anterior temporal cortex (P < 0.05), at 4.5 months, and the occipital association area (P < 0.01) at 1.5 month (i.e., 10% out of the 20 tests).
Perirhinal damage-cerebral metabolic rate of glucose correlations
For the correlative analyses with the damage index (Table 4), we used the CMRglc values obtained at the time point nearest to euthanasia (i.e., month 10). Regarding perirhinal damage, out of the 32 correlations tested (i.e., 12 + 4 ROIs [sets I and II, respectively] x 2 damage indices [BA 35 and 36]), 6 (19%) were statistically significant (P < 0.05), all but one being in the neurobiologically expected direction (i.e., the more severe the perirhinal damage, the lower the CMRglc). Four concerned BA 35, in which the damage index correlated with CMRglc negatively in the anterior temporal (both sets) and inferior parietal (set I) cortices, and positively in the posterior temporal cortex (set I only). The other two significant correlations were negative and concerned damage index for BA 36 and CMRglc in the anterior temporal and occipital association (trend at P = 0.05) cortices (set II only). Typical correlations between the damage index for each perirhinal area and CMR glc values are illustrated for two regions in Fig. 5. In contrast to these findings concerning perirhinal damage, no significant correlation was found between damage index in the four adjacent structures and CMRglc for any region.
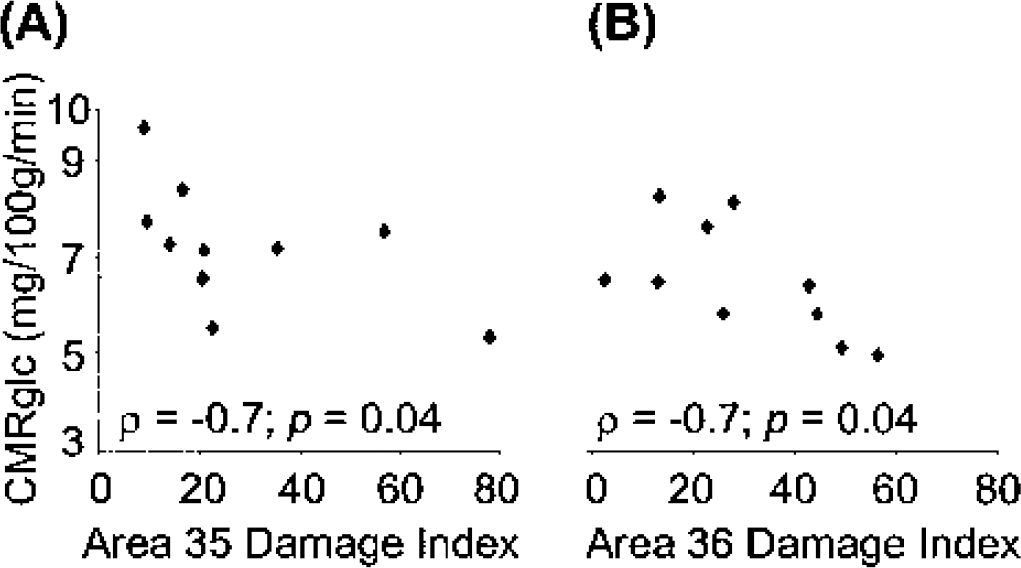
Illustration of typical correlations between histologic perirhinal damage index and cerebral metabolic rate of glucose (CMRglc).
Spearman's correlations (P < 0.1) between cerebral metabolic rate of glucose values in perirhinal-lesioned group and damage index in perirhinal areas
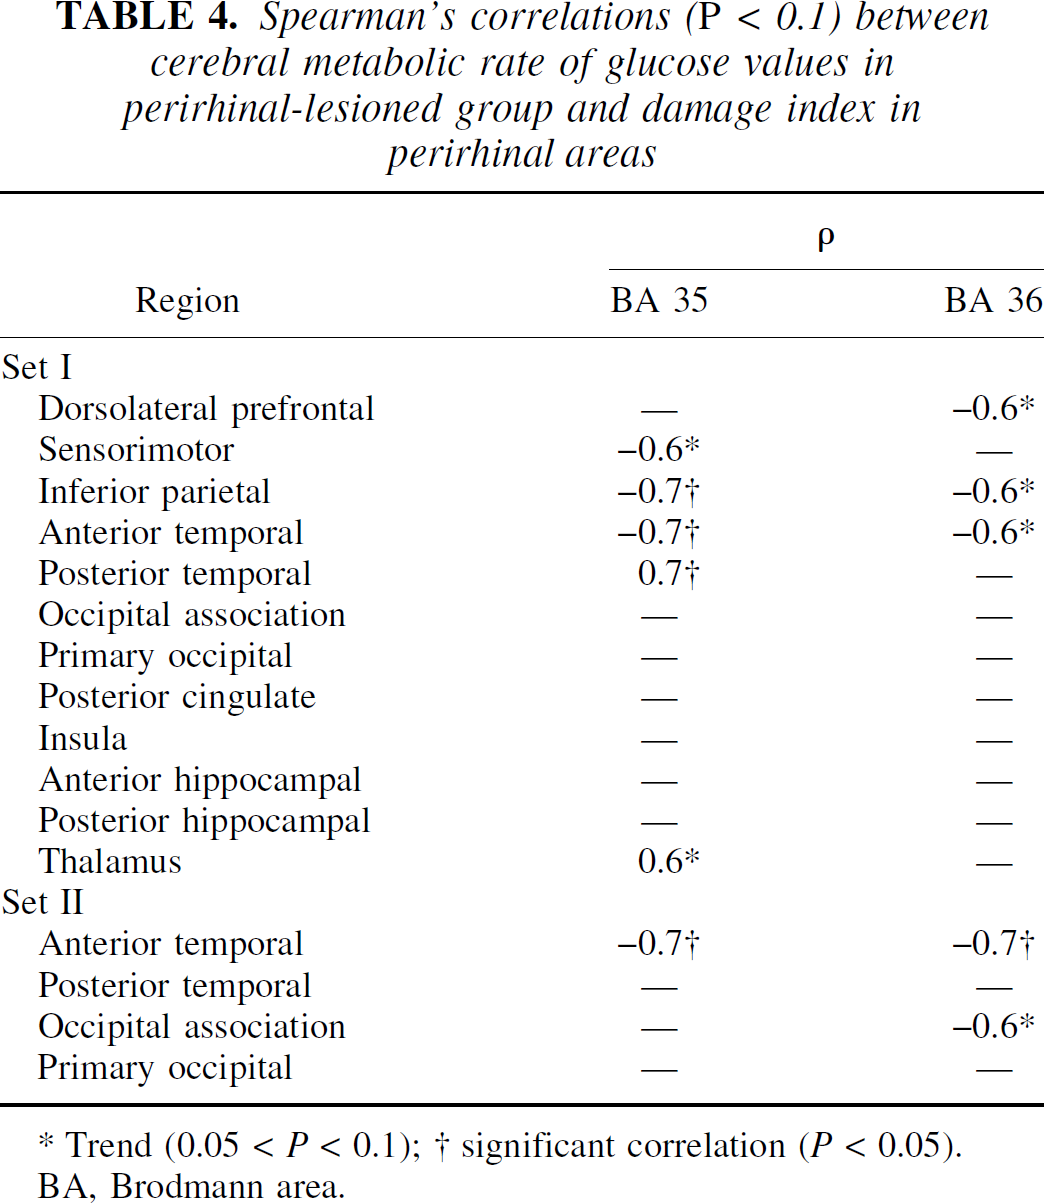
Trend (0.05 < P < 0.1); † significant correlation (P < 0.05).
BA, Brodmann area.
Comments
The present results show that excitotoxic lesions of the perirhinal cortex lead to CMRglc decreases that were significant in five brain regions only, and at an essentially late time point (all but one occurred 4.5 months after surgery), which contrasts with the more extensive and sustained hypometabolism observed after lesions of both the entorhinal and perirhinal areas (Meguro et al., 1999). As in the latter report, the damage, restricted here to the perirhinal cortex, was not consistently severe, but one advantage of this is that it allowed for meaningful correlations with histologic damage, which showed that the CMRglc values of two of the five hypometabolic regions as well as two additional regions significantly correlated with the degree of perirhinal damage.
Only the main methodological issues and short comments concerning the metabolic effects will be addressed here (see Discussion for implications concerning AD, aging, and connectivity). Some methodological considerations already discussed extensively in the study by Meguro et al. (1999) also apply to the present study, especially the small sample inherent to studies in nonhuman primates, which obviously hinders sensitivity but is compensated by the correlative analysis.
Regarding the severity of perirhinal damage, although it appears to be less here than in other studies with excitotoxic lesions in the rhinal cortex (Baxter and Murray, 2001; Màlkovà et al., 2001; Meguro et al., 1999), several aspects of the experimental procedure indicate that this difference is more apparent than real. First, contrary to most earlier studies, our damage index included the most rostral part of the perirhinal cortex (Blaizot et al., 2001), which represents about 40% of the total perirhinal volume; also note that this rostral part was not targeted in our first two PR baboons and was only slightly damaged in the other three PR baboons. Second, contrary to previous excitotoxic lesion studies, we distinguished complete from incomplete neuronal loss so as to optimally estimate the damage extent. Without these two particularities for damage assessment, the mean perirhinal damage index would have been of 43 ± 18 as compared with 28 ± 15 here, as shown in Table 3. Thanks to this rigorous methodology, the significant correlations found between CMRglc and damage indices are more likely to reflect true relations between both features. Obviously, the variable degree of damage across the PR group was also instrumental to reveal such correlations.
To reduce partial volume effects and improve sensitivity to CMRglc changes, improved delineation for the temporal and occipital ROIs was implemented in the present study. Consistent with this goal, significant lesion-induced hypometabolism of the anterior temporal and occipital association cortices was found only using set II (i.e., the data set with these novel ROIs; see Materials and Methods), with the CMRglc values for both regions being significantly correlated with perirhinal damage index. Because of these findings and for the sake of clarity, only the data from set II will be addressed in Discussion regarding the four brain regions common to both sets.
Concerning the metabolic effects of the selective perirhinal lesions, two main issues should be addressed before discussing the significant effects observed in the present study. The first is the somewhat unexpected lack of significant hypometabolism at early time points (i.e., up to 2.5 months after surgery), which contrasts with that observed after rhinal lesions (Meguro et al., 1999). Although it seems obvious that damage to both entorhinal and perirhinal areas would have more deleterious effects than perirhinal damage alone, direct comparison between baboons with perirhinal and rhinal lesions could help to specify the contribution of the perirhinal damage. To this aim, CMRglc values from both groups were compared at 1 and 2.5 months after surgery (see analysis II). Data at 1.5 months were not considered because of the possible distortion in the results due to the different PET devices used in each group (i.e., TTV03 for the RH group as compared to HR+ for the PR group; see Materials and Methods). Second, the statistical validity of the significant hypometabolism observed at 4.5 months could be questioned, since these perirhinal effects appear at this single time point. Reliability of our data was, therefore, further tested by comparing the CMRglc values in PR, RH, and sham-operated animals, and by pooling the data from both the present perirhinal and previous rhinal studies for the sham-operated animals to increase sensitivity (see analysis III). Note that these late data were unavailable at the time of the Meguro et al. (1999) report, and that data from set II were not available in both RH and SRH groups, so that analysis II and III were performed on set I data only. Finally, no interstudy comparison could be performed at 10 months after surgery since the latest time point assessed after rhinal lesions was 4.5 months (Blaizot et al., 1997). The disappearance of the perirhinal effects at 10 months will, thus, be addressed in Discussion.
Analysis II: PR versus RH baboons
Specific statistical analyses
Metabolic effects of selective perirhinal lesions were compared to those reported after lesions of both rhinal areas in the Meguro et al. (1999) study, by means of region-by-region 2 × 2 (group x time) ANOVAs with time (i.e., postsurgical months 1 and 2.5) as repeated measure. Post hoc analyses were computed with t-tests. Before this analysis, the lack of significant difference in baseline CMRglc values between the RH and PR groups was tested and confirmed by simple t-tests for all regions investigated (data not shown).
Cerebral metabolic rate of glucose results
Only 8 baboons were included in the analysis (RH1, RH3–RH5, PR1–PR3, and PR5) because of missing values in RH2 (month 2.5) and PR4 (month 1). Table 5 shows the mean ± SD CMRglc data for the 12 regions analyzed and both groups, together with the statistical findings, including Bonferroni correction for post hoc multiple tests. The ANOVAs revealed significant group-effects only, in half of the regions investigated. Post hoc tests showed that these results were due to significantly lower CMRglc values in the RH than in the PR group at both time points for three regions, and at 2.5 months only for two other regions.
Regional cerebral metabolic rate of glucose values in the 12 brain regions from set I in perirhinal-lesioned and rhinal-lesioned groups (n = 4 per group) at 1 and 2 ½ months after surgery, and corresponding statistical findings (analysis II)
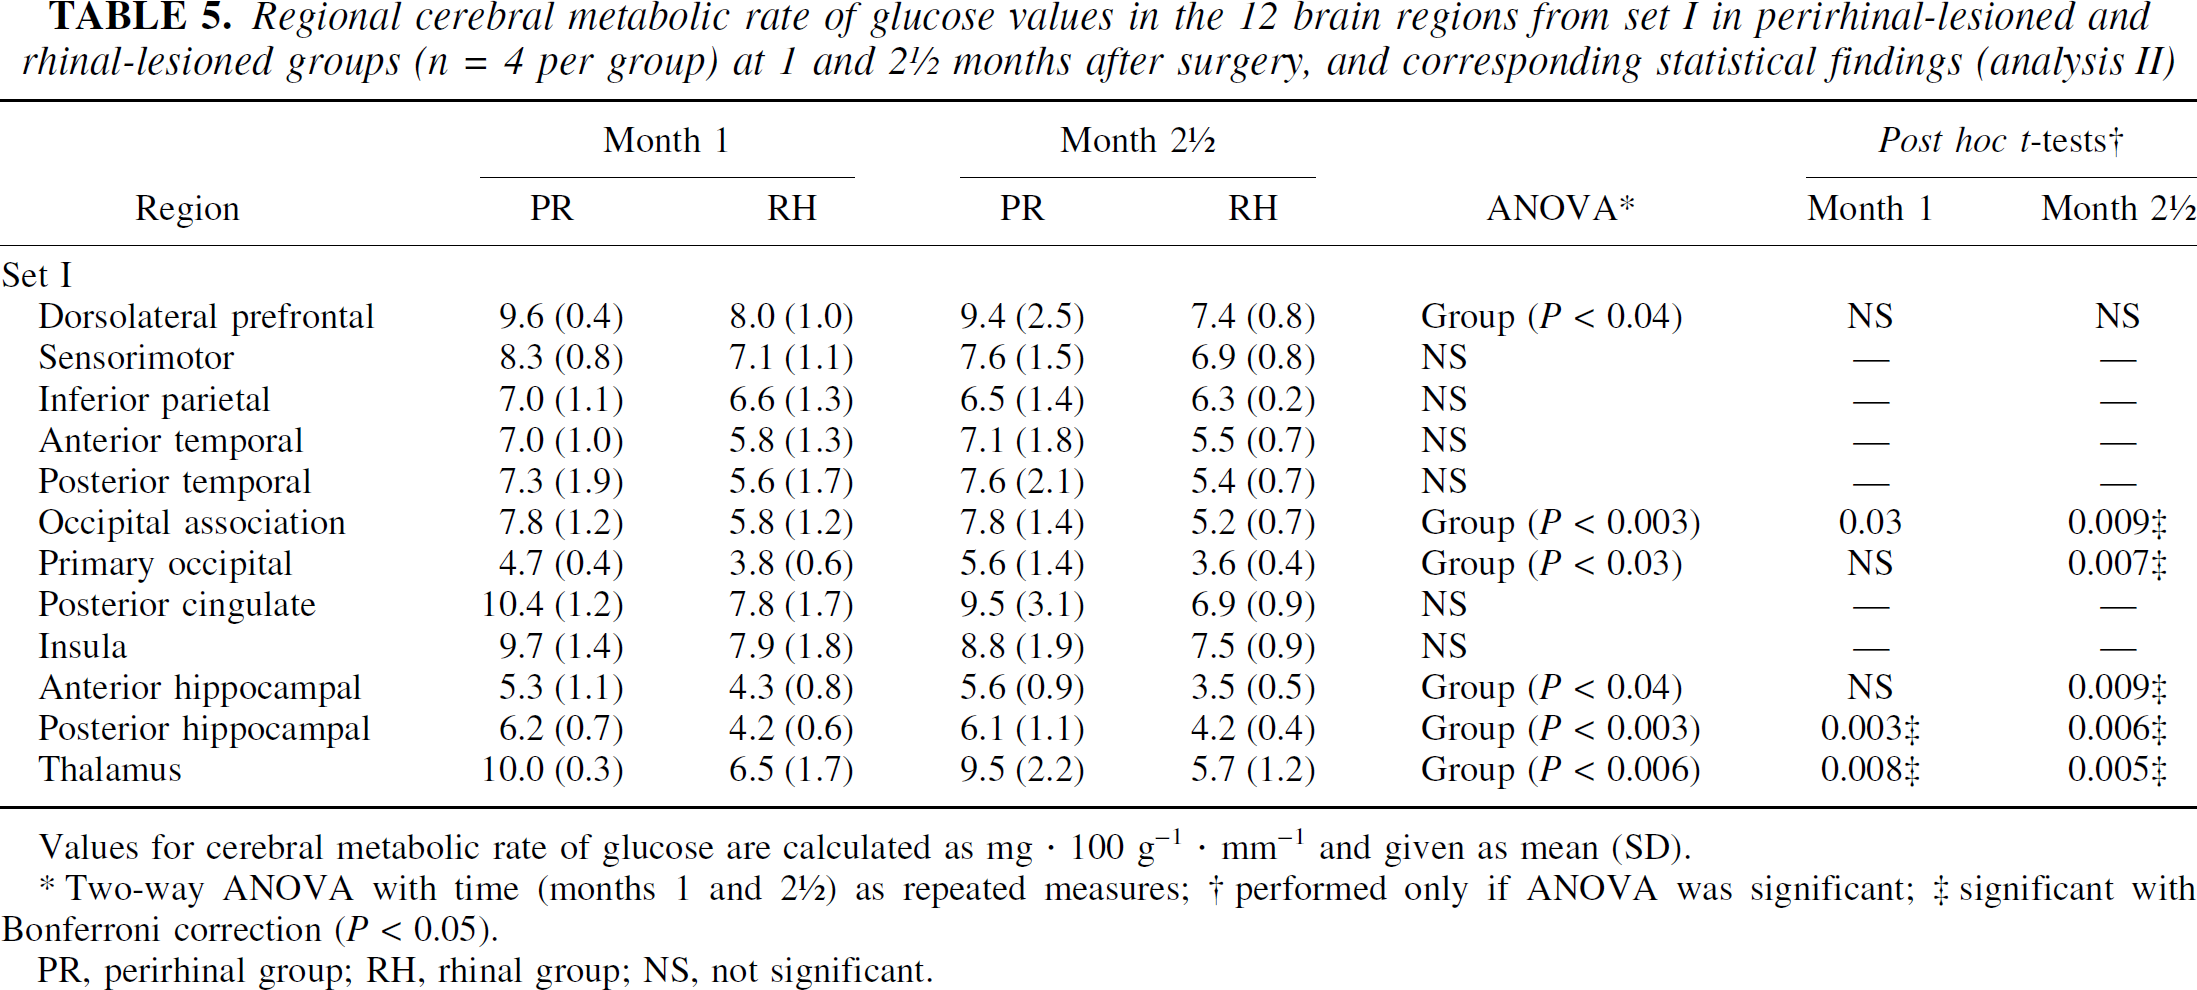
Values for cerebral metabolic rate of glucose are calculated as mg · 100 g−1 · mm−1 and given as mean (SD).
Two-way ANOVA with time (months 1 and 2 ½) as repeated measures; † performed only if ANOVA was significant; ‡ significant with Bonferroni correction (P < 0.05).
PR, perirhinal group; RH, rhinal group; NS, not significant.
Comments
The significantly lower CMRglc values after rhinal lesions compared with perirhinal lesions are in agreement with the expected contribution of entorhinal damage to the hypometabolism reported after lesions of both rhinal areas. First, there exist specific neocortical and hippocampal deafferentations after entorhinal damage (Meguro et al., 1999). In addition, because both the entorhinal and perirhinal cortices have reciprocal connections and common output structures (Suzuki, 1996a), it is conceivable that lesions of both rhinal areas may lead to synergetic effects on CMRglc decline, as compared with lesions of the perirhinal cortex alone, especially in regions such as the posterior hippocampus and the associative occipital cortex (significant intergroup difference at both time points), reported as hypometabolic after lesion of both rhinal areas (Meguro et al., 1999). These pieces of evidence would explain the non-detectable CMRglc decreases at these early time points after damage limited to the perirhinal cortex. Furthermore, the use of two different PET devices in the PR group, as compared with a single device in the RH group, may have been a source of underestimation of the metabolic effects of perirhinal damage. As the data from both devices were pooled in the PR group, we cannot rule out that this resulted in larger variance than in the Meguro et al. (1999) study, thus possibly preventing detection of potentially specific metabolic effects of the perirhinal lesion. This effect is clearly visible at 2.5 months (Table 5).
Furthermore, the lack of significant difference between RH and PR groups in some regions suggests the contribution of perirhinal damage to the significant CMRglc declines reported after lesions of both rhinal areas is not negligible (Meguro et al., 1999), especially in the inferior parietal and sensorimotor cortices (Table 5), where CMRglc correlated with perirhinal damage after combined perirhinal and entorhinal lesions (Meguro et al., 1999).
Analysis II, therefore, tends to confirm our hypothesis that combined entorhinal and perirhinal lesions lead to more severe hypometabolism than selective perirhinal lesions. The lack of significant difference between the two groups in some regions also suggests that the metabolic declines in the PR group, detected at a later time point with analysis I, may not be fortuitous.
Analysis III: PR versus RH versus SPR + SRH baboons
Specific statistical analyses
Comparison between CMRglc values from PR (n = 5), RH (n = 3), and sham-operated animals (named SH group after pooling from both studies; n = 9) was performed by means of region-by-region one-way ANOVAs with three groups at postsurgical month 4.5. Post hoc analyses were computed with t-tests.
Cerebral metabolic rate of glucose results
As shown in Table 6, CMR glc in the SH group was consistently higher than that of both the PR and RH groups. Unexpectedly, the RH group showed lower CMRglc values than the PR group in about half of the regions investigated, while the reverse was observed for the other half. The ANOVAs revealed a significant group effect in 5 out of the 12 regions tested. Post hoc tests showed that, compared to the sham-operated animals, CMRglc values were significantly lower in two regions in the RH group, and in four regions in the PR group. No significant difference was found between PR and RH groups.
Regional cerebral metabolic rate of glucose values in the 12 brain regions from set I in the perirhinal, rhinal and sham-operated groups at 4 ½ months after surgery, and corresponding statistical findings (analysis III)
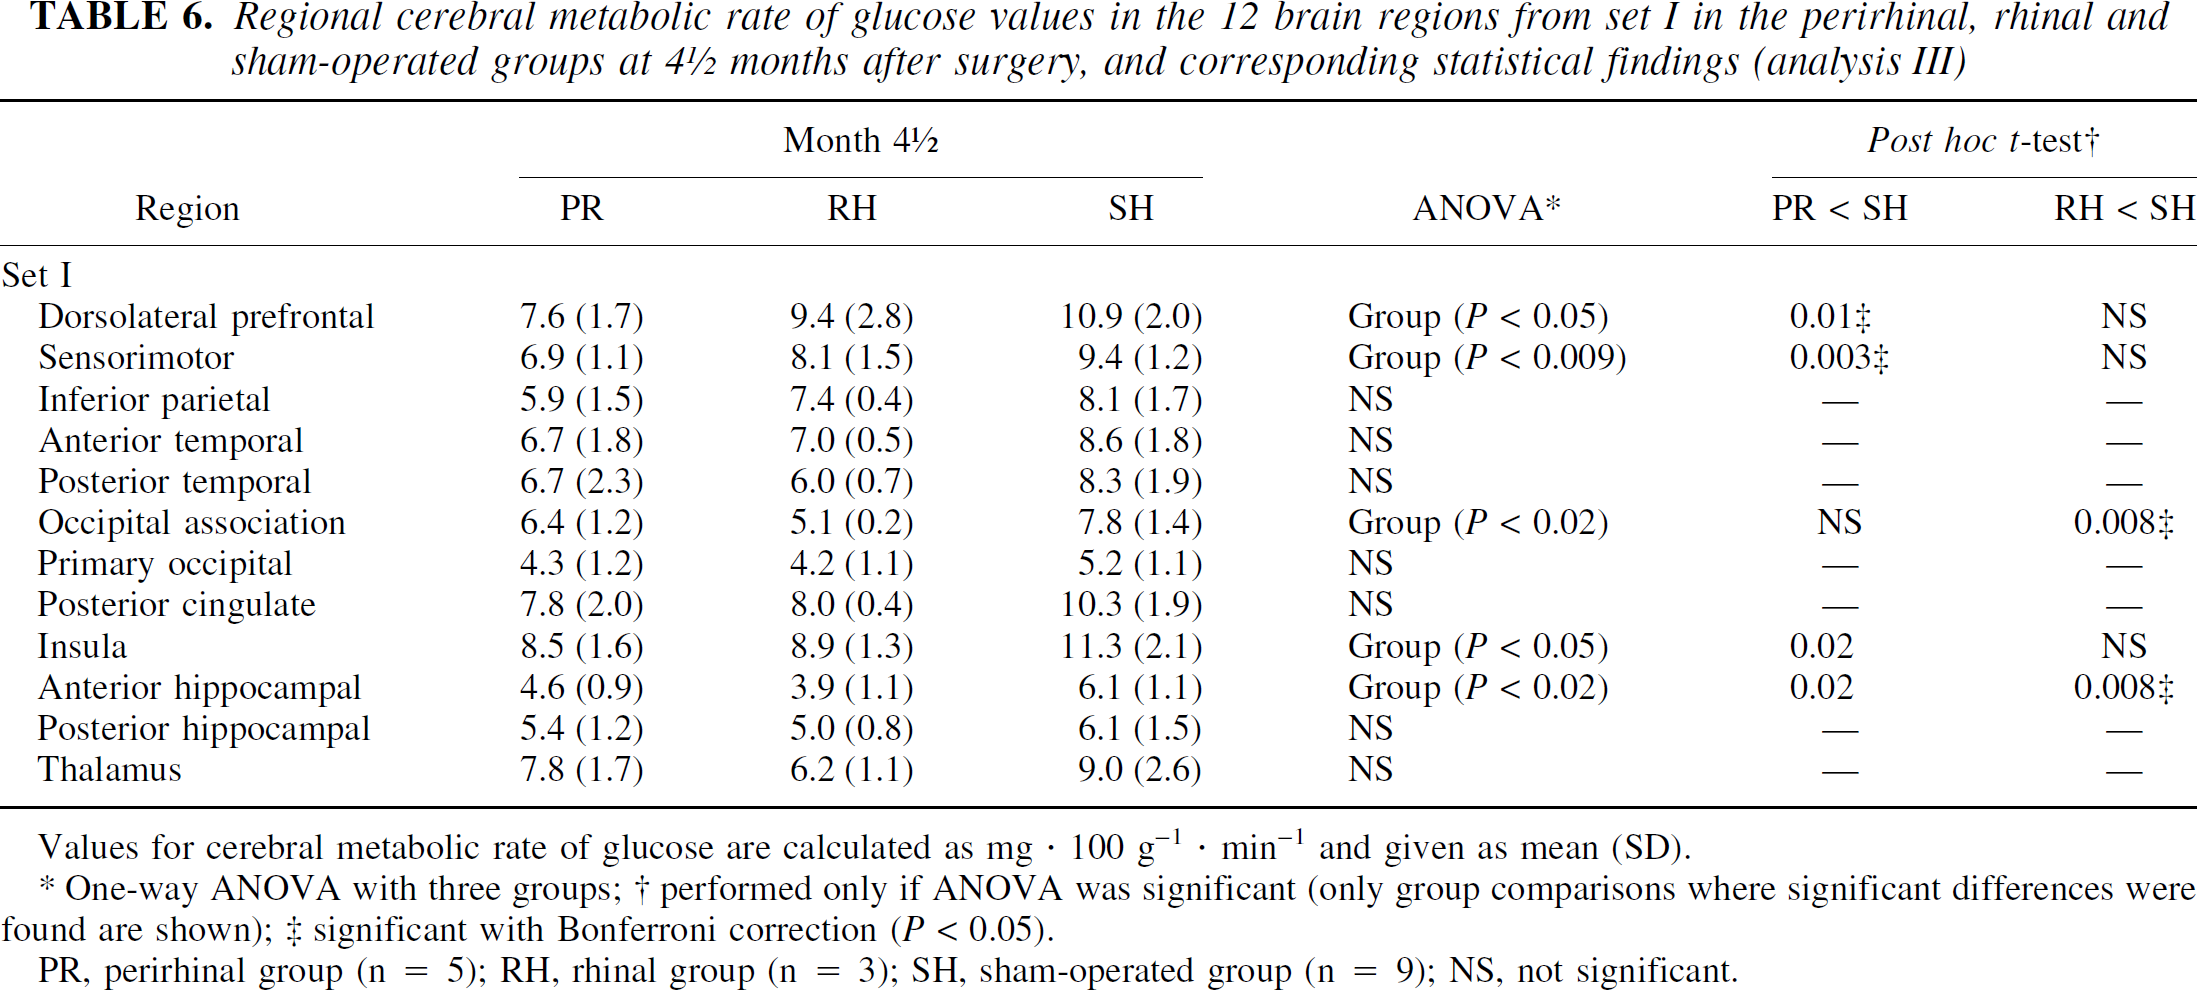
Values for cerebral metabolic rate of glucose are calculated as mg · 100 g−1 · min−1 and given as mean (SD).
One-way ANOVA with three groups; † performed only if ANOVA was significant (only group comparisons where significant differences were found are shown); ‡ significant with Bonferroni correction (P < 0.05).
PR, perirhinal group (n = 5); RH, rhinal group (n = 3); SH, sham-operated group (n = 9); NS, not significant.
Comments
By increasing the statistical power with higher number of sham-operated animals, the results of analysis III not only confirm but also strengthen the implication of perirhinal damage in the cerebral hypometabolism, as evidenced at month 4.5 with analysis I. Thus, besides the significant CMR glc decreases found in the three ROIs from set I, already detected with analysis I (i.e., the dorsolateral prefrontal and sensorimotor cortices, as well as in the anterior hippocampal region), and now more significant with analysis III, this latter analysis revealed a significant hypometabolism in the insula as well.
The surprisingly smaller number of significantly hypometabolic regions in the RH than in the PR group, as compared to the SH group, likely results from poor sensitivity from both the small number of RH baboons (n = 3 vs. n = 5 for the PR group) and the PET device with which the data were acquired. In addition, we cannot rule out that the slight differences in perirhinal damage distribution (e.g., the more rostral lesions in the PR than in the RH group) may partly account for this finding.
DISCUSSION
In this study, we found that bilateral excitotoxic lesions of the perirhinal cortex in the baboon induce a significant decrease in CMRglc in a few brain regions (5 of the 16 investigated), though not as sustained and extensive as that observed after lesions of both the entorhinal and perirhinal areas (Meguro et al., 1999). Interestingly, the CMRglc values of two of the five significantly hypometabolic regions, as well as of two additional regions, significantly correlated with the degree of perirhinal damage. Importantly, most of the regions, showing significant hypometabolism and/or significant CMRglc-perirhinal damage correlation, would be expected based on perirhinal cortex connectivity. Overall, therefore, our data converge to indicate that perirhinal cortex lesions alone are capable of inducing distant CMRglc reductions in connected cortical areas, though obviously less conspicuously so than combined perirhinal-entorhinal lesions.
After debating the transient metabolic effects observed after selective perirhinal lesions, the regional profile of our findings with analysis I will be discussed in terms of implications for AD, aging, and connectivity, and will be compared with the results obtained after lesions of both rhinal areas (Meguro et al., 1999, and analyses II and III).
We observed only late remote metabolic effects after perirhinal lesions as compared with the earlier and sustained cerebral hypometabolism found after lesions of both rhinal areas. Thus, analysis I showed that significant CMRglc declines in the PR group were not observed before the 4.5-month time point, except in the occipital association ROI, whereas it was observed as early as the 1-month time point after rhinal lesions (Meguro et al., 1999). As already mentioned in Comments regarding analysis II, which indicates that, at earlier time points (i.e., 1 and 2.5 months after surgery), CMRglc values in half of the regions investigated were significantly lower in RH than in PR groups, the more circumscribed intended damage in the present study, together with the synergism issue, are probably the main causes for undetectable early hypometabolism. Furthermore, the early recovery thought to take place after brain injury may be more effective after selective perirhinal than after more extensive rhinal lesions. Nevertheless, slight, although not significant, involvement of the perirhinal damage in the hypometabolism observed after rhinal lesions at these early time points may occur, as suggested by both the lower CMRglc values in PR as compared to SPR group (analysis I) and the nonsignificant difference in CMRglc between PR and RH groups (analysis II) in some brain areas.
The finding that the cerebral hypometabolism observed 4.5 months after perirhinal lesions was no longer detected 5 months later (i.e., 10 months after surgery) suggests that, after a period of stabilization of the effects induced by deafferentation, new effective compensatory mechanisms occur, especially in the hippocampus. We cannot rule out, however, that the transient effects observed in our study may be the consequence of the incomplete damage to the perirhinal cortex achieved in this protocol. Unfortunately, a formal comparison of the duration of the hypometabolism induced by selective perirhinal damage and combined entorhinal-perirhinal lesion would be impossible, since the latest postlesion time point assessed in the latter study was 4.5 months. Despite these transient effects of perirhinal damage, which were also reported after entorhinal lesions in rats (Beck et al., 1996; Hayashi et al., 1999), it remains that the hypometabolic pattern detected at 4.5 months does not seem fortuitous, as discussed below.
To facilitate the discussion of the regional metabolic effects, they will be classified according to two subgroups of regions, categorized with respect to both the present findings and their relationships with AD and aging. The first subgroup encompasses brain regions with expected “specific” effects after perirhinal lesions, whereas the second subgroup is made of regions with either less expected (or unexpectedly absent) metabolic effects. Note that the CMRglc-perirhinal damage correlations will be discussed without distinguishing the two BAs (i.e., 35 and 36), as some anatomic connections are common to both areas and others unknown.
The first subgroup of regions comprises the anterior temporal, inferior parietal, occipital association, and dorsolateral prefrontal cortices, as well as the anterior hippocampal region. These five regions showed significant hypometabolism and/or CMRglc-perirhinal damage correlation after perirhinal lesions.
Regarding the temporal cortex, both the significant CMRglc decline and the significant negative CMRglc-perirhinal damage correlation only concerned the anterior temporal ROI, which includes area TE. This rostrocaudal differentiation agrees with the denser connections between the perirhinal cortex and both area TE and the anterior part of area TEO, as compared to the posterior part of TEO (Suzuki and Amaral, 1994a). The fact that no significant hypometabolism of the anterior temporal cortex was observed after rhinal lesions (Meguro et al., 1999) presumably reflects partial volume effects with the ROI used for this work, as no significant effect of perirhinal lesions was found in this region when using the same ROI (i.e., set I, see analysis I).
Concerning the inferior parietal cortex, the CMRglc values significantly correlated with perirhinal damage, as found after rhinal lesions (Meguro et al., 1999), which is consistent with the dense connections of this cortical region with the caudal half of the perirhinal cortex (Insausti and Muñoz, 1999). The lack of significant hypometabolism in this study is in apparent conflict only with our earlier findings after rhinal lesions (Meguro et al., 1999), since the caudal part of the perirhinal cortex was more extensively damaged in the latter study. Moreover, the lack of significant difference between RH and PR groups with analysis II suggests that hypometabolism was present, albeit slightly marked only, in the PR group. This view is also supported by the trend for a significant group effect with ANOVA (P = 0.06) due to a significant hypometabolism in the PR group as compared with the larger SH group (P = 0.02) when performing post hoc test with analysis III (data not shown).
Regarding the occipital association cortex, we found a significant CMRglc decline after perirhinal lesions, with the CMRglc values significantly correlating with neuronal loss in the perirhinal cortex in both this study (P = 0.05) and in Meguro et al. (1999). It is therefore likely that hypometabolism in this region reflects true and indirect remote synaptic disruption following perirhinal damage, which would agree with the significantly lower CMRglc values in PR group as compared with SH group observed with analysis III.
A significant CMRglc decline, with a trend for a significant correlation with perirhinal damage (P = 0.07), was observed for the dorsolateral prefrontal ROI and confirmed with analysis III. Lesioning both rhinal areas induced a nonsignificant metabolic decline in this region, but the CMRglc significantly correlated with neuronal loss in the perirhinal cortex (Meguro et al., 1999). Few direct anatomic connections exist between the perirhinal and the dorsolateral prefrontal cortices, mainly originating from the fundus of the rhinal sulcus (Goldman-Rakic et al., 1984; Insausti and Muñoz, 1999; Suzuki and Amaral, 1994a), which was accurately damaged in the present study. Indirect connections are dense, however, especially via TE (Webster et al., 1994). Thus, both these direct and indirect perirhinal-dorsolateral prefrontal connections may have important functional roles. Although it is well established that the perirhinal cortex is involved in visual recognition memory (Brown and Aggleton, 2001; Murray and Richmond, 2001; Suzuki, 1996b), our findings would be consistent with growing evidence that it also plays a role in working memory (Davachi and Goldman-Rakic, 2001; Miller et al., 1991), a function in which the dorsolateral prefrontal cortex is heavily involved (Goldman-Rakic, 1987; Petrides, 2000).
Regarding the hippocampal region, the significant CMRglc decline after perirhinal lesions, restricted here to the anterior ROI, is consistent with the anatomic connections between the perirhinal cortex and the respective structures encompassed in the anterior and posterior hippocampal ROIs. Thus, each intended ROI comprised parts of the hippocampus directly connected to the perirhinal cortex (Insausti and Muñoz, 2001; Insausti et al., 1987; Suzuki and Amaral, 1990; Yukie, 2000), whereas the anterior hippocampal ROI additionally included the amygdala, which has dense connections with the perirhinal cortex (Saunders and Rosene, 1988; Stefanacci et al., 1996). These results, confirmed by analysis III, are similar to those found after combined lesions of the entorhinal and perirhinal cortices (Meguro et al., 1999; analysis III).
In AD, the temporal, parietal, and occipital association cortices are classically known to exhibit glucose hypometabolism (Cutler et al., 1985; Foster et al., 1999; Kumar et al., 1991; Mielke et al., 1994; Rapoport, 1991). The prefrontal region is also hypometabolic in AD, though usually at a more advanced stage (Foster et al., 1999). Concerning the hippocampal region, discrepant findings have been reported, with lack of hypometabolism usually attributed to methodological issues (Baron and Godeau, 2000). Significant hippocampal hypometabolism, however, has been more consistently reported in recent studies (De Santi et al., 2001; Ouchi et al., 1998).
Regarding aging, while the NFTs involve initially the perirhinal cortex and then the entorhinal cortex (Braak and Braak, 1991; Delacourte et al., 1999), each of the five regions discussed previously, apart from the occipital association cortex, show declining glucose consumption with age. The prefrontal region is the most consistently affected (Baron and Godeau, 2000; De Santi et al., 1995; Hoffman et al., 1989), and a correlation between the CMRglc in this region and memory performance across age has been reported (Baron and Godeau, 2000; Baron et al., 1997; de Leon et al., 2001). A metabolic decline in the hippocampus with aging is a less consistent finding, but has also been reported in recent voxel-based PET studies (Baron and Godeau, 2000). Therefore, the finding of reduced glucose consumption in both the prefrontal cortex and the hippocampal region in both aging and baboons with perirhinal lesions would suggest that the inconsistent observation of hypometabolism in these two brain regions in AD may reflect the presence of reduced CMRglc already in the healthy aged controls.
The second subgroup of regions comprises two regions, namely, the sensorimotor and the posterior cingulate cortices, which showed less expected findings.
The sensorimotor cortex was significantly hypometabolic here (with both analysis I and III), as also reported after rhinal lesions (Meguro et al., 1999). In addition, there was a correlation between sensorimotor cortex CMRglc and perirhinal cortex damage both previously after entire rhinal lesions (Meguro et al., 1999) and here after lesion of the perirhinal cortex alone (P = 0.07). Although the interpretation for this finding remains unclear, the data suggests that we are dealing with specific effects of the lesion. While this region is largely spared metabolically in early AD, it is affected both in more advanced AD (Cutler et al., 1985; Kumar et al., 1991; Rapoport, 1991) and in normal aging (McGeer et al., 1990; Moeller et al., 1996). Our findings, therefore, suggest that perirhinal cortex pathology may contribute to these metabolic alterations.
The other somewhat unexpected finding was the lack of metabolic effects of perirhinal lesions in the posterior cingulate cortex, a region affected very early in AD (Minoshima et al., 1997). This contrasts with findings after extensive rhinal lesions, where CMRglc in the posterior cingulate cortex was significantly reduced and correlated with perirhinal neuronal loss (Meguro et al., 1999). Isolated damage to the perirhinal cortex, therefore, which has mostly indirect connections with the posterior cingulate cortex, would appear in itself unable to induce this distant metabolic effect, which would be consistent with the trend for a significant difference between RH and PR groups with analysis II (P = 0.06). We believe that entorhinal cortex damage would contribute substantially to the hypometabolism found in this region in AD, probably via synergetic effects from perirhinal damage, since there exist major interconnections between both rhinal areas (Suzuki and Amaral, 1994b) as well as direct connections between the entorhinal cortex and the posterior cingulate cortex (Suzuki, 1996a). This hypothesis would be consistent with the lack of hypometabolism in the posterior cingulate cortex in aging (Baron and Godeau, 2000; Hoffman et al., 1989), where the entorhinal cortex is only mildly affected by the NFTs (Delacourte et al., 1999; Price and Morris, 1999), contrasting with the severe entorhinal damage present in early AD.
CONCLUSIONS
Overall, our data suggest that, although damage to the perirhinal cortex does induce metabolic effects in connected areas and hence likely contributes to the hypometabolism found in AD, it is insufficient to induce the severe and sustained metabolic changes that we observed previously after damage to both rhinal areas. It remains, however, unclear whether isolated destruction of the entorhinal cortex would explain most of the metabolic effects detected after extensive rhinal lesions, or whether combined entorhinal and perirhinal lesions are required. Taken together with the severe visual recognition memory impairment observed in the baboons with perirhinal lesions of the present study (Millien et al., 1999), perirhinal damage would strongly contribute to the memory deficit observed in AD, but to a lesser extent to the glucose hypometabolism classically reported in this neurodegenerative disease.
Interestingly, although the transient effects of perirhinal damage suggest that, in contrast to rhinal lesions, either more severe local damage or associated brain damage is required for enduring hypometabolism, the metabolic profile observed 4.5 months after selective perirhinal lesions appears closer to that observed in healthy human aging than in early AD. Indeed, as in aging but in contrast to early AD, perirhinal damage in baboons resulted in significant prefrontal cortex hypometabolism, whereas the posterior cingulate cortex was unaffected. These findings would be consistent with (1) selective perirhinal damage, which better mimics NFTs topography of healthy aged subjects; (2) the fact that only the entorhinal cortex has dense direct connections with the posterior cingulate cortex; and (3) the finding of significant prefrontal hypometabolism in late AD only.
Footnotes
Acknowledgements
The authors thank A. Brocquehaye, M. H. Noel, and N. Jacques for technical support; B. Landeau, Drs. D. Ochoa and A. Young for their precious contribution and helpful advice regarding PET, surgery, and histology; and the PET camera and cyclotron teams, Dr. L. Barré, and the radio-chemistry technicians.