
Abstract
Using autoradiographic image-averaging strategies, we studied the relationship between local glucose utilization (LCMRglc) and blood flow (LCBF) in a highly reproducible model of transient (2-hour) middle cerebral artery occlusion (MCAO) produced in Sprague-Dawley rats by insertion of an intraluminal suture coated with poly-L-lysine. Neurobehavioral examination at 60 minutes after occlusion substantiated a high-grade deficit in all animals. In two subgroups, LCBF was measured with 14C-iodoantipyrine at either 1.5 hours of MCAO, or at 1 hour of recirculation after suture removal. In two other matched subgroups, LCMRglc was measured with 14C-2-deoxyglucose at 1.5 to 2.25 hours of MCAO, and at 0.75 to 1.5 hours of recirculation after 2 hours of MCAO. Average image data sets were generated for LCBF, LCMRglc, and the LCMRglc/LCBF ratio for each study time. Middle cerebral artery occlusion for 2 hours induced graded LCBF decrements affecting ipsilateral cortical and basal ganglionic regions. After 1 hour of recirculation, LCBF in previously ischemic neocortical regions increased by 40% to 200% above ischemic levels, but remained depressed, on average, at about 40% of control. By contrast, frank hyperemia was noted in the previously ischemic caudoputamen. Mean cortical LCBF values during MCAO correlated highly with their respective LCBF values after 1 hour of recirculation (R = 0.93), suggesting that postischemic LCBF recovery is related to the depth of ischemia. Despite focal ischemia, LCMRglc during ~2 hours of MCAO was preserved, on average, at near-normal levels; but following ~1 h of recirculation, LCMRglc became markedly depressed (on average, 55% of control in previously densely ischemic cortical regions). Regression analysis indicated that this depressed glucose utilization was determined largely by the intensity of antecedent ischemia. By pixel analysis, the ischemic core (defined as LCBF 0% to 20% of control) comprised 33% of the ischemic hemisphere, and the penumbra (LCBF 20% to 40%) accounted for 26%. The penumbra was concentrated at the coronal poles of the ischemic lesion and formed a thin shell around the central ischemic core. During 2 hours of MCAO, the LCMRglc/LCBF ratio within the ischemic penumbra was increased four-fold above normal (average, 179 umol/100 mL). In marked contrast, after ~1 h recirculation, this uncoupling had almost completely subsided. The companion study (Zhao et al., 1997) further analyzes these findings in relation to patterns of infarctive histopathology.
Keywords
Graded decrements in cerebral perfusion in the focally ischemic brain set into motion a complex sequence of pathophysiological events, which are sensitively reflected in local alterations of cerebral glucose utilization (LCMRglc), blood flow (LCBF), and the interrelationship between metabolism and flow—variables that are readily amenable to quantitative analysis by autoradiographic methods (Sakurada et al., 1978; Sokoloff et al., 1977; Zhao et al., 1995). The complete characterization of the pathophysiological processes leading to brain injury in cerebral ischemia is greatly aided by the use of consistent animal models having a high degree of interanimal reproducibility (Ginsberg, 1996; Ginsberg and Busto, in press). This is particularly the case in models of focal ischemia produced by selective arterial occlusion, in which differences in rat strain (e.g., spontaneously hypertensive versus normotensive strains) as well as in the site, extent, and technique of vascular occlusion all appear to exert important influences on lesion size, location, and consistency (Coyle, 1986; Brint et al., 1988; Duverger and MacKenzie, 1988; Markgraf et al., 1993).
In recent years, several groups have developed methods of transient or permanent middle cerebral artery occlusion (MCAO) in rodents by the insertion of an intraluminal suture filament into the artery (Koizumi et al., 1986; Nagasawa and Kogure, 1989; Zea Longa et al., 1989). These models have been widely applied in the rat to study a variety of ischemia-related problems, such as the time-course of neuronal changes (Bartus et al., 1995; Garcia et al., 1995), neurological deficit (Garcia et al., 1995), local cerebral blood flow (Nagasawa and Kogure, 1989; Memezawa et al., 1992a, 1992b), tissue energy state (Folbergrová et al., 1992), gene expression (Kinouchi et al., 1994; Kokaia et al., 1995; Iadecola et al., 1996), apoptosis (Li et al., 1995; Chopp et al., 1996), ischemic depolarizations (Chen et al., 1993; Röther et al., 1996), hypothermic (Chen et al., 1992) and pharmacologic (Belayev et al., 1995) neuroprotection, and magnetic resonance imaging (Mintorovitch et al., 1991; Minematsu et al., 1992, Kohno et al., 1995; Röther et al., 1996). The adaptation of MCA suture-occlusion to the mouse has permitted studies in transgenic and gene-knockout strains (Kamii et al., 1994; Hara et al., 1996; Huang et al., 1996).
In previous studies of MCA suture-occlusion, success in achieving infarction has been variable (93%, Koizumi et al., 1986; and 56%, Zea Longa et al., 1989). Subarachnoid hemorrhage may occur because of perforation of intracranial arteries (Laing et al., 1993); high mortality has been reported in some studies (Nagasawa and Kogure, 1989); and differences in total infarct volume may arise when similarly-sized sutures from different manufacturers are used (Kuge et al., 1995). To deal with these methodological problems, we modified the method of Zea Longa et al. (1989) by coating the suture with poly-L-lysine, a polycationic molecule thought to increase adhesion of the suture to the endothelial surface of the occluded vessel (Belayev et al., 1996a; Zhao et al., 1996). In validation studies, we have reported a low coefficient of variation of infarct size with this technique (Belayev et al., 1996a), and we have applied the method to study blood-brain barrier function (Belayev et al., 1996b) and the effect of pharmacotherapeutic agents (Belayev et al., 1995).
The high reproducibility of this MCA suture-occlusion model lends it ideally to the precise study of the interrelationships between local hemodynamic and metabolic events in the focally ischemic brain by permitting the application of sophisticated image-processing strategies by means of which image data sets derived from LCBF and LCMRglc studies in separate groups of replicate animals may be coaligned, mapped into a common atlas-derived template, averaged to form mean data sets, and coanalyzed via pixel-based methods to permit statistical comparison of multimodal data. The feasibility of this approach has been documented in previous publications (Zhao et al., 1993, 1995; Belayev et al., 1995; Prado et al., 1996; Ginsberg et al., 1997), and has been applied to analyze metabolism-blood flow interrelationships and histopathology in a model of photothrombotic distal MCAO (Back et al., 1995; Alexis et al., 1996).
In the current study, we studied LCBF, LCMRglc, and their interrelationship both during a 2-hour period of MCAO by intraluminal suture as well as after 1 hour of postischemic recirculation. The companion study (Zhao et al., 1997), in turn, reports correlations of these data with histopathology using similar pixel-based image-analysis strategies.
MATERIALS AND METHODS
Studies were performed on 20 adult male Sprague-Dawley rats, weighing 320 to 380g, obtained from Charles River Laboratories, Inc, (Wilmington, MA, U.S.A.). All animals underwent right MCAO by insertion of an intraluminal suture. The rats were assigned in a randomized manner to experiments using the autoradiographic measurement of either LCBF or LCMRglc.
Surgical preparation
Animals were fasted overnight but were allowed free access to water. Atropine sulfate (0.5 mg/kg intraperitoneally) was injected 10 minutes before anesthesia. Anesthesia was induced with 3.5% halothane in a mixture of 70% nitrous oxide and a balance of oxygen. Rats were orally intubated and mechanically ventilated. During ventilation, the animals were immobilized with pancuronium bromide (0.6 mg/kg intravenously). Temperature probes were inserted into the rectum (CMA/150 temperature controller, CMA/Microdialysis AB, Stockholm, Sweden) and left temporalis muscle (Hypo-33-1. TG SMP-M, Omega Engineering, Stanford, CT, U.S.A.), and separate heating lamps were used to maintain rectal and cranial temperatures at 37 to 37.5°C. Polyethylene catheters were introduced into the right femoral artery and vein for blood pressure recording and blood sampling. Mean arterial blood pressure was measured via an indwelling femoral arterial catheter connected to a precalibrated pressure transducer (Model P23XL, Gould instrument Systems, Valley View, OH, U.S.A.) and was recorded continuously (Gould Model RS3400 polygraph). Serial measurements (15 minutes before MCAO, 15 minutes and 90 minutes after onset of MCAO, and 30 minutes after the onset of reperfusion) were made of arterial blood gases and pH (Model ABL50, Radiometer America, Inc., Westlake, OH, U.S.A.) and plasma glucose (Model 2300 Stat, Yellow Springs Instrument Co, Inc., Yellow Springs, OH, U.S.A.) (Table 1).
Physiological variables in rats subjected to MCAO
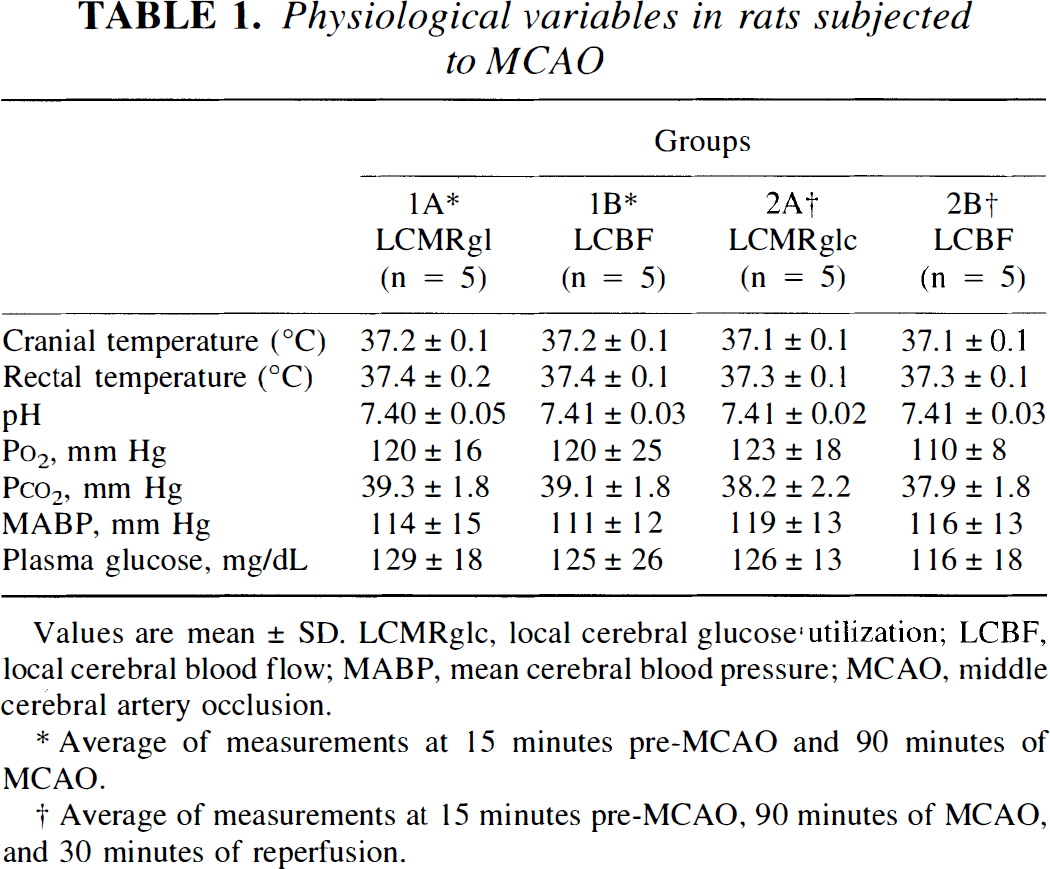
Values are mean ± SD. LCMRglc, local cerebral glucose utilization; LCBF, local cerebral blood flow; MABP, mean cerebral blood pressure; MCAO, middle cerebral artery occlusion.
Average of measurements at 15 minutes pre-MCAO and 90 minutes of MCAO.
Average of measurements at 15 minutes pre-MCAO, 90 minutes of MCAO, and 30 minutes of reperfusion.
Middle cerebral artery occlusion
Middle cerebral artery occlusion was induced as described by Zea Longa et al. (1989). Under an operating microscope, the right common carotid artery was exposed through a midline neck incision and was carefully dissected free from surrounding nerves and fascia from its bifurcation to the base of the skull. The occipital artery branches of the external carotid artery were then isolated, and these branches were dissected and coagulated. The internal carotid artery was isolated and carefully separated from the adjacent vagus nerve, and the pterygopalatine artery was ligated. Next, a 4-cm length of 3-0 monofilament nylon suture (Harvard Apparatus, Inc., South Natick, MA, U.S.A.) was inserted via the proximal external carotid artery into the internal carotid artery and then into the circle of Willis, effectively occluding the MCA.
To produce MCAO, we used a poly-L-lysine coated suture, as previously described (Belayev et al., 1996a). Before use, the tip of the suture was blunted by heating near a flame. A 20-mm distal segment of the suture was then coated with poly-L-lysine solution (0.1% [wt/vol] in deionized water, [Sigma, St. Louis, MO, U.S.A.]) and dried in a 60°C oven for 1 hour. The suture was inserted 19 to 20 mm from the bifurcation of the common carotid artery, according to the animal's body weight. After the intraluminal suture was placed, the neck incision was closed with a silk suture. The animals were then allowed to awaken from anesthesia and were returned to their cages.
Two animal groups, each consisting of LCBF and LCMRglc subgroups, were studied. Rats in subgroups 1A (LCBF) and 1B (LCMRglc) were subjected to a 2-hour period of MCAO and were studied without reperfusion. In subgroups 2A (LCBF) and 2B (LCMRglc), rats were reanesthetized after 2 hours of MCAO with the same anesthetic combination as used initially. Temperature probes were reinserted, and the intraluminal suture was carefully removed. Autoradiographic studies were performed after ~1 hour of recirculation. Each of these 4 subgroups consisted of n = 5 rats.
Neurobehavioral testing
Behavioral testing based on our previously published neurological function scale (Belayev et al., 1996a) was performed in all 20 rats before MCAO and at 60 minutes of MCAO by an investigator (L.B.) who was blinded to the experimental groups; for this testing, rats were allowed to awaken from anesthesia at 15 minutes after suture insertion. Any rats showing convulsions or sustained disturbances of consciousness were excluded from the study. In our experience, most of the latter have proven to have subarachnoid hemorrhage secondary to suture-induced rupture of the internal carotid artery. In the current study, only 1 animal (from group 2A) needed to be excluded for this reason.
Autoradiographic studies of local cerebral glucose utilization and blood flow
In both Group 1 (~2 hours of MCAO) and Group 2 (2 hours of MCAO plus ~1 hour of recirculation), rats were randomly assigned to either LCBF or LCMRglc subgroups (n = 5 each). To measure LCBF in group 1 A, 14C-labeled iodoantipyrine was injected at 1.75 h after MCAo. In group 2A, 14C-labeled iodoantipyrine was injected at 1 hour of postischemic recirculation. In each subgroup, 20 μCi of the radioactive tracer (specific activity 40 μCi/mmol, New England Nuclear, Boston, MA, U.S.A.) dissolved in 1 mL of isotonic saline was infused intravenously at a constant rate over 45 seconds via a Harvard infusion pump. Arterial blood samples were taken at approximately 2-second intervals from a freely flowing femoral arterial line. In two other subgroups, LCMRglc was measured with 14C-2-deoxyglucose (2-DG). In subgroup 1B, an intravenous bolus of 20 μCi of 2-DG (specific activity 40 to 45 μCi/mmol, New England Nuclear) dissolved in 0.1 mL saline was administered at 1.5 hours after the onset of MCAO. In subgroup 2B, the MCA suture was removed after 2 hours of MCAO, and 2-DG was administered 45 minutes later. Arterial blood samples were taken every 10 seconds during the first minute, at 1 minute intervals for 5 minutes, and at 2.5- to 5-minute intervals for the remainder of the 45-minute study period. Plasma samples were assayed for 2-DG by liquid scintillation counting and for plasma glucose by means of a glucose analyzer (Yellow Springs Instrument Co.). As the temporal centroid of 2-DG uptake into the brain occurs approximately 15 to 20 minutes after its bolus administration, these time-points (i.e., 1.75 hours after MCAO, and 1 hour of recirculation, respectively) corresponded to the times of the LCBF study in subgroups 1A and 2A, respectively, thus permitting more valid comparisons between the LCMRglc and LCBF subgroups.
Autoradiographic studies were terminated by decapitation. Brains were quickly removed (<1.5 minutes) and frozen over liquid nitrogen. They were subsequently embedded and sectioned subserially in a cryostat (20-μm thickness, 100-μm intervals) as previously described (Zhao et al., 1995). These sections, together with calibrated 14C-methylmethacrylate standards, were exposed to Kodak Hyperfilm Beta-max film for 10 days. Films were digitized by means of a Xillix CCD camera (70 μm/pixel resolution) interfaced to an MCID image analysis system (Imaging Research, Inc., St. Catherines, Ontario, Canada). Image files were transferred to a clustered DEC-Alpha minicomputer system (Digital Equipment Corp., Nashua, NH, U.S.A.) for processing. Operational equations of the iodoantipyrine method (Sakurada et al., 1978) and the 2-DG method modified for variable plasma glucose (Sokoloff et al., 1977; Savaki et al., 1980) were used to compute LCBF and LCMRglc, respectively. We assumed normal values for the kinetic constants and lumped constant of the 2-DG model (Sokoloff et al., 1977), as we have previously shown, using the 14C-methylglucose method (Dienel et al., 1991; Greenberg et al., 1992), that even in the acute focal-ischemic penumbra, in which LCBF is reduced to 20% to 40% of control, the brain glucose space, and hence the lumped constant, are unaltered (Yao et al., 1995). Because this is not the case at LCBF values <20% of control, we have excluded the ischemic core from our analysis of the LCMRglc/LCBF ratio (see Results).
Generation of averaged three-dimensional autoradiographic image data sets
Three-dimensional autoradiographic image reconstruction was based on a novel image alignment algorithm which we have previously published in detail (Zhao et al., 1993, 1995) and have implemented in studies of brain ischemia (Back et al., 1995; Prado et al., 1996) and traumatic brain injury (Ginsberg et al., 1997). In this method, a linear affine transformation was first used to register sequential coronal sections of each brain, and transformation parameters were calculated by point-to-point disparity analysis. Each coronal section was aligned to its adjacent neighbor by applying a reverse transformation with the estimated translation and rotation parameters. After alignment of LCBF or LCMRglc image data sets in individual rats, corresponding coronal sections of all brains of each LCBF series or of each LCMRglc series, respectively, were placed in register with one another at a common coronal reference level (bregma + 0.7 mm, [Paxinos and Watson, 1982]). One brain was designated as the template, and all other sections were mapped into its contours at each coronal level by means of an averaging procedure similar to that used for image alignment. These procedures resulted in quantitative three-dimensional image data sets of average LCBF and LCMRglc for groups 1 and 2, which could each be displayed in pseudo-color on a video terminal. Three-dimensional standard-deviation data sets of LCBF and LCMRglc were generated in a similar manner.
Next an LCMRglc/LCBF ratio image data set was calculated by the following equation:
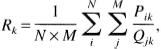
Autoradiographic region-of-interest analysis was performed at 8 representative coronal levels (ranging from bregma +1.2 to −7.8 mm) by superimposing a digitized atlas based on the atlas of Zilles et al. (1985) (Fig. 1). A polygon tool was used to demarcate multiple cortical and subcortical regions of interest on each digitized atlas section. The atlas templates were then fitted by disparity analysis to the corresponding autoradiographic sections of individual rats of each respective subgroup; automated region-of-interest readings were taken; and averages and standard deviations were computed for each region of interest of the two LCBF or LCMRglc subgroups. Mean values for the LCMRglc/LCBF ratio were obtained from region-of-interest measurements on the averaged ratio data set. (Tables 2 through 4 present the anatomic levels and atlas levels used in this analysis. Some structures were measured at multiple coronal levels [as noted in the “Atlas Level” column of Tables 2 through 4] and an average structure value computed for each rat.)
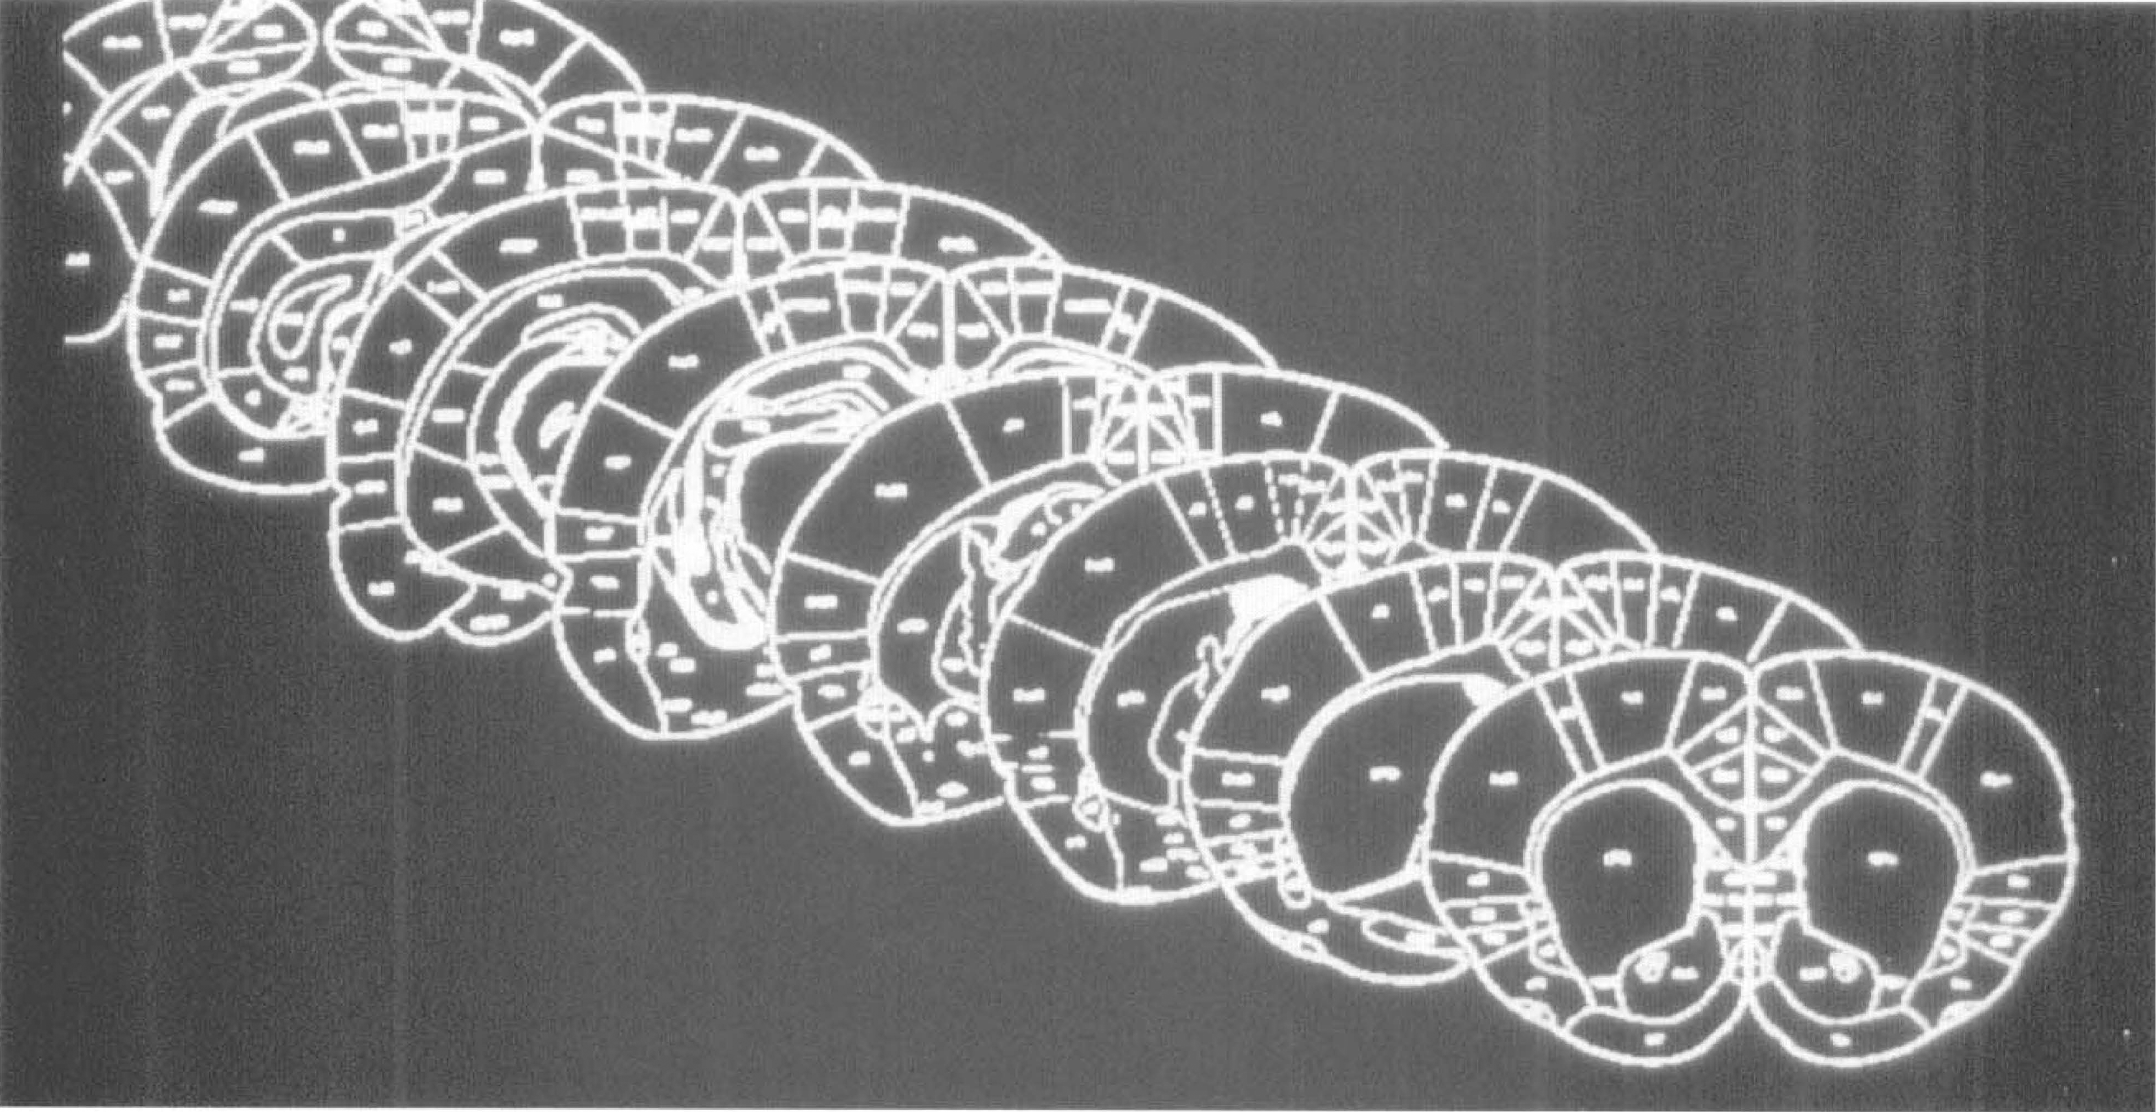
Digitized templates at eight coronal levels (bregma +1.2, −0.3, −1.3, −1.8, −3.8, −4.8, −6.3, and −7.8 mm) based on the atlas of Zilles et al. (1985), used for autoradiographic region-of-interest analysis. These correspond to the atlas levels 0 to 7 referred to in Tables 2 to 4
Local cerebral blood flow (mL/g/min)
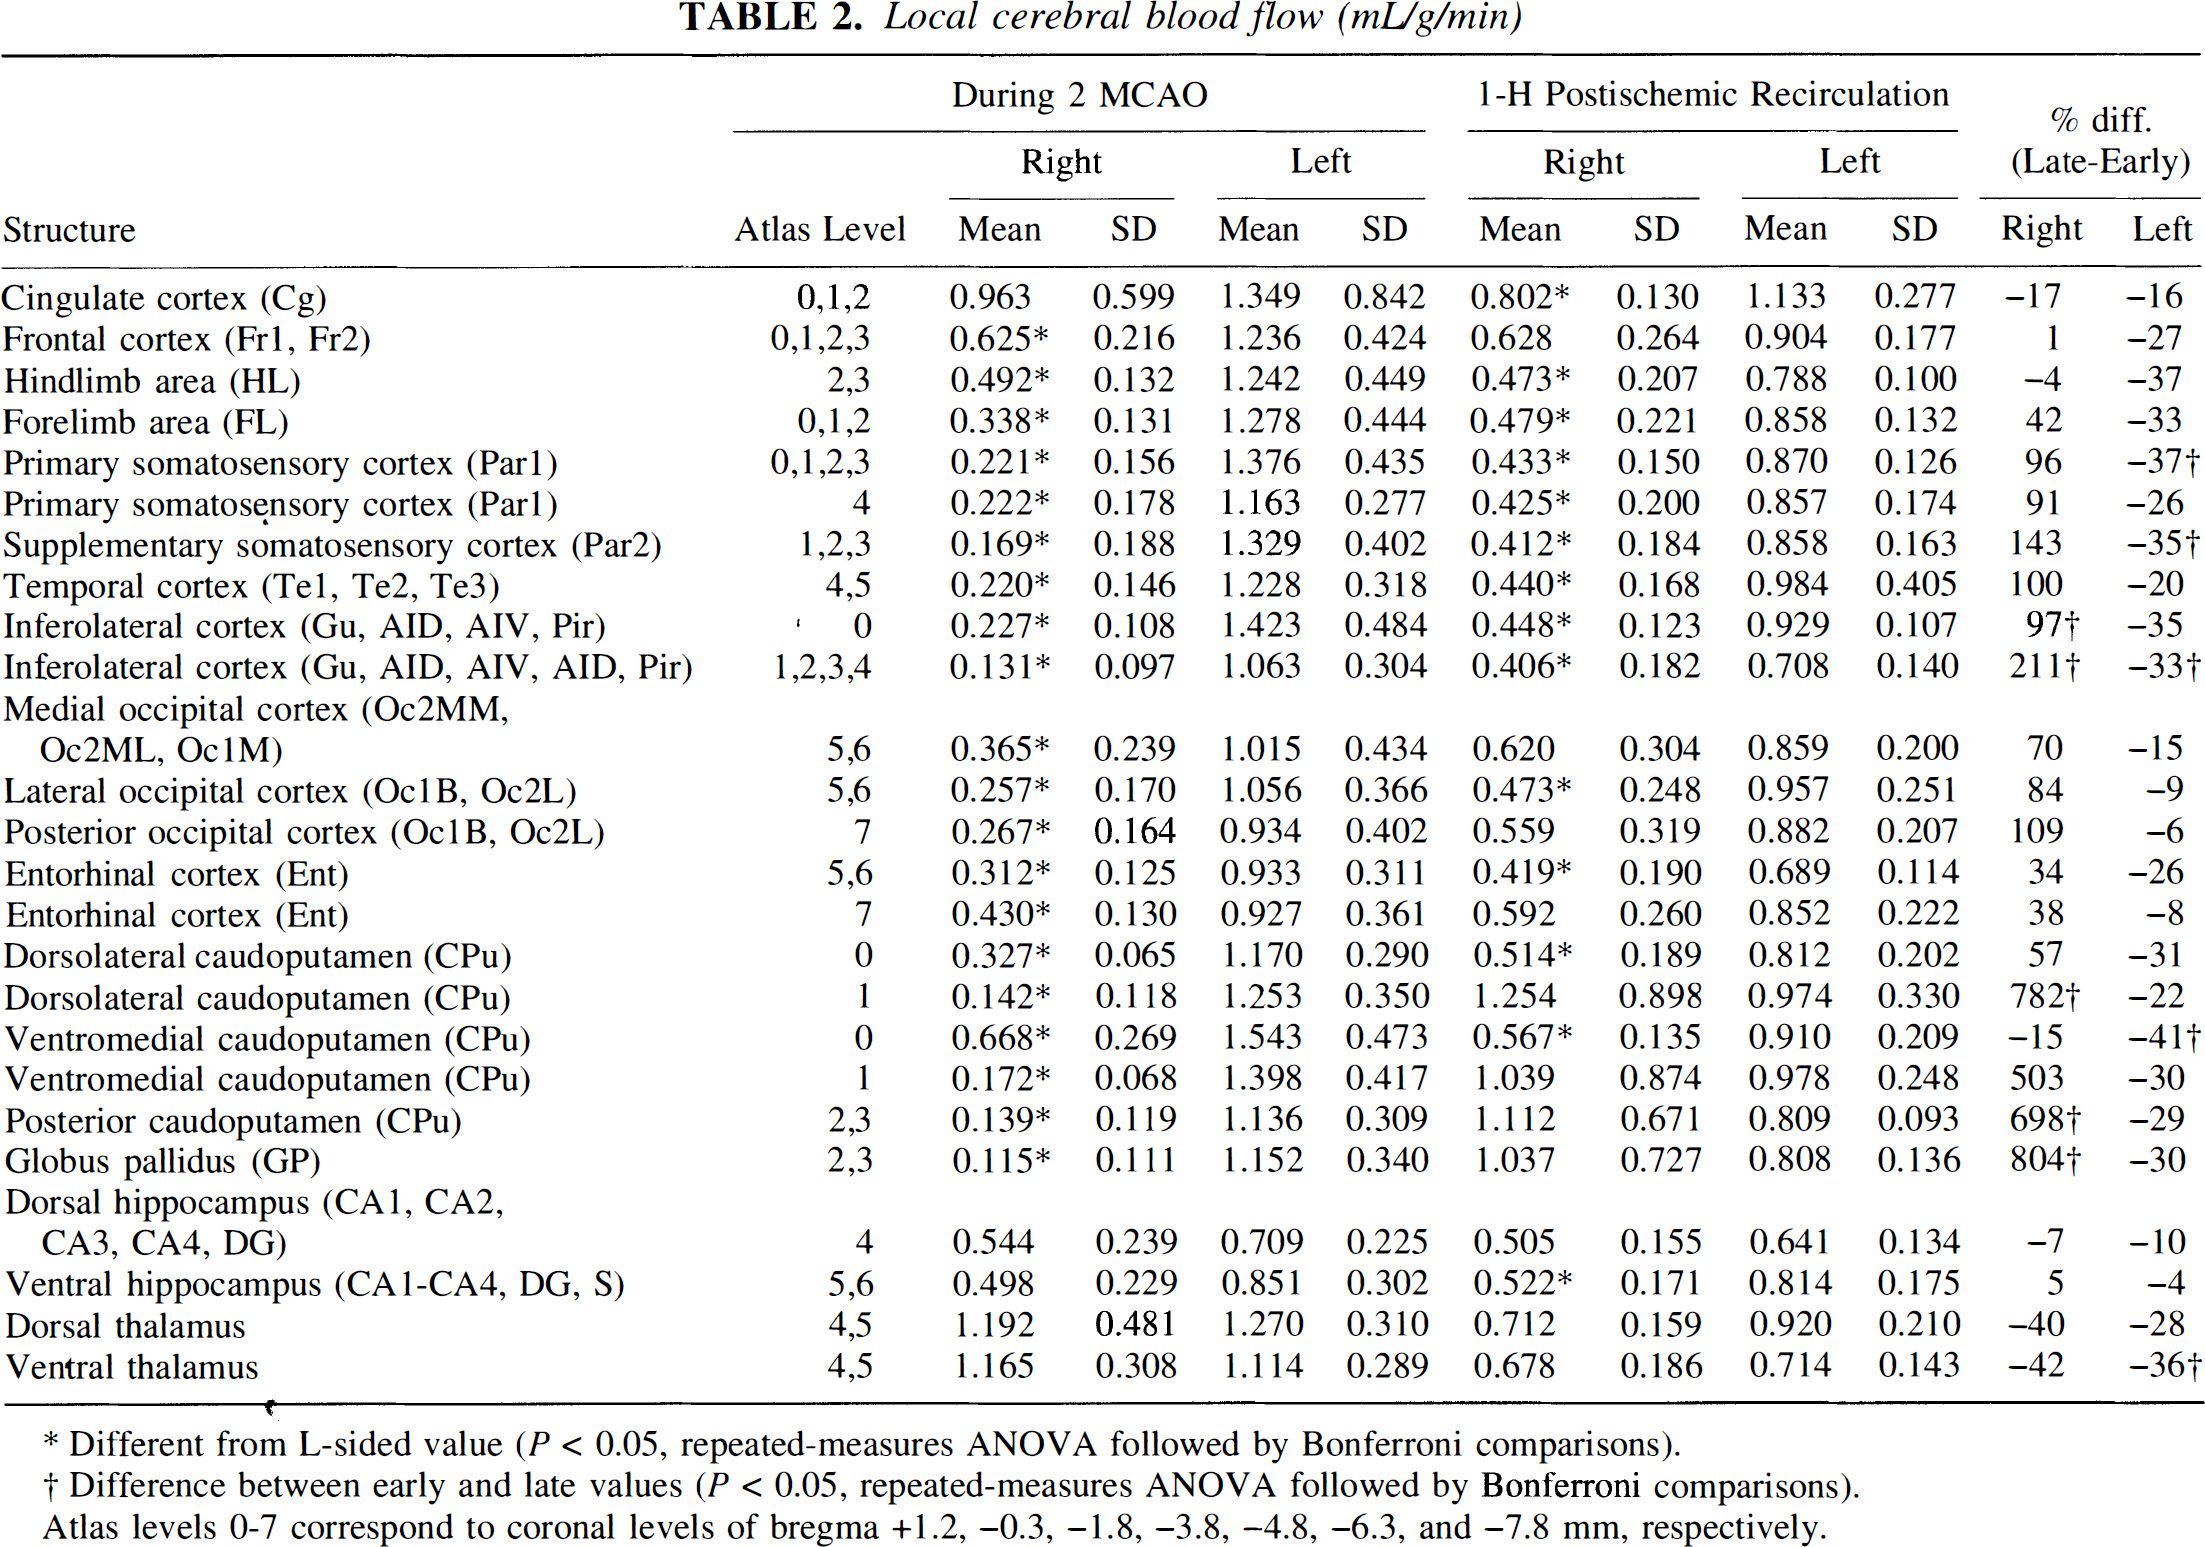
Different from L-sided value (P < 0.05, repeated-measures ANOVA followed by Bonferroni comparisons).
Difference between early and late values (P < 0.05, repeated-measures ANOVA followed by Bonferroni comparisons).
Atlas levels 0-7 correspond to coronal levels of bregma +1.2, −0.3, −1.8, −3.8, −4.8, −6.3, and −7.8 mm, respectively.
Local cerebral glucose utilization (μmol/100g/min)
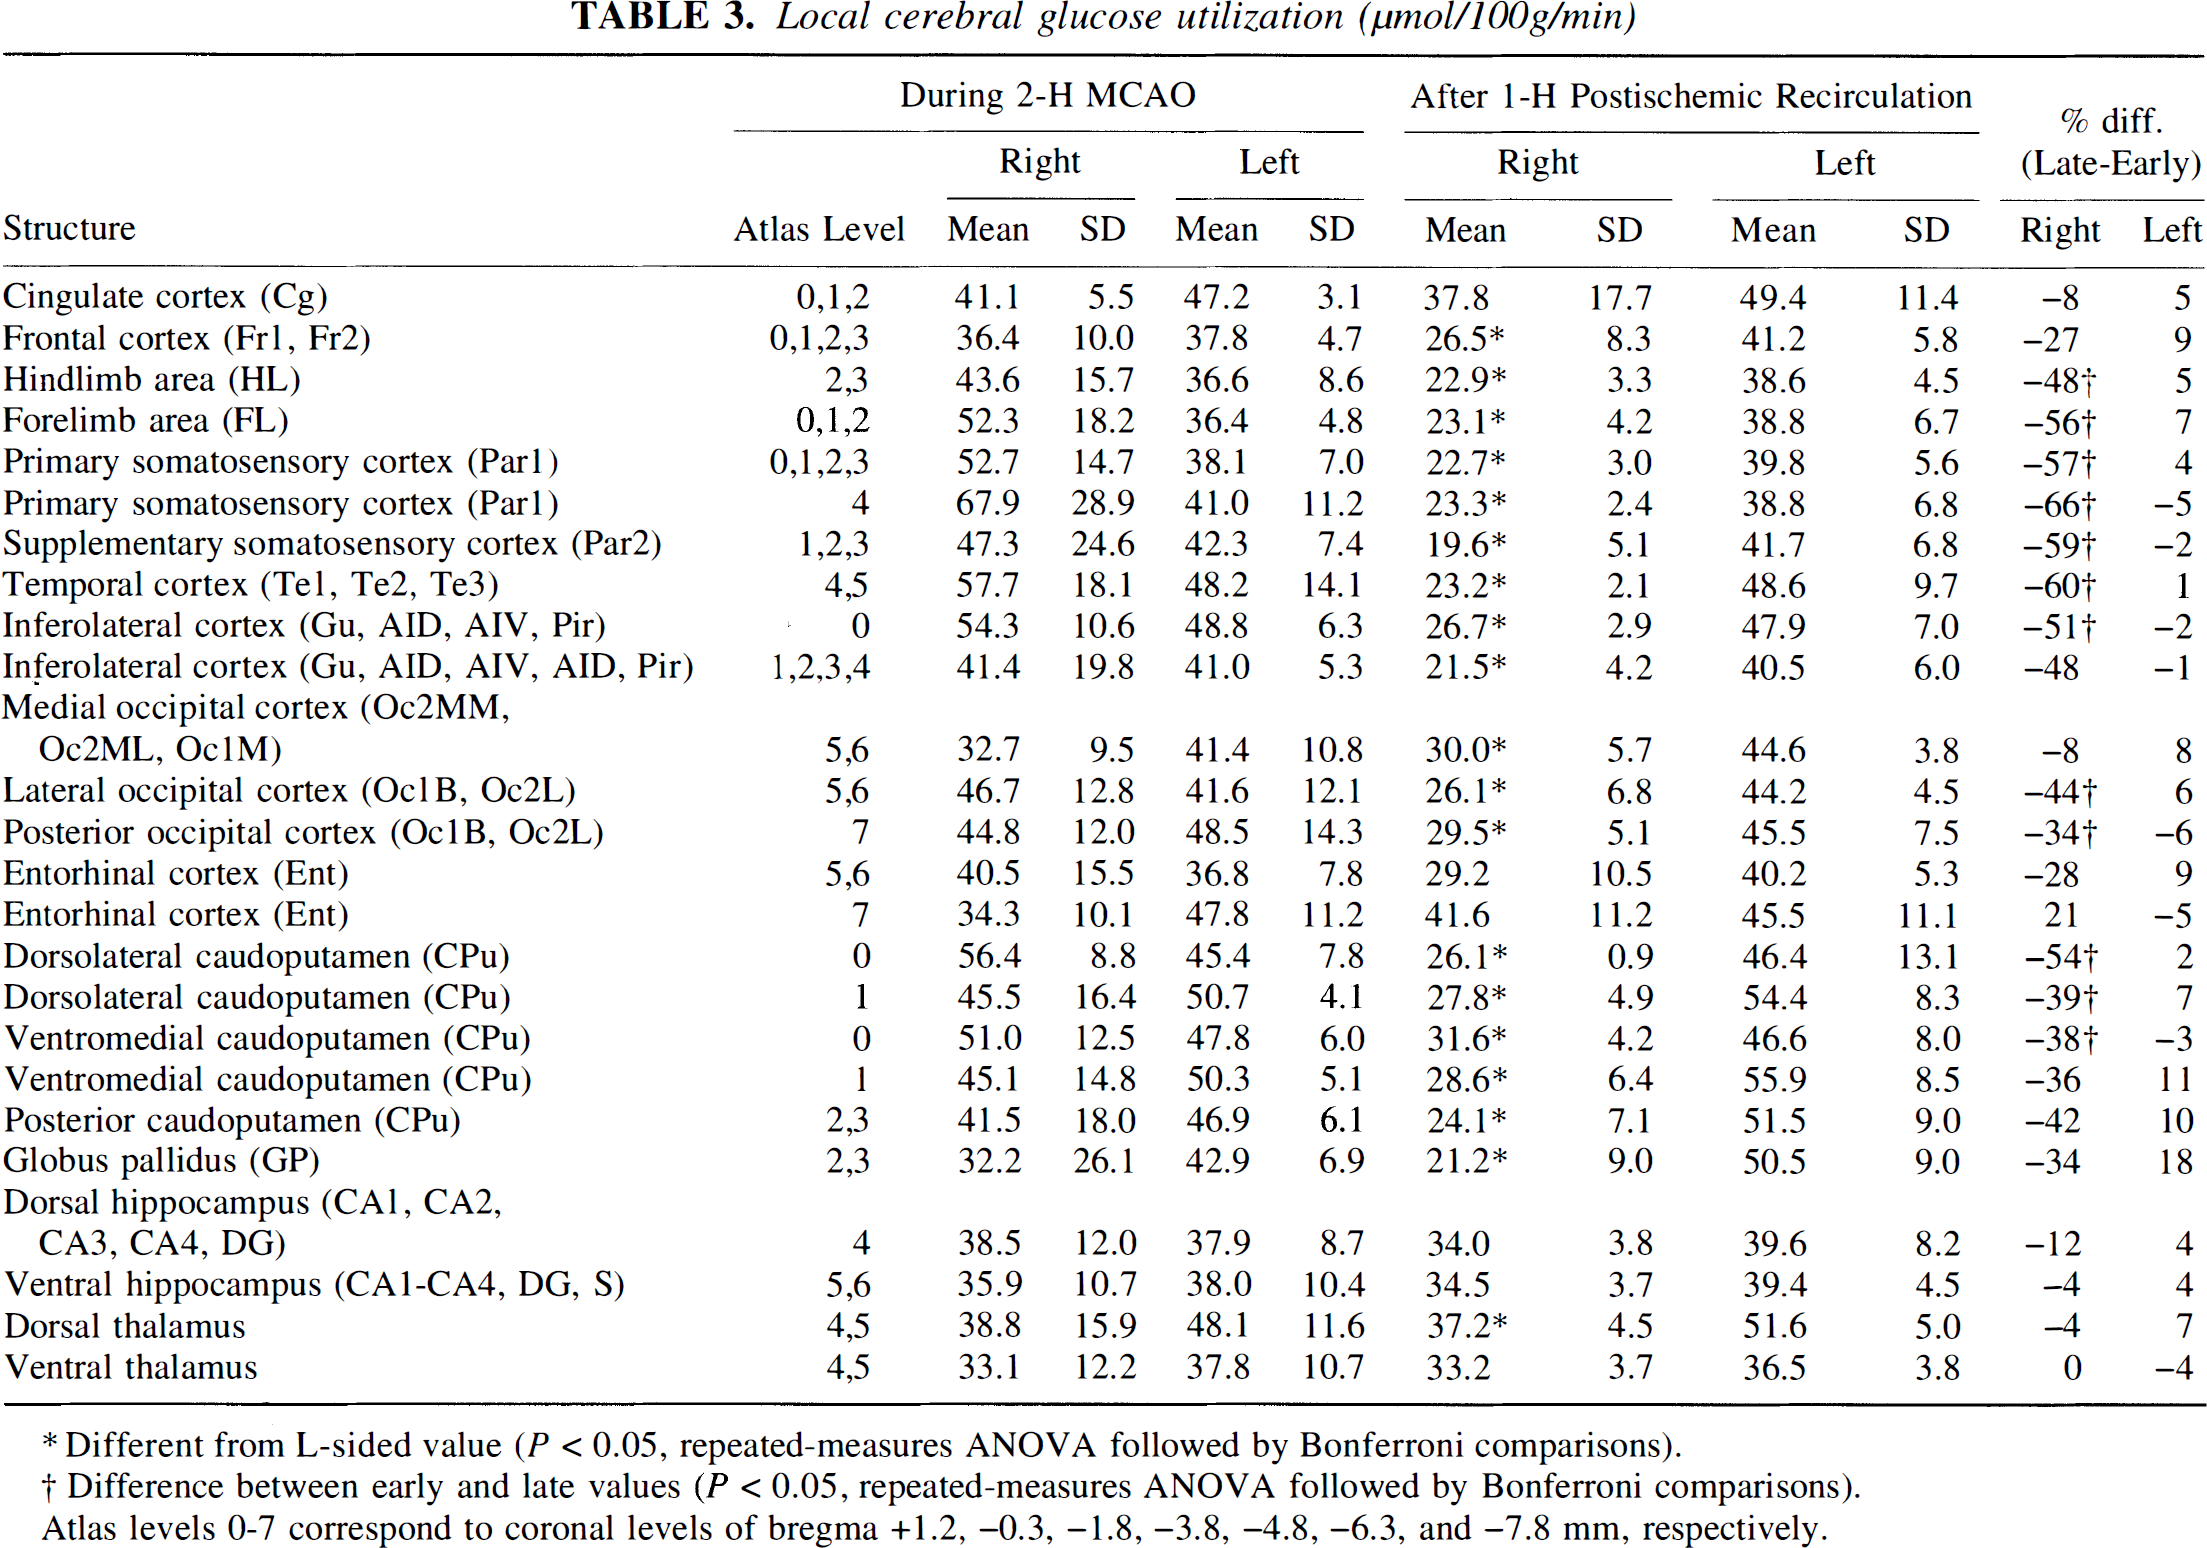
Different from L-sided value (P < 0.05, repeated-measures ANOVA followed by Bonferroni comparisons).
Difference between early and late values (P < 0.05, repeated-measures ANOVA followed by Bonferroni comparisons).
Atlas levels 0-7 correspond to coronal levels of bregma +1.2, −0.3, −1.8, −3.8, −4.8, −6.3, and −7.8 mm, respectively.
Local cerebral glucose utilization/local cerebral blood flow ratio (μmol/100mL)
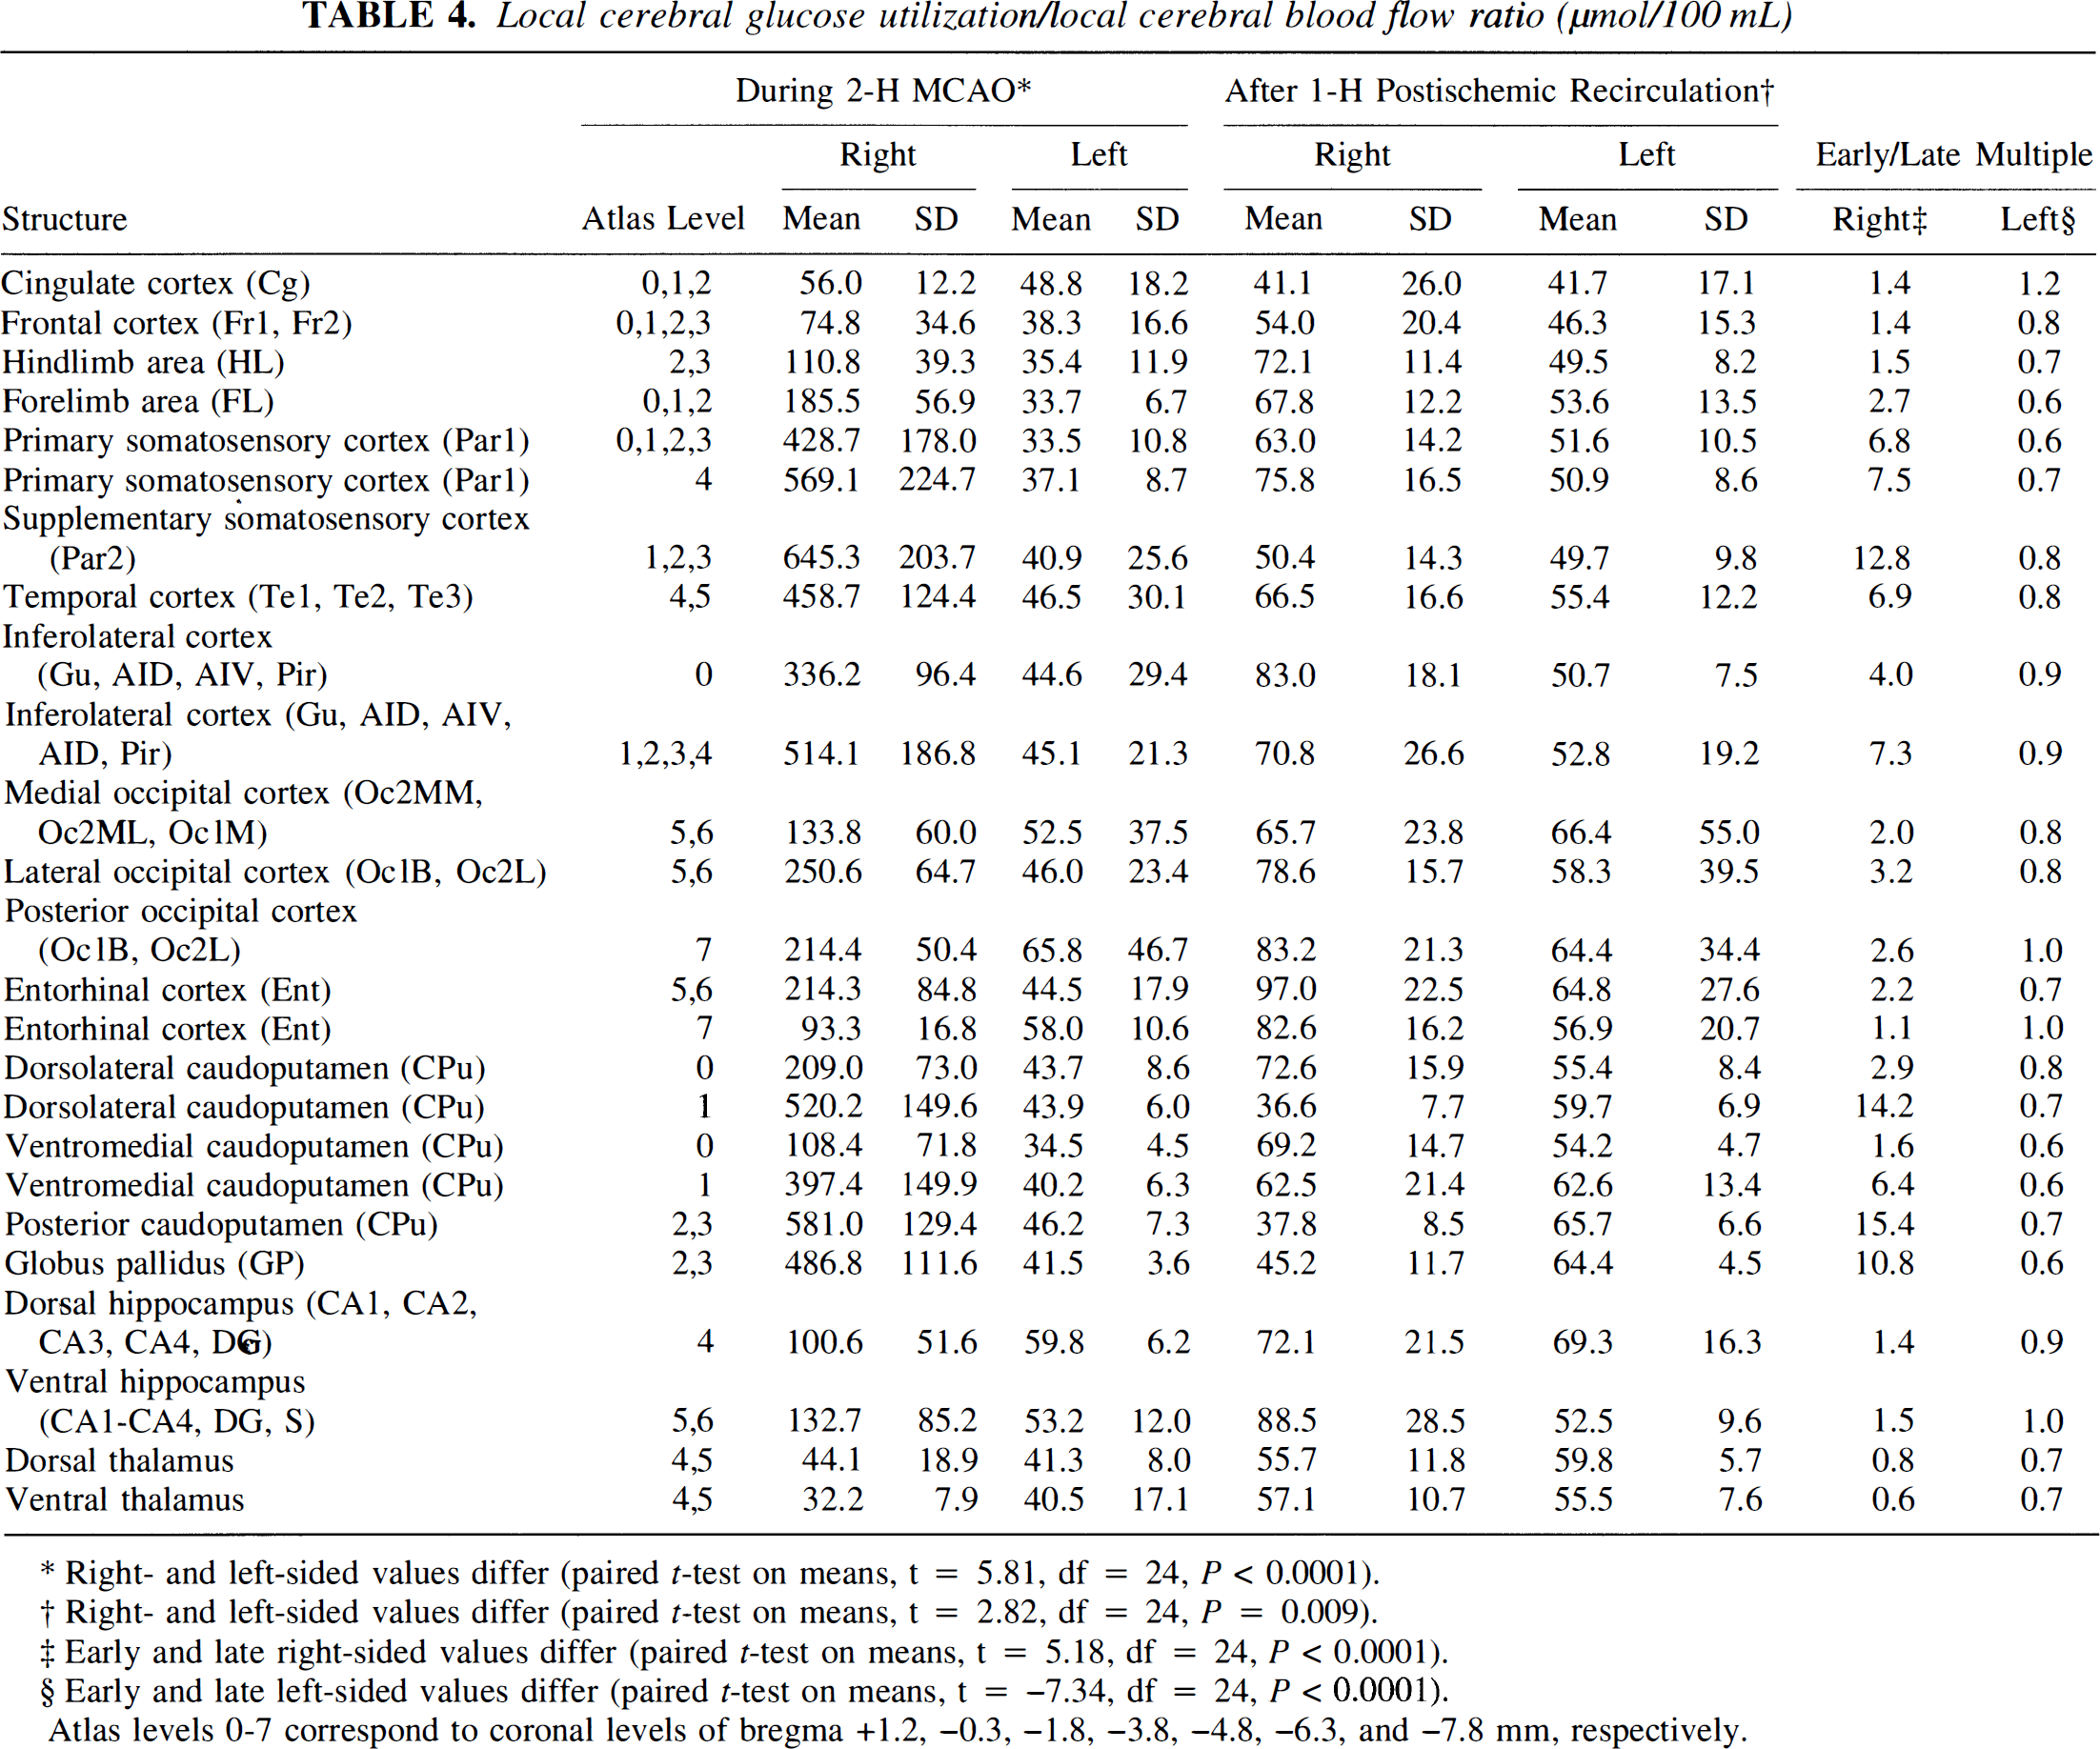
Right- and left-sided values differ (paired t-test on means, t = 5.81, df = 24, P < 0.0001).
Right- and left-sided values differ (paired t-test on means, t = 2.82, df = 24, P = 0.009).
Early and late right-sided values differ (paired t-test on means, t = 5.18, df = 24, P < 0.0001).
Early and late left-sided values differ (paired t-test on means, t = −7.34, df = 24, P < 0.0001).
Atlas levels 0-7 correspond to coronal levels of bregma +1.2, −0.3, −1.8, −3.8, −4.8, −6.3, and −7.8 mm, respectively.
To facilitate data analysis, the ischemic core was defined as those image pixels of the 2 hours of MCAO average LCBF data set in which LCBF was reduced to 20% of control levels or below (i.e., below 0.24 mL/g/min). The ischemic penumbra was defined as those image pixels having LCBF between 20% and 40% of control (i.e., 0.24 to 0.47 mL/g/min). These threshold levels are consistent with the previous literature and with our earlier analysis of LCBF and LCMRglc in a model of photothrombotic distal MCAO (Back et al., 1995).
Statistical analysis
Tabular values are expressed as mean ± SD. Repeated-measures analysis of variance with post-hoc Bonferroni tests (to correct for multiple comparisons) were used to compare left- and right-sided LCBF (Table 2) and LCMRglc values (Table 3) in each group, and to compare corresponding structures of each hemisphere in the 2 hours of MCAO and 1 hour of recirculation groups (SAS general linear models routines, SAS Institute, Cary, NC, U.S.A.). Paired t-tests were used to compare right- versus left-sided structure means and to compare corresponding hemispheres within each subgroup. Differences were considered statistically significant at the P < 0.05 level.
RESULTS
Physiological variables
These are presented in Table 1. No intergroup differences were noted for arterial blood pressure, blood gases, or plasma glucose.
Neurological observations
All rats showed a normal neurological score (= 0) before MCAO, and each rat developed a marked neurological deficit when examined at 60 minutes of MCAO (score in each rat = 9 out of possible 10). In previous studies, this uniformity of neurological deficit has correlated with highly consistent histological infarcts after 3-day survival (Belayev et al., 1996a). The neurological deficits resulting from 2 hours of MCAO in this model are presented in greater detail in the companion article (Zhao et al., 1997).
Local blood flow during middle cerebral artery occlusion and after recirculation
These data are presented in Table 2, and shown in Figs. 2 and 3. Right MCAO for 2 hours induced a gradient of ipsilateral LCBF decrements affecting cortical and basal ganglionic regions (right- versus left-sided LCBF, F(1,8) = 22.1, P = 0.0015, repeated-measures analysis of variance). In this model of proximal MCAO, ischemia was most dense (11% to 19% of the contralateral hemisphere control value of 1.2 mL/g/min) in primary somatosensory cortex, supplementary somatosensory cortex, temporal cortex, and inferolateral neocortical areas; and 10% to 14% of control in regions of the caudoputamen and globus pallidus (Table 2). A lesser intensity of ischemia was present in hindlimb and forelimb areas and in occipital and entorhinal (Ent) cortices (Table 2).
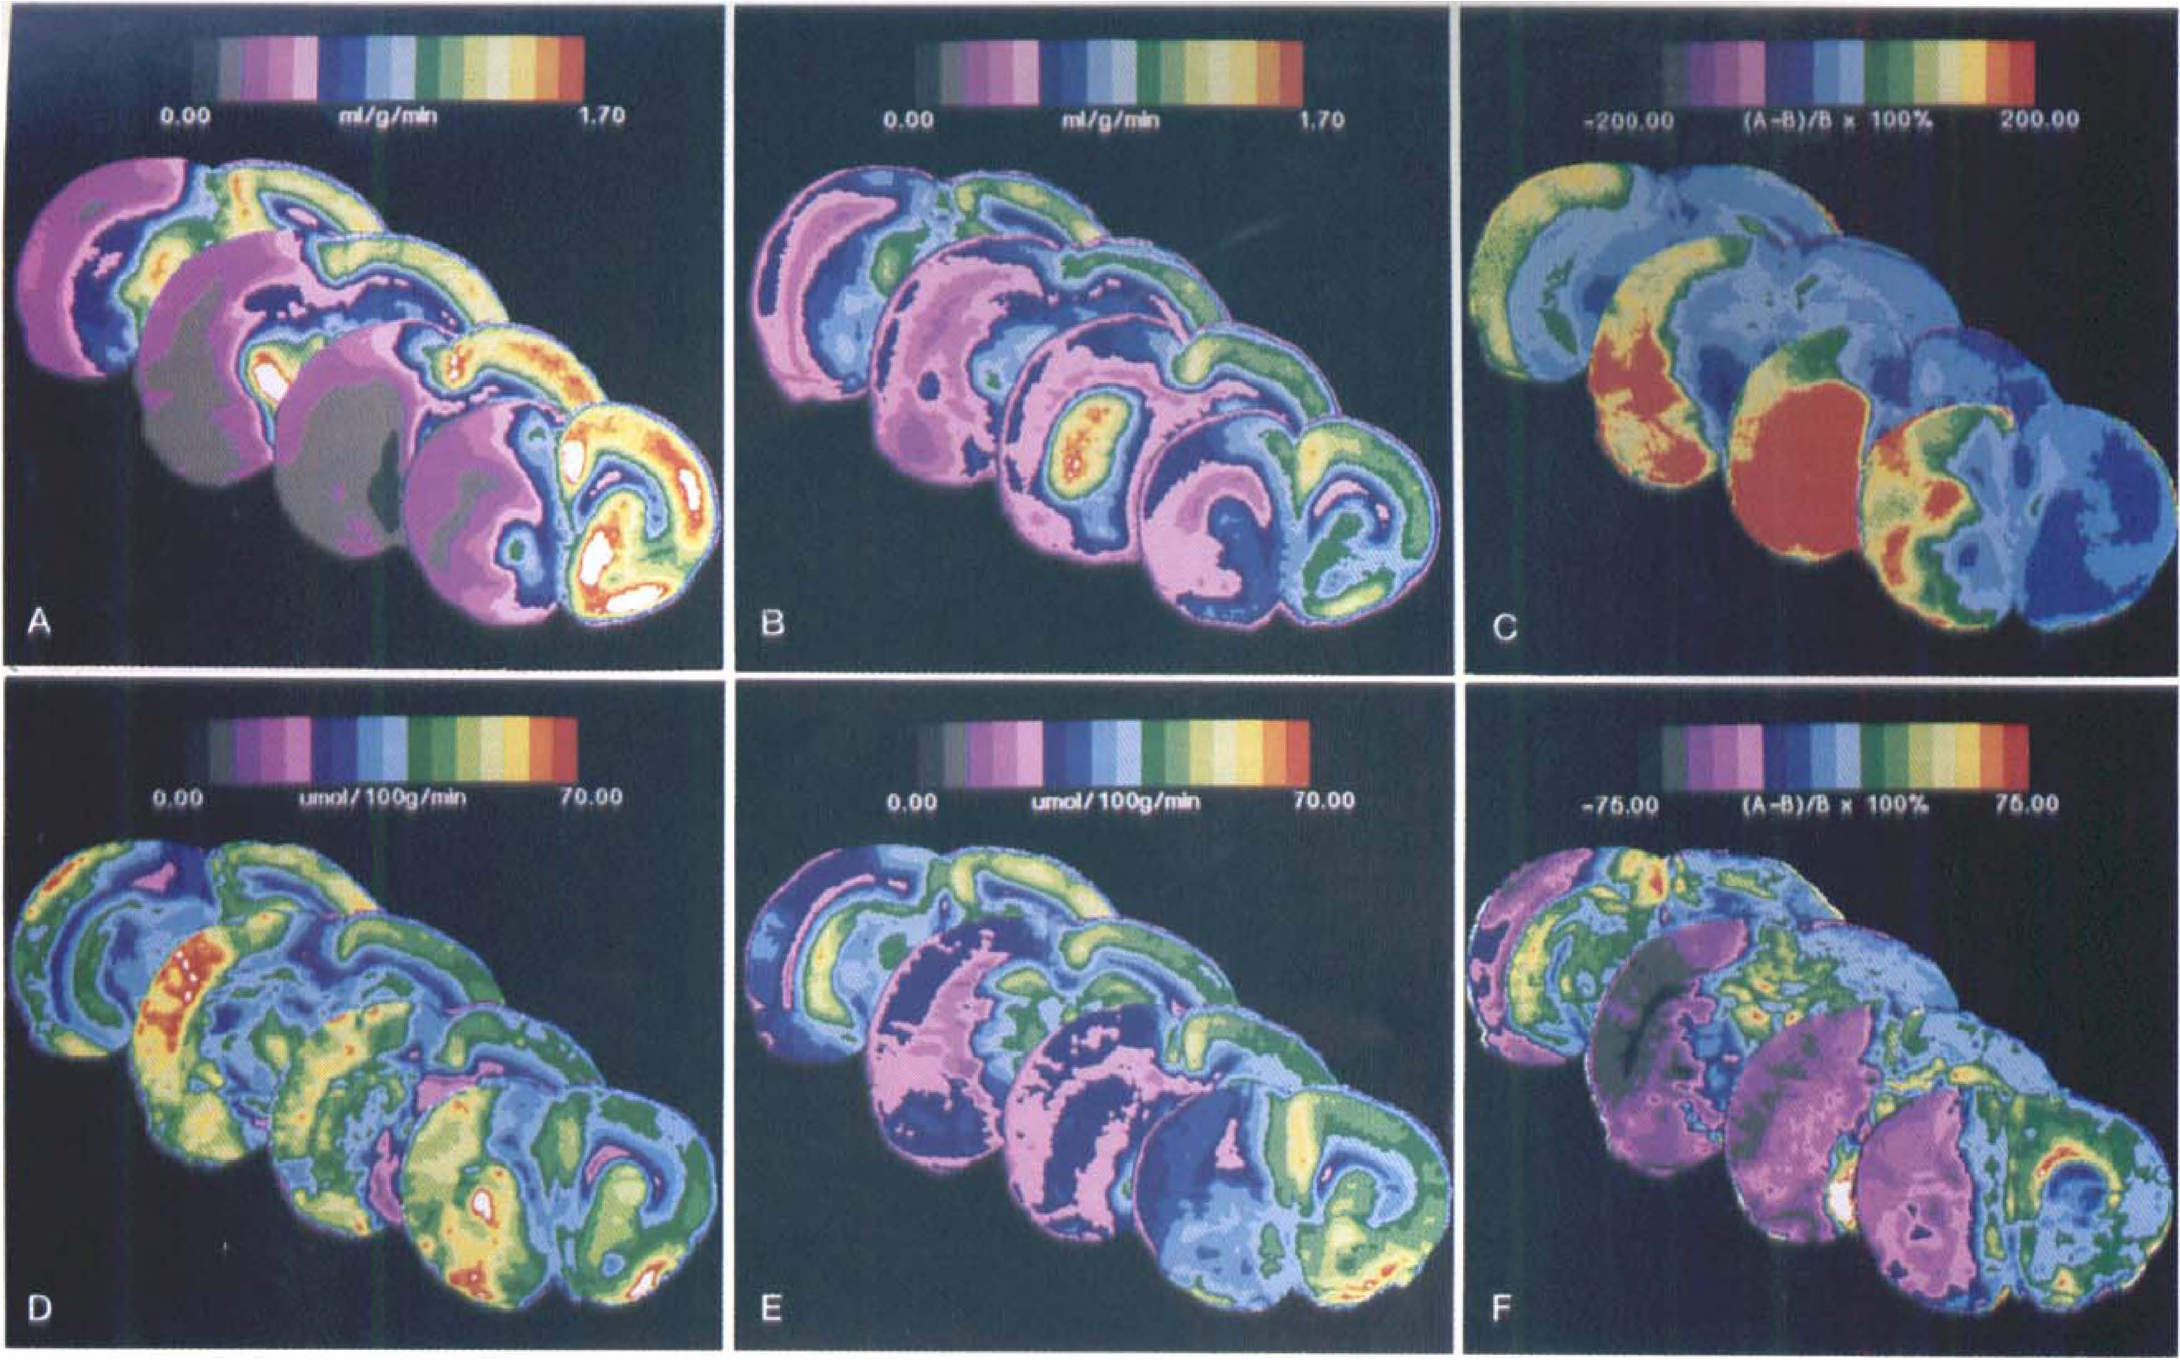
Average local cerebral blood flow (LCBF) (upper row) and average local glucose utilization (LCMRglc) (lower row) data sets at four representative coronal levels (bregma +1.2, −1.3, −3.8, and −6.3 mm). (A) LCBF at 2 hours of middle cerebral artery occlusion (MCAO); (
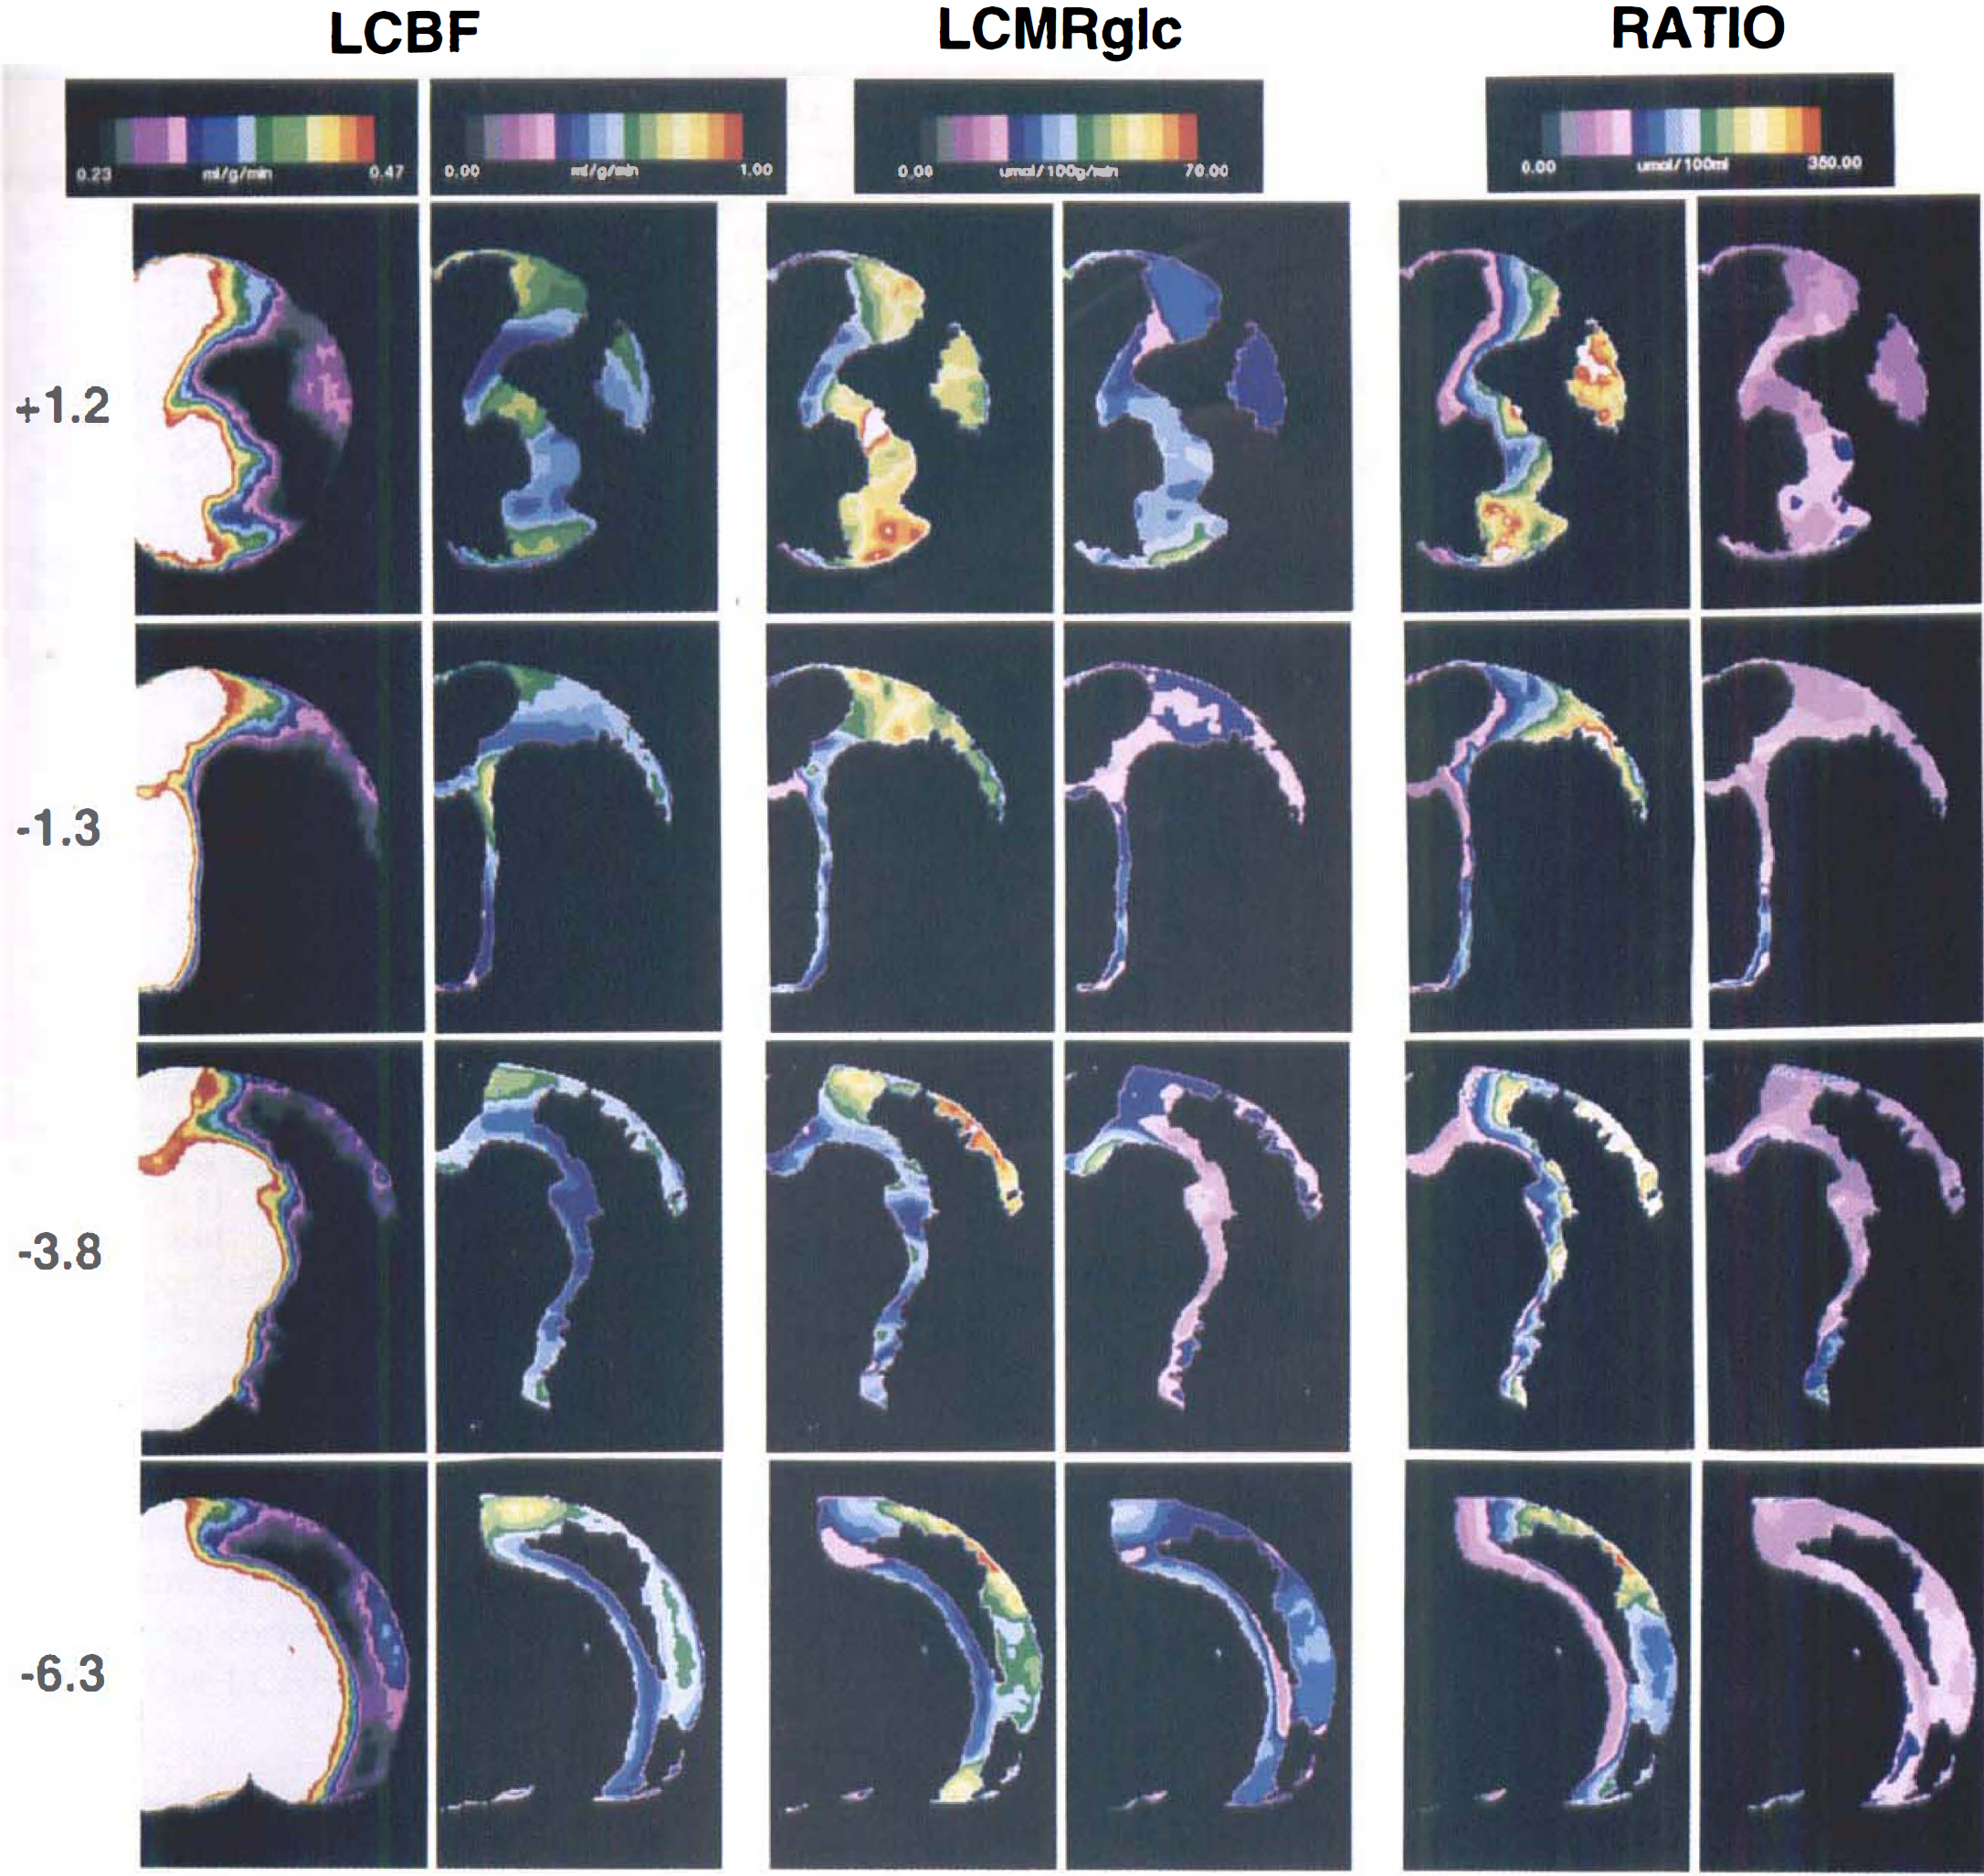
Thresholded pseudocolor images of the ischemic penumbra at the four coronal levels shown in Fig. 2. The penumbra was defined as those pixels of the 2 hours of MCAO image data set having LCBF values between 20% and 40% of contralateral control (i.e., 0.24 to 0.47 mL/g/min). These pixels, thus defined, were analyzed for their LCBF (
After 1 hour of postischemic recirculation, LCBF in the previously densely ischemic neocortical regions increased by approximately 40% to 200% above ischemic values but remained, on average, at approximately 0.4 to 0.5 mL/g/min, or approximately 40% of control levels. By contrast, frank hyperemia (reaching 500% to 800% above ischemic values) was noted in the previously ischemic caudoputamen and globus pallidus (Table 2). Interestingly, LCBF in the nonischemic left hemisphere, when measured at 1 hour of recirculation, was depressed to 0.86 ± 0.11 mL/g/min, or 26% below the mean hemisphere value of 1.17 ± 0.20 mL/g/min measured during MCAO (paired t-test on average of structure means in Table 2, P < 0.0001). Figure 2 illustrates quantitative average LCBF images at 4 representative coronal levels, together with a difference image comparing LCBF at these levels before and after recirculation.
A striking correlation was noted between respective mean cortical LCBF values measured during MCAO and after 1 hour of recirculation (R = 0.93) (Fig. 4). This finding suggests that the extent to which LCBF within a previously ischemic cortical region recovered toward normal during early recirculation was largely determined by its depth of antecedent ischemia.
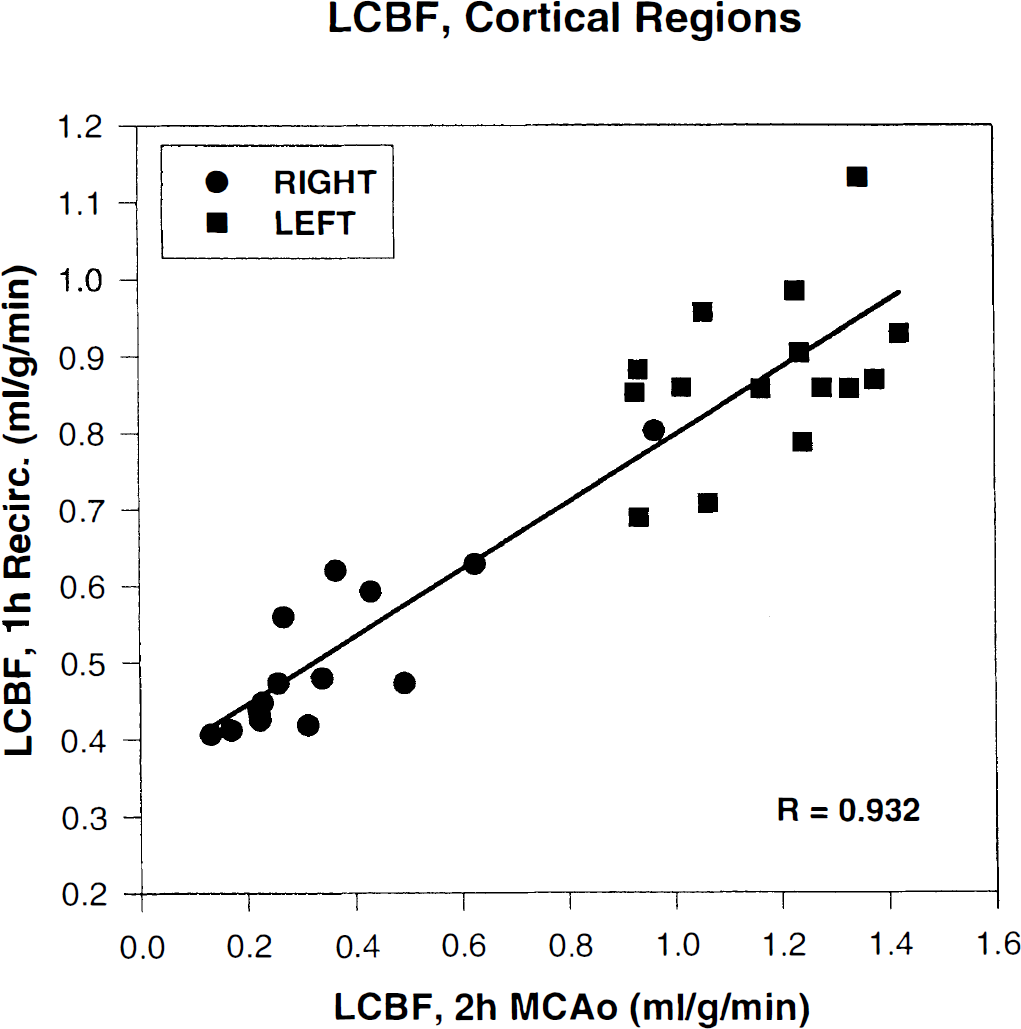
Mean LCBF values of cortical structures of the ischemic (right) and nonischemic (left) hemisphere, plotted versus their corresponding LCBF values after early recirculation (data taken from cortical structure means presented in Table 2). Corresponding data at the two time points are highly correlated.
Local glucose utilization during middle cerebral artery occlusion and after recirculation
Despite severe ischemia (Table 2), right-sided LCMRglc measured during ~2 hours MCAO showed, on average, no significant depression below contralateral values. The average of hemisphere structure means (Table 3) was identical for the right and left hemispheres (44.5 ± 8.9 and 43.2 ± 4.9 μmol/100g/min, respectively), and neither right-sided cortical nor basal ganglionic LCMRglc were altered, on average, with respect to contralateral values. (However, in autoradiograms of individual rats, heterogeneous loci of focally elevated or depressed LCMRglc could be identified. As these loci differed topographically from animal to animal, they tended to be obscured by the image-averaging procedure.) By contrast, after ~1 hour of postischemic recirculation, glucose metabolic rate became markedly depressed (on average, 55% of contralateral values) in the previously densely ischemic right cortical areas, and a similar trend was noted for the caudoputamen (Table 3). Right hemisphere LCMRglc values after ~1 hour of recirculation were, on average, 63% of corresponding left-hemisphere values [F(1,8) = 51.8; P = 0.0001] (Table 3). Although left-hemisphere LCMRglc mean values were virtually identical during MCAO and at ~1 hour of recirculation (43.2 ± 4.9 versus 44.7 ± 5.5 μmol/100g/min, respectively), paired t-testing of structure means revealed the former to lie slightly but significantly (P = 0.008) below the latter. Quantitative mean LCMRglc images at representative coronal levels, and difference images comparing LCMRglc before and after recirculation, are shown in Fig. 2.
Linear regression analysis revealed that mean LCBF values for cortical structures measured both during MCAO and after ~1 hour of recirculation were, in each instance, highly correlated to LCMRglc of those respective structures after ~1 hour of recirculation (Fig. 5). These relationships indicate that the postischemic depression of local glucose utilization was largely determined by the depth of antecedent ischemia, and that postischemic LCBF of these structures was depressed pari passu with postischemic LCMRglc.
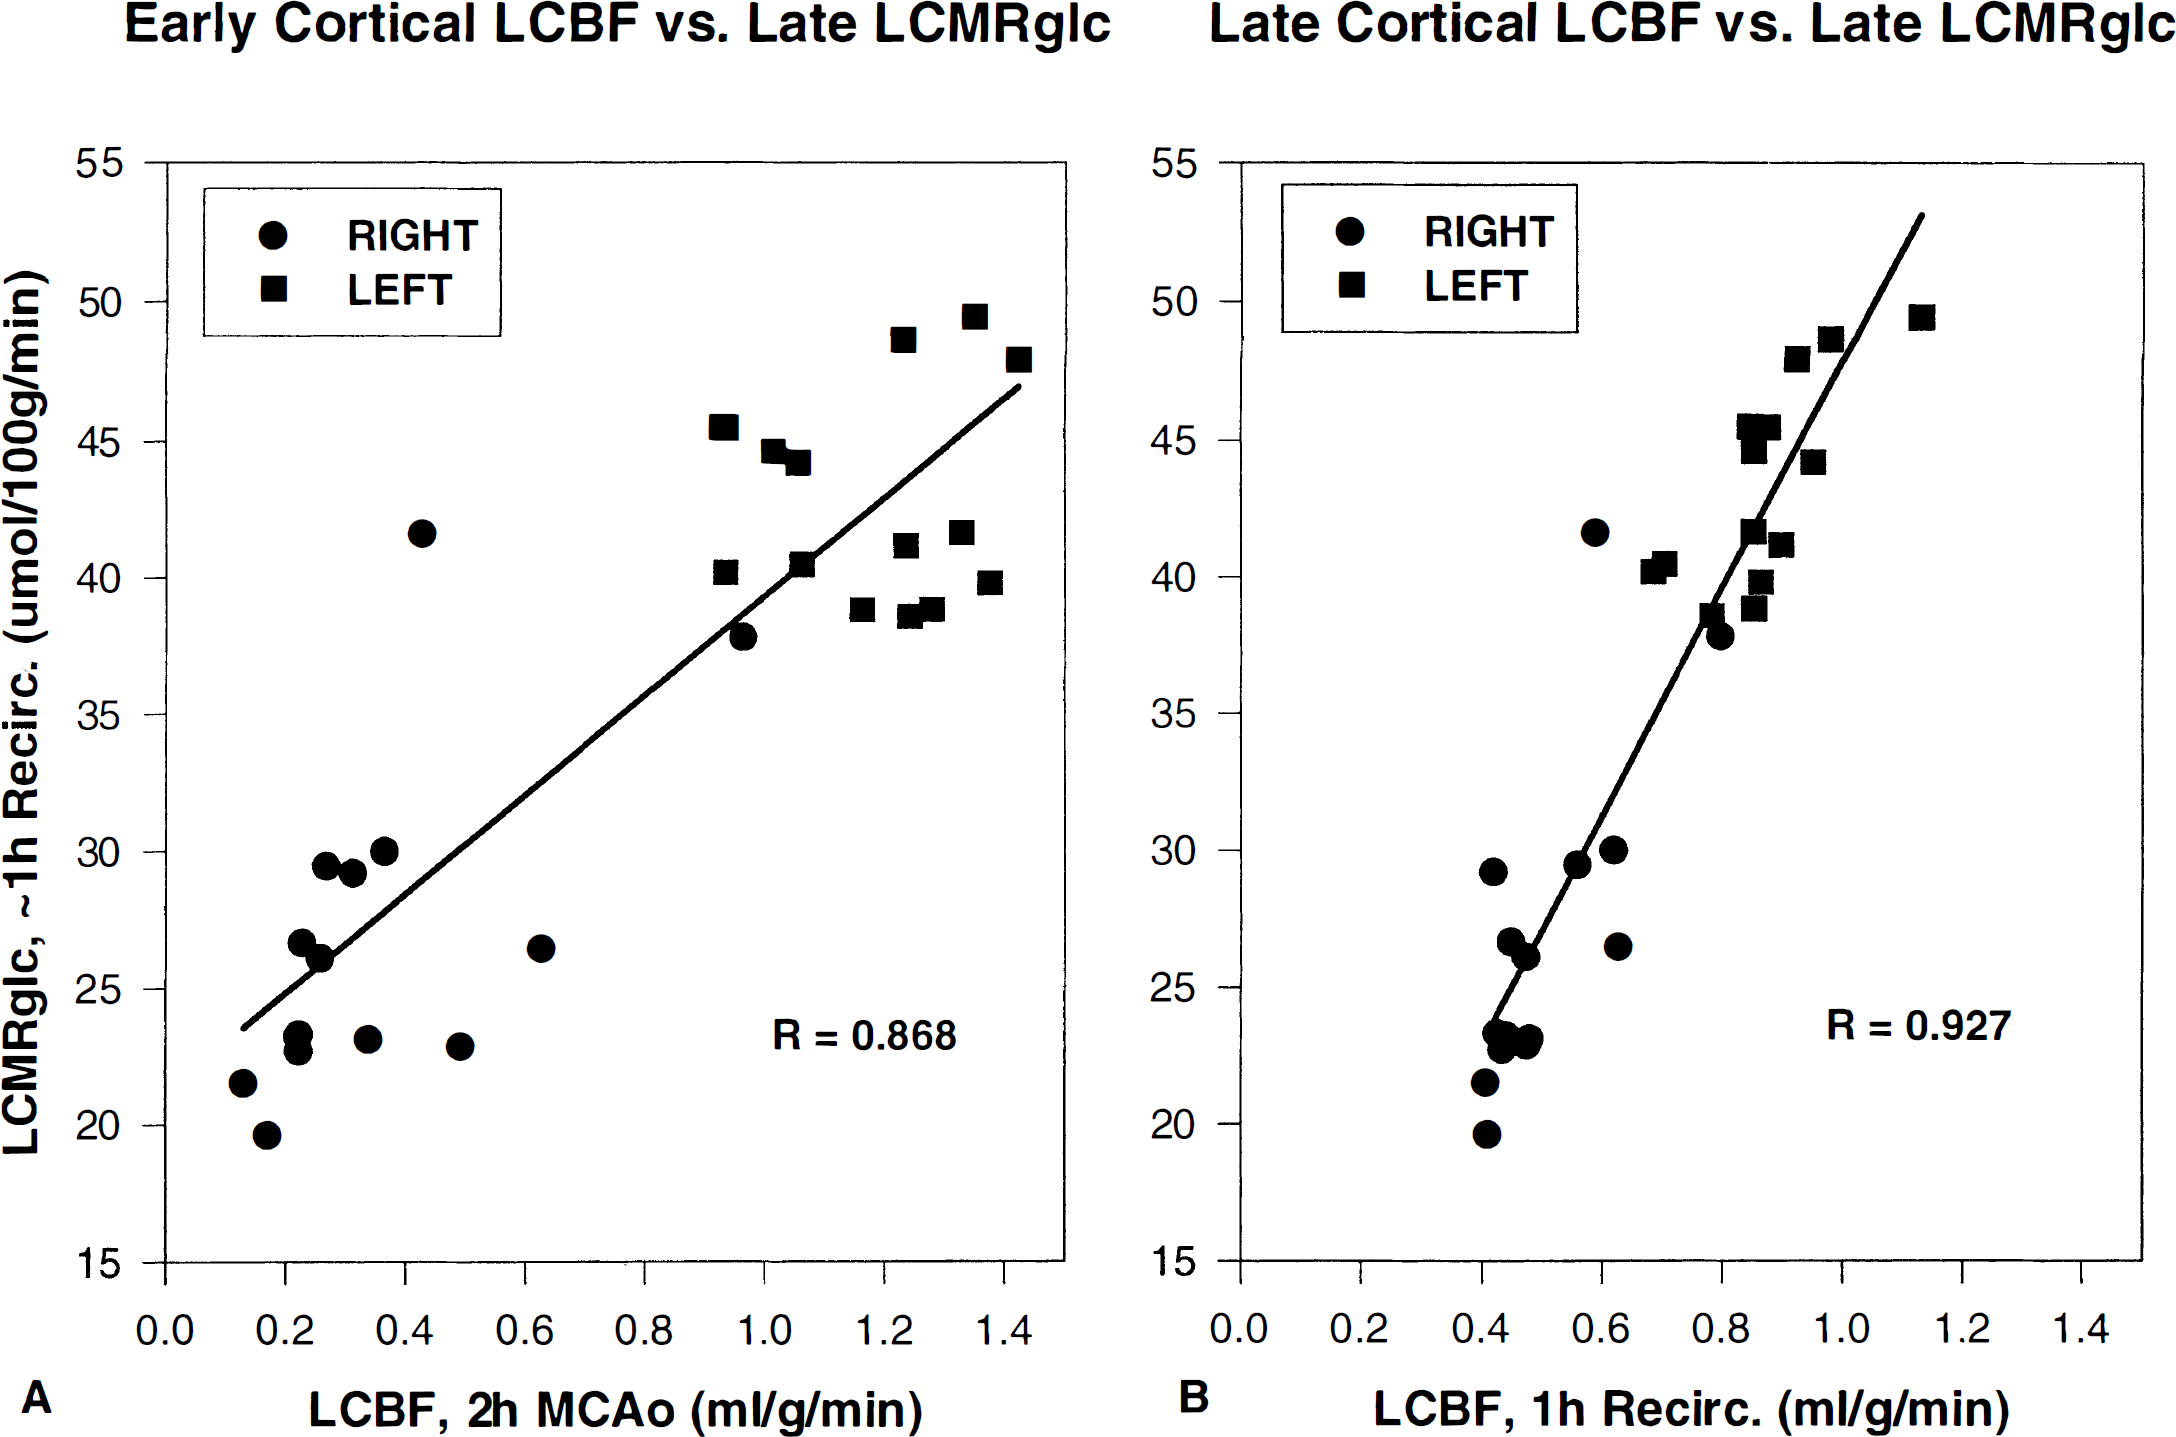
Linear regression analysis of mean cortical LCBF during 2 hours of MCAO (
Image analysis of the ischemic core and penumbra
Figure 3 shows threshold images of average LCBF, LCMRglc, and the LCMRglc/LCBF ratio in the ischemic penumbra at four representative levels. Pixel measurements (Table 5) revealed that the ischemic penumbra at 2 hours of MCAO (defined as LCBF 20% to 40% of control) amounted, on average, to 26.4% of the entire right hemisphere, virtually equal to the size of the ischemic core (33.4%). As shown in Fig. 3, the ischemic penumbra was concentrated at the frontal and parieto-occipital poles of the ischemic lesion; in the central portions of the ischemic lesion, the penumbra formed a thin shell around the ischemic core.
Pixel-based analysis of ischemic core and penumbra*
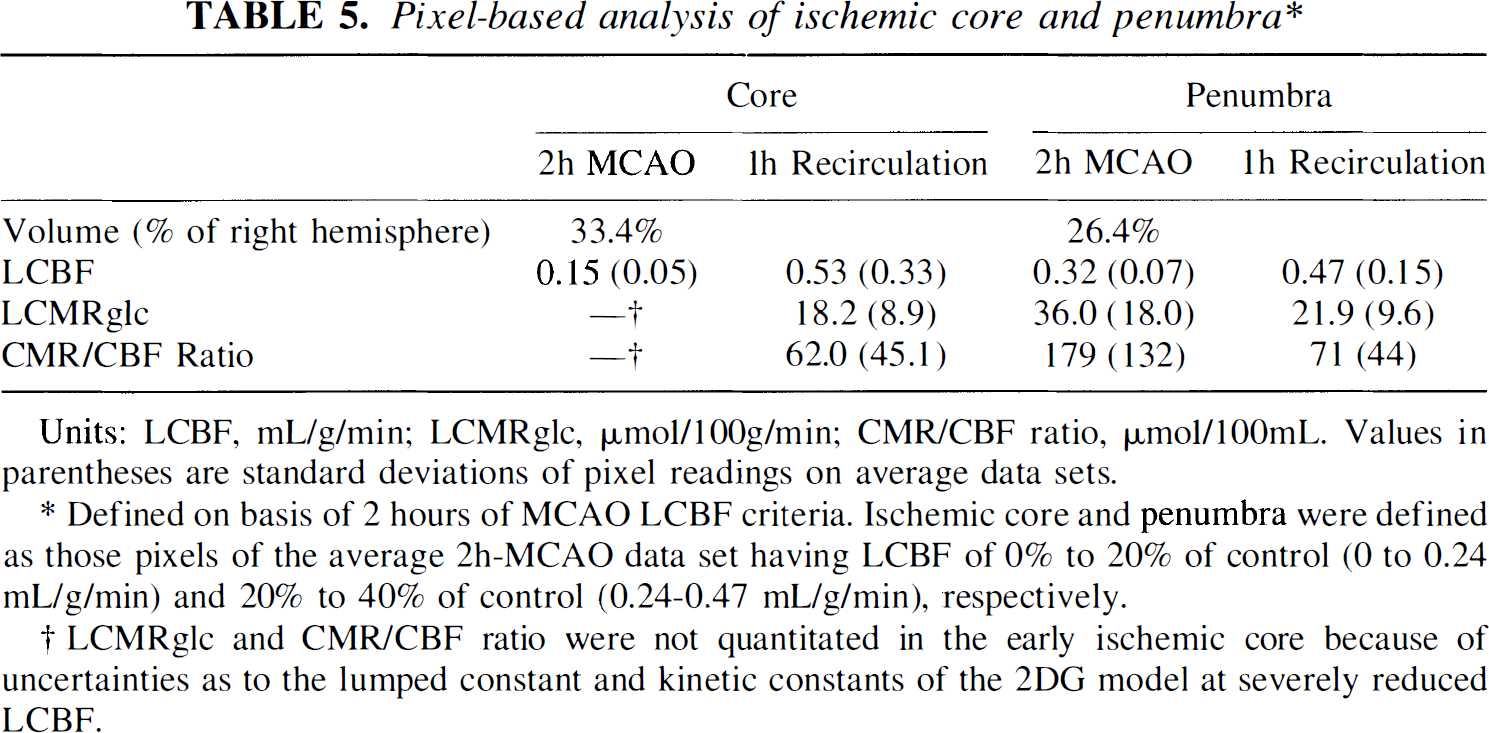
Units: LCBF, mL/g/min; LCMRglc, μmol/100g/min; CMR/CBF ratio, μmol/100mL. Values in parentheses are standard deviations of pixel readings on average data sets.
Defined on basis of 2 hours of MCAO LCBF criteria. Ischemic core and penumbra were defined as those pixels of the average 2h-MCAO data set having LCBF of 0% to 20% of control (0 to 0.24 mL/g/min) and 20% to 40% of control (0.24–0.47 mL/g/min), respectively.
LCMRglc and CMR/CBF ratio were not quantitated in the early ischemic core because of uncertainties as to the lumped constant and kinetic constants of the 2DG model at severely reduced LCBF.
The mean CBF value of the ischemic penumbra, averaged over all image pixels, was 0.32 mL/g/min (Table 5). After 1 hour of recirculation, LCBF in these same (former penumbral) pixels had increased on average, to 0.47 mL/g/min. Table 5 and Fig. 3 show that LCMRglc within the early ischemic penumbra (at ~2 hours of MCAO) was well preserved, whereas after ~1 hour of recirculation, penumbral LCMRglc had declined severely (to 22 μmol/100g/min; Table 5). The ratio of local glucose utilization to blood flow (LCMRglc/LCBF) is tabulated in Tables 4 and 5 and is depicted for the penumbra in Fig. 3. In the acute ischemic penumbra (at ~2 hours of MCAO), the LCMRglc/LCBF ratio was markedly elevated (on average, 179 μmol/100 mL, or about four-fold above the mean left-hemisphere value). In marked contrast, after ~1 hour of recirculation, the metabolism/flow uncoupling noted in the penumbra at 2 hours MCAO had almost completely subsided (71 μmol/100mL), but comparison of the global mean ratio for right- versus left-sided structures showed a small but significant persistent right-sided elevation (66.0 ± 15.9 versus 56.5 ± 6.9 μmol/100mL, respectively; P = 0.009; data of Table 4). In addition, a small but highly significant difference was noted between the left-hemisphere LCMRglc/LCBF ratio measured at 2 hours of MCAO (44.6 ± 8.2) versus at 1 hour of recirculation (56.5 ± 6.9 μmol/100mL) (P < 0.0001; Table 4).
Figure 6 shows the relationship between right-sided LCBF and LCMRglc values during 2 hours of MCAO (Fig. 6A) and after recirculation (Fig 6B), for those cortical regions having LCBF values in the core or penumbral ranges during ischemia (0% to 40% of control). During MCAO, this relationship was complex, reflecting normal or elevated LCMRglc in the face of moderate ischemia, i.e., uncoupling (Fig. 6A). By contrast, these same right-sided cortical structures showed a vastly different metabolism/flow relationship after recirculation, which now could be well described by a first-order curve fit (Fig. 6B).
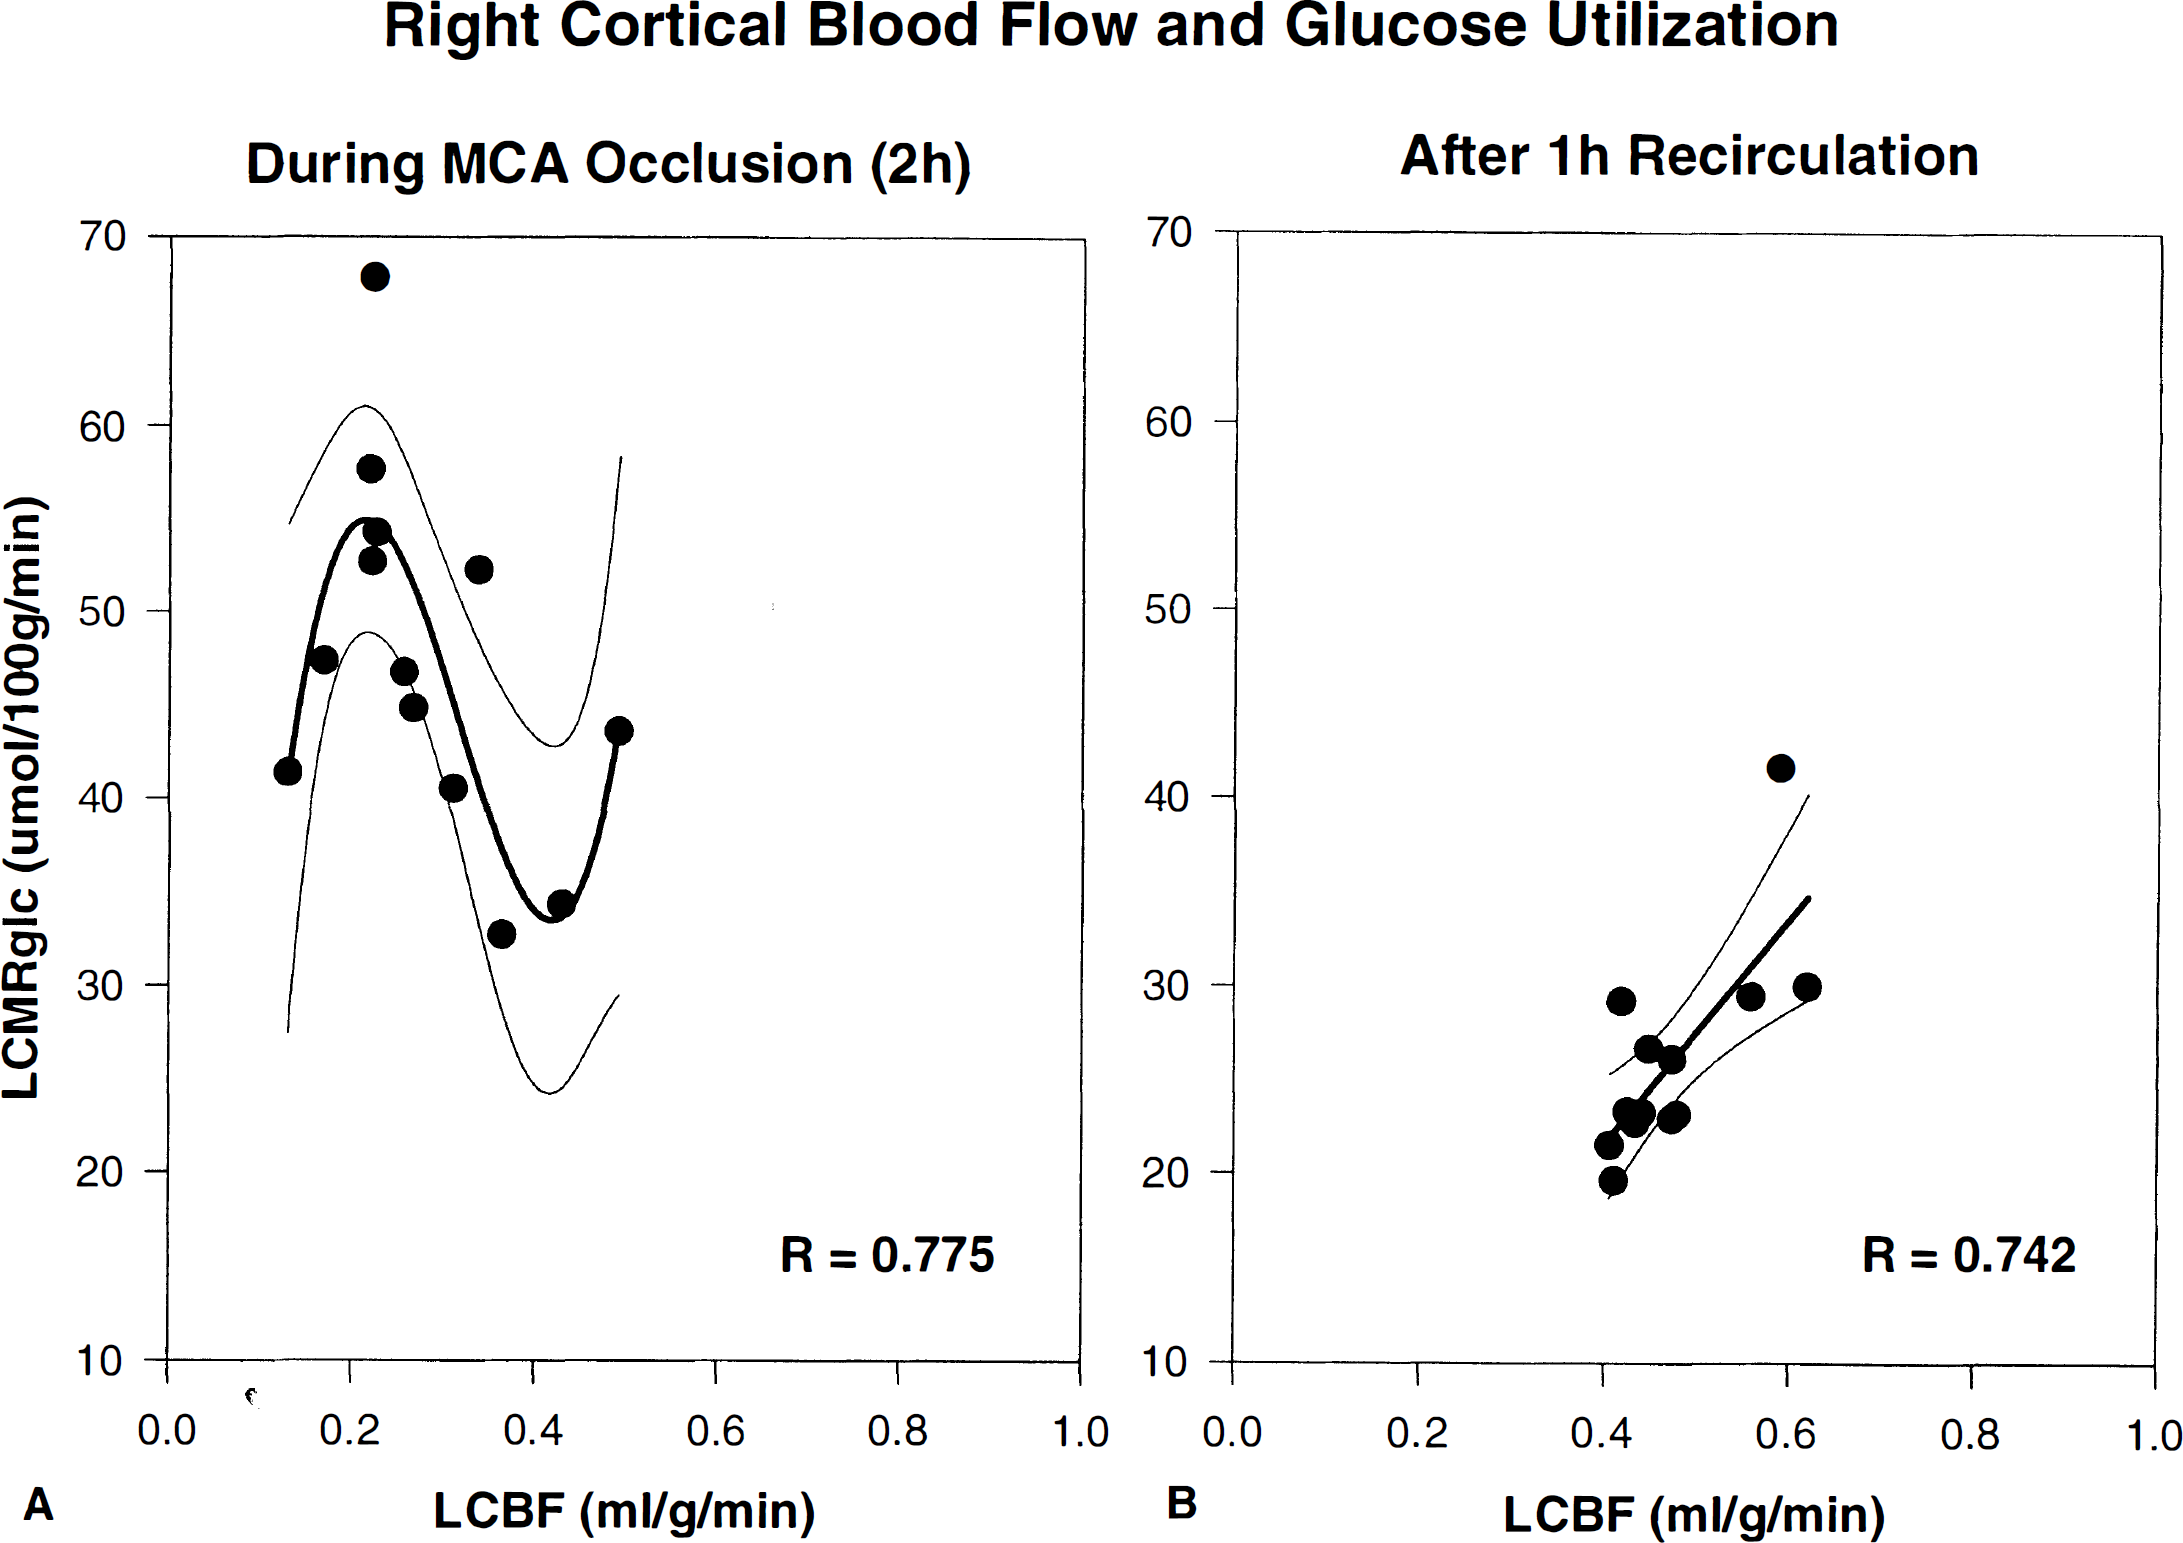
Relationship between mean LCBF and LCMRglc during 2 hours of MCAO (
DISCUSSION
This study was greatly enabled by the opportunity to combine a highly consistent and technically straightforward model of transient focal ischemia with a robust, pixel-based autoradiographic image-averaging approach that facilitated the comparative analysis of averaged multimodal image data sets obtained under differing physiological conditions (ischemia and recirculation) and permitted extensive topographic and statistical analysis.
Model consistency
The hemodynamic consistency of this model of MCA suture-occlusion is evident in the well-demarcated topography of the early ischemic lesion (Fig. 2) and the acceptable interanimal variability of LCBF within ischemic brain structures (Table 2; mean coefficient of variation for LCBF at 2 hours of MCAO, 35%). We attribute the consistency of the hemodynamic lesion, in part, to our modification of suture preparation by blunting its tip and applying a poly-L-lysine coating to enhance adhesion of the suture to the vascular endothelium (Belayev et al., 1996a). The advantages of this modification include a 100% incidence of infarction after 2 hours of MCAO, predictable size and location of the infarct, and a high degree of interanimal reproducibility of infarct size (coefficient of variation 8%), together with the consistent production of high-grade neurological deficits. This interanimal consistency facilitated the design of the present study, in which data derived from matched animal groups of modest size (n = 5 each) were sufficiently robust to permit detailed quantitative intergroup comparisons.
Memezawa et al. (1992a), using the MCA suture-occlusion method of Koizumi et al. (1986), studied LCBF autoradiographically at 1 and 3 hours of MCAO and reported a gradient of LCBF decrements affecting dorsolateral, lateral, and inferolateral neocortices (approximately 0.6 to 0.7, 0.2 to 0.3, and 0.1 to 0.2 mL/g/min, respectively) and caudoputamen. The highest degrees of ischemia (at 60 minutes of MCAO) were in the somatosensory cortex (7% to 8% of contralateral control) and lateral caudoputamen (4% to 12% of control) (Memezawa et al., 1992a). Nagasawa and Kogure (1989) also reported severe LCBF reductions in lateral caudoputamen (2% of control) and frontoparietal somatosensory cortex (10% of control) with 1 to 3 hours of MCAO. Our LCBF findings at 2 hours MCAO are similar.
Topography of the ischemic lesion: core versus penumbra
A unique feature of this study is that pixel-based analytical methods could be applied to averaged data sets encompassing virtually the entire hemisphere so as to yield precise estimates, both of the LCBF and LCMRglc alterations within multiple atlas-defined anatomic regions (Tables 2 to 4), as well as of overall affected tissue volumes (Table 5). In agreement with our previous observations in a rat model of photothrombotic distal MCAO (Back et al., 1995), the total early hemodynamic lesion (defined as pixels with LCBF < 40% of contralateral values at 2 hours of MCAO) was very sizeable, amounting to nearly 60% of hemispheric pixels at the 8 coronal levels analyzed (Table 5). Remarkably, the ischemic penumbra alone comprised fully 44% of the total hemodynamic lesion. (In our earlier MCAo study (Back et al., 1995), this figure was 54%.) As neuroprotectant pharmacotherapy is thought chiefly to target the ischemic penumbra (Ginsberg, 1995), the substantial size of the early penumbra in this model commends it for use in such studies.
Anatomic areas having ischemic-core CBF values in this study included primary and supplementary somatosensory cortices, temporal and inferolateral cortex, and widespread portions of caudoputamen. Penumbral-level CBF was present in fore- and hindlimb areas, occipital and entorhinal cortex, and portions of caudoputamen, while hippocampus was only marginally ischemic, and thalamic CBF values were in the supraischemic range (Table 2). This CBF distribution is consonant with the consistent forelimb placing deficits observed in this model (more completely analyzed in the comparison article [Zhao et al., 1997]). Thus, this model shows gradients of LCBF within the ischemic range extensively involving both cortical and subcortical sites, in keeping with other models of proximal MCAO (Tamura et al., 1981; Tyson et al., 1984; Takagi et al., 1995).
Physiology of the ischemic penumbra
It is useful to conceptualize the penumbra as a hemodynamically altered zone suspended precariously below the LCBF threshold needed, on the one hand, to support synaptic transmission but above that required, on the other hand, for maintenance of cellular ionic homeostasis (Astrup et al., 1981; Strong et al., 1983; Heiss, 1992; Hossmann, 1994; Obrenovitch, 1995; Back et al., in press). The experimental literature suggests that although the absolute CBF thresholds for failure of synaptic transmission and ionic homeostasis may vary with animal species, anesthesia, and ischemia model, nonetheless when these critical flow levels are expressed as percentages of control, consistent threshold levels emerge— ~40%, and ~12% to 15%, respectively (Morawetz et al., 1978; Tamura et al., 1981; Heiss and Rosner, 1983; Strong et al., 1983; Hossmann, 1994; Back et al., in press).
Although controversy continues as to the time-frame within which penumbral deterioration occurs (Heiss et al., 1992; Ginsberg and Pulsinelli, 1994; Fisher and Garcia, 1996; Furlan et al., 1996; Ginsberg, 1997), it is generally appreciated that the penumbra is temporally and spatially dynamic and metastable (Heiss et al., 1994). As careful correlation of local cortical electrical activity with LCBF during ischemia has shown that both the severity and duration of ischemia determine pathological outcome (Heiss and Rosner, 1983), it is likely that subtle differences in LCBF within the various subregions of the penumbra may eventuate in major differences in histopathological outcome.
Dissociation of glucose metabolism and blood flow in the early penumbra
The present results provide further evidence that a marked dissociation of LCMRglc and LCBF characterizes the early ischemic penumbra, attributable to a preservation, on average, of near-normal glucose metabolic rate (Table 3; Fig. 6) in the face of reduced flow (Table 2), resulting in dramatic elevations of the LCMRglc/LCBF ratio in penumbral pixels (Tables 4 and 5; Figs. 3 and 6). This amounted on average to 179 μmol/100 mL—thus representing an almost four-fold elevation of the coupling ratio compared with normal brain. The extent of metabolism-flow dissociation in this study was similar in degree to that observed in our previous study of photothrombotic distal MCAO (Back et al., 1995). In other studies of MCAO, deoxyglucose autoradiography has yielded the consistent observation that zones of normal or increased glucose metabolism are present within an acute ischemic focus, often just peripheral to core-regions of markedly suppressed metabolism (Ginsberg et al., 1977; Welsh et al., 1980; Hossmann et al., 1985; Tanaka et al., 1985; Nedergaard and Astrup, 1986; Back et al., 1995; Yao et al., 1995; Ginsberg et al., 1996; Back et al., in press).
The similarity of this phenomenon across diverse focal ischemia models thus dispels any suspicion that it is a model-dependent epiphenomenon. Furthermore, the near-disappearance of metabolism-flow uncoupling after ~1 hour of recirculation in the current study (Table 4; Fig. 3) substantiates that it is indeed dependent on critical degrees of blood flow reduction.
Evidence from recent studies suggests that recurrent ischemic depolarizations arising in the acute penumbra constitute the probable stimulus driving the inappropriately increased metabolic activity within the penumbra (Hossmann, 1994; Back et al., in press). Recurrent ischemic depolarizations were observed in our previous study of photothrombotic distal MCAO (Back et al., 1995), and the induction of additional depolarization enhanced both histopathological injury and neurobehavioral deficits in that model (Alexis et al., 1996; Back et al., 1996). In other studies, the suppression of ischemic depolarizations by pharmacological antagonism of N-methyl-D-aspartate receptors (Gill et al., 1992; Iijima et al., 1992) or non-N-methyl-D-aspartate receptors (Mies et al., 1994), or by moderate hypothermia (Chen et al., 1993), substantially reduced the volume of ischemic infarction. Ischemic depolarizations seem to be injurious in that, in contrast to the situation with normal spreading depression, LCBF in ischemic tissue is unable to increase in response to heightened metabolic demand, so that tissue oxygen tension falls episodically (Back et al., 1994) and high-energy stores may become depleted (Takeda et al., 1993).
Blood flow and glucose metabolism during early recirculation
The recovery of LCBF after 2 hours of MCAO was remarkable for its regional heterogeneity. While frank hyperemia was evident in basal ganglia (Fig. 2; Table 2), neocortical areas that had been equally ischemic (e.g., somatosensory, temporal, and inferolateral cortices-Table 2) remained hypoperfused at 1 hour of recirculation. Although the reasons for this remain unclear, it is nonetheless apparent that the postischemic LCBF recovery of the various neocortical regions was highly correlated to their respective levels of LCBF during the antecedent ischemic period (R = 0.093, Fig. 4). This is consistent with the possibility that higher degrees of neocortical ischemia in this model may enhance intravascular sedimentation and sludging of blood elements, offering a rheologic impediment to subsequent microvascular reperfusion (Hossmann, 1993).
Reports of LCBF during recirculation in MCA suture-occlusion models are scanty. In one such study in which the suture method of Koizumi et al. (1986) was applied, LCBF increased to approximately 30% of contralateral levels after 15 minutes of reperfusion, with a high degree of interanimal variability (Memezawa et al., 1992b). Heterogeneous reperfusion was also noted in the study of Nagasawa and Kogure (1989) although their differing study-time points prevent precise comparisons with the current findings.
Local glucose utilization, although heterogeneous, was preserved at near-normal levels during MCAO (Table 3; Figs. 2, 3 and 6A) but tended to decrease by about 40% to 60% in previously ischemic structures at ~1 hour of recirculation, to levels which in previous studies from our laboratory (Yao et al., 1995) have signalled irreversible injury. The high degree of correlation noted between LCBF in cortical structures measured during MCAO and the LCMRglc of those same structures 1 hour later (R = 0.93, Fig. 5B) strongly supports the hypothesis that this early metabolic deterioration is primarily determined by the severity of antecedent ischemia. The companion article (Zhao et al., 1997) presents a detailed pixel-based correlative analysis of LCMRglc and histopathology in this model to support the view these low LCMRglc levels indeed imply irreversible tissue injury. Thus, ischemia of severe degree in this model, if lasting for 2 hours, triggers injury processes that cannot be reversed by partial spontaneous reperfusion alone.
To summarize, by studying LCBF and LCMRglc in matched series at both 2 hours of MCAO and 1 hour of postischemic recirculation in a commonly used model of temporary MCAO, we have established the following: (1) the presence of consistent graded LCBF decrements within cortical and basal ganglionic regions during ischemia; (2) a topographically well-demarcated ischemic penumbra (Fig. 3), characterized by preserved LCMRglc and uncoupling of glucose utilization and blood flow during ~2 hours of MCAO; (3) regionally heterogeneous restoration of LCBF on recirculation, comprising both hyperemic foci within basal ganglia and persistent moderate hypoperfusion of cortical regions; and (4) substantially depressed LCMRglc within the previous ischemic core and penumbra by ~1 hour of recirculation (suggesting nonviability), associated with near-normalization of the LCMRglc/LCBF ratio. The companion study which follows (Zhao et al., 1997) places these findings in pathophysiological perspective by correlating them to patterns of infarctive histopathology in this model.
Footnotes
Acknowledgments
The authors thank Isabel Saúl and Ofelia Alonso for their superb assistance in the autoradiographic studies, and Judith Y. Loor-Estades for her skillful autoradiographic preparation.