
Abstract
The mRNA expression of the proinflammatory cytokine interleukin-1β (IL-1β) has been shown to be induced in neural elements during ischemia. It is not clear which cells generate the IL-1β mRNA and eventually synthesize IL-1 protein and which cells respond to this signaling by producing IL-1 receptors during ischemia. To clarify this question, rats were subjected to global ischemia by bilateral carotid occlusion and hypotension for 20 minutes, followed by reperfusion for 2 hours (n = 7), 8 hours (n = 7), or 24 hours (n = 7). Cryostat sections were hybridized using antisense oligonucleotide probes (30 dimer). Multiple cell markers were used in immunohistochemical staining to identify the cells expressing IL-1β and IL-1R protein. The sham animals (n = 5) showed no or only a weak expression of IL-1R or IL-1β mRNA. The number of IL-1β mRNA-expressing cells was significantly increased by 2 hours of reperfusion in several brain areas including cortex (12-fold compared with sham) and caudate-putamen (14-fold), and was maximally increased in most hippocampal regions by 8 hours of reperfusion (mean ± SD of positive cells/field versus sham equivalent being 37.9 ± 12.3 versus 4.0 ± 3.3; 30.6 ± 9.0 versus 3.1 ± 2.3; 41.3 ± 17.5 versus 2.9 ± 1.9; in CA1; CA2; CA3/CA4 regions of the hippocampus, respectively). IL-1β mRNA signal was also intensified in the white matter areas. Changes in IL-1R mRNA were seen in the hippocampus (after 2 hours CA1: 16-fold; CA2: 17-fold; DG: 24-fold increase; and CA3/CA4: 10-fold increase after 8 hours), and the expression was prolonged especially in CA1 and CA2 regions up to 24 hours of reperfusion. The major cellular source of IL-1β protein was glia (astrocytes, oligodendrocytes, microglia, and scattered perivascular macrophages/monocytes), while neurons and sporadic microvascular endothelia showed IL-1R immunoreactivity. The data suggest that neurons in discrete areas vulnerable for selective neuronal death, and possibly the vascular endothelium, are target cells for ischemia-induced glial IL-1β production.
Expression of cytokines, a heterogeneous group of pleiotropic polypeptides mediating immune and inflammatory effects, can occur in the CNS as a response to local or systemic infection or injury. A number of cytokines have been shown to be produced in ischemic brain injury, including interleukin-6 (IL-6), fibroblast growth factor, transforming growth factor-β, interleukin 1-β (IL-1β) (Hopkins and Rothwell, 1995), and tumor necrosis factor-α (Liu et al., 1994; Szaflarski et al., 1995). Interleukin-1 is a potent enhancer of inflammatory reactions through liberation of other inflammatory metabolites or enzymes such as prostaglandins, collagenase, and phospolipase A2 (Benveniste, 1992). Interleukin-1 also stimulates numerous cell types to synthesize cytokines, including IL-6, tumor necrosis factor-α, colony stimulating factors, and IL-1 itself (Benveniste, 1992).
Interleukin-1 has been postulated to be a mediator in the pathogenesis of ischemic brain damage. It may participate in the transformation of the vascular endothelium from normally anti-thrombotic to procoagulant and proadhesive surface after ischemia (Hallenbeck and Dutka, 1990). Moreover, IL-1 acts on endothelial cells to promote leukocyte adhesion and transmigration into the brain tissue, thus aggravating the ischemic brain damage and edema (Hallenbeck and Dutka, 1990). In fact, intracerebroventricular injection of recombinant human IL-1 has been shown to increase brain edema in transient focal ischemia in rats, and this can be antagonized by injection of an IL-1 blocker, zinc protoporhyrin (Yamasaki et al., 1992). A pathophysiologic role for IL-1 in cerebral ischemia is further supported by several recent studies, where IL-1 antagonism has been shown to protect against ischemic damage (Relton and Rothwell 1992; Betz et al., 1995; Garcia et al., 1995; Yamasaki et al., 1995). On the other hand, wound healing and neuronal growth and repair have been suggested to be mediated by this multi-faceted cytokine (Rothwell, 1991).
Cytokines initiate their actions by binding to specific membrane receptors on target cells. The response of a particular cell to a given cytokine is determined by the level of expression of the cytokine receptors and the signal transduction pathways of the target cell, which are activated by the cytokine (Benveniste, 1992). The IL-1 effect is mediated by two distinct gene products, namely IL-1α and IL-1β. Both IL-1 forms recognize the same cell surface IL-1 receptor, IL-1R (Hopkins and Rothwell, 1995). An endogenous IL-1 inhibitor, interleukin-1 receptor antagonist (IL-1Ra), mRNA has been described in the hippocampus, hypothalamus, choroid plexus, cerebellum, and in the blood vessels throughout the unstimulated rat brain (Licinio et al., 1991). Later, the mRNA for the type I IL-1 receptor was shown to colocalize with the above-mentioned distribution of the endogenous antagonist of IL-1 function (Cunningham et al., 1992).
Although neurons, astroglia, perivascular monocytes/macrophages, and endothelial cells are also capable of expressing cytokines, the dominant source of cytokines after brain damage seems to be activated microglia (Hopkins and Rothwell, 1995). However, the cellular localization of IL-1 receptors(s) in the brain is not known, neither is any description of the receptor in brain ischemia available. Therefore, we studied the temporal and spatial distribution of mRNA for IL-1β and IL-1R combined with the topography of IL-1β and IL-1R protein distribution in a rat transient global ischemia model. We hypothesized that global ischemic injury would result in differential expression of interleukin-1 and its receptor in glial and neuronal cells, enabling us to better characterize the relationship between these neural elements through cytokines in cerebral ischemia.
MATERIALS AND METHODS
Twenty-six, 16-week old (275 to 470 g; mean 358 ± 53.0 g) male Sprague-Dawley rats (Taconic Farms, Germantown, NY, U.S.A.) were used. The experiments reported herein were conducted according to the principles set forth in the Guide for Care and Use of Laboratory Animals, Institute of Laboratory Animal Resources, National Research Council (DHEW publication No. NIH 85-23, 1985).
Global ischemia
Transient forebrain ischemia was produced as previously described by Smith et al. (1984). In brief, ischemia was achieved in rats by bilateral carotid artery clamping for 20 minutes combined with hypotension induced by systemic hemorrhage and followed by 2, 8, or 24 hours of reperfusion. Rats were anesthetized with 1 to 2% halothane and 30/70 mixture of O2 and N2O. The CBF was measured on-line (2-mm posterior to bregma) by laser Doppler flowmetry (BPM, 403, TSI Inc., St. Paul, MA, U.S.A.) according to a technique described elsewhere (Lindsberg et al., 1991). The volume of blood withdrawn through a PE-50 catheter placed in the left femoral artery varied between 6.0 to 12.0 mL and was adjusted to maintain CBF values below 10% of the baseline value. Blood gas analyses were performed repeatedly to nearly half of the animals. The pH was corrected routinely by giving sodium bicarbonate (75 mg/mL) intravenously. Mean arterial blood pressure was recorded in all experimental animals (Physiograph MK IV, Narco, Houston, TX, U.S.A.). Five sham animals went through the same surgical procedures except for the occlusion of the carotid arteries and the systemic hypotension. The animals were killed with an overdose of pentobarbital at 2 (n = 7), 8 (n = 7), or 24 hours (n = 7) of reperfusion. Transcardial perfusion with precooled phosphate buffered saline (PBS) for 4 to 5 minutes was completed before the removal of the brain, which was immediately frozen and stored at −70°C until examined. The sham animals were killed at 24 hours of reperfusion.
Tissue preparation
Coronal sections (18 μm) of the frontal lobe at the level of the striatum and the hippocampus were cut in a cryostat (Model Microm 505HM, Microm GMBH). Two sections were mounted on a gelatin-coated slide (Rite-on micro slide, Becton Dickinson Labware, NJ, U.S.A.) separated by about 360 μm.
In situ hybridization of brain sections
The probes used were 30 base pair oligonucleotide sequences complementary to the rat cDNA to mRNA sequences for rat IL-1β and IL-1 receptor (Type I) in the GenBank. The antisense oligonucleotide sequences were as follows: (1) IL-1β: TGT GCC ACG GTT TTC TTA TGG CTC TGA GAG and (2) IL-1 receptor: GTG TCC AGC ACA GGA TCC AGG GTT AAT AAG. These sequences had no overlap with other rodent cytokine mRNA and they had less than 10 base pair continuous homology to any other mRNA sequences in the rodent gene bank. Northern blot analysis of the target RNA for each oligonucleotide sequence demonstrated upregulation by lipopolysaccharide treatment and the positive blots corresponded in size to the appropriate mRNA for IL-1β and IL-1 receptor as described in the literature. Sense probes of equivalent length contained a mirror image sequence of the antisense oligonucleotides.
The tissue sections were postfixed in 4% formaldehyde in PBS (phosphate buffered saline) for 10 minutes and washed quickly with PBS. Pretreatment of the slides was continued with further fixation in 4% formaldehyde/PBS, followed by two PBS rinses. The sections were then acetylated for 10 minutes with 0.25% (volume to volume ratio) acetic anhydride and 0.1 mol/L triethanolamine in sterile 0.9% (weight to volume ratio) NaCl (pH 8.0), dehydrated through graded ethanols, extracted with chloroform for 5 minutes and rehydrated through graded ethanols. The oligonucleotides were 3′-end labeled with [35S]dATP using terminal deoxytransferase to a specific activity of approximately 5 × 10⁶ cpm/ng. Hybridization was performed overnight in a humid chamber at 37°C in a volume of 100 μL of probe and hybridization buffer mixture, each milliliter consisting of 500 μL 100% deionized formamide, 120 μL 5 mol/L NaCl, 40 μL 2 mol/L TRIS-HCL/100 mmol/L EDTA, 10 μL 10% Na pyrophosphate, 20 μL 10% SDS, 200 μg heparin, 200 μL 50% dextran sulfate, 20 μL 5 mol/L DTT, and 80 μL of labeled probe and sterile water to arrive at 1 × 10⁶ cpm/slide. After hybridization, the slides were washed at 42°C with four changes in 50% formamide in 2 × SSC for 1 hour and with 2 changes in 1 × SSC for 1 h. Hybridized radioactivity was visualized by exposing the slides on Kodak NTB2 or NTB3 emulsion for 2 to 4 weeks, developed, and counter stained either with hematoxylin and eosin or cresyl violet.
Light microscopy of in situ hybridization slides
The slides were examined under light microscope by an investigator (T.V.) unaware of the experimental conditions. The colocalization of the silver grains with the cresyl violet counter stain (Nissl stain for cytoplasmic rough endoplasmic reticulum [RER]) indicated positive neuronal cell bodies, referred to as neuronal (cell body) expression of the mRNA later in the text. The Nissl-stained glial cells were identified based on their small size (less than 10 to 15 μm) and intensive staining (“dark cells”) (Gerfen, 1989). The cells were counted as positive when they showed >20 silver grains per cell with the magnification of 256× (Fig. 1). The mean of positive cells per field was based on counting 2 or 5 fields/brain area in each animal with the magnification 400× (Tables 1, 2, and 3).
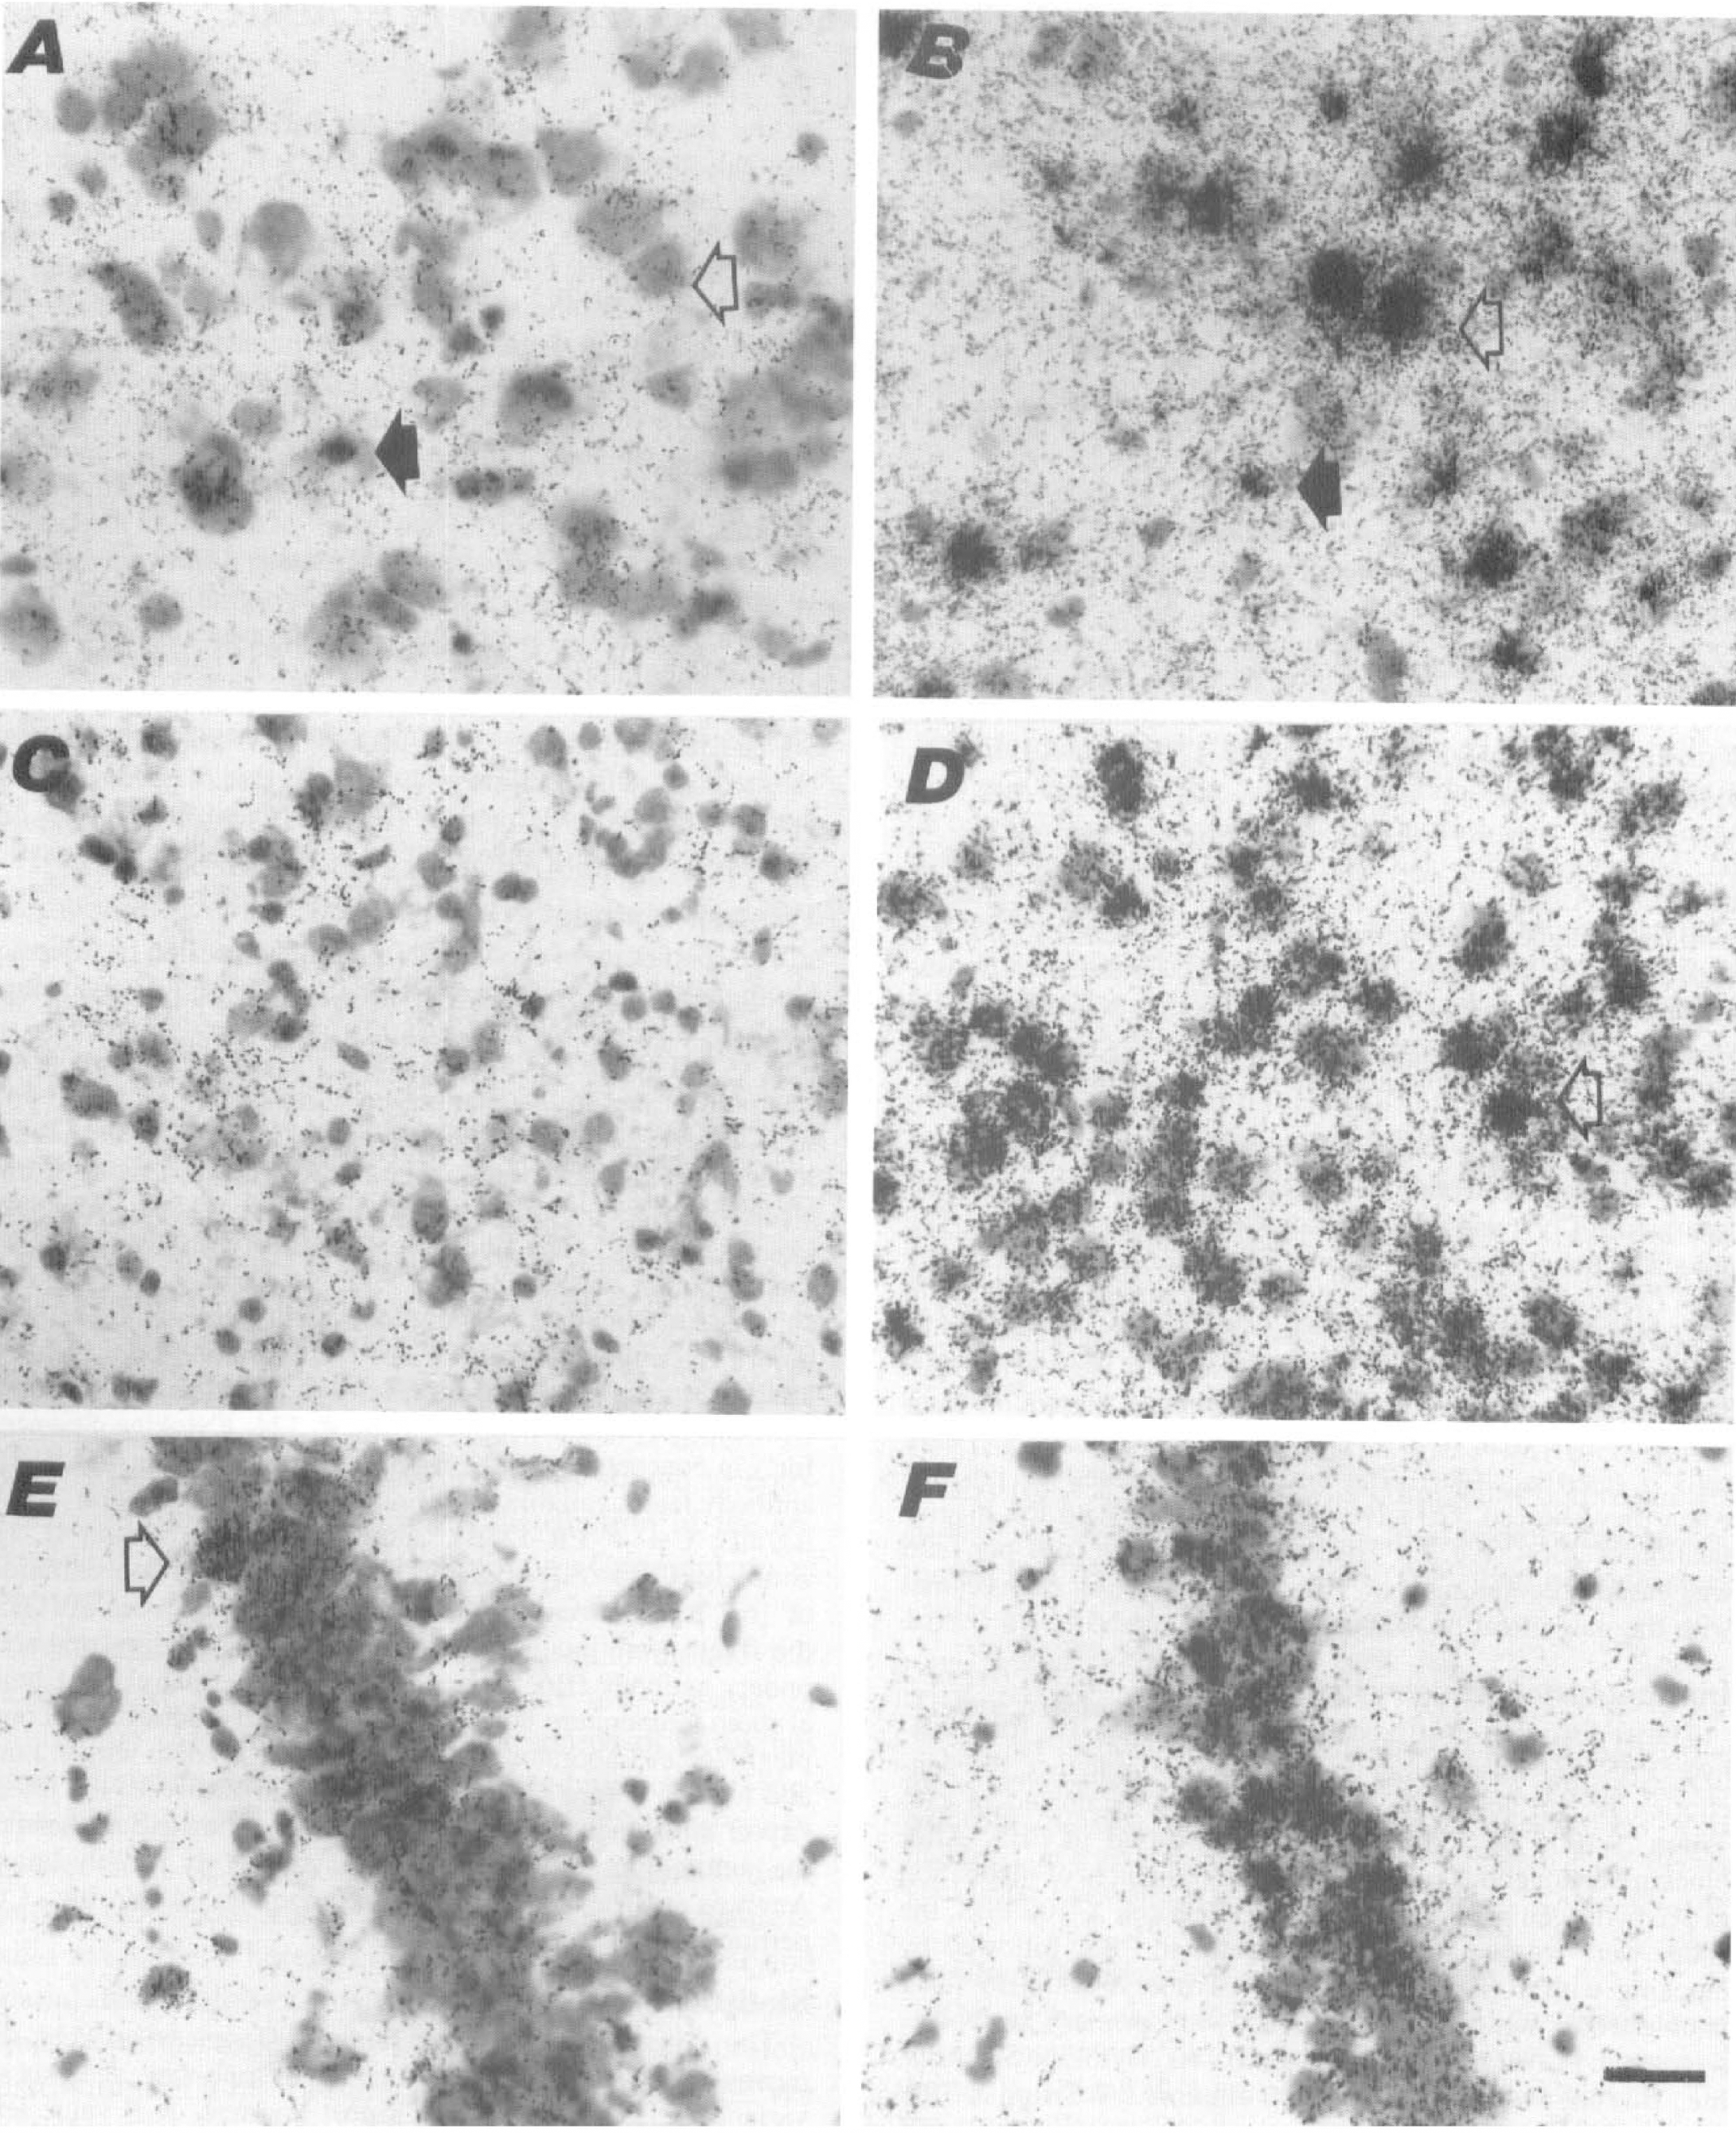
Hybridization of IL-1β and IL-1 Receptor mRNA in sham and postischemic brains.
Mean ± SD of IL-1β mRNA positive cells/field at the level of the striatum
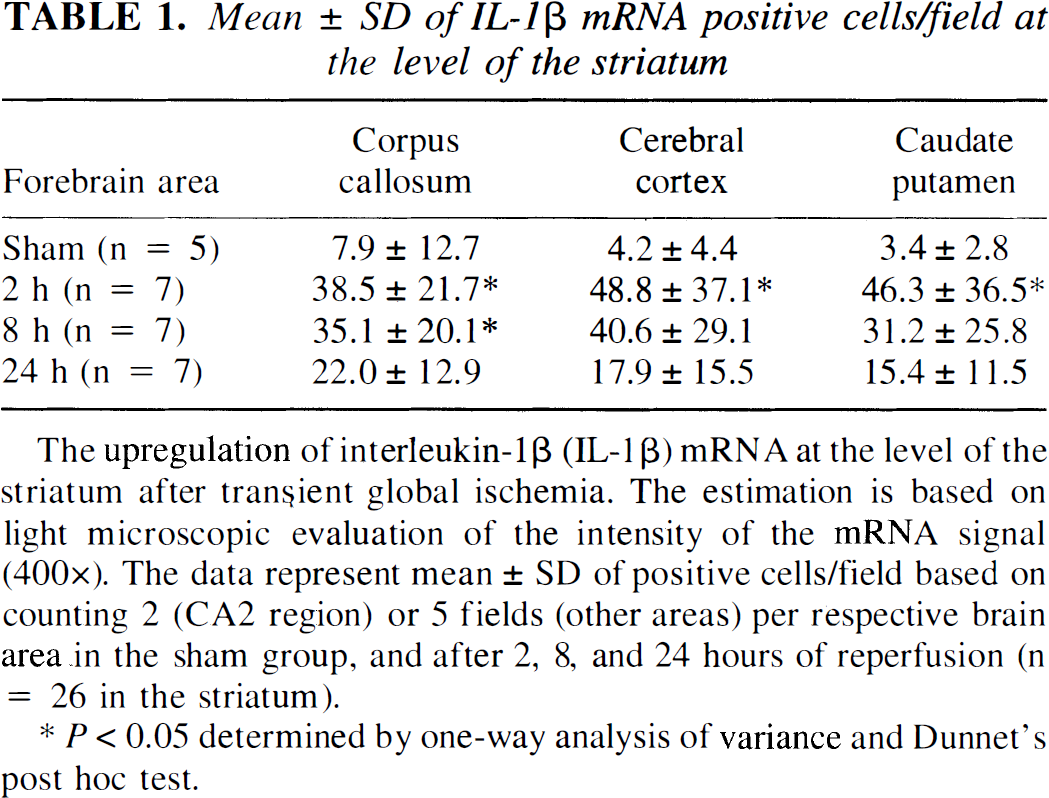
The upregulation of interleukin-1β (IL-1β) mRNA at the level of the striatum after transient global ischemia. The estimation is based on light microscopic evaluation of the intensity of the mRNA signal (400×). The data represent mean ± SD of positive cells/field based on counting 2 (CA2 region) or 5 fields (other areas) per respective brain area in the sham group, and after 2, 8, and 24 hours of reperfusion (n = 26 in the striatum).
P < 0.05 determined by one-way analysis of variance and Dunnet's post hoc test.
Mean ± SD of IL-1β mRNA positive cells/field at the level of the hippocampus
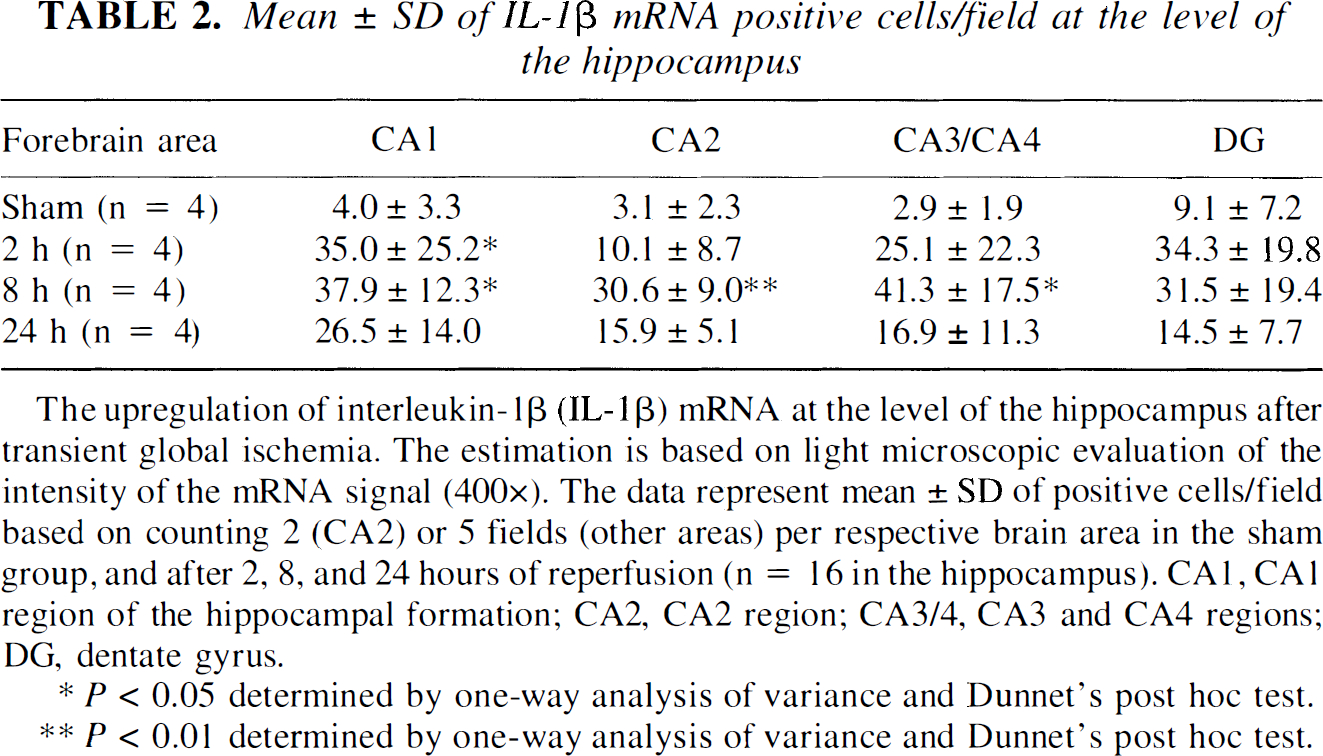
The upregulation of interleukin-1β (IL-1β) mRNA at the level of the hippocampus after transient global ischemia. The estimation is based on light microscopic evaluation of the intensity of the mRNA signal (400×). The data represent mean ± SD of positive cells/field based on counting 2 (CA2) or 5 fields (other areas) per respective brain area in the sham group, and after 2, 8, and 24 hours of reperfusion (n = 16 in the hippocampus). CA1, CA1 region of the hippocampal formation; CA2, CA2 region; CA3/4, CA3 and CA4 regions; DG, dentate gyrus.
P < 0.05 determined by one-way analysis of variance and Dunnet's post hoc test.
P < 0.01 determined by one-way analysis of variance and Dunnet's post hoc test.
IL-1 receptor mRNA expression and immunoreactivity in different hippocampal regions after global ischemia
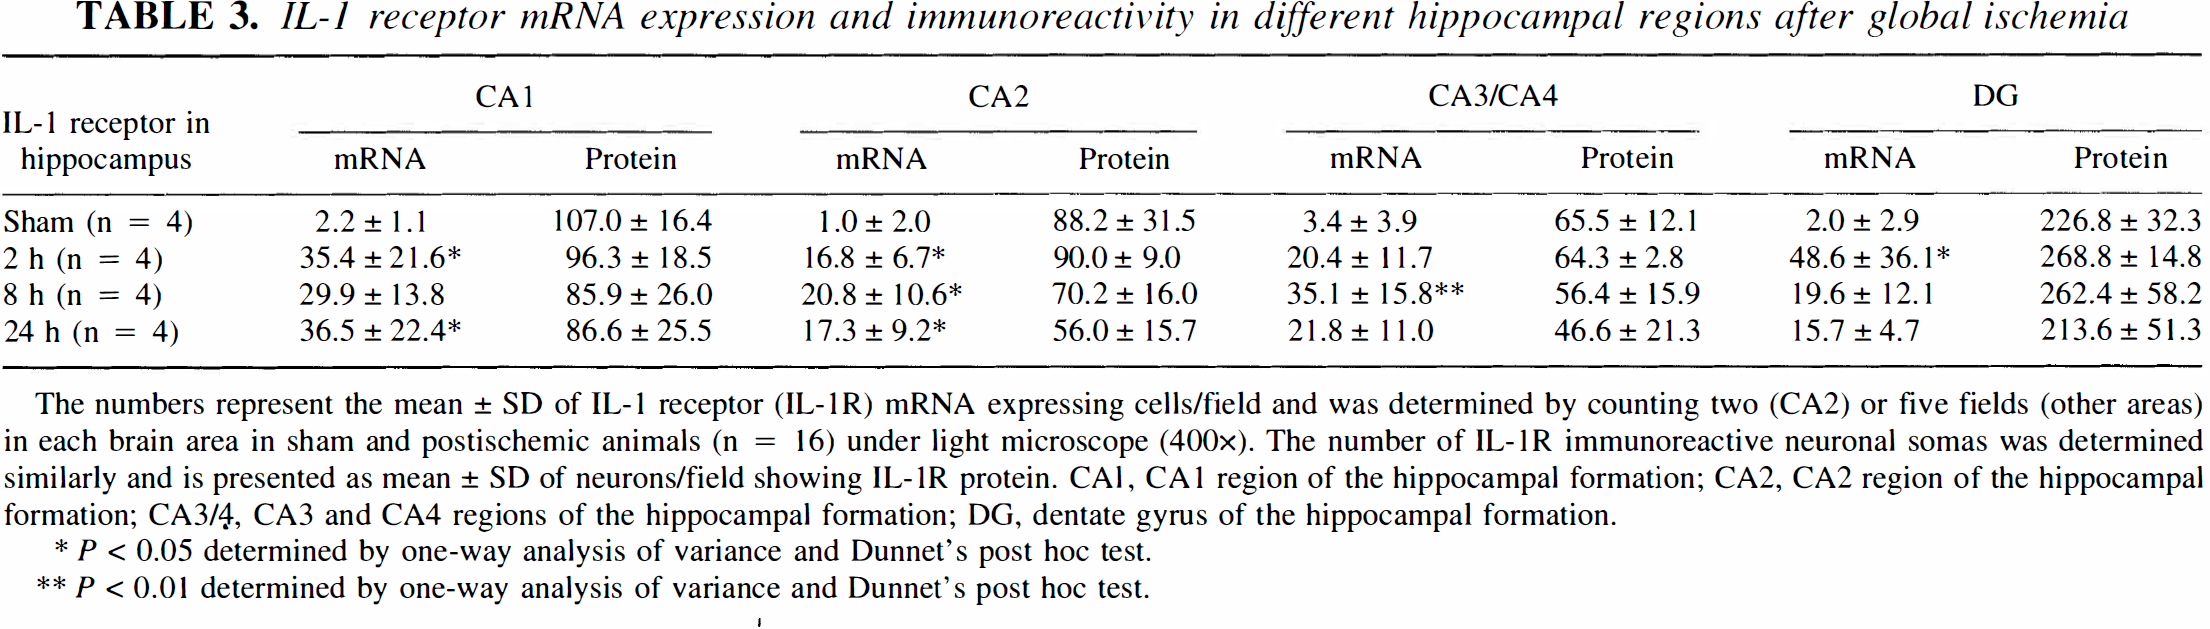
The numbers represent the mean ± SD of IL-1 receptor (IL-1R) mRNA expressing cells/field and was determined by counting two (CA2) or five fields (other areas) in each brain area in sham and postischemic animals (n = 16) under light microscope (400×). The number of IL-1R immunoreactive neuronal somas was determined similarly and is presented as mean ± SD of neurons/field showing IL-1R protein. CA1, CA1 region of the hippocampal formation; CA2, CA2 region of the hippocampal formation; CA3/4, CA3 and CA4 regions of the hippocampal formation; DG, dentate gyrus of the hippocampal formation.
P < 0.05 determined by one-way analysis of variance and Dunnet's post hoc test.
P < 0.01 determined by one-way analysis of variance and Dunnet's post hoc test.
Immunohistochemistry
The slides were postfixed for 30 minutes in 4% formaldehyde/PBS and rinsed quickly with PBS. To enhance the penetration of the antibodies, the slides were incubated in .3% Triton X-100/PBS for 20 minutes and rinsed in PBS. After blocking endogenous peroxidase with 30 minutes of incubation in 1% hydrogen peroxidase (H2O2)/.3% Triton X-100/PBS, the slides were washed for 2 × 10 minutes in PBS, followed by blocking with 10% normal sera/.3% Triton X-100/PBS for 1 hour at room temperature. The following primary antibodies were used: Polyclonal rabbit anti-rat IL-1β (Cytokine Sciences, Inc., Boston, MA, U.S.A.) in 1:100 dilution/.3% Triton X-100/2% blocking sera/PBS. Polyclonal rabbit anti mouse IL-1RI (M-20) (Santa Cruz Biotechnology, Inc., Santa Cruz, CA, U.S.A.) in 1:1000 dilution was used to identify the interleukin-1 receptor (type I). A control rabbit immunoglobulin G (R IgG) for polyclonals (Endogen, Inc., Cambridge, MA, U.S.A.) was used as a control in the corresponding dilution. Other primary antibodies used on adjacent sections to reveal the IL-1β expressing cell type were: Monoclonal mouse anti-rat CD 11b (MRC OX-42; Serotec, Washington DC, U.S.A.) in 1:1000 dilution; polyclonal rabbit anti-human von Willebrand factor (Dako A/S, Glostrup, Denmark) 1:1000; monoclonal mouse anti-rat myelin/oligodendrocyte (MAB328) (Chemicon International, Inc., Temecula, CA, U.S.A.) 1:1000; monoclonal mouse anti-glial fibrillary acidic protein (Boehringer Mannheim, Indianapolis, IN, U.S.A.) 1:500 (0.04 μg/mL); monoclonal mouse anti-bovine microtubule-associated protein-2 (Boehringer Mannheim) 1:4000 (0.5 μg/mL); monoclonal mouse anti-rat perivascular monocytes/macrophages (ED2) (Serotec, Washington DC, U.S.A.) 1:1000. The control antibodies were of the same immunoglobulin (sub)class as the monoclonal antibodies and in the above-mentioned control, R IgG served as a control for von Willebrand factor antibody in a corresponding dilution. After 20 to 24 hours of incubation with the primary antibody at +4°C, the slides were washed 2 × 10 minutes in PBS. Amplification of the signal was performed by the avidin-biotin method with the appropriate peroxidase kit (Vector Laboratories, Inc., Burlingame, CA, U.S.A.) and visualized by 4 minutes incubation in diaminobenzidine (DAB; Sigma Chemical Co, St. Louis, MO, U.S.A.) with 6 mg/.0003% H2O2/10 mL PBS, followed by a PBS rinse. The slides were then mounted with Permount® (Fischer Scientific, NJ, U.S.A.) and coverslipped for investigation under a light microscope.
Western blotting
The specificity of the IL-1β antibody was tested by Western blotting (Fig. 2). Five ng and 10 ng (in 0.5 μg/mL concentration) or 5, 10, and 50 ng (5 μg/mL) of rat recombinant IL-1β (Cat # 501-RL, R&D Systems Inc.) was diluted with reducing Laemmli buffer for separation on a 15% sodium dodecyl sulfate-polyacrylamide gel and subsequent transfer to nitro cellulose filter (Schleicher & Schnell, Germany) with mini-electrophoretic blotting system (EBU-200; C.B.S. Scientific Co, CA, U.S.A.). The filters were blocked with 5% BSA/TBS for 24 hours, washed 3 times with 1% Tween-20/TBS, and subsequently blocked with appropriate normal serum (1:3000) before overnight incubation at +4°C with one of the IL-1β antibodies used to test the specificity of IL-1 detection. Parallel with the polyclonal antibody (Cat # 124, Cytokine Sciences Inc.) in concentration of 2 μg/mL, a polyclonal anti-rat IL-1β antibody later available from Endogen (in 1:500 dilution = 1.8 μg/mL; Cat # PR-427B), and a polyclonal anti-rat IL-1β antibody (Cat # 501-RL, R&D Systems Inc.) in concentration of 16.7 μg/mL were used. After 3 washes in Tween-20/TBS, the filters were incubated with appropriate biotidinylated secondary antibody (Boehringer Mannheim, Germany) for 1 hour at room temperature before incubation with avidin-biotin complex (Vector Laboratories, Inc.) for 1 hour at room temperature and washed before ECL detection. Quantification of the intensity of the signal was determined by densitometric analysis of the autoradiograms by National Institutes of Health Image Analysis software on a PowerMac computer (Apple Inc., Cupertino, CA, U.S.A.) (Fig. 2).
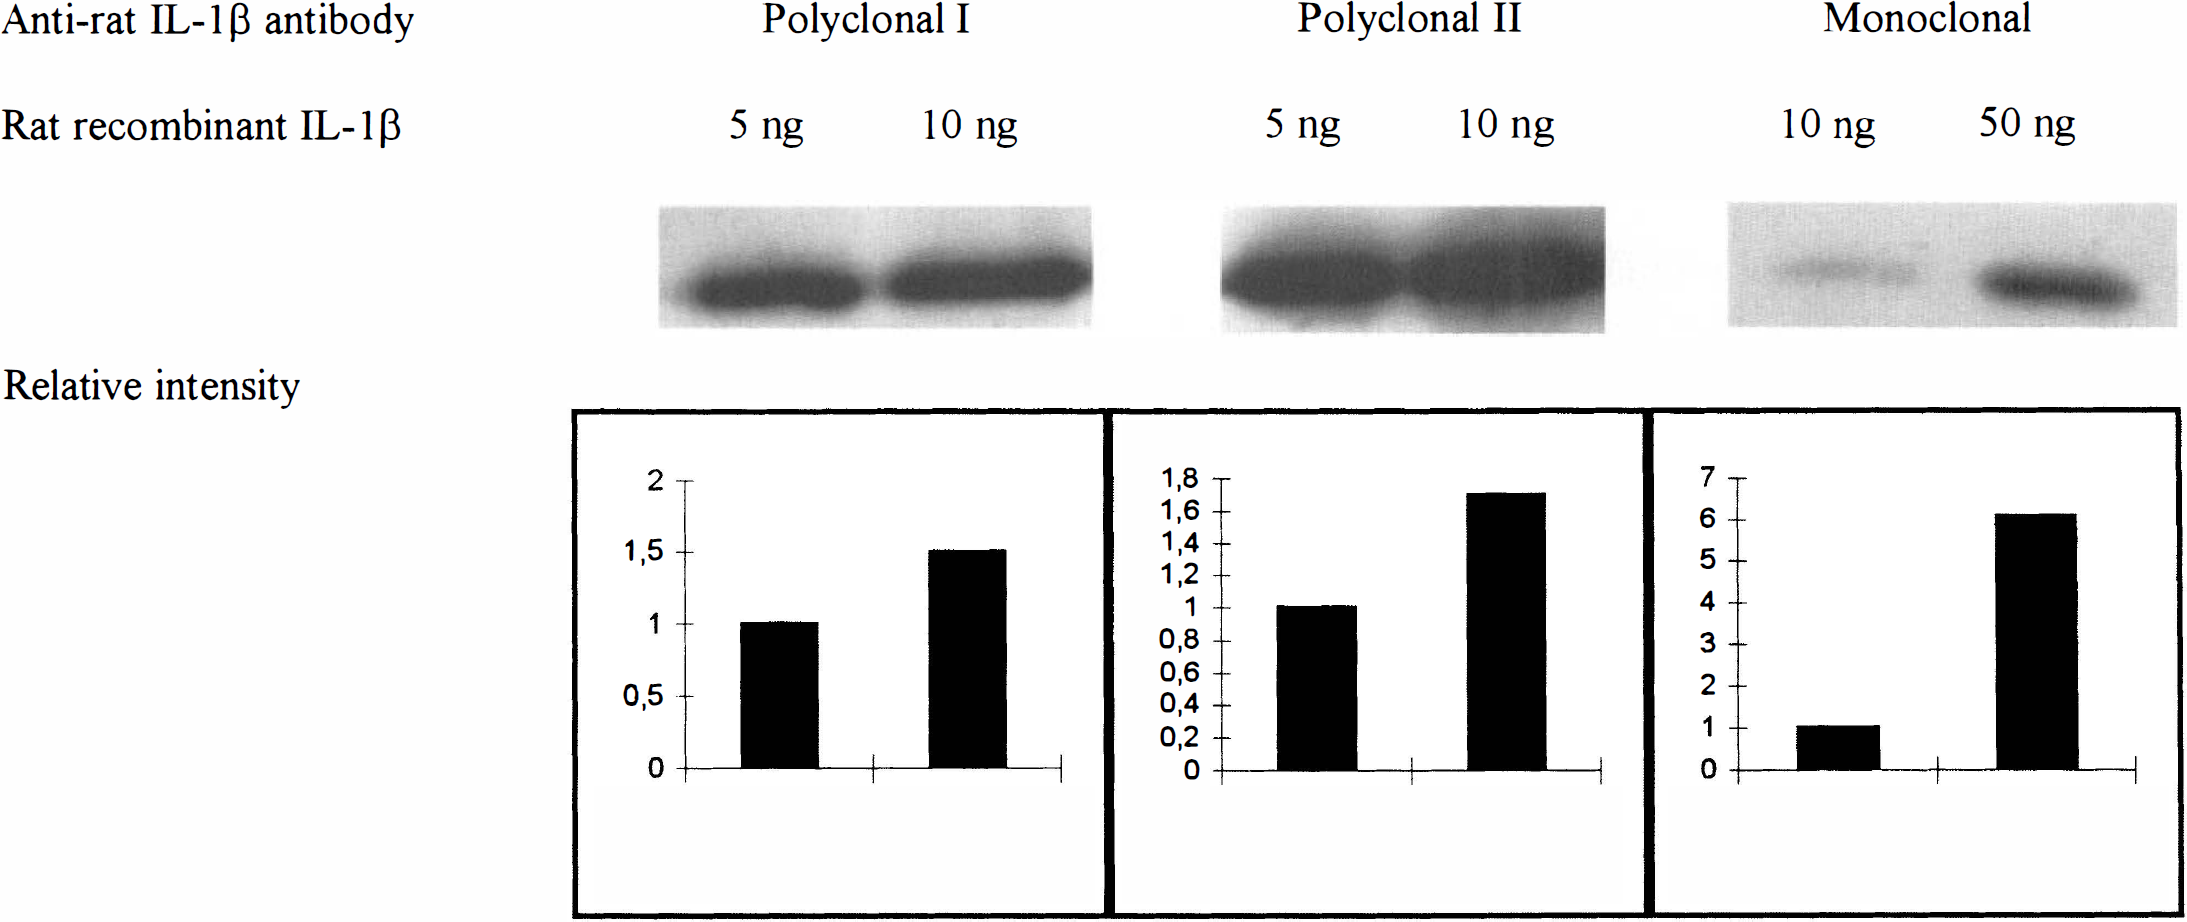
Specificity of the IL-1β antibody tested by Western blot analysis. Detection of rat recombinant IL-1β in amounts of 5 and 10 ng (at concentration of 0.5 μg/mL) with polyclonal anti-rat IL-1β antibody used for the immunohistochemical staining (Cat No. 124, Cytokine Sciences Inc.). Detection of rat recombinant IL-1β in amounts of 5 and 10 ng with a polyclonal anti-rat IL-1β antibody (Cat 3 PR-427B, Endogen). Detection of 5, 10, and 50 ng (5.0 μg/mL) of rat recombinant IL-1β with a polyclonal anti-rat IL-1β antibody (Cat No. AF-501-NA, R&D Systems Inc.). All three antibodies detect a signal of appropriate size in a semiquantitative manner as depicted by bottom panels showing the corresponding relative intensity values of the autoradiographic bands as determined by densitometric analysis (National Institutes of Health Image Analysis Software).
Statistical analysis
The statistical significance of the differences between the means of the groups was estimated by one-way analysis of variance followed by Dunnet's post hoc test. A P value less than .05 was considered statistically significant.
RESULTS
Validation of the ischemic insult
Careful on-line monitoring of the CBF of the experimental animals at the baseline, during global ischemia, and 5 minutes after reperfusion verified equal ischemic/reperfusion insult in all experimental groups (percentages of the baseline CBF value [100%] being 3.6 ± 1.3; 5.1 ± 2.5; 5.4 ± 2.6 during ischemia, and 154.4 ± 48.1; 170.3 ± 37.3; 177.8 ± 37.7 after 5 minutes of reperfusion in the groups of 2, 8, and 24 hours of reperfusion). No significant differences between the groups existed either at the baseline, during ischemia, or after 5 minutes of reperfusion (determined by analysis of variance). The mean arterial blood pressure (mean arterial blood pressure ± SD) of the experimental animals was 111 ± 15.8 mm Hg, 56.2 ± 22.1 mm Hg, and 135.4 ± 18.4 mm Hg at the baseline, during ischemia, and after 5 minutes of reperfusion, respectively. As expected, the animals were mildly acidotic after the ischemic/hemorrhagic period. On the average, the blood pH dropped to 7.32 ± 0.08 similarly in all groups (7.31 ± 0.05, 7.33 ± 0.09, 7.37 ± 0.06 in the 2-, 8-, and 24-hour groups, respectively). Because the rats remained on spontaneous respiration, they were mildly hypercarbic (
Specificity of the in situ oligonucleotide probes
The design and the Northern blot analysis of the target DNA of the probes is described in the Materials and Methods. According to the protocol described above, an independent second labeling and hybridization of the probes were performed to ascertain the reproducibility of the in situ hybridization results. At the level of the striatum, a second hybridization (n = 16) of IL-1β and IL-1 receptors was repeated in brain sections adjacent to the first hybridization (n = 26). At the level of the hippocampus, four animals from each group were used for both hybridizations (n = 16). The distribution of the mRNA signal was estimated by a blinded investigator. The reproducibility for IL-1β mRNA was 75%/87.5%, and for IL-1 receptor mRNA 58.3%/87.5% at the level of the striatum and the hippocampus, respectively (overall reproducibility 77.1%). RNAse pretreatment of the sections yielded reduction or abolition of the mRNA signal. The sense probes did not show any hybridization over low background signal (data not shown).
Specificity of immunohistochemistry
Omitting the primary or secondary antibody in the avidin-biotin-method resulted in immunoreactivity comparable to the background. Omitting the AB-complex resulted in total loss of staining. The nonspecific immunoglobulins of the same (sub)class as the antibodies of interest (IL-1β, IL-1R, and cell markers) revealed nonspecific staining (data not shown). The IL-1RI antibody staining was abolished by preadsorption with accompanying control peptide (Cat No. sc-689P, Santa Cruz Biotechnology, Inc.) in 10× (weight) excess (Fig. 3A and B). Western blot detection of rat recombinant IL-1β (Cat No. 501-RL, R&D Systems Inc.) was run parallel with the polyclonal antibody used for the immunohistochemical staining (Cat No. 124, Cytokine Sciences, Inc.) and with a polyclonal antibody later available from Endogen (Cat No. PR-427B) plus a polyclonal antibody (Cat No. AF-501-NA, R&D Systems). All antibodies detected a band of similar size corresponding to rat recombinant IL-1β in a semiquantitative manner as determined by densitometry of the autoradiograms (Fig. 2). Control incubation of parallel filter with normal rabbit serum did not detect the signal. Preadsorption of the anti-rat IL-1β (Cytokine Sciences Inc.) antibody with 10× concentration of rat recombinant IL-1β (R&D Systems Inc.) before immunohistochemical staining resulted in abolition of the immunoreactivity (data not shown).
IL-1 receptor protein in the postischemic brain.
Expression of IL-1β and IL-1 receptor mRNA in sham animals
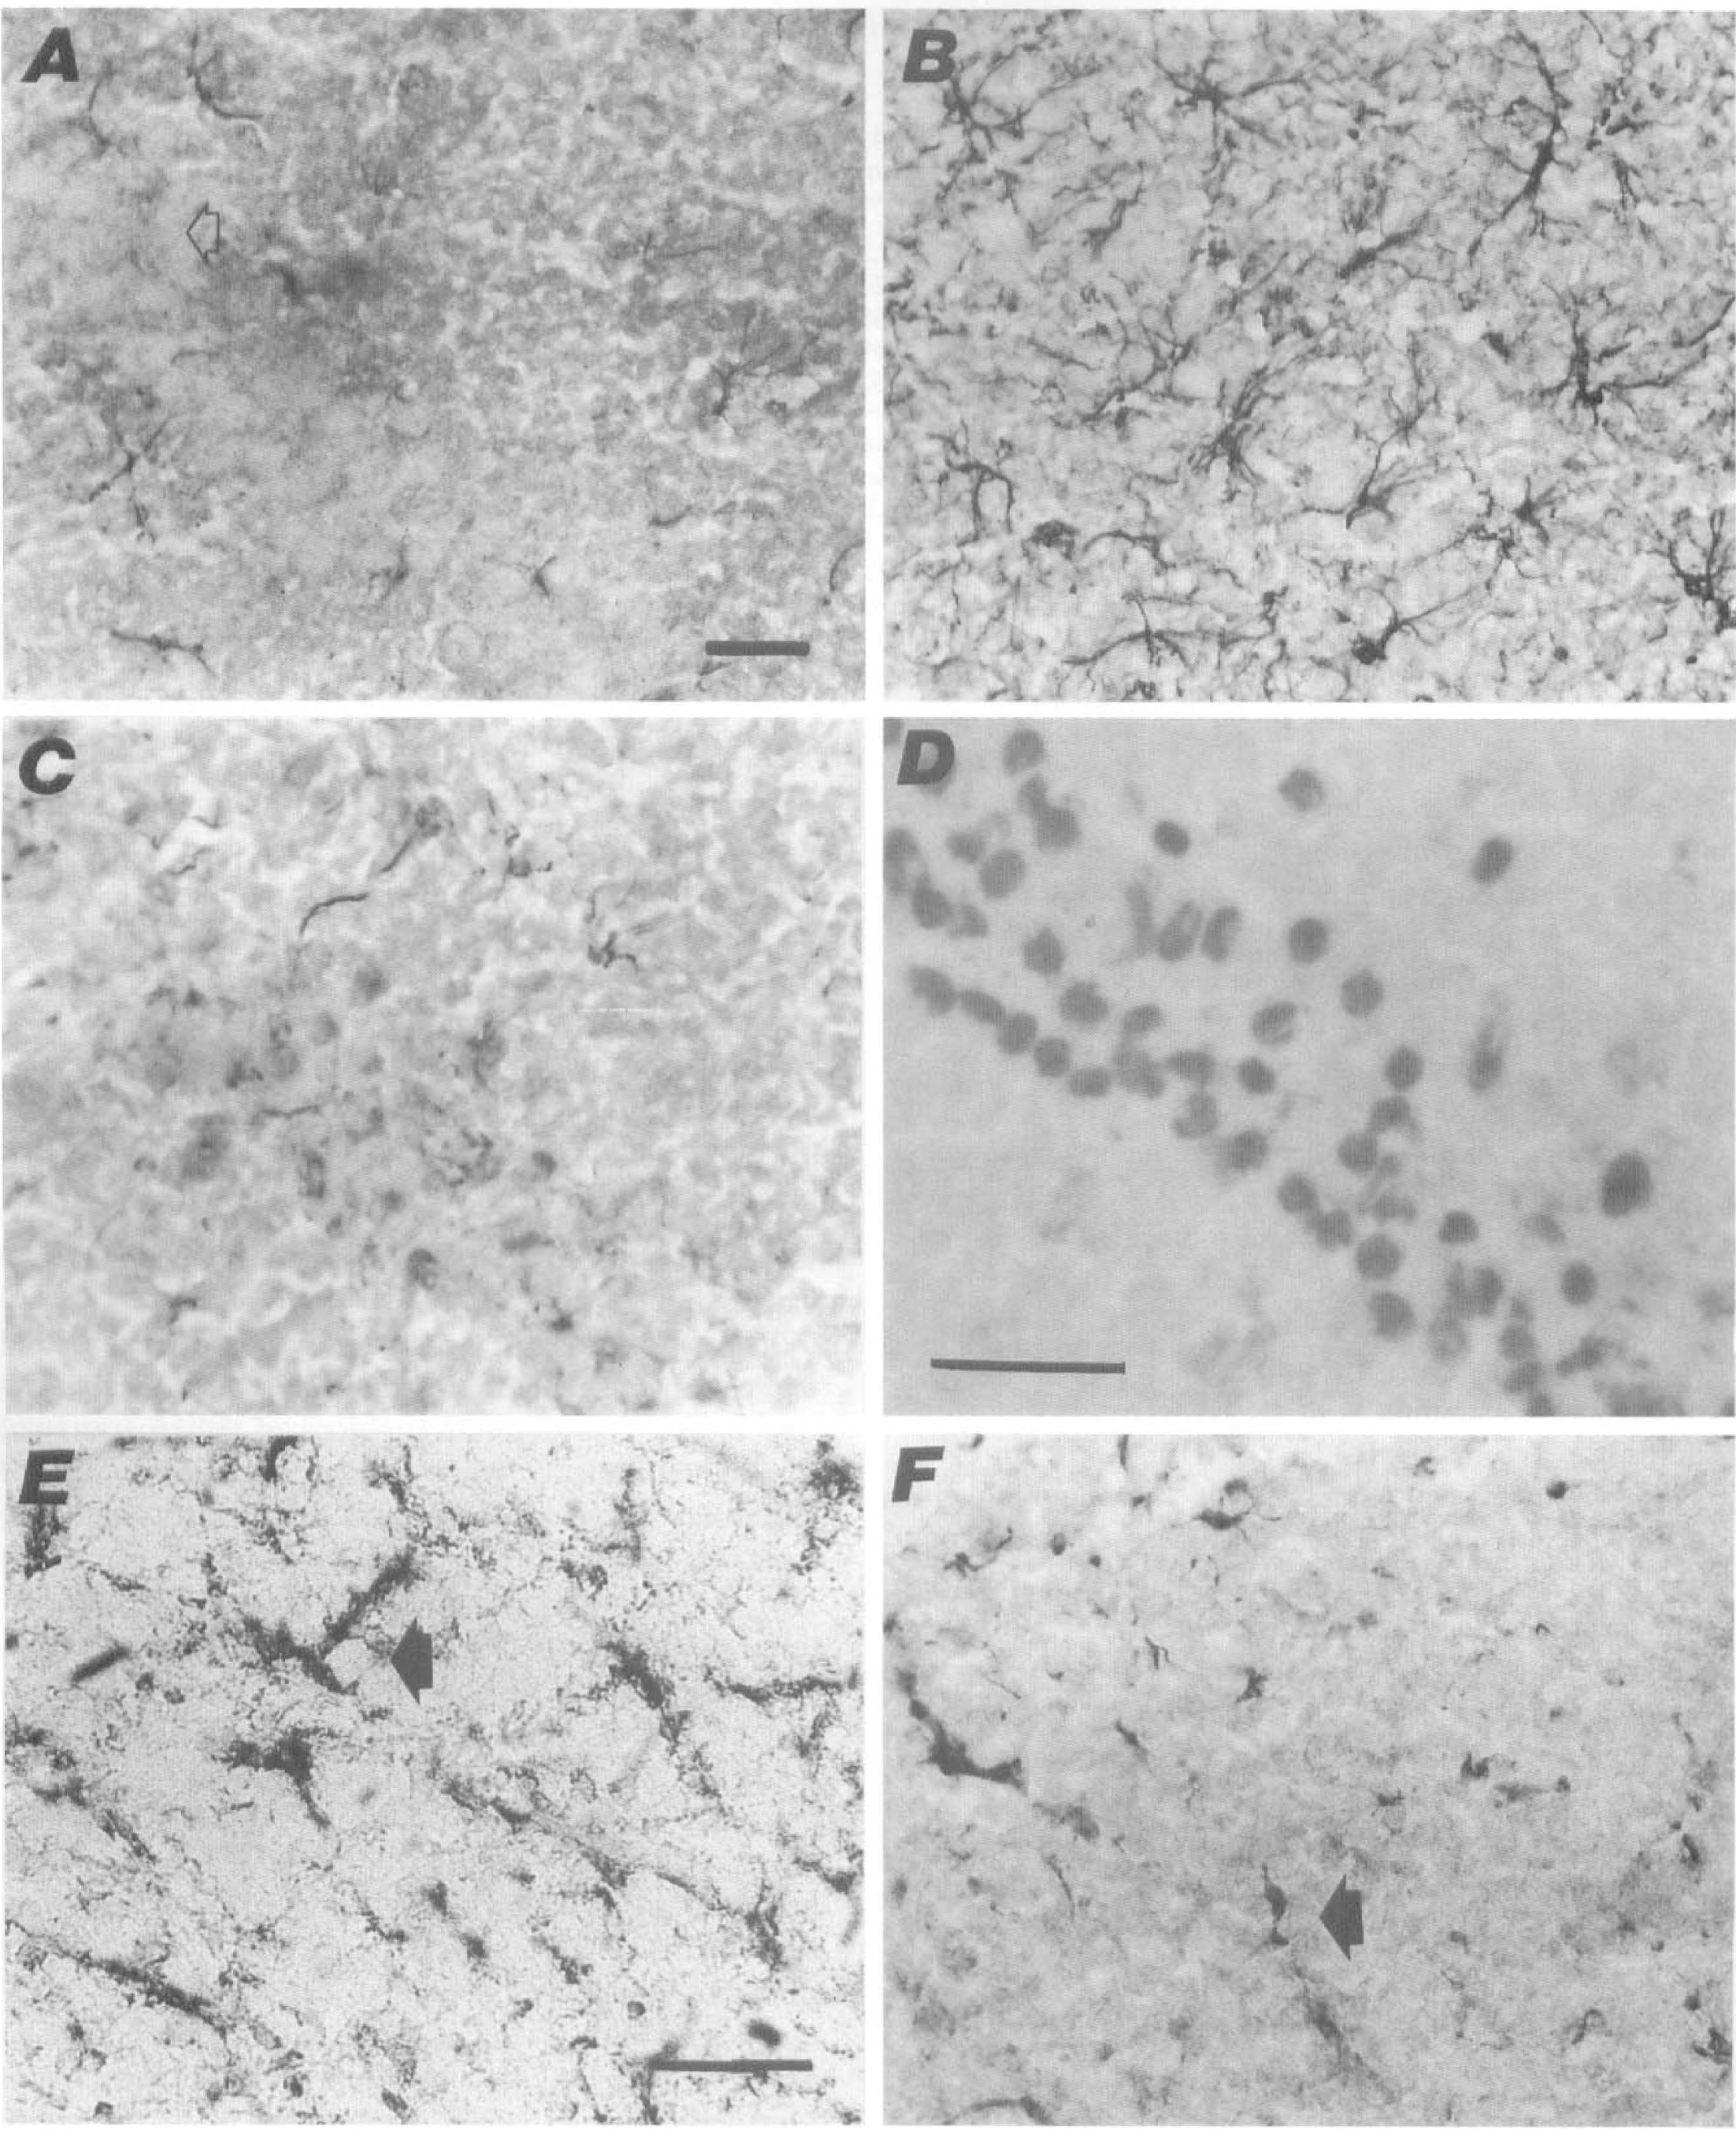
At the level of striatum (caudate-putamen), no or only a weak white matter signal for IL-1β mRNA or a low cortical expression combined with low caudate-putamen expression was seen in the sham animals (Table 1; Fig. 1A). The signal was not colocalized with the cresyl violet-positive neuronal somas. Similarly, low mRNA signal for IL-1β was detected in the CA1, CA2, CA3/CA4, and the dentate gyrus regions of the hippocampus in the sham animals (Table 2).
At the level of the striatum, no or only a low IL-1R mRNA expression was found in the sham animals (Fig. 1C). At the level of hippocampus, low IL-1R mRNA expression was detected in the sham animals in the CA1 through CA3/CA4 regions, and/or dentate gyrus (Table 3; Fig. 1E).
A constitutive expression of IL-1β and IL-1R over microvascular structures and a weak mRNA signal in the meninges and choroid plexus was detected in sham animals.
Ischemia-induced changes in IL-1β and IL-1 receptor (IL-1R) mRNA
A maximal increase in the number of IL-1β mRNA positive cells was detected already by 2 hours of reperfusion in the forebrain areas including cortex (12-fold increase), caudate-putamen (14-fold), and white matter areas (a 5-fold increase in corpus callosum; Table 1). A submaximal to maximal increase in IL-1β mRNA was also seen at the level of hippocampus in the CA1 region (9-fold) and dentate gyrus (4-fold; Table 2) by 2 hours of reperfusion. In the CA2 and CA3/CA4 regions of the hippocampus, the maximal increase was reached by 8 hours of reperfusion (a 10 and 14-fold increase, respectively; Table 2). Correspondingly, maximal increase in the number of IL-1R mRNA-positive cells was evident in the CA1 region (16-fold) and dentate gyrus (24-fold) by 2 hours of reperfusion, while the maximal intensification in the receptor mRNA was detected by 8 hours of reperfusion in the CA2 and CA3/CA4 regions of the hippocampus (Table 3).
After 8 hours of reperfusion, IL-1β signal remained induced in the cortex (Fig. 1B), caudate-putamen, and white matter areas (Table 1). Also IL-1R mRNA expression was evident in these areas (Fig. ID). At the hippocampal level, CA1, CA2, and CA3/CA4 regions showed maximally induced IL-1β mRNA, while the expression in dentate gyrus was comparable to 2 hours of reperfusion (Table 2). Likewise, the mRNA signal for the receptor was induced in CA1 (Fig. 1F) through CA3/CA4 areas but started attenuating in the dentate gyrus (Table 3). The cortical upregulation of IL-1R in neurons encompassed all cortical layers or was focused to layers II to IV.
After 24 hours of reperfusion, expression of IL-1β mRNA started attenuating in the white matter areas, caudate-putamen, and cortex (Table 1). The CA1 region of the hippocampus remained especially strongly induced for IL-1β, while the mRNA expression in the CA2 to CA3/CA4 regions and dentate gyrus was reduced more drastically (Table 2). In accordance, IL-1R mRNA signal remained highly induced exclusively in hippocampal CA1 region but dropped to moderate levels in other hippocampal areas (Table 3), and even less striking induction was still seen in the cortex, corpus callosum, and caudate-putamen (data not shown).
The upregulated cortical signal for both IL-1β and IL-1R was predominantly neuronal at all time points after ischemia/reperfusion (Fig. 1B and D). The striatal expression for IL-1β and IL-1R showed no clear predominance for neuronal cells at any reperfusion times. Only a weak mRNA signal for IL-1β and IL-1R was detected in the meninges, microvascular structures or in the choroid plexus of either the sham-operated or postischemic animals. No upregulation by ischemia/reperfusion could be detected in these structures.
IL-1β protein expression in sham animals
Low or moderate IL-1β immunoreactivity was evident in all sham animals. IL-1β immunoreactivity was shown at the level of the striatum, corpus callosum, cortex, and caudate-putamen (Table 4). At the hippocampal level, CA1 through CA3/CA4 and dentate gyrus were IL-1β positive (Table 5) along with white matter areas and septal, deep brain areas.
IL-1β immunoreactive glial cells in striatal areas
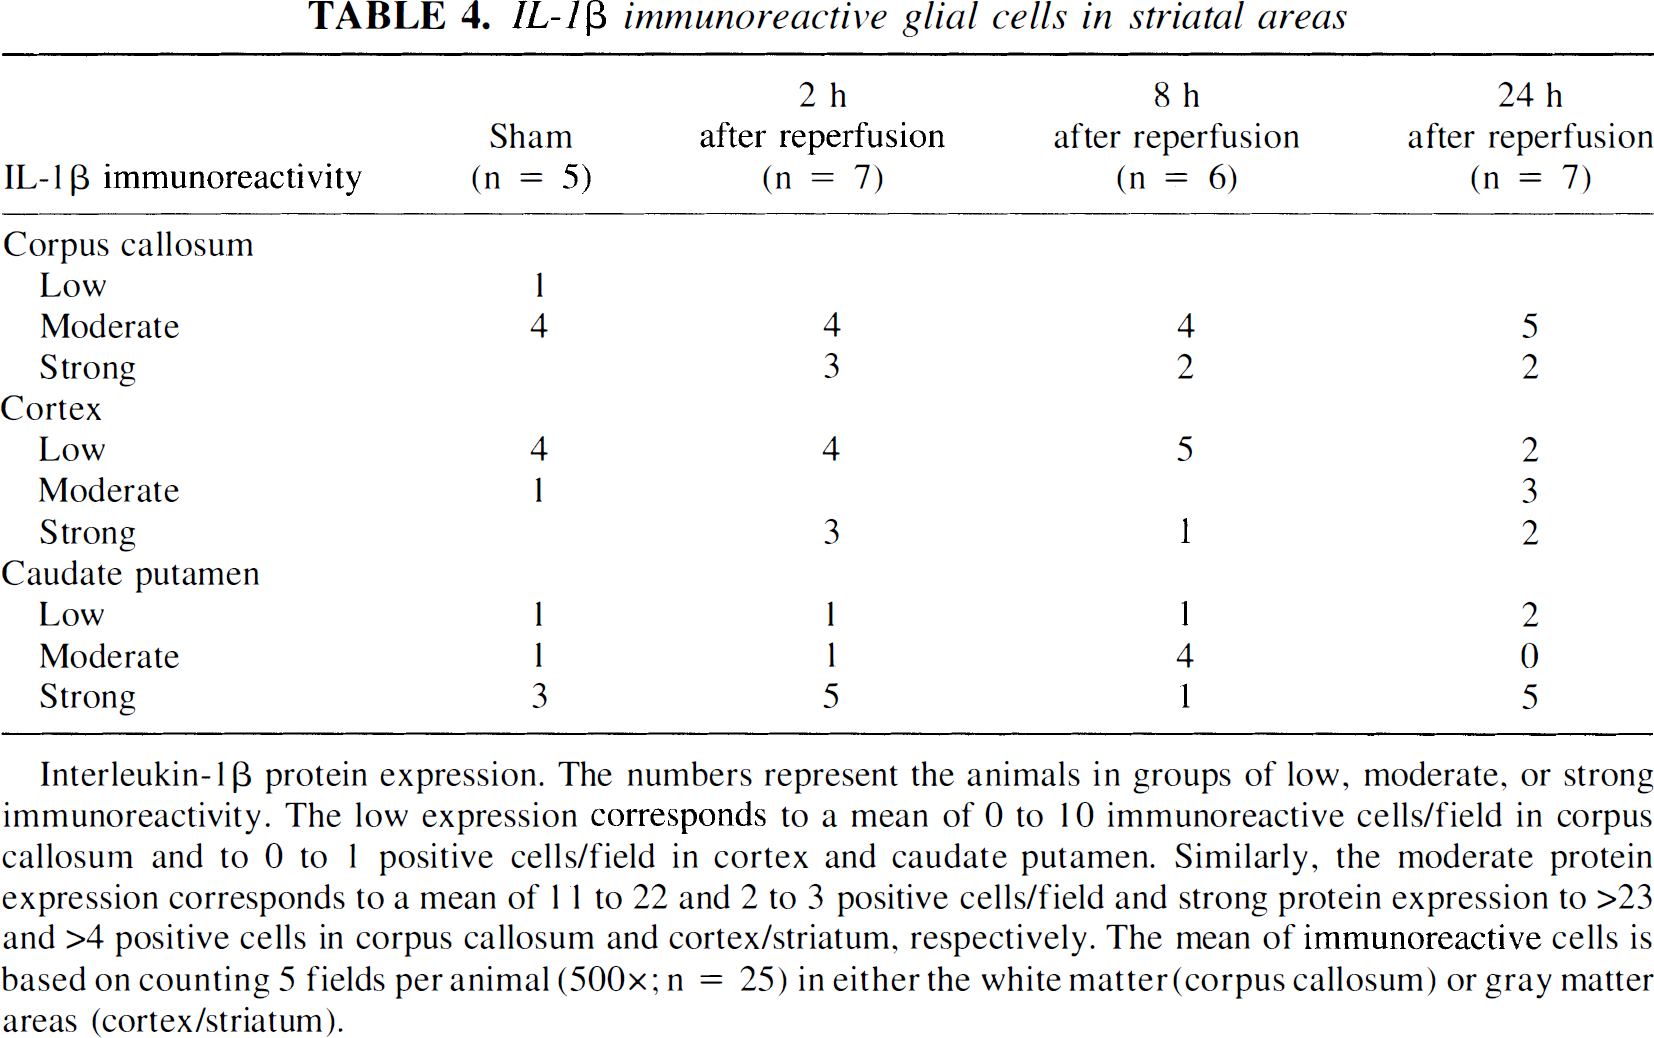
Interleukin-1β protein expression. The numbers represent the animals in groups of low, moderate, or strong immunoreactivity. The low expression corresponds to a mean of 0 to 10 immunoreactive cells/field in corpus callosum and to 0 to 1 positive cells/field in cortex and caudate putamen. Similarly, the moderate protein expression corresponds to a mean of 1 1 to 22 and 2 to 3 positive cells/field and strong protein expression to >23 and >4 positive cells in corpus callosum and cortex/striatum, respectively. The mean of immunoreactive cells is based on counting 5 fields per animal (500×; n = 25) in either the white matter (corpus callosum) or gray matter areas (cortex/striatum).
Mean ± SD of IL-1β immunoreactive glial cells/field in hippocampal areas
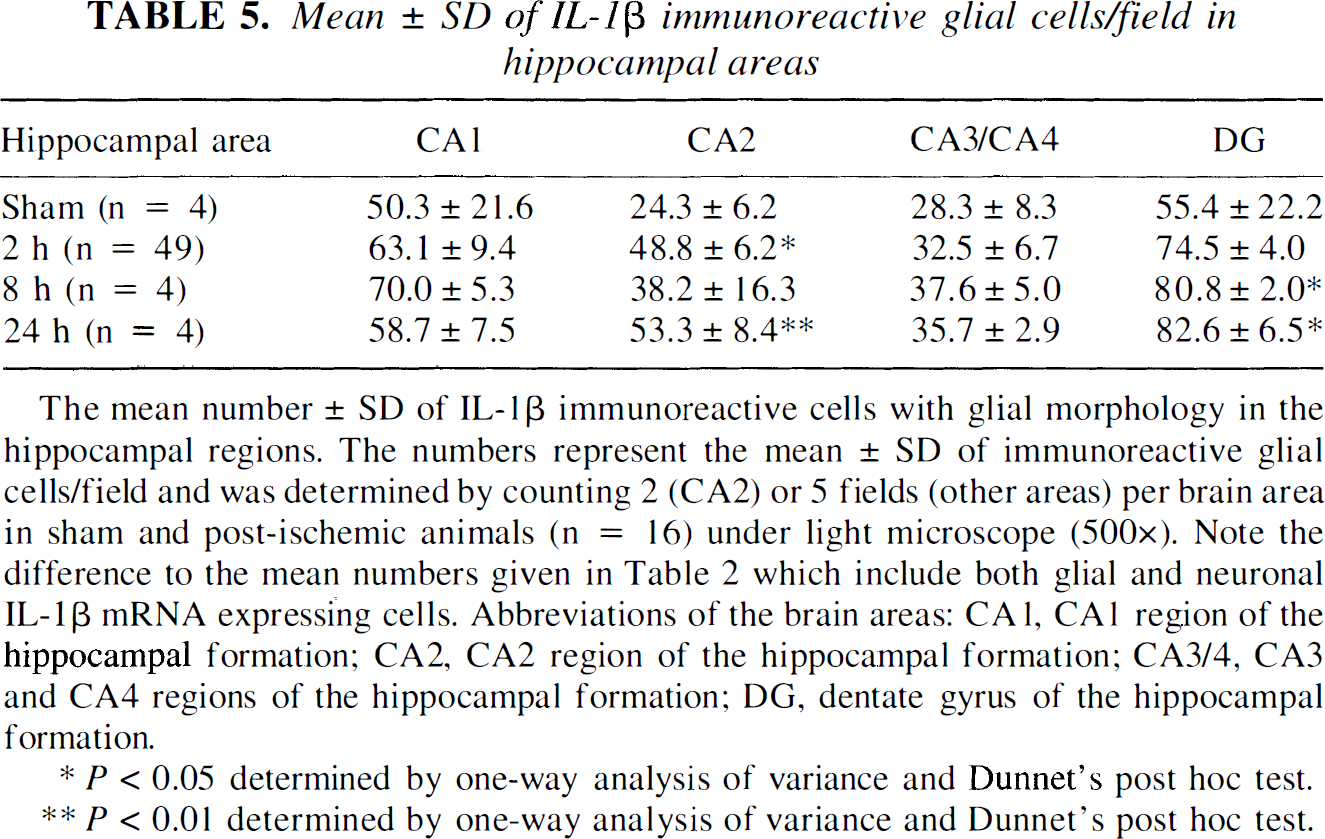
The mean number ± SD of IL-1β immunoreactive cells with glial morphology in the hippocampal regions. The numbers represent the mean ± SD of immunoreactive glial cells/field and was determined by counting 2 (CA2) or 5 fields (other areas) per brain area in sham and post-ischemic animals (n = 16) under light microscope (500×). Note the difference to the mean numbers given in Table 2 which include both glial and neuronal IL-1β mRNA expressing cells. Abbreviations of the brain areas: CA1, CA1 region of the hippocampal formation; CA2, CA2 region of the hippocampal formation; CA3/4, CA3 and CA4 regions of the hippocampal formation; DG, dentate gyrus of the hippocampal formation.
P < 0.05 determined by one-way analysis of variance and Dunnet's post hoc test.
P < 0.01 determined by one-way analysis of variance and Dunnet's post hoc test.
Ischemia-induced changes in the IL-1β protein expression
After 2 hours of reperfusion, the number of IL-1β-positive cells tended to increase in the corpus callosum, cortex, and caudate-putamen (Table 4). Similar tendency of IL-1β immunoreactivity was also seen in the hippocampal formation confined to cells consistent with glial morphology (Table 5; see text below).
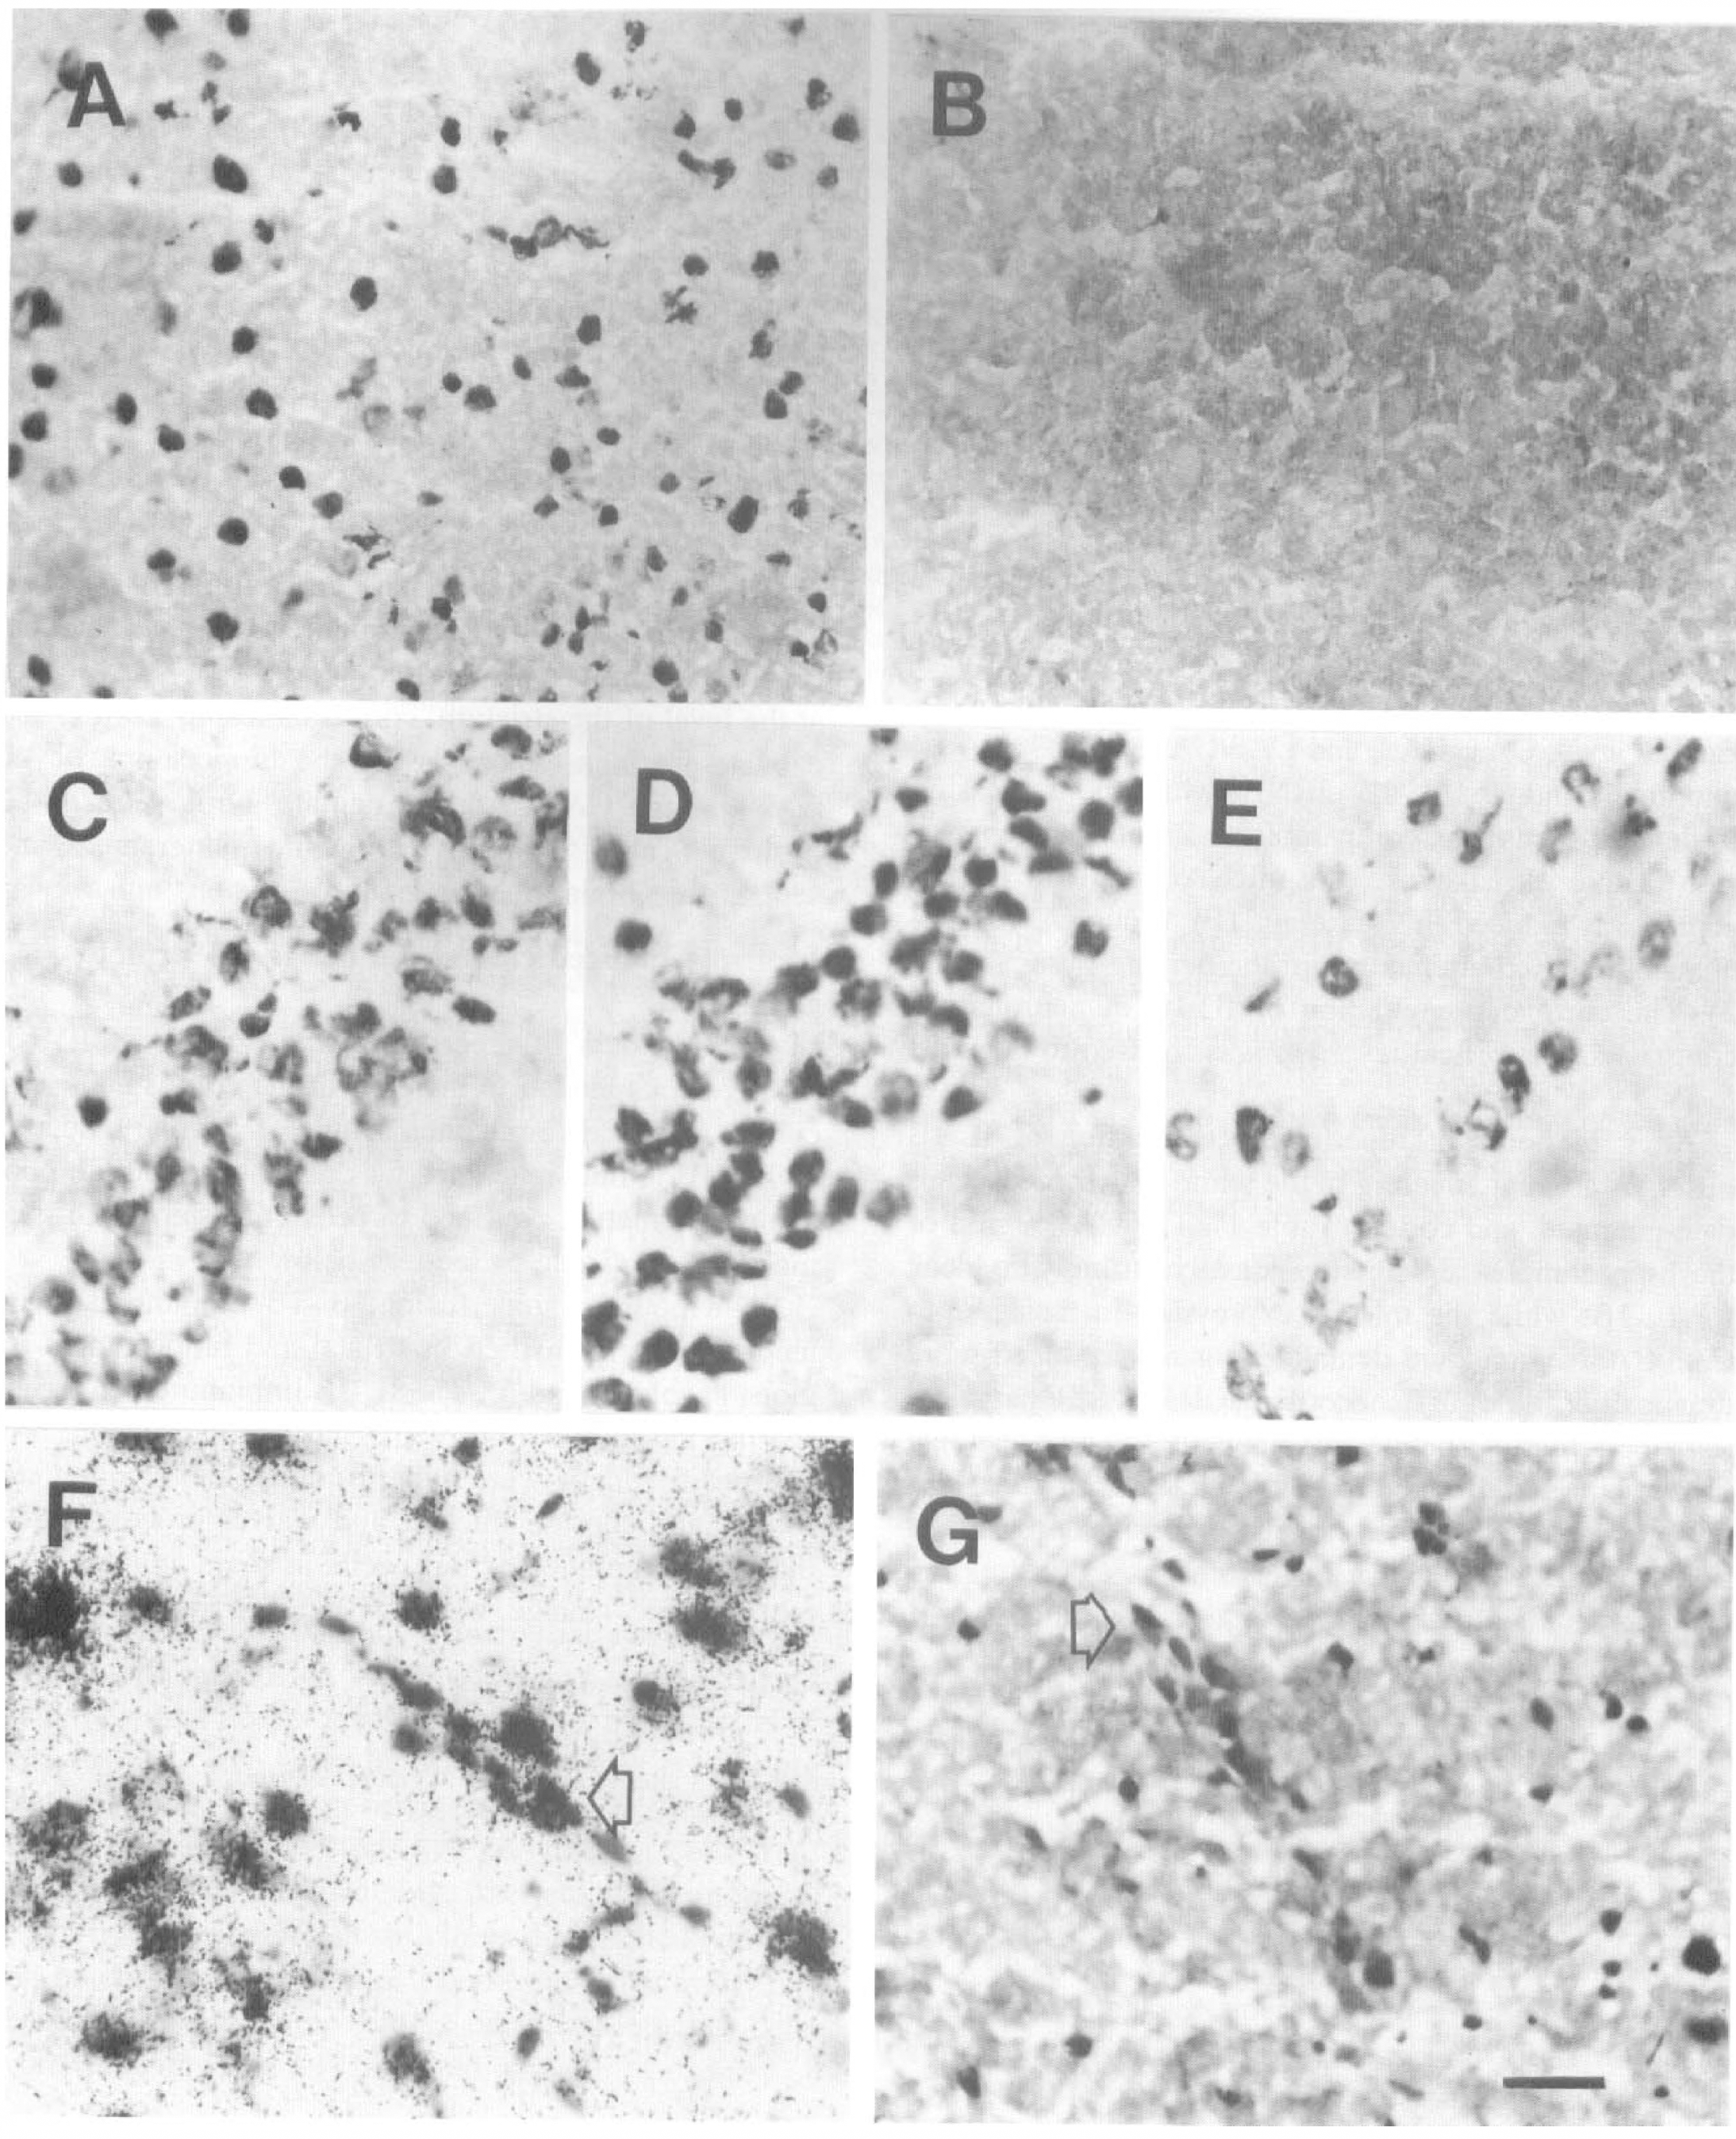
By 8 hours of reperfusion, IL-1β immunoreactivity tended to be intensified in striatal and hippocampal regions (Tables 4 and 5). The IL-1β immunoreactive cells sharing the morphology with glial fibrillary acidic protein-positive cells were hypertrophied, had swollen cell somas, and shorter, thicker, and waiver processes than the IL-1β immunoreactivity cells in sham animals. This morphologic change was still evident at 24 hours of reperfusion and corresponded to increased glial fibrillary acidic protein immunoreactivity (Fig. 4A and B).
IL-1β and IL-1 receptor proteins in postischemic brain.
The amount of IL-1β-expressing cells tended to be increased still by 24 hours of ischemia/reperfusion at the striatal level and reached significance in hippocampal regions CA2 and dentate gyrus, while in the CA1 and CA3/CA4 regions the number of immunoreactive cells started attenuating (Tables 4 and 5).
The main cell type expressing induced IL-1β immunoreactivity after ischemia/different reperfusion periods was identical to glial fibrillary acidic protein-positive astrocytes observed in the adjacent section (Fig. 4B). Thin processes staining with IL-1β were also indistinguishable from MAB328-positive (for myelin/oligodendrocytes) cell processes (Fig. 4C). Staining with the OX-42 antibody for granulocytes, macrophages, and microglia revealed coexpression with IL-1β in perivascular macrophages. Although microglial activation was evident with the OX-42 staining and was seen to expand from the white matter areas to the cortex by 24 hours of reperfusion, only sporadic IL-1β-positive cells were identical with OX-42 positive microglial cells (Fig. 4E and F). Sporadic IL-1β positive perivascular cells were also identified by ED2 staining. Interleukin-1β immunoreactivity was not seen in structures that stained with the cell markers for neuronal cell bodies and dendrites (microtubule-associated protein-2) or for endothelial cells (von Willebrand factor) (data not shown).
IL-1R protein expression in sham animals
Interleukin-1R immunoreactivity was detected in the sham brains (n = 4; Table 3). The widespread expression localized in the cytoplasm of neurons throughout the cortex, superior colliculus, medial geniculate, central gray, ventral tegmental area, substantia nigra, and the dentate gyrus and hippocampal CA1, CA2, and CA3/4 regions. Non-neuronal immunoreactivity could not be confirmed by identical cell morphology with any of the cell markers used, which however does not exclude glial origin of some of the IL-1R-positive small cell somas (Fig. 3A). Additionally, IL-1R immunoreactivity was detected in corpus callosum, possibly in oligodendrocytes. A weak constitutive IL-1R immunoreactivity was also detected over microvascular endothelium. The choroid plexus/ependymal cells were comparable to rabbit IgG or preadsorption controls (data not shown).
Ischemia-induced changes in the IL-1R protein expression
In the postischemic brains (n = 12), IL-1R protein expression was detected in cortex (Fig. 3A), dentate gyrus, and CA2 to CA3/CA4 regions of the hippocampal formation (Table 3). While no increase in the number of receptor positive neurons could be detected after ischemia, the proportion of neuronal cell somas positive for IL-1 receptor was determined by counting immunoreactive cells from slides counter stained with hematoxylin. The percentage of neurons immunoreactive for IL-1 receptor in the CA1 region of the hippocampus in the sham animals (91%; n = 4) was found to be identical to the percentage 8 hours after ischemia (91%; n = 4). Similarly, in the dentate gyrus the sham and postischemic proportions of the receptor protein positive neurons were 94% and 95%, respectively. However, the intensity of immunostaining was increased in most cases by ischemia/reperfusion in the cells capable of protein translation (Fig. 3D). By 24 hours of reperfusion in three out of four animals investigated, the number of IL-1R immunoreactive neurons was decreased creating a ‘patchy’ immunoreactivity pattern in the CA1 region (Fig. 3E). Additionally, IL-1R immunoreactivity was evident in sporadic endothelial structures, corresponding with the mRNA expression (Fig. 3F and G). No other structures, except these aforementioned areas containing selectively vulnerable neurons, were systematically evaluated after ischemia/reperfusion. An equally weak IL-1R immunoreactivity was detected both in the sham and postischemic corpus callosum, possibly caused by oligodendrocytic expression of the receptor (data not shown).
DISCUSSION
Global cerebral ischemia/reperfusion acutely altered the expression of IL-1β and its receptor in a number of ischemia-sensitive brain structures, such as the hippocampal pyramidal cell layers, granular cell layers of the dentate gyrus, cortex, and striatum. While IL-1β mRNA expression was increased both in the white matter areas and in the aforementioned gray matter structures, a coinciding increase in IL-1R gene expression was seen exclusively over neuronal cell bodies of the hippocampus. In contrast to the strong expression of IL-1R in hippocampal neurons, there was weak expression of the IL-1R mRNA and only a weak noninducible staining for the IL-1R protein in the white matter areas, suggesting that ischemia/reperfusion induces IL-1R protein primarily in neuronal cell bodies. At the protein level, a tendency for increased glial IL-1β was evident, while no neuronal IL-1β protein could be detected. An interesting scenario develops in which glial is incited to propagate IL-1β effects in postischemic brain (IL-1β expression in glia), the targets being the neurons (neuronal expression of IL-1R).
Several previous studies have reported induced IL-1β gene expression in brain ischemia (Minami et al., 1992; Liu et al., 1993; Yabuuchi et al., 1994; Wang et al., 1994; Szaflarski et al., 1995). In agreement with our present results, global ischemia induced IL-1β mRNA in the cortex and striatum 4 hours after reperfusion and the signal decreased toward sham level at 24 hours (Minami et al., 1992). In contrast to our findings, no mRNA expression was seen in the striatum before the third day of reperfusion in a transient ischemia model (4 vessel occlusion for 30 minutes) (Wiessner et al., 1993). The hippocampal formation remained negative throughout the 15 minute-7 day observation period (Wiessner et al., 1993). However, other studies have clearly shown an early induction of IL-1β mRNA in the hippocampus (Minami et al., 1992; Yabuuchi et al., 1994; Szaflarski et al., 1995) and this was also confirmed in the present study. Yabuuchi et al. (1994) observed similar topography of IL-1β mRNA upregulation in the postischemic cortex as seen in our study, and an early nonneuronal activation in the polymorphic layer of the hippocampus 30 minutes after ischemia that could precede the later (2 hours to 24 hours) neuronal mRNA expression seen in our study (Yabuuchi et al., 1994). In nonischemic rat brain, a predominantly neuronal signal patterns for IL-1β mRNA was detected over the granule cell layer of the dentate gyrus and the CA1 pyramidal cells of the hippocampus, over the granule cells of the cerebellum, the granule and periglomerular cells of the olfactory bulb, and over dispersed cells of the ventromedial hypothalamus and frontal cortex (Bandtlow et al., 1990).
The distribution of IL-1 receptors in the murine brain has been examined indirectly by binding assays of radioactively labeled IL-1 by several investigators (Farrar et al., 1987; Katsuura et al., 1988; Takao et al., 1990; Haour et al., 1990; Ban et al., 1991) and support our finding of IL-1 receptor being expressed by neurons. Although only sporadic sham animals showed IL-1R mRNA expression in our study, the previously described gene expression of IL-1R (Type I) by in situ hybridization (Cunningham et al., 1992) was found in same areas as seen in our few IL-1R-positive sham animals. Furthermore, we have now shown the IL-1R protein expression to be neuronal and widely distributed also in the postischemic rat brain.
In the present study, no neuronal IL-1β protein expression could be detected either in the sham or post-ischemic cortex, hippocampus or caudate/putamen. This is in agreement with previous studies that show neuronal IL-1β immunoreactivity in the human and nonprimate brain is restricted to brain regions involved in endocrine and autonomic functions (Breder et al., 1988; Lechan et al., 1990). Although the dilution of the polyclonal antibody used in our study (1:100) resulted in a moderate level of background staining, which could impair the detection of faint immunoreactivity in the neuronal processes, the parenchymal immunoreactivity had distinct glial morphology. However, induction of mRNA for IL-1β occurred in cortical and hippocampal neurons after ischemia/reperfusion. Transcription of IL-1 gene without translation is also induced by complement or calcium ionophore in peripheral blood mononuclear cells (Schindler et al., 1990a; Dinarello, 1991). Activation of peripheral blood mononuclear cells by surface adherence induces expression of IL-1β mRNA but not the protein (Schindler et al, 1990b). Under this condition the cells are primed to respond with an exaggerated release of IL-1 by subsequent stimulation with lipopolysaccharide (Schindler et al., 1990b). Our results show that in cortical and hippocampal pyramidal cells, ischemia induces expression of IL-1β mRNA that is not translated into protein, thus possibly leaving the neurons in a “primed” state. In this preconditioned state even a modest stimulation might result in a massive release of IL-1 that could magnify the effect of glial IL-1 and contribute to the delayed neuronal damage in these neurons. The prolonged mRNA expression (24 hours of reperfusion) of IL-1β and even more notably the IL-1R seen in the cortex, CA1 region, and the dentate gyrus could further contribute to the delayed neuronal death described in these selective areas (Kirino, 1982). Interestingly, in the present study, decreased IL-1R immunoreactivity was seen in hippocampal CA1 and CA3 regions in a majority of the animals after 24 hours of reperfusion, fitting with the evolution of delayed neuronal death. There was no correlation between the clearly upregulated IL-1R mRNA expression and translation into protein in these areas already after 2 and 8 hours of reperfusion (Table 3). This could partly be caused by downregulation of IL-1 receptor by IL-1, as has been described for murine Th2 cells (Dinarello, 1991). This downregulation is suggested not to be a function of receptor occupancy, because it is observed at IL-1 concentrations that occupy less than 10% of the receptors. The mechanism is a decrease in the half-life of the mRNA for IL-1R (Dinarello, 1991). This could be applicable for not increased IL-1R protein seen in our study despite the robust upregulation of IL-1R mRNA. Furthermore, low receptor occupancy is suggested to be enough to trigger intracellular signaling by IL-1 in T cells and thus favors the idea of less pronounced receptor protein expression to be effective (Dinarello, 1991).
Global ischemia induced upregulation of copper-zinc superoxide dismutase mRNA whereas the protein expression was decreased in the gerbil hippocampus (Matsuyama et al., 1993) indicating that the dissociation between mRNA and protein expression after ischemia is not restricted to the cytokine system. On the other hand, the discrepancy between the IL-1β mRNA and protein expression in neurons might be caused by inhibition of IL-1 synthesis in ischemic tissue. In a compromised energy state, the neurons could be able to transcribe mRNA for IL-1β, but lack the capability of translating the actual protein because of reduced overall protein synthesis. This reduction is suggested to be transient in cells that recover from the insult, but sustained in the cells destined to die (Siesjö et al., 1995). Indeed, our results indicated robust IL-1 receptor message induction that did not translate into increased protein synthesis. However, a generalized inhibition of neuronal protein synthesis seems unlikely as the IL-1R protein was expressed in hippocampal neurons also in the postischemic brain and the percentage of positive cells remained unchanged. Moreover, the intensity of the staining tended to be increased in the neurons capable of translation (Fig. 3D).
IL-1β protein was almost exclusively expressed in glial cells, primarily in astrocytes and to a lesser degree in oligodendrocytes and microglia. Weak to moderate IL-1β immunoreactivity was occasionally detected in perivascular macrophages and monocytes. No immunostaining for IL-1β protein could be detected in neurons, although IL-1β mRNA colocalized with large neuronal cell bodies in the postischemic brain, showing differential expression of IL-1 and its receptor by glia and neurons after ischemia/reperfusion. This emphasizes the role of neurons as targets of IL-1 actions and lends support to our hypothesis, that glial IL-1β acting on neuronal IL-1R participates in the cytokine “cross-talk” between neural elements at risk of metabolic damage. The postischemic induction of glial IL-1 protein was consistent in all brain regions investigated and tended to correlate with the upregulated mRNA production (Tables 1, 2, and 3). However, it may be that the increase in the number of IL-1β protein-positive cells is not the only factor that determines the biological efficacy of IL-1. Changes in the availability of IL-1 could be reflected in the intensity of the immunostaining, which in turn is difficult to quantitate and thus makes such an evaluation arbitrary. Indeed, a recent study using EIA-technique for IL-1β quantitation showed the levels of IL-1 to be significantly increased in cortex, striatum, and hippocampus as opposed to other areas investigated after transient global ischemia in a gerbil brain (Saito et al., 1996).
Glial IL-1β protein expression was paralleled by neuronal IL-1R synthesis, suggesting that neurons may be target cells for IL-1β effects in brain ischemia. Because both neuronal death and exitotoxic damage was reported to be inhibited by intracerebroventricular injection of IL-1Ra in the rat PMCAO model, binding of IL-1β on the IL-1R may have a pathophysiological role in ischemic brain (Relton and Rothwell, 1992). Reduction in infarct size (64%) was achieved by adenoviral vector transfer of IL-1Ra intracerebroventricularly 5 days before PMCAO in a rat (Betz et al., 1995). Although blocking of the possible IL-1 binding sites of the ependymal cells (as suggested by binding of IL-1 to choroid plexus; Farrar et al., 1987) by IL-1Ra may contribute to the improved outcome in the above cited studies, the protective effect most likely is caused by blockade of the intraparenchymal receptor(s). No ependymal immunoreactivity for type I IL-1R was seen in our study. On the other hand, the IL-1 effects in brain ischemia may partly be mediated by leukocyte response as suggested by favorable results of leukocyte inhibition by systemically given IL-1Ra in a PMCAO model (Garcia et al., 1995). Besides better neurological function and less weight loss, fewer leukocytes were detected in the ischemic hemispheres of the treated animals along with fewer necrotic neurons and smaller area of pallor (Garcia et al., 1995). A direct effect of IL-1β on brain endothelium is supported by the present findings that IL-1β-positive cells were found in close proximity to the parenchymal microvessels. Astrocyte end feet are in direct contact with endothelial cells and comprise an important part of the blood-brain barrier. Interleukin-1β immunoreactivity was expressed in astrocytic processes surrounding intraparenchymal blood vessels and in perivascular macrophages. Although IL-1β mRNA was sporadically seen over the endothelium of intraparenchymal blood vessels, IL-1β immunoreactivity did not clearly colocalize with the endothelial cells. Endothelial cells are capable of IL-1 expression but the principal product in these cells is IL-1α (Dinarello, 1991) which our IL-1β selective antibody may not be able to detect. However, a weak constitutive expression of IL-1 receptor mRNA and protein was present in the brain microvascular endothelium. The presence of IL-1R in the endothelial cells and the IL-1β gene product in the surrounding perivascular astrocytes and macrophages enable IL-1β contribute to the ischemic damage by directly activating endothelial cells to release arachidonic acid metabolites, platelet-activating factor, inducing endothelial expression of adhesion molecules for leukocytes and platelets and ultimately provoking the endothelium to undergo a change to a prothrombotic and proadherent surface (Hallenbeck, 1994).
In summary, the present study showed upregulation of IL-1β mRNA and its receptor gene expression after global ischemia. Interleukin-1β and IL-1R mRNA upregulation took place in neuronal cell bodies in the post-ischemic cortex and CA1 through CA3/CA4 regions and the dentate gyrus of the hippocampal formation. A transient upregulation for IL-1β mRNA in the white matter areas was also detected. Differential protein expression was seen for the IL-1β and IL-1R, the former being expressed by glial cells (mostly astrocytes), the latter being localized in the neurons and, to a lesser degree in the endothelial cells, suggesting that neurons and endothelium may be the primary targets of IL-1β in brain ischemia/reperfusion injury.