
Abstract
We measured CBF and CO2 reactivity after traumatic brain injury (TBI) produced by controlled cortical impact (CCI) using magnetic resonance imaging (MRI) and spin-labeled carotid artery water protons as an endogenous tracer. Fourteen Sprague-Dawley rats divided into TBI (CCI; 4.02 ± 0.14 m/s velocity; 2.5 mm deformation), sham, and control groups were studied 24 hours after TBI or surgery. Perfusion maps were generated during normocarbia (Paco2 30 to 40 mm Hg) and hypocarbia (Paco2 15 to 25 mm Hg). During normocarbia, CBF was reduced within a cortical region of interest (ROI, injured versus contralateral) after TBI (200 ± 82 versus 296 ± 65 mL · 100 g−1 · min−1, P < 0.05). Within a contusion-enriched ROI, CBF was reduced after TBI (142 ± 73 versus 280 ± 64 mL · 100 g−1 · min−1P < 0.05). Cerebral blood flow in the sham group was modestly reduced (212 ± 112 versus 262 ± 118 mL · 100 g−1 · min−1, P < 0.05). Also, TBI widened the distribution of CBF in injured and contralateral cortex. Hypocarbia reduced cortical CBF in control (48%), sham (45%), and TBI rats (48%) versus normocarbia, P < 0.05. In the contusion-enriched ROI, only controls showed a significant reduction in CBF, suggesting blunted CO2 reactivity in the sham and TBI group. CO2 reactivity was reduced in the sham (13%) and TBI (30%) groups within the cortical ROI (versus contralateral cortex). These values were increased twofold within the contusion-enriched ROI but were not statistically significant. After TBI, hypocarbia narrowed the CBF distribution in the injured cortex. We conclude that perfusion MRI using arterial spin-labeling is feasible for the serial, noninvasive measurement of CBF and CO2 reactivity in rats.
Contemporary models of traumatic brain injury (TBI) in the rat (e.g., fluid percussion and controlled cortical impact [CCI]) reproduce important components of human head injury, such as contusion, hemorrhage, edema, and axonal injury (Dixon et al, 1991; Goodman et al., 1994; Kochanek et al., 1995). These models have also provided meaningful insight into the cellular and molecular mechanisms of secondary injury (McIntosh et al., 1992) and have been important in the development of clinical trials (Hall et al., 1988; Kontos and Wei, 1986; Smith et al., 1993; McIntosh, 1992). However, our understanding of the response of the cerebral circulation to TBI in these models remains incomplete. Specifically, the serial measurement of regional CBF in individual animals and the study of the response of the regional cerebral circulation to changes in Paco2 (CO2 reactivity) have not been possible using any single currently available technique.
The ideal technique for measuring CBF after TBI should be (1) noninvasive, allowing for serial measurements, (2) directly quantitative, and (3) should produce an accurate map of flow delineating the heterogeneity of posttraumatic CBF. Current techniques for measuring CBF in rats, such as laser-Doppler flowmetry, radiolabeled microspheres, and autoradiography, all fail to meet these criteria on at least one account (Ginsberg, 1987; Warner et al., 1987; Reith et al., 1994). Laser-Doppler flowmetry measures red cell volume and velocity, and is limited to a small sampling area. Microspheres, while useful, are limited by sampling variation and target area vascularity, particularly in small animals such as rats (Yamakami and McIntosh, 1991). Finally, autoradiography yields only a single data point per animal.
These limitations notwithstanding, investigators have been able to estimate local CBF changes using existing techniques. An estimation of CO2 reactivity after TBI using laser-Doppler flowmetry was recently reported (Lee et al., 1995). Techniques have been combined to answer questions pertaining to cerebrovascular failure. Cerebral blood flow was recently measured using both 14C-isopropyliodoamphetamine and laser-Doppler flowmetry in an attempt to delineate local CBF kinetics in the first 4 hours after CCI (Bryan et al, 1995).
Technological advances in solid organ perfusion imaging have yielded important information about organ function. Wash-in and wash-out of exogenously delivered diffusible tracers have been measured to derive organ perfusion rates (Jones et al., 1982). Recently, the noninvasive technique of magnetic resonance imaging (MRI) of rat brain perfusion in vivo by arterial spin labeling was described (Detre et al., 1992). This technique avoids the use of injectable tracers, and instead uses arterial water as an endogenous tracer by magnetically labeling the water proton spins at the level of the carotid arteries. A quantitative map of CBF is then generated from magnetization changes measured in the brain images.
We report the application of perfusion MRI, using arterial spin labeling, to the serial and noninvasive measurement of CBF and CO2 reactivity after CCI in the rat.
METHODS AND MATERIALS
Surgery and brain trauma model
The study protocol was approved by the University of Pittsburgh Animal Care and Use Committee. Fourteen virus-free mature male Sprague-Dawley rats (318 to 491 g) were studied.
Anesthesia was induced using 4% isoflurane in a ratio of N2O to O2 of 2:1. The rats were orotracheally intubated and mechanically ventilated. The isoflurane was reduced to 2% followed by sterile surgical placement of a femoral arterial catheter for the administration of penicillin (100,000 U intramuscularly; Upjohn, Kalamazoo, MI, U.S.A.), gentamicin (10 mg/kg intramuscularly; Elkins-Sinn, Cherry Hill, NJ, U.S.A.), and pancuronium bromide (0.1 mg · kg−1 · h−1 intravenously; Elkins-Sinn).
After stereotactic head positioning (David Kopf, Tujunga, CA, U.S.A.), the scalp was retracted, exposing the left parietal bone. A craniotomy was made using a high-speed dental drill under a binocular operating microscope. A burr hole was made 5.0-mm anterior and 2.0-mm lateral to the bregma in the left skull and a temperature probe (0.009 in diameter) was inserted 2-mm into the cortex. The bone flap was left in place and the isoflurane was reduced to 1.1% followed by a 30-minute equilibration period. The brain was maintained at 37 ± 0.5°C and arterial blood gasses were optimized. Target values for the arterial blood gases were a PaO2 between 35 and 45 mm Hg and a PaO2 > 70 mm Hg.
Traumatic brain injury was produced using the CCI device as recently described (Kochanek et al., 1995) with minor modifications. The bone flap and the temperature probe were removed and a CCI (4.02 ± 0.14 m/s impactor velocity, 2.5 mm deformation depth) was delivered onto the exposed dura overlying the left parietal cortex. The bone flap was replaced and sealed with dental cement and the scalp was resutured. The femoral artery catheter and brain temperature probe were removed and the rat was allowed to recover more than I hour. After extubation, supplemental O2 was administered for 30 minutes. Once fully recovered, the rat was returned to its cage with full access to food and water.
Three groups of rats were studied. The first group (TBI, n = 4) was subjected to CCI as described, the second group (sham, n = 5) was subjected to craniotomy without cortical contusion and the third group consisted of control rats (n = 5).
Perfusion magnetic resonance imaging method
The perfusion MRI technique of arterial spin labeling (Detre et al., 1992) uses endogenous arterial water as a tracer by magnetically labeling the water proton spins. This labeling is achieved with spin inversion, using principles of adiabatic fast passage (Dixon et al., 1986) by applying a continuous, low-power radiofrequency field in the presence of a magnetic field gradient during the recovery time period of an MRI sequence (Williams et al., 1992). Two brain images of the same plane were acquired with the inversion plane centered over the carotid arteries for the labeled image, and then centered symmetrically opposite to the image detection plane for the control image. The control image accounts for any off-resonance saturation effects of the low-power radiofrequency field caused by crossrelaxation with macromolecules.
Cerebral blood flow was calculated for each pixel in the perfusion maps with the following equation.

where λ = Blood-brain partition coefficient for water; T1obs = in vivo spin-lattice relaxation time for tissue water; Mc = Magnetization intensity of the control image; ML = Magnetization intensity of the labeled image; α = Degree of arterial spin labeling.
A spatially constant value of 0.9 mL · g−1 was assumed for λ (Herscovitch and Raichle, 1985) and of 1.6 seconds for T1obs (Detre et al., 1992). The value for a was measured previously in a separate group of normal rats following the method of Zhang et al., (1993) and was found to be 80%.
Magnetic resonance imaging acquisition protocol
Rats in the TBI and sham groups were transported to the MRI Center (Pittsburgh NMR Center for Biomedical Research, Carnegie Mellon University) 24 hours after surgery, where they were anesthetized with 5% halothane and a ratio of N2O to O2 of 2:1, endotracheally intubated, and mechanically ventilated. Halothane was reduced to 1.5% and a femoral arterial catheter was placed. The rat was placed in a Bruker Biospec 4.7 Tesla/40 cm system (Bruker Instruments, Billerica, MA, U.S.A.) equipped with a 15-cm gradient insert and a 7-cm diameter 1H imaging coil. Halothane was discontinued and anesthesia was maintained with a ratio of N2O to O2 of 2:1. Pancuronium bromide (0.1 mg · kg−1 · h−1) was given by continuous infusion while the rat was in the magnet. Arterial blood gases were monitored and rectal temperature was monitored and controlled to 37°C using a heated water pad.
The coronal plane at the level of the left parietal cortex corresponding to the contusion was positioned at the isocenter of the magnet following pilot multislice, predominantly T2- weighted (TR/TE = 1087.5/60 ms) spin-echo images (Fig. 1). Once normocarbia was established, two perfusion images in this plane were acquired in succession with a spin-echo sequence (2000 ms recovery time, 30 ms echo time, 5-cm field of view, 2-mm slice thickness, 128 × 64 matrix size, and 2 signal averages with labeling applied ± 2 cm from the image detection plane.). The tidal volume and ventilator rate were increased. Once hypocarbia was established two perfusion images were again acquired in this plane resulting in two perfusion images at each Paco2 condition.
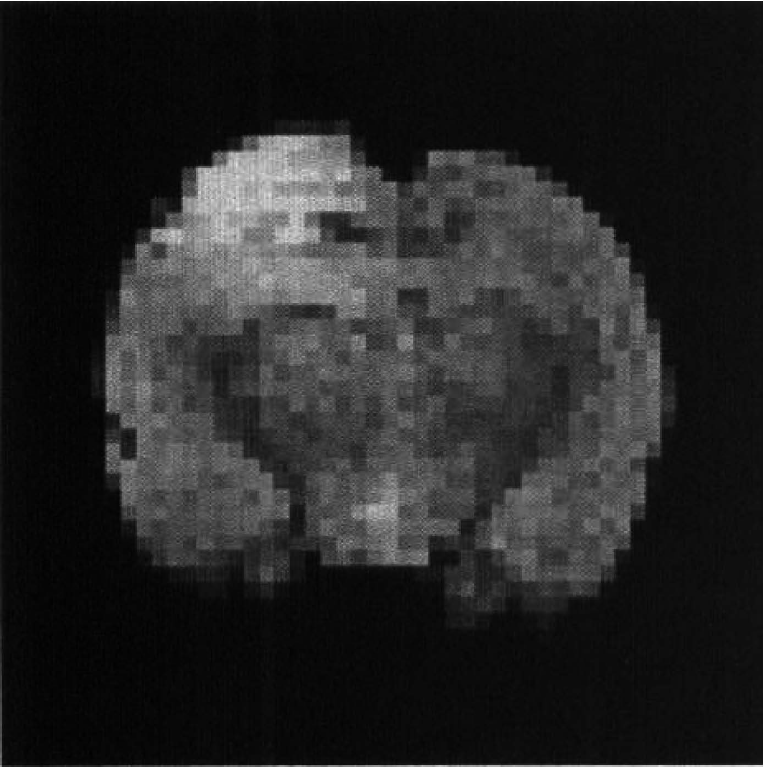
Predominantly T2-weighted coronal image (TR/TE = 1087.5/60 ms) of rat brain from a multislice data set 24 hours after controlled cortical impact. This figure is an example of the image used to locate the contusion, that is readily identifiable as high intensity.
Rats in the control group were taken to the MRI Center, intubated, and anesthetized in an identical manner. A femoral arterial catheter was placed, but no other surgery was performed. Images were acquired as previously described.
Image analysis of mean cerebral blood flow
Anatomic regions of interest (ROI) were defined on the control images from perfusion experiments before the generation of perfusion maps. Regions of interest boundaries were defined on coronal sections as (1) the entire left and right parietal cortex within the slice including the contusion (cortical ROI) and (2) a second, smaller ROI that included the full cortical thickness but began 1 mm from midline and extended to the midpoint of the arc that defined the entire parietal cortex in each hemisphere. This restriction enriches the contribution of the contusion zone (contusion-enriched ROI). Perfusion maps were generated using Equation 1 and pixels with negative flow values were reassigned to zero. Regions of interest definitions and mean CBF calculations within each ROI were performed for all rats under both normal and reduced Paco2 conditions using the image analysis software package, Stimulate version 3.6.1 (kindly provided by John Strupp, Center for Magnetic Resonance Research, University of Minnesota, Minneapolis, MN) (Strupp, 1996).
Of the 56 total perfusion maps generated, 6 were excluded from analysis because of image artifacts (ventilator-related motion or poor image quality). At least one map was retained for each condition in each rat. When both perfusion maps were artifact-free, the arithmetic mean of the two measurements was computed.
Cerebral blood flow distribution
To further examine the difference in distribution and range of CBF in the TBI and control groups, as well as the impact of hypocarbia on the distribution and range, box-plots of CBF were constructed. Pixel values in cortical ROI from each rat in the control (n = 5) and TBI (n = 4) groups were compiled into four data sets for each Paco2 condition. Specifically, normocarbia: left cortical CBF (control, TBI) and right cortical CBF (control, TBI); hypocarbia: left cortical CBF (control, TBI) and right cortical CBF (control, TBI).
CO2 reactivity determination and generation of maps
From the CBF data acquired at two different levels of Paco2 CO2 reactivity was calculated from the mean perfusion values within each ROI in all rats using Equation 2 (Marion and Bouma, 1991).
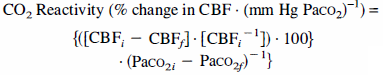
where CBFi = CBF value, normocarbia; CBFf = CBF value, hypocarbia; Paco2i = Paco2 value, normocarbia; Paco2f = Paco2 value, hypocarbia.
Equation 2 was also applied on a pixel-by-pixel basis to generate spatial maps of CO2 reactivity from values within the perfusion maps. Some pixels within the perfusion maps have a value of zero mL · 100 g−1 · min−1. These pixels were assigned a value of 0.01 mL · 100 g−1 · min−1 to avoid division by zero. Maps of CO2 reactivity were generated for the purpose of visualization only. Quantitation of CO2 reactivity was performed using mean perfusion values within each ROI as described above.
Statistical analysis
All data are expressed as mean ± SD. Comparisons of physiologic variables among TBI, sham, and control groups were made using one-way analysis of variance. Comparisons of mean CBF and CO2 reactivity within a group were made using the paired Student's t-test. Specific intergroup differences were identified using two way analysis of variance with Student-Neuman-Keuls for multiple comparison when warranted by the F-statistic. Analysis of the CBF distribution was performed using the log-rank statistic. Significance was defined by a P-value < 0.05.
RESULTS
Physiologic parameters
There were no differences between groups in any physiologic variable at normocarbia (Table 1). Paco2 was reduced by hyperventilation as expected (P < 0.05) in all three groups. Mean arterial blood pressure increased during hypocarbia in the control and sham groups (P < 0.05), but not the TBI group. In addition, PaO2 increased in all groups during hyperventilation (P < 0.05), but the rats were neither hypotensive nor hypoxemic at any time.
Physiologic data during perfusion MRI Acquisition
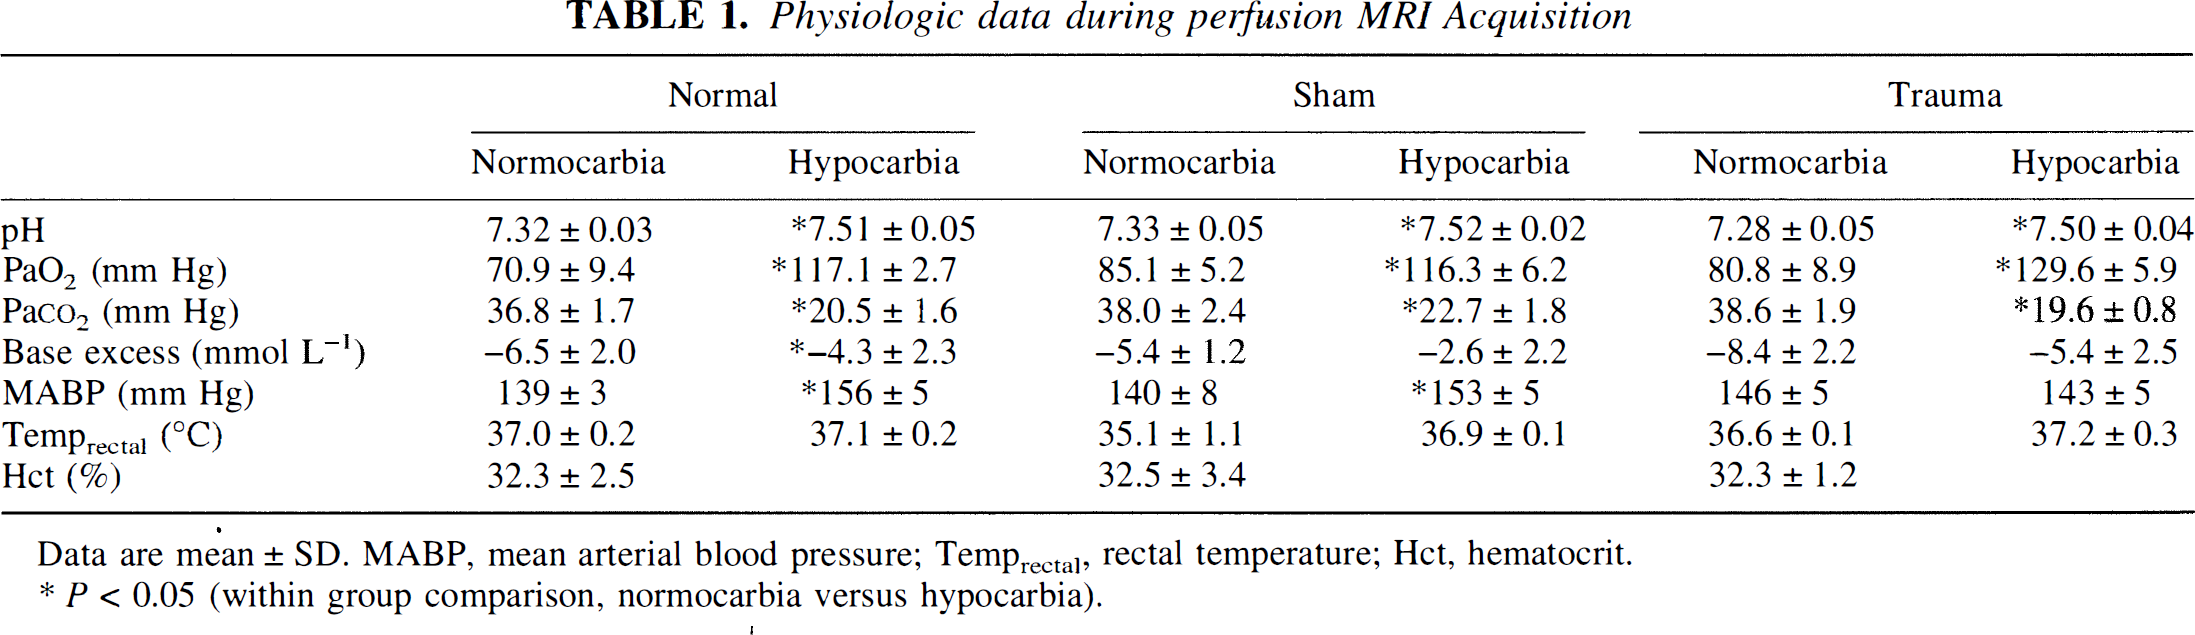
Data are mean ± SD, MABP, mean arterial blood pressure; Temprectal, rectal temperature: Hct, hematocrit.
P < 0.05 (within group comparison, normocarbia versus hypocarbia).
Mean cerebral blood flow measurements
The mean CBF in the control, sham, and TBI groups during normocarbia (cortical ROI) are presented in Fig. 2A. There were no significant differences in CBF between groups within either the right or left ROI. However, there was a reduction in CBF in the injured left versus uninjured right ROI within the TBI group (P = 0.01).
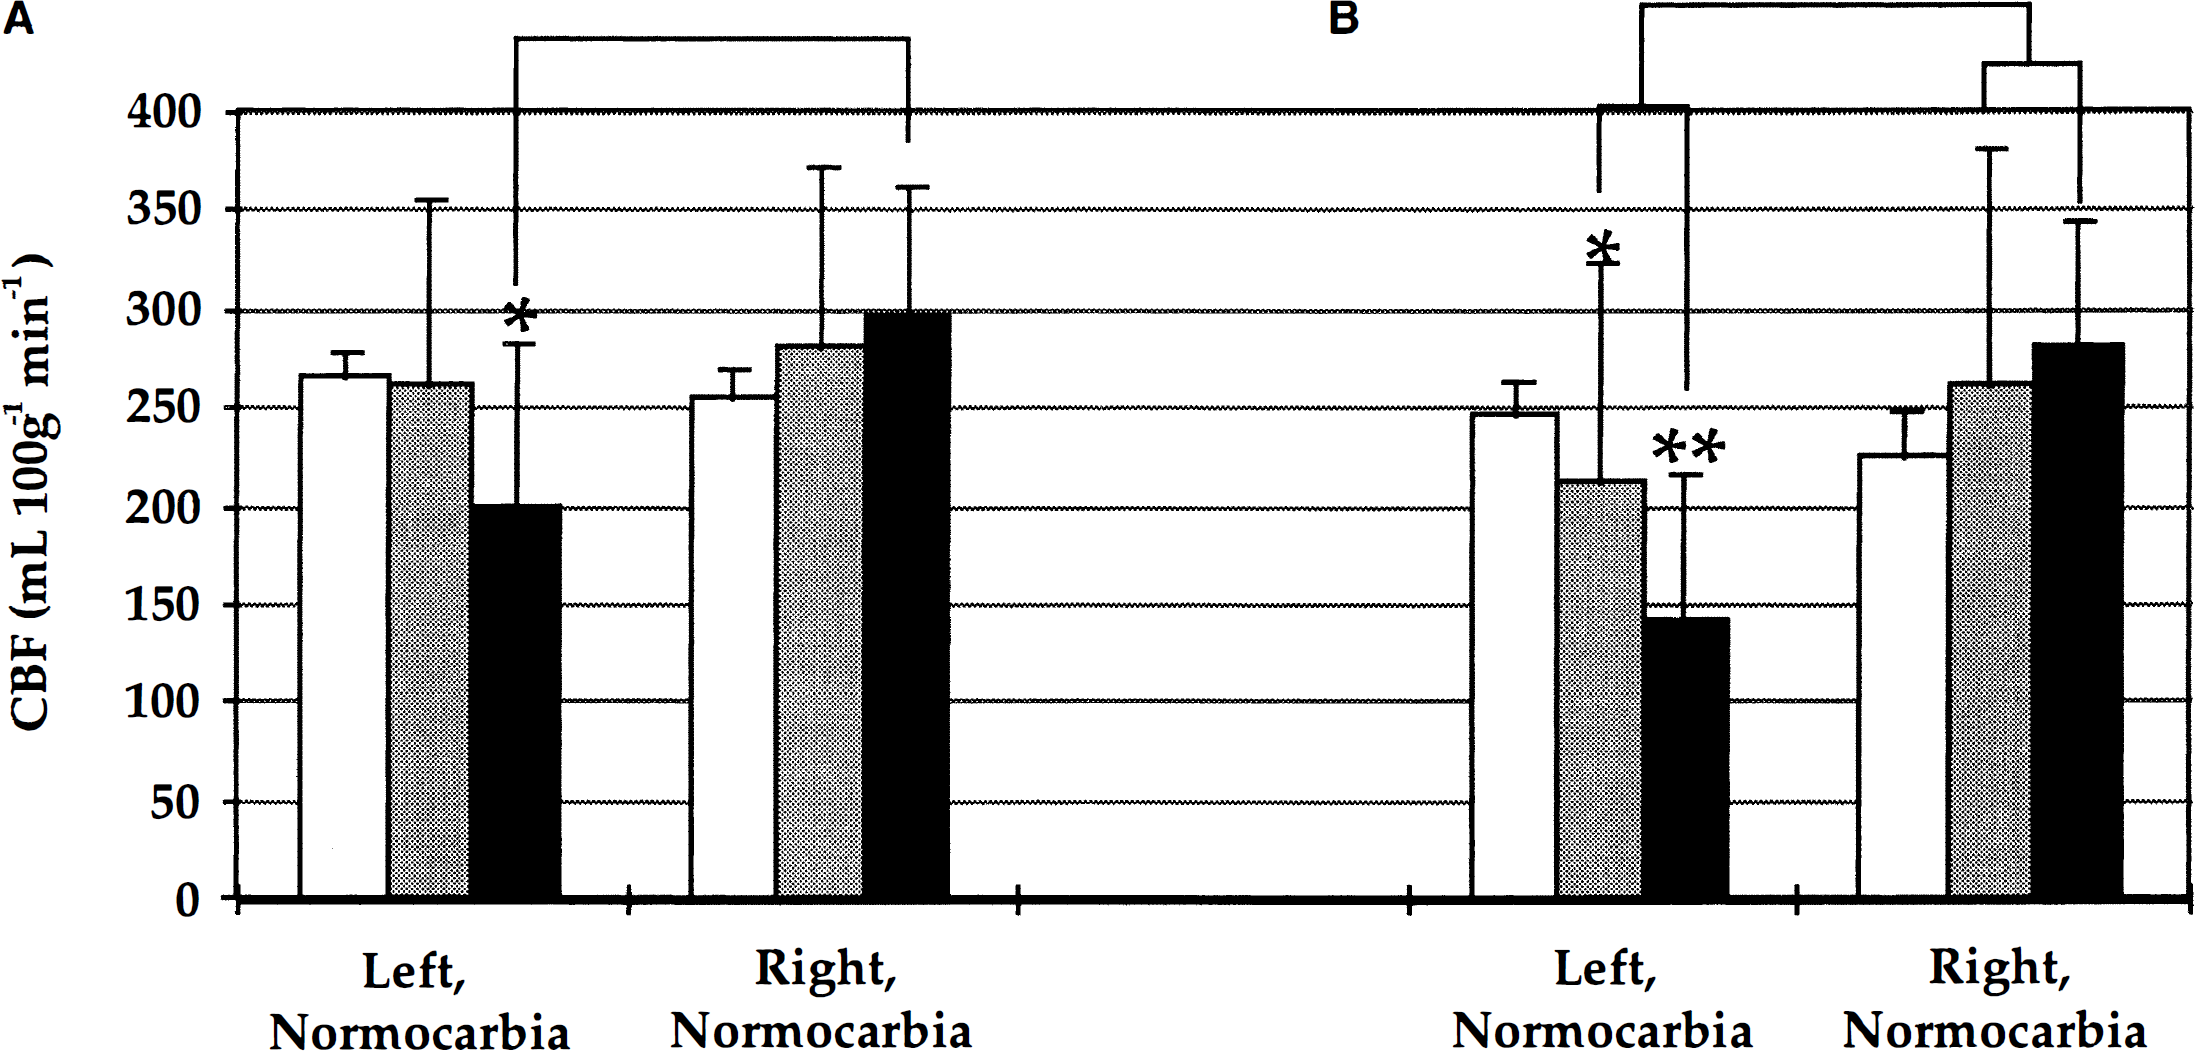
Mean CBF from regions of interest (ROI) within the parietal cortex in control rats [□, n = 5] and in rats 24 hours after either sham [▪, n = 5] or traumatic brain injury (TBI) [▪, n = 4] during normocarbia. (A) Cortical ROI, *P = 0.01, left versus right within TBI group. (B) Contusion-enriched ROI enhancing the contribution of the contusion, *P= 0.032 left versus right within sham. **P= 0.003 left versus right within TBI group.
Mean CBF from the contusion-enriched ROI is depicted in Fig. 2B. In contrast to the cortical ROI, when the injured left and uninjured right ROI were compared, a reduction in CBF was noted in the sham group (P = 0.032) and was much more apparent in the TBI group (P = 0.003).
Assessment of CO2 reactivity
Perfusion maps from control and injured rats during normocarbia and hypocarbia are shown in Fig. 3A–D. Hypocarbia in both groups resulted in a global reduction in flow. In perfusion maps during normocarbia in rats at 24 hours after CCI, a region of low CBF was readily identified (Fig. 3C) that was limited to the cortex and underlying white matter. Although hypocarbia (Fig. 3D) reduced perfusion in most areas, it did not seem to further decrease perfusion in the contused region. The images shown are the average of the pair of the perfusion maps generated, with regions outside the brain cropped for presentation purposes. A low-flow region was visually apparent in one sham rat.
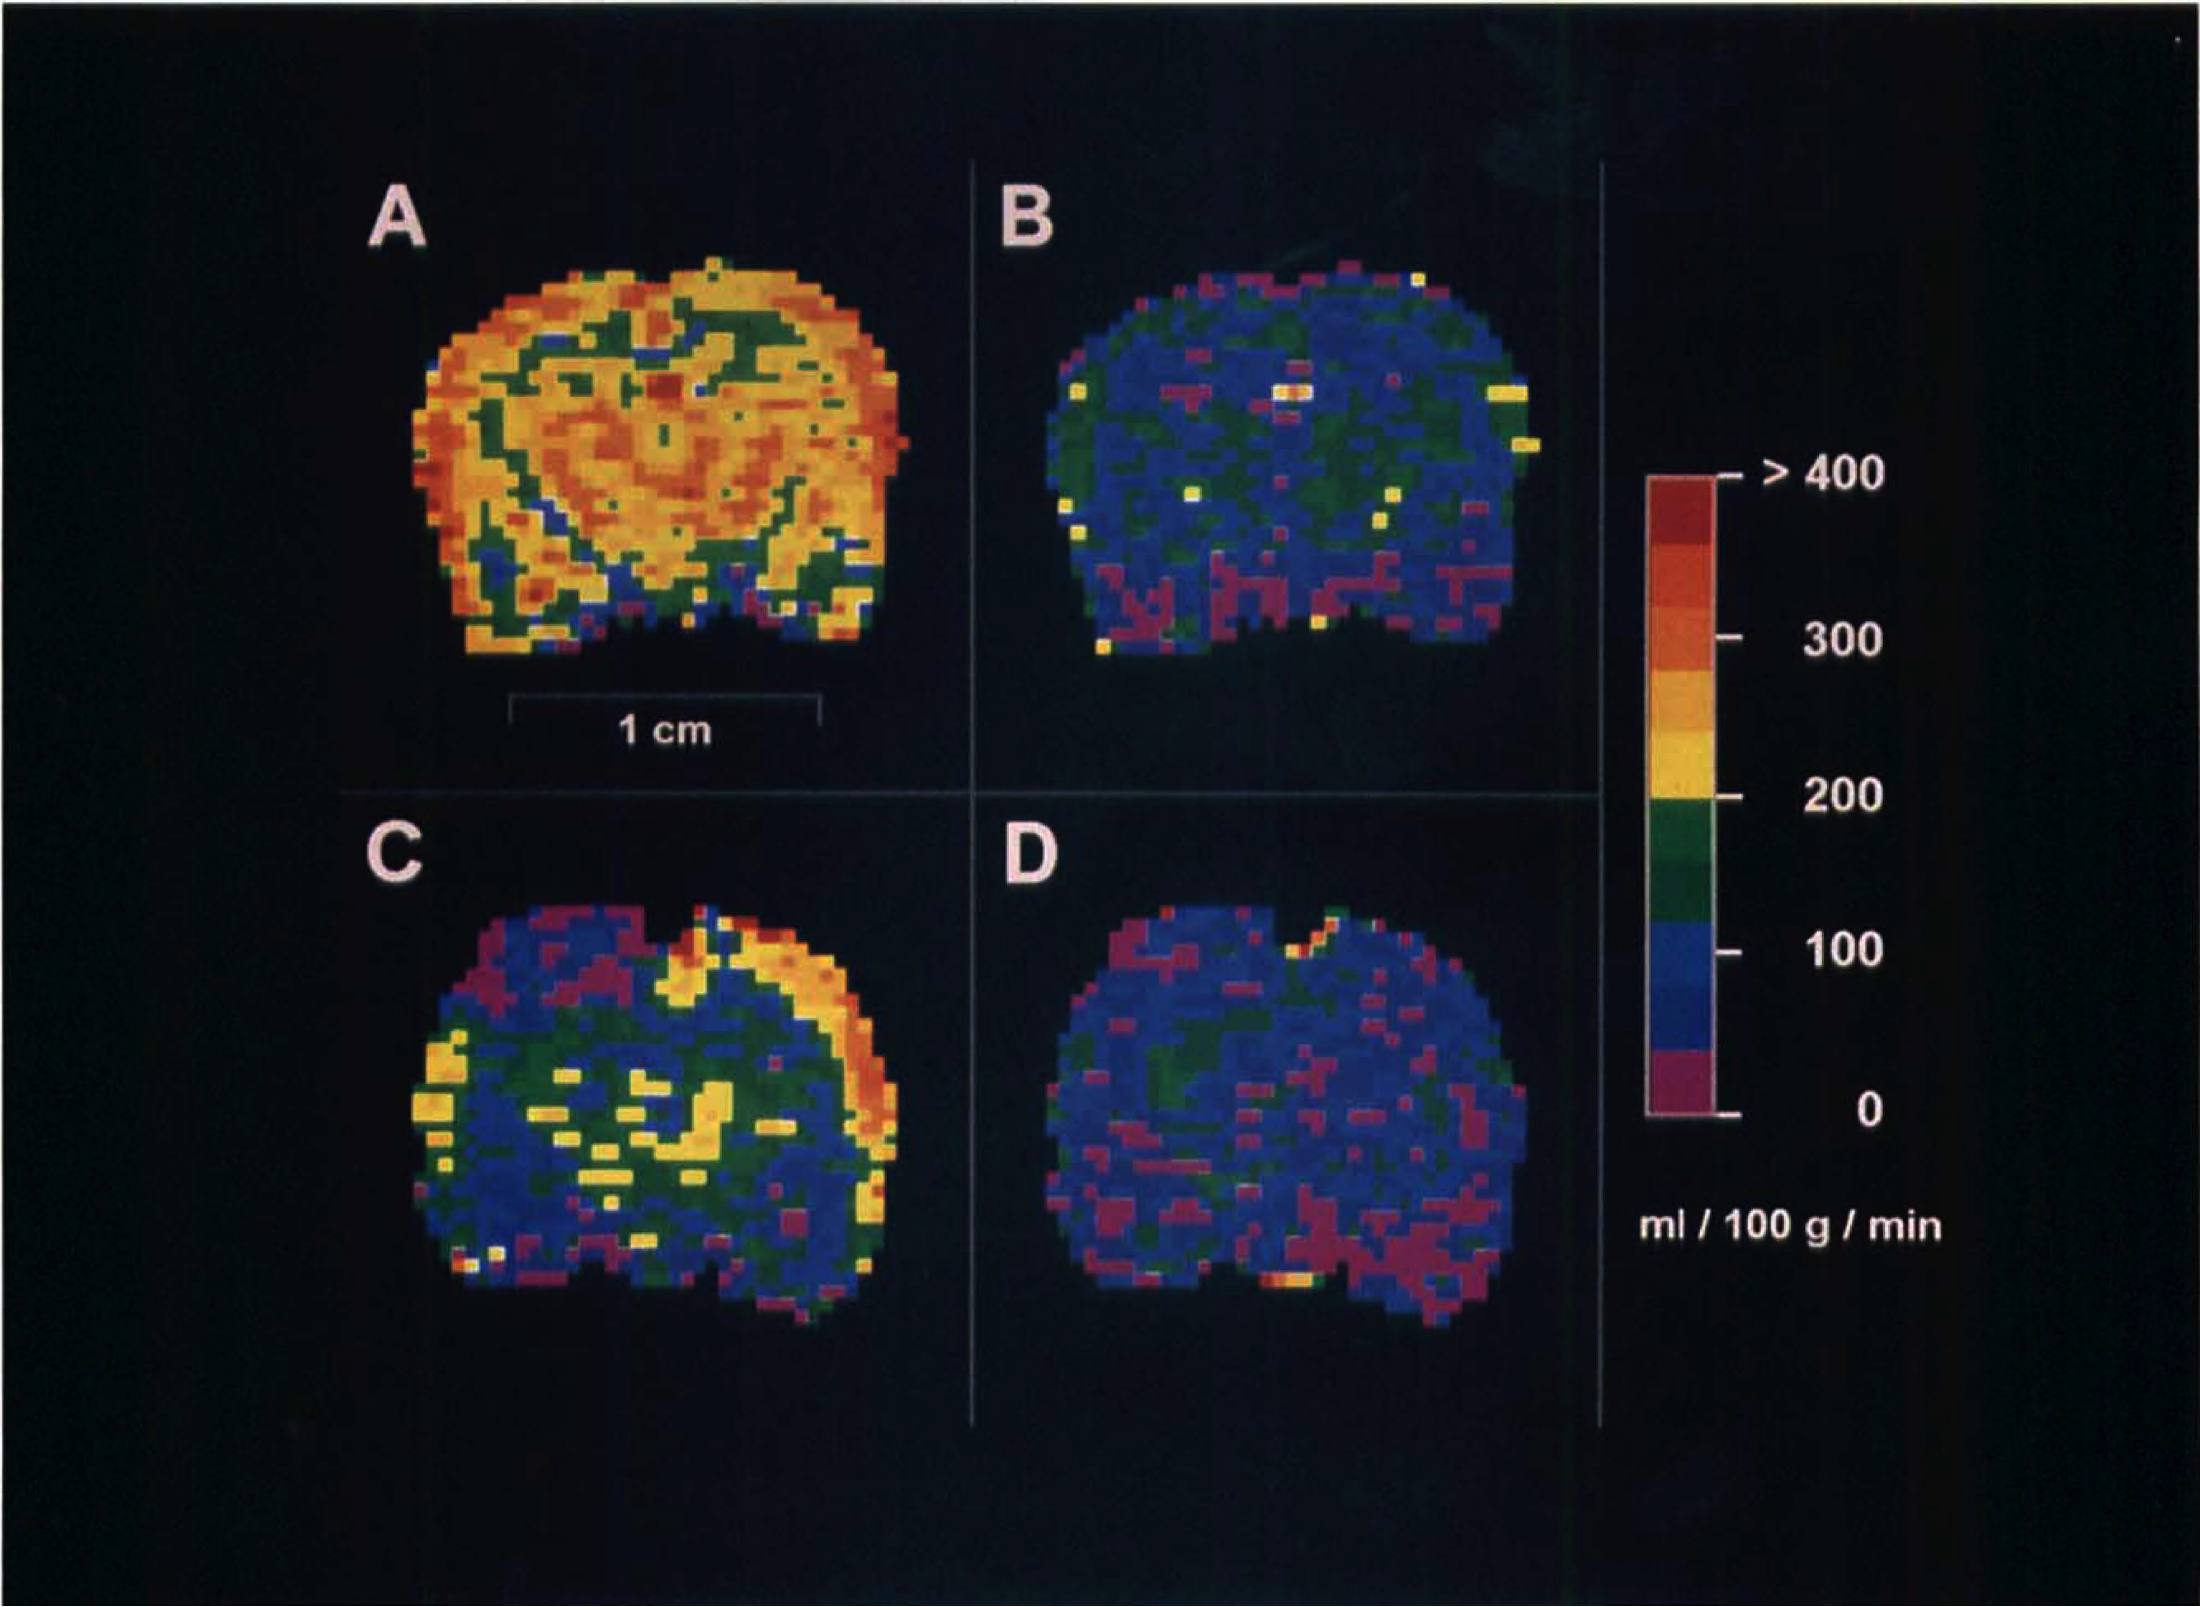
Colorimetric perfusion maps of rat brain in the coronal plane before and during hypocarbia. Serial studies from a single rat in the control group (A, B) and a single rat in the trauma group (24 hours after TBI, C, D) are shown. Hypocarbia caused the reduction and homogenization of CBF (B, D). Cerebral blood flow in the readily identifiable contusion zone (C) in the left parietal cortex does not seem to decrease during hypocarbia (D). The perfusion maps of Figs. 3C and 3D are from the same rat used to generate the predominantly T2-weighted image in Fig. 1.
Fig. 4A depicts mean CBF in the cortical ROI in the three groups before and during hypocarbia. The normocarbia data from Fig. 2 are displayed here for comparison. There was a bilateral reduction in CBF in the control, sham, and TBI groups during hypocarbia (P < 0.05, versus normocarbia). However, in the contusion-enriched ROI (Fig. 4B), a reduction in CBF in the left cortex during hypocarbia was observed only in the control rats (versus normocarbia, P < 0.05). This suggests an attenuation of CO2 reactivity in the contusion-enriched ROI in the sham and TBI groups. In contrast, hyperventilation reduced CBF in all groups in the uninjured right ROI (P < 0.05, hypocarbia versus normocarbia).
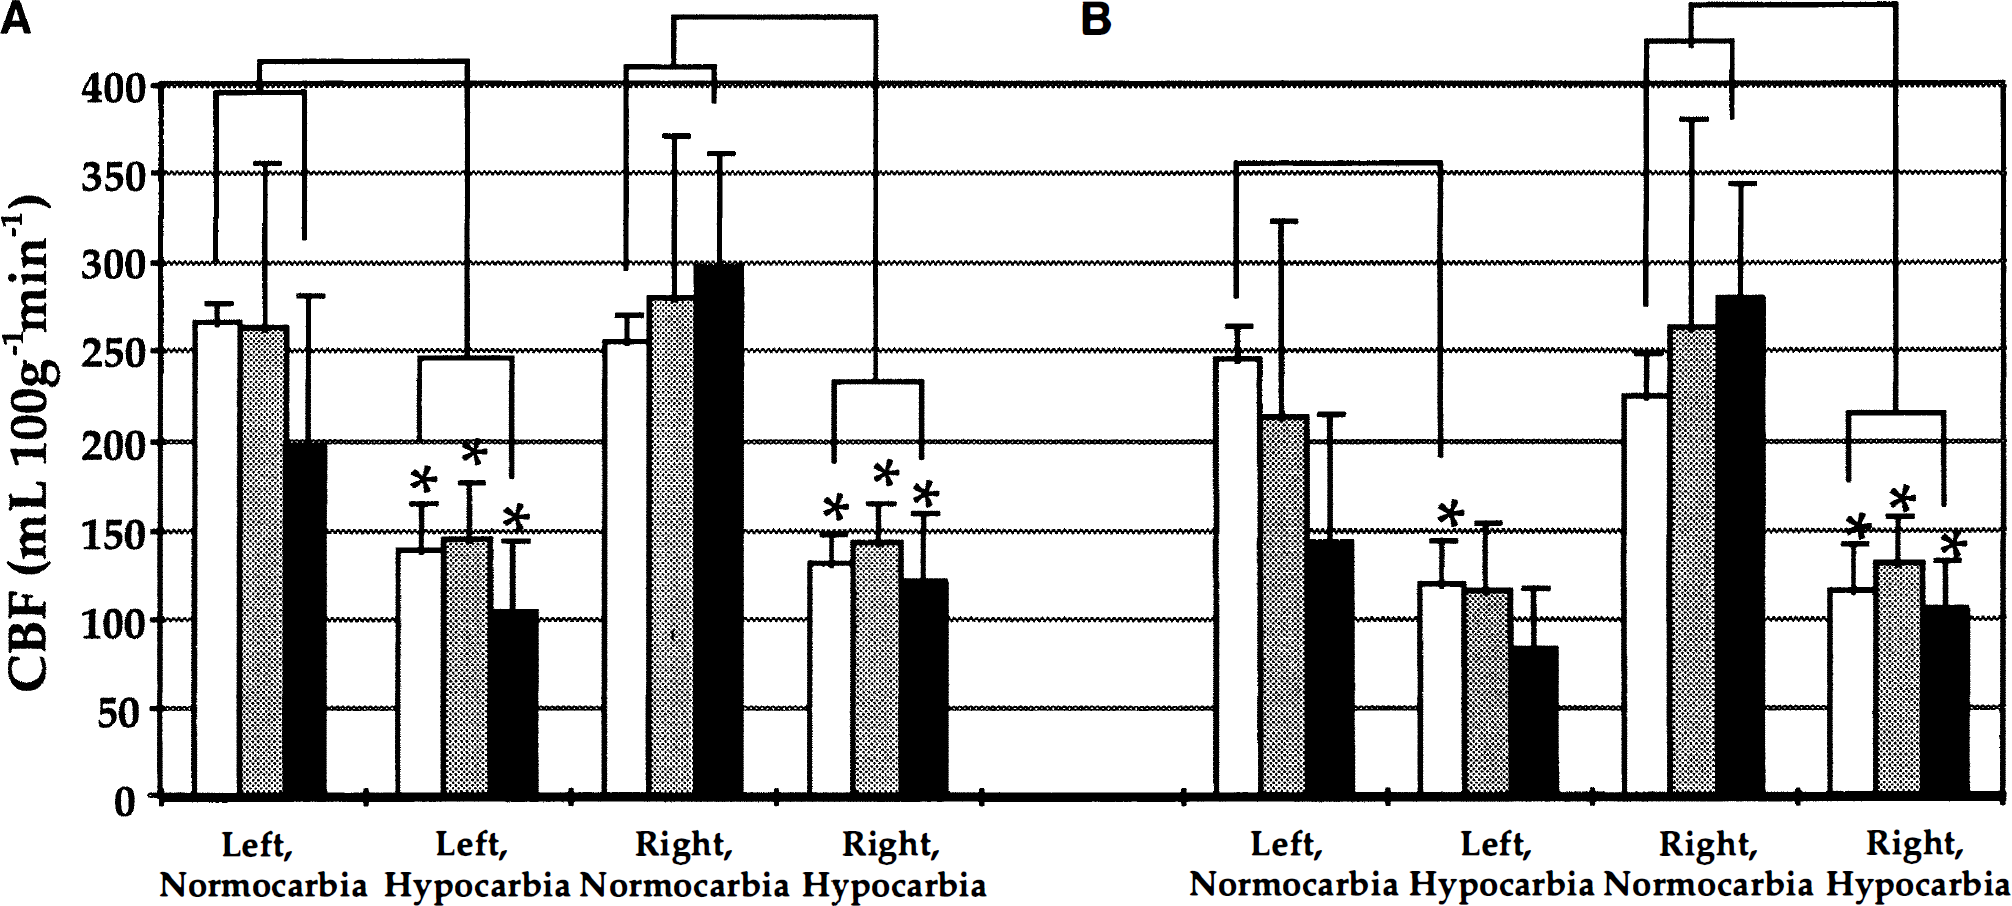
Mean CBF from ROI within the parietal cortex in control rats [□, n = 5] and in rats 24 hours after either sham [▪, n = 5] or TBI[▪ n = 4] before and during hypocarbia. (A) Cortical ROI. (B) Contusion-enriched ROI (*P < 0.05, hypocarbia versus normocarbia within groups)
In the left cortex of the control group, CO2 reactivity CO2 reactivity in the contusion-enriched ROI in the sham and TBI groups. In contrast, hyperventilation reduced CBF in all groups in the uninjured right ROI (P < 0.05, hypocarbia versus normocarbia).
In the left cortex of the control group, CO2 reactivity was 2.9 ± 0.3% (P = 0.68, versus right cortex) in the cortical ROI and 3.1 ± 0.3% (P = 0.3, versus right cortex) in the contusion-enriched ROI. In the left cortical ROI, the sham and TBI groups had CO2 reactivities of 2.7 ± 0.9% (P = 0.45, versus right cortex) and 2.2 ± 0.9%, (P = 0.31, versus uninjured cortex) respectively. Whereas, in the left contusion-enriched ROI, CO2 reactivity was 2.1 ± 1.9% (P = 0.2, versus right cortex) in the sham and 1.4 ± 2.1%, (P = 0.2, versus uninjured cortex) in the TBI group, respectively. Within the cortical ROI, CO2 reactivities in the sham and TBI groups were 13% and 31% less, respectively, when the left was compared with the uninjured right parietal cortex. In contrast, within the contusion-enriched ROI, CO2 reactivities in the sham and TBI groups were 28% and 58% less, respectively, when the left was compared with the uninjured right parietal cortex. Whereas these differences were not statistically significant, they do show a consistent trend of attenuated CO2 reactivity under the craniotomy (sham) and within the contusion.
CO2 reactivity maps from control and injured rats are shown in Fig. 5A and 5B, respectively. These maps were generated from the perfusion studies of the same rats shown in Fig. 3. These maps were helpful for visualizing the spatial heterogeneity of CO2 reactivity and revealed homogeneous reactivity throughout the normal rat brain (Fig. 5A), but heterogenous reactivity at 24 hours after TBI (Fig. 5B). CO2 reactivity was markedly attenuated within the contusion and in multiple foci within the ipsilateral hemisphere.
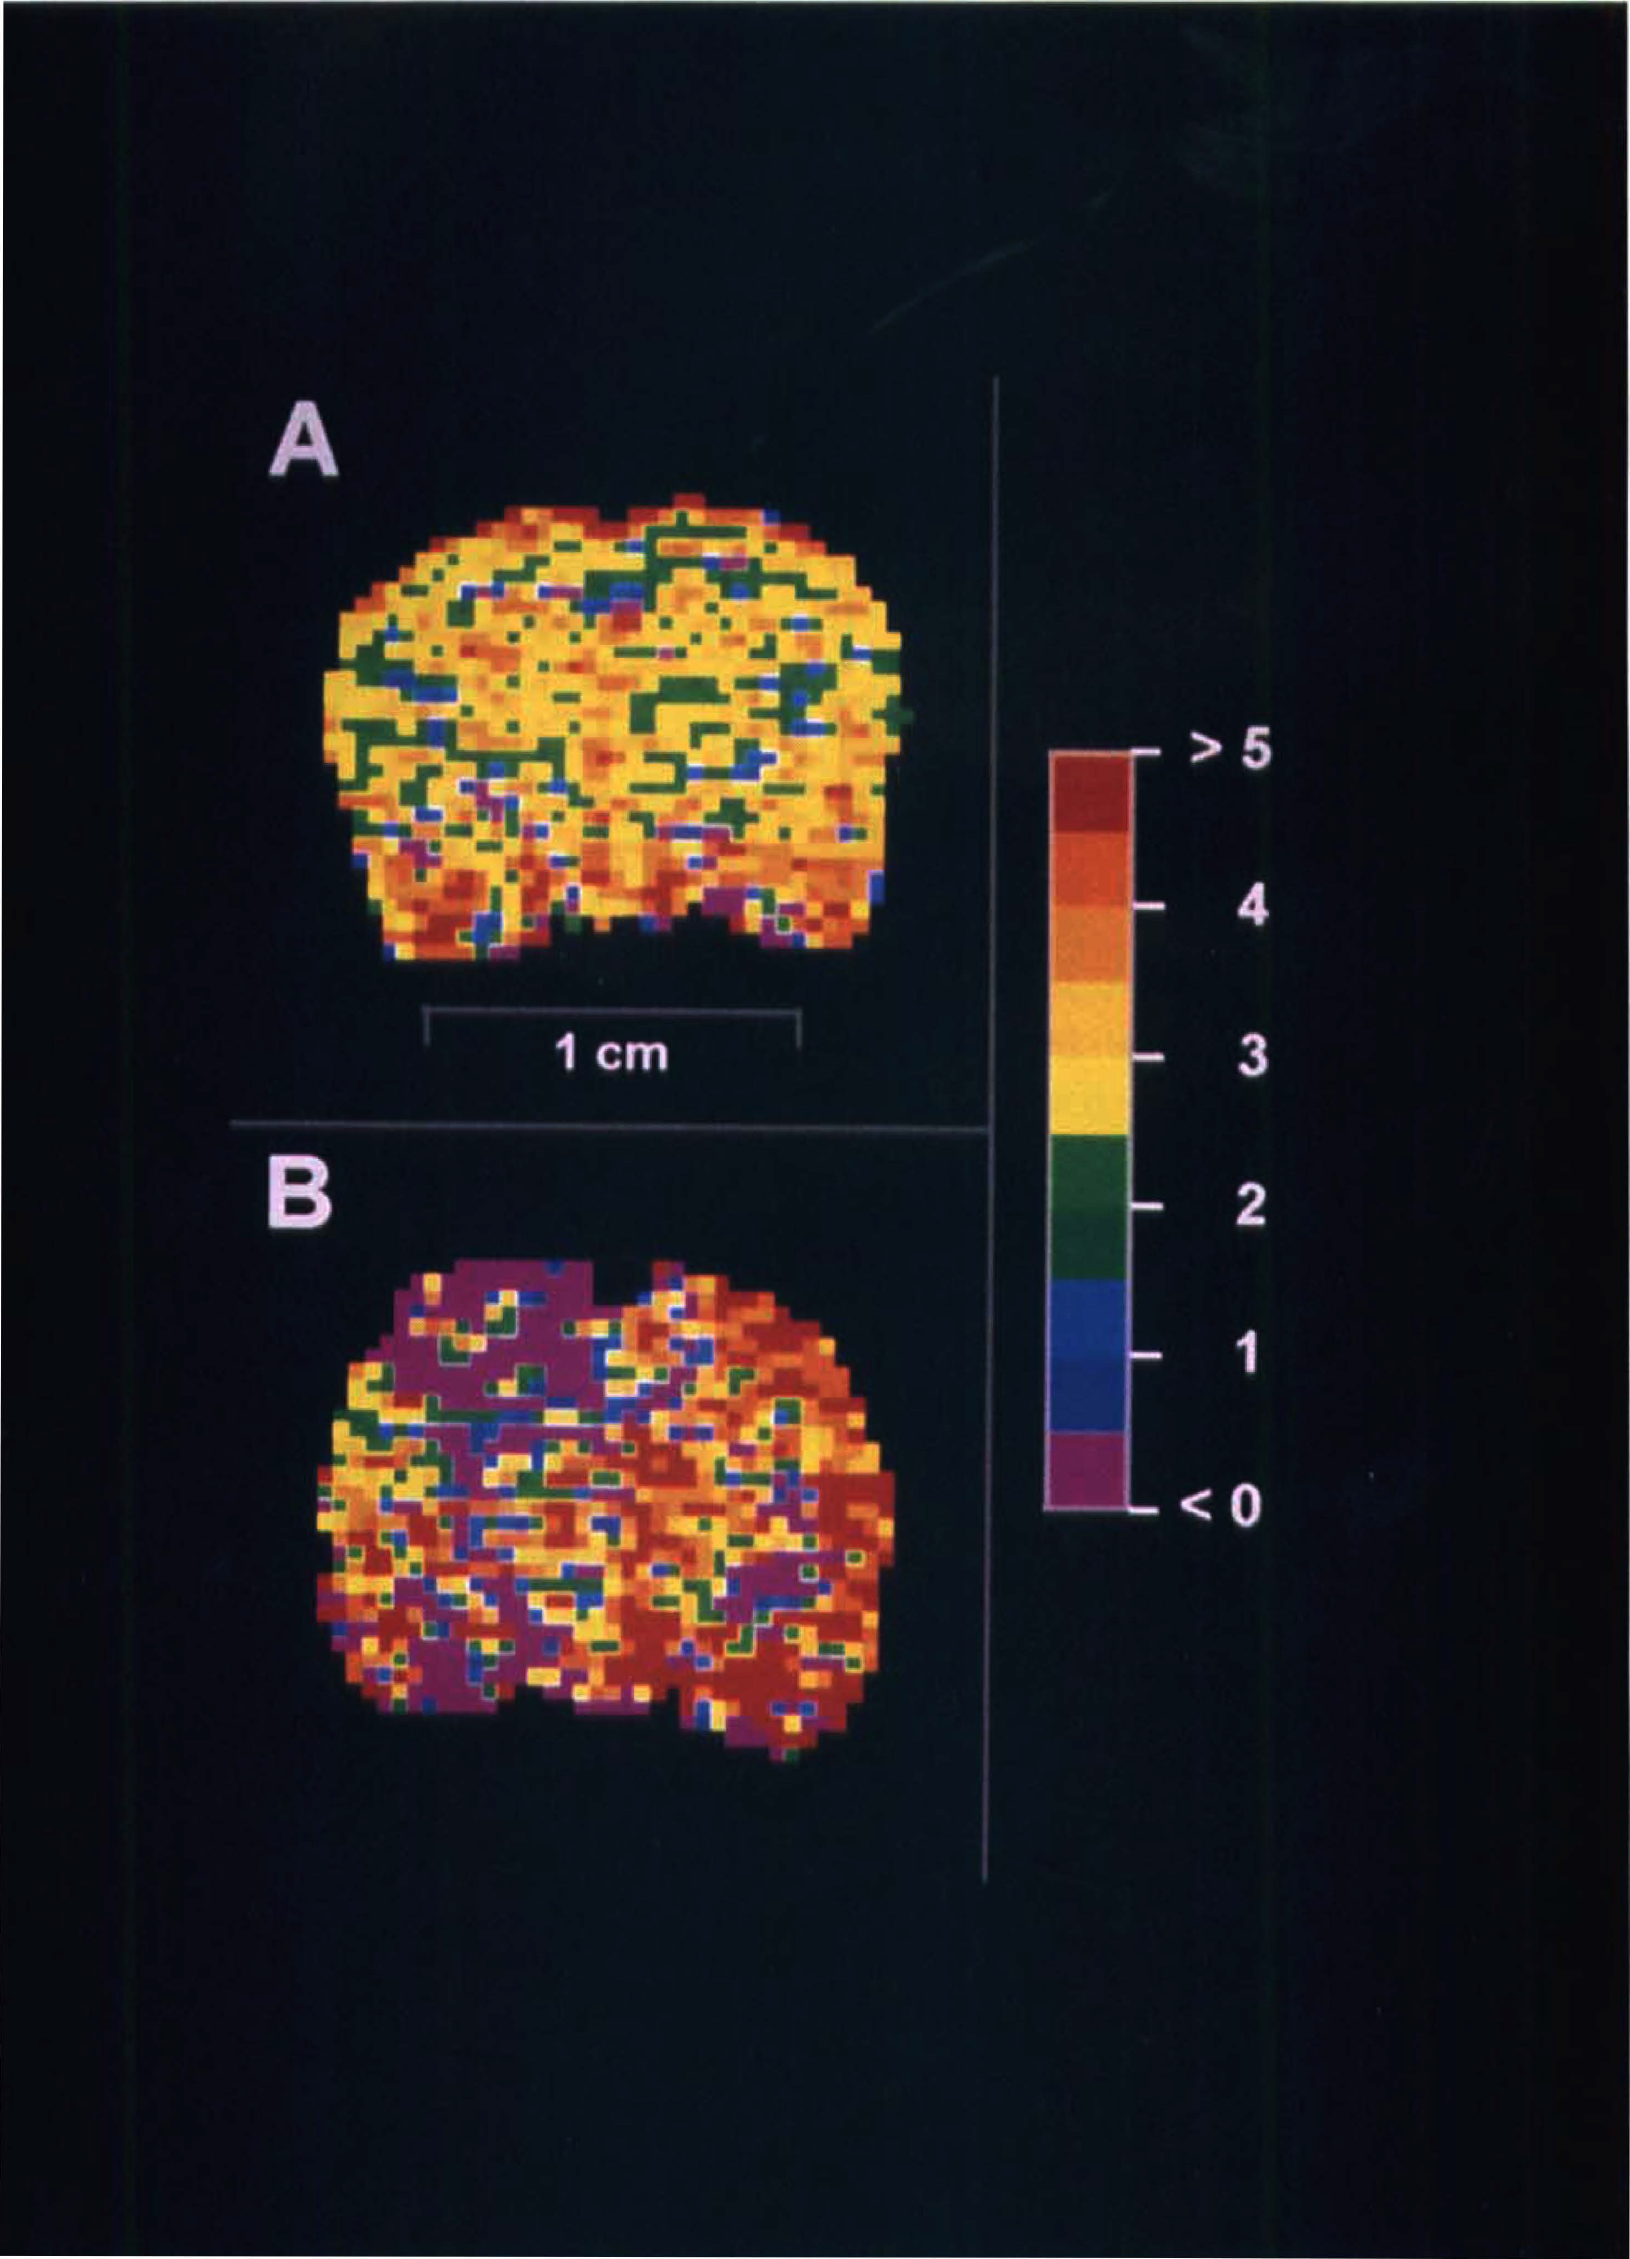
These coronal images depict in vivo regional vascular CO2 reactivity (% change in CBF · [mm Hg PaCO2]−1) in control (A) and 24 hours after TBI (B) rat brain. These colorimetric maps were generated using values from the perfusion maps shown in Fig. 2. CO2 reactivity is markedly reduced in the area of the contusion (B) and in multiple foci within the ipsilateral hemisphere. CO2 reactivity is preserved in the contralateral hemisphere. This suggests that the controlled cortical impact insult as used in these studies models a very severe contusion with loss of CO2 reactivity.
Assessment of cerebral blood flow distribution
Fig. 6 presents box plots depicting CBF in the control and TBI groups before and during hypocarbia. Box plots were generated using pooled CBF data to quantify the distributions of CBF in the two groups and determine the impact of hypocarbia on these distributions. The lines span the 5th to 95th percentiles, while the boxed regions span the 25th to 75th quartiles (interquartile range, IQR75-25), with a bisecting median line.
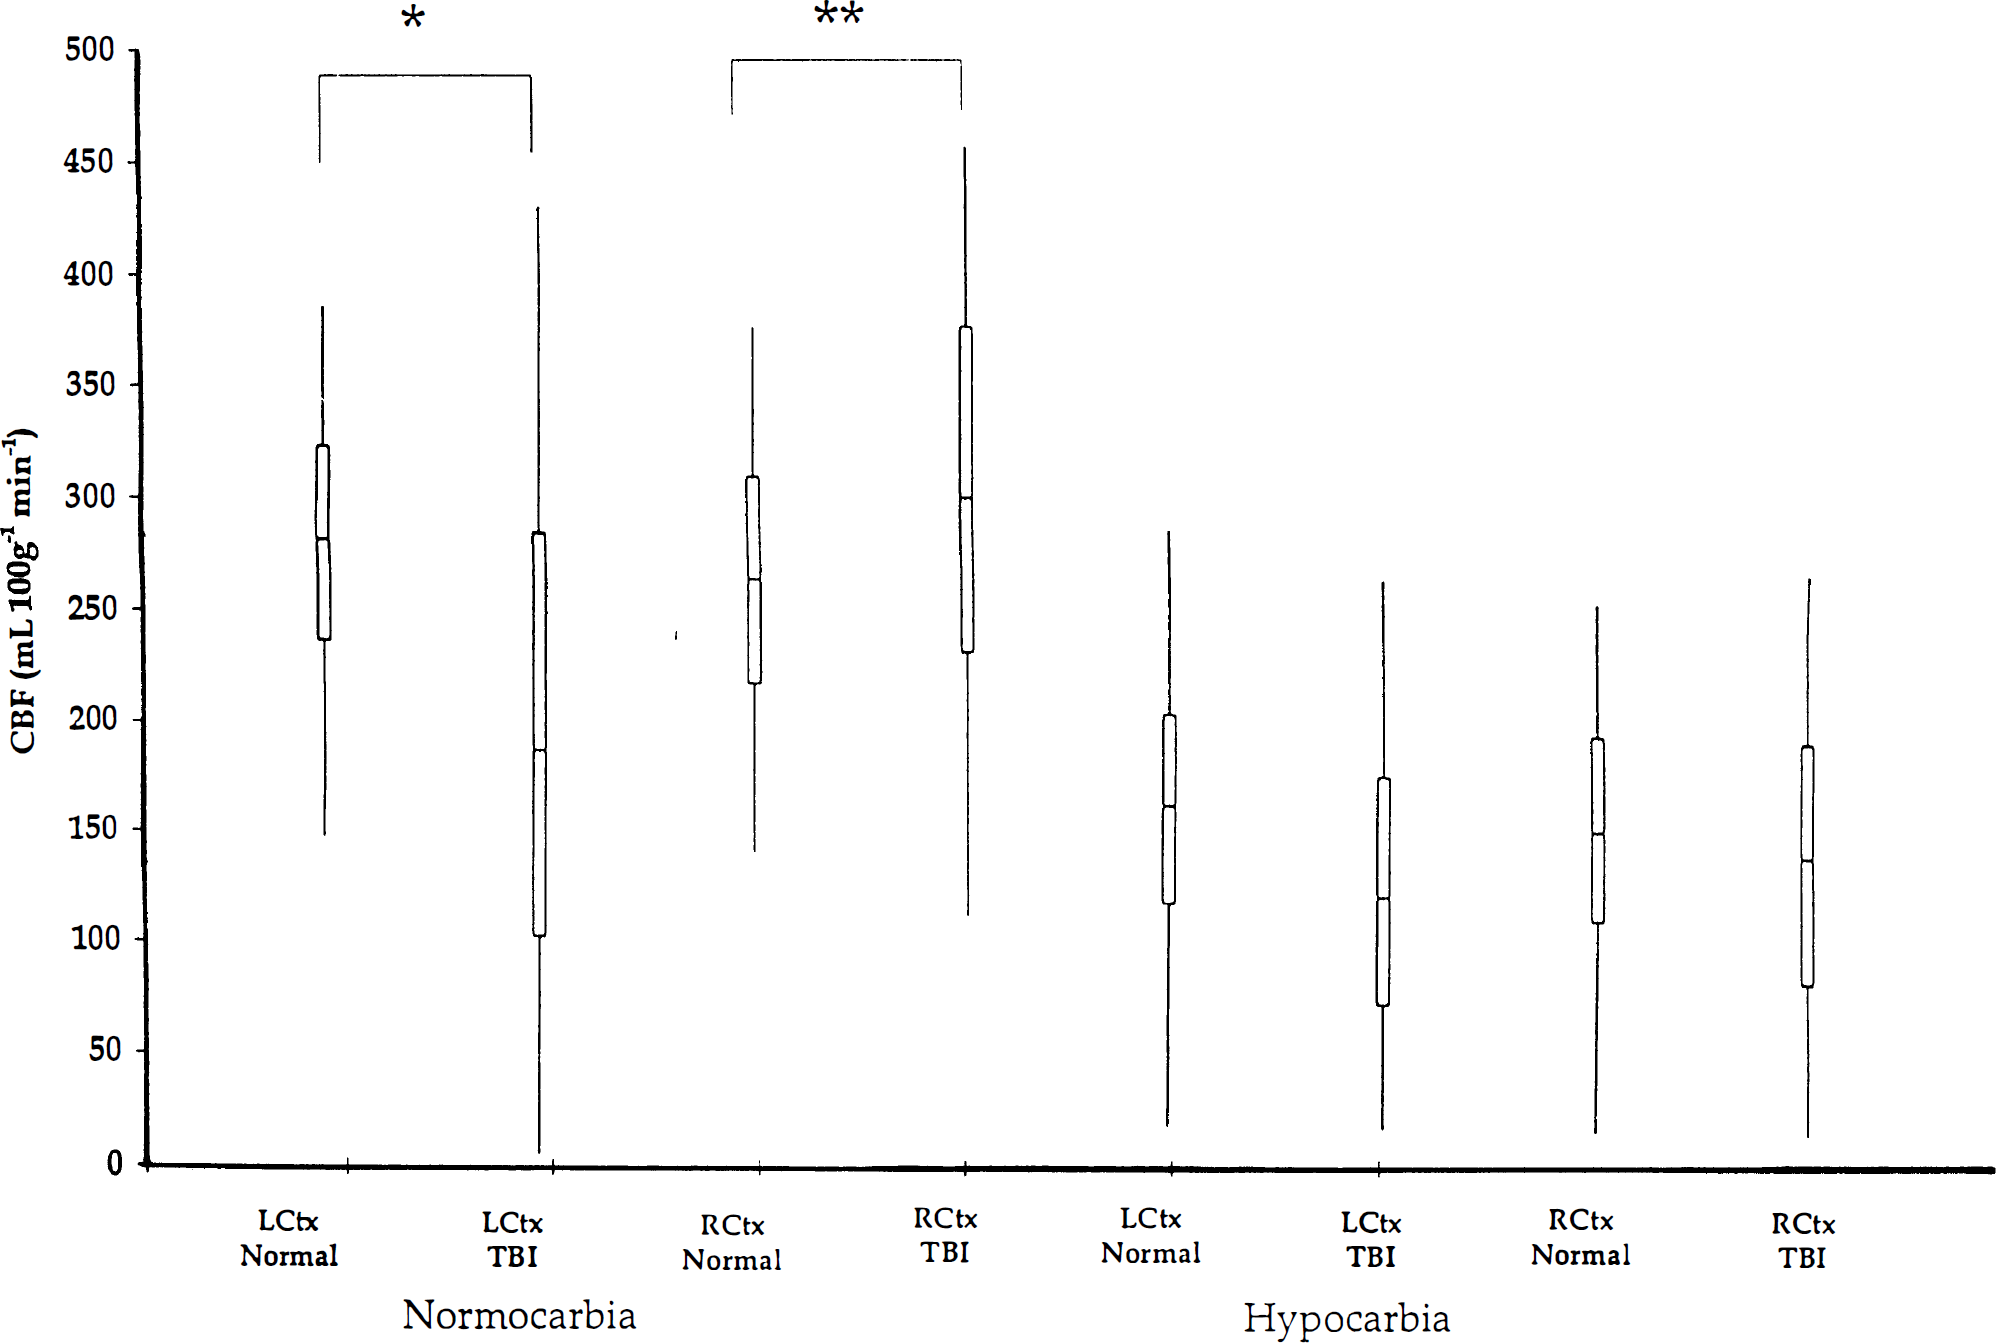
Box-plots depicting CBF in control rats and in rats 24 hours after TBI during normocarbia and hypocarbia. Range: 5th to 95th percentile; Boxed regions: 25th to 75th quartiles with bisecting median values. LCtx, left cortical ROI; RCtx, right cortical ROI; TBI, traumatic brain injury group (n = 4), Control = control group (n = 5). There was a wider distribution of CBF in the injured than uninjured left parietal cortex (LCtx, TBI versus Controls; *P = 0.0001) and in the right cortex of the TBI group (RCtx, TBI versus Controls; **P = 0.0001). There was a reduction in the interquartile range (IQR75-25) in the TBI group during hypocarbia.
The injured left parietal cortex exhibited a greater number of lower and higher flow pixels compared to the control left parietal cortex (IQR75-25: 186 versus 85 mL · 100 g−1 · min−1, TBI versus control, P = 0.0001). Additionally, within the TBI group there was a wider range of flows in the injured cortex compared with the contralateral control (IQR75–25: 186 versus 146 mL · 100 g−1 · min−1, TBI versus control, P = 0.0001). Finally, within the TBI group the uninjured right cortex had a wider range of flows compared with the right cortex in the control group (IQR75–25: 146 versus 92 mL · 100 g−1 · min−1, TBI versus control). The box plots, therefore, show the marked heterogeneity of CBF in both the injured and contralateral parietal cortex at 24 hours after TBI.
Hypocarbia reduced the interquartile range in the TBI group but not in the control group. In the left cortex, for example, the IQR75-25 was reduced by hypocarbia from 186 to 101 mL · 100 g−1 · min−1, within the TBI group, whereas the IQR75-25 changed from 85 to 84 mL · 100 g−1. min−1, in the control group. This further suggests that while there is marked heterogeneity of CBF 24 hours after CCI in the rat, hypocarbia resulted in an homogenization of flows.
DISCUSSION
Cerebral blood flow
A wide range of values have been reported for normal CBF in the rat. Hemispheric CBF ranged from 196 to 256 mL · 100 g−1 · min−1 in rats anesthetized with 70% N2O in O2, measured using microspheres or radioactive Xe (Gjedde et al., 1977). Parietal cortex CBF measured using 14C-iodoantipyrine autoradiography was between 140 and 220 mL · 100 g−1 · min−1 in rats anesthetized with 70% N2O in O2 and immobilized with tubocurare (Siesjo et al., 1983). Neocortical CBF was 214 mL · 100 g−1 · min−1 measured by autoradiography in rats anesthetized with a combination of 70% N2O and isoflurane (Hansen et al., 1989). We recently reported that parietal cortex CBF was 185 mL · 100 g−1 · min−1 in rats anesthetized with 70% N2O and 1% isoflurane. The value of 260 mL · 100 g−1 · min−1 for parietal cortex CBF determined by perfusion MRI in this study is similar to or somewhat greater than previously cited for CBF in rat cortex measured using similar regimens and standard techniques. Cerebral blood flow measured by the perfusion MRI technique was significantly correlated with CBF measured with microspheres over a wide range of flow (40 to 350 mL · 100 g−1 · min−1; Walsh et al., 1994), and studies in isolated perfused rat heart showed excellent correlation between myocardial flow measured by flowmeter and by perfusion MRI (Williams et al., 1993).
Numerous technical factors could have contributed to the discrepancies between CBF measured by perfusion MRI and literature values using other techniques. First, a spatially constant value for T1obs based on data previously generated from T1obs maps in normal brain was used to calculate CBF in this study. Within the contusion, T1obs is expected to increase because of edema. By using a spatially constant value for T1obs CBF within the contusion is likely to have been overestimated in this model. In a preliminary assessment in one additional rat a T1obs map was generated from a saturation recovery experiment with 8 time points. The T1obs value was 1.59 ± 0.13 seconds in the contusion core at 24 hours after injury. This was in agreement with the value for T1obs of 1.6 seconds used in this study. However, T1obs within a rim at the perimeter of the contusion (presumably edematous) was 2.45 ± 0.33 seconds. This heterogeneity of T1obs may have resulted in overestimation of CBF when the value of 1.6 seconds was applied to the contusion rim. The determination of regional maps of T1obs for each image would have allowed more accurate derivation of CBF throughout the contusion, but would have prolonged image acquisition times.
Second, while adiabatic fast passage labels spins within a range of flow velocities in the carotid arteries (Williams et al., 1992; Zhang et al., 1992; Zhang et al., 1993), deviation from this range will result in a reduction in the degree of labeling relative to the value measured in normal rats.
In accordance with our prior standards, pixels with a negative value were reassigned a value of zero mL · 100 g−1 · min−1. The mean percent of pixels with negative or zero values in the left cortex of the control rats was < 0.5%. In the TBI group the value was 5.9% and increased to 11.9% with hyperventilation (P = 0.11, before hyperventilation versus after hyperventilation). The reassignment may have contributed to a systematic error in CBF, particularly in the TBI group. In future applications, negative values will not be reassigned.
Finally, a spatially constant value of λ was assumed. It is possible that λ may also be spatially variable as it may increase in areas of edema (Herscovitch and Raichle, 1985). The likelihood of validating this possibility and quantifying it's impact on error contribution is currently not feasible. It is also possible other subtle factors could influence CBF such as the marked auditory stimuli from the magnetic field gradients or the effects of serial anesthesia and surgery used in sham and TBI groups. The impact of the latter factors has not been investigated.
Other investigators have begun to apply this noninvasive perfusion MRI technique to assess CBF in injured brain, notably in studies of focal cerebral ischemia. Recently, Jiang et al., (1994) successfully used perfusion MRI to serially assess relative CBF in the caudate in rats subjected to middle cerebral artery occlusion. In a recent preliminary report, Heiland et al., (1995) suggested a high degree of correlation between CBF measured by contrast-enhanced perfusion MRI and autoradiography in a rat model of focal ischemia. Finally, although there may be limitations and additional methodologic issues to address with this novel technique, the potential value of generating serial, noninvasive maps of regional CBF in small animals such as rodents is considerable.
Effect of traumatic brain injury on cerebral blood flow
In this study, hypoperfusion in the injured cortex, particularly in the core of the contusion, at 24 hours after CCI was similar to that observed by others (Hovda et al., 1993) at 24 hours after a CCI of less severity (2-mm deformation depth) and after a CCI of greater severityI (Kochanek et al., 1995). In our study, defining a contusion-enriched ROI facilitated the detection of cortical hypoperfusion produced by CCI.
In the injured cortex at 24 hours after trauma, foci of increased CBF were not visually apparent in this model, in contrast with that produced by the modified Feeney weight-drop model (Biagas et al., 1996). However, analysis of the CBF distributions revealed that in the injured parietal cortex, CBF was more heterogeneous than in control rats. Based on the size of the upper and lower quartiles, this heterogeneity was apparent in both low and high flows. The IQR75-25 was 2.2 times wider in the injured cortex than in the normal cortex. In the contralateral parietal cortex at 24 hours after TBI, CBF was again more heterogeneous than normal (IQR75-25 1.6 times wider), and the upper quartile was well above the range of flows seen in the normal parietal cortex, confirming the existence of regions with both increased and decreased flow.
Using the contusion-enriched ROI, we were able to show a modest reduction in CBF (19%) beneath the craniotomy site in shams at 24 hours after TBI. Effects of craniotomy alone on numerous parameters have been reported (Meany et al., 1994). This may reflect vascular disruption in the meningeal and pial vessels or mild surgical trauma to the cortex itself. The cerebrovascular physiology in our sham rats was altered by craniotomy and identifies them as distinct from controls.
CO2 reactivity
The 3.0% change in CBF in parietal cortex per millimeters of mercury change in PaCO2 we observed in control rats is consistent with the value of 3.7% reported by Wang et al., (1992) in rats studied using serial intracarotid 133Xe CBF determinations. Hypocarbia reduced CBF in all three groups studied within the left and right cortical ROI. In contrast, during hyperventilation, CBF in the contusion-enriched ROI was significantly reduced only in the control rats, suggesting that CO2 reactivity was attenuated in the contusion and beneath the craniotomy. In the left contusion-enriched ROI, CO2 reactivity was 55% less in the TBI compared with the control group. These reductions were not statistically significant, but power was limited by the small number of rats tested. Finally, in rats subjected to TBI, the distributions of CBF in the injured and contralateral parietal cortex were wider than in the control parietal cortex. Although hyperventilation appeared to shift the mean but not the range of flow distributions in control rats, it noticeably reduced the range of flow distribution in the injured and contralateral cortex in rats after TBI, producing distributions with similar IQR75-25 as those observed in control rats. This indicates that hyperventilation produces a homogenization of CBF after CCI in the rat, a finding similar to that frequently described during hyperventilation in humans with head injury (Bouma et al., 1991; Enevoldsen et al., 1976).
CONCLUSION
Perfusion MR1 by arterial spin labeling can be successfully used to measure CBF after cortical contusion in anesthetized and paralyzed rats. The noninvasive nature of this technique facilitated the generation of serial perfusion maps that showed the marked heterogeneity of CBF 24 hours after injury, allowed for the assessment of the reactivity of the cerebral circulation to changes in PaCO2, and the generation of maps of CO2 reactivity. To our knowledge, these are the first serial maps of CBF produced before and during hyperventilation in either control or injured rat brain. The application of perfusion MRI warrants further investigation.
Footnotes
Abbreviations used
Acknowledgements
The authors thank Drs. Robert S.B. Clark, C. Edward Dixon, and Edwin Nemoto for their critical review of this manuscript, Lisa Cohn for her editorial expertise; and Maryann Butowicz for her technical assistance that facilitated image acquisition.