
Abstract
Much attention has been paid to the effects of mild traumatic brain injury (mTBI) on cerebrovascular reactivity in adult populations, yet it remains understudied in pediatric injury. In this study, 30 adolescents (12–18 years old) with pediatric mTBI (pmTBI) and 35 age- and sex-matched healthy controls (HC) underwent clinical and neuroimaging assessments during sub-acute (6.9 ± 2.2 days) and early chronic (120.4 ± 11.7 days) phases of injury. Relative to controls, pmTBI reported greater initial post-concussion symptoms, headache, pain, and anxiety, resolving by four months post-injury. Patients reported increased sleep issues and exhibited deficits in processing speed and attention across both visits. In grey-white matter interface areas throughout the brain, pmTBI displayed increased maximal fit/amplitude of a time-shifted end-tidal CO2 regressor to blood oxygen-level dependent response relative to HC, as well as increased latency to maximal fit. The alterations persisted through the early chronic phase of injury, with maximal fit being associated with complaints of ongoing sleep disturbances during post hoc analyses but not cognitive measures of processing speed or attention. Collectively, these findings suggest that deficits in the speed and degree of cerebrovascular reactivity may persist longer than current conceptualizations about clinical recovery within 30 days.
Keywords
Introduction
In recent years, induction of hypercapnia (i.e., increased CO2 dissolved in the blood) as a means to measure cerebrovascular reactivity (CVR) during blood-oxygen-level dependent (BOLD) imaging has gained increased traction as a promising biomarker for identifying deficits following mild traumatic brain injury in adults (mTBI). 1 However, no studies have examined BOLD CVR abnormalities during the acute or sub-acute phase (i.e., less than four months post-injury) in pediatric mTBI (pmTBI) samples. 2 Considering the potential detrimental effects of pmTBI on the developing brain, 3 this represents a critical gap in current knowledge. Moreover, longitudinal studies are needed to examine how injury affects CVR trajectory during neurodevelopment,4–6 in particular in terms of cerebrovascular dilation 7 or neuronal pruning. 8
CVR contributes a unique perspective of cerebral vascular functioning. In contrast to transcranial Doppler ultrasound, which generates a single measure of blood flow through the middle cerebral artery, and arterial spin labeling (ASL), which measures static cerebral blood flow (CBF), CVR measures changes in the hemodynamic response in the presence of vasodilatory agents such as acetazolamide or CO2. Results suggest decreased static CBF in chronic pmTBI, with both hypo- and hyperperfusion reported sub-acutely (see Table 1 from Stephens et al. 9 ). In both the early 9 and late 10 stages of pmTBI, there are indications that increased CBF is associated with persistent symptoms, but not impaired cognitive functioning. 11 Furthermore, it is important to note that several recent publications12–14 report no global CBF differences in mixed adult and young adult mTBI cohorts during the sub-acute phase in conjunction with increased CVR. Collectively, these findings suggest that BOLD CVR is either more sensitive than ASL, exhibits a prolonged time course to recovery, or is capturing different physiological consequences following mTBI.
Clinical and neuropsychological data.
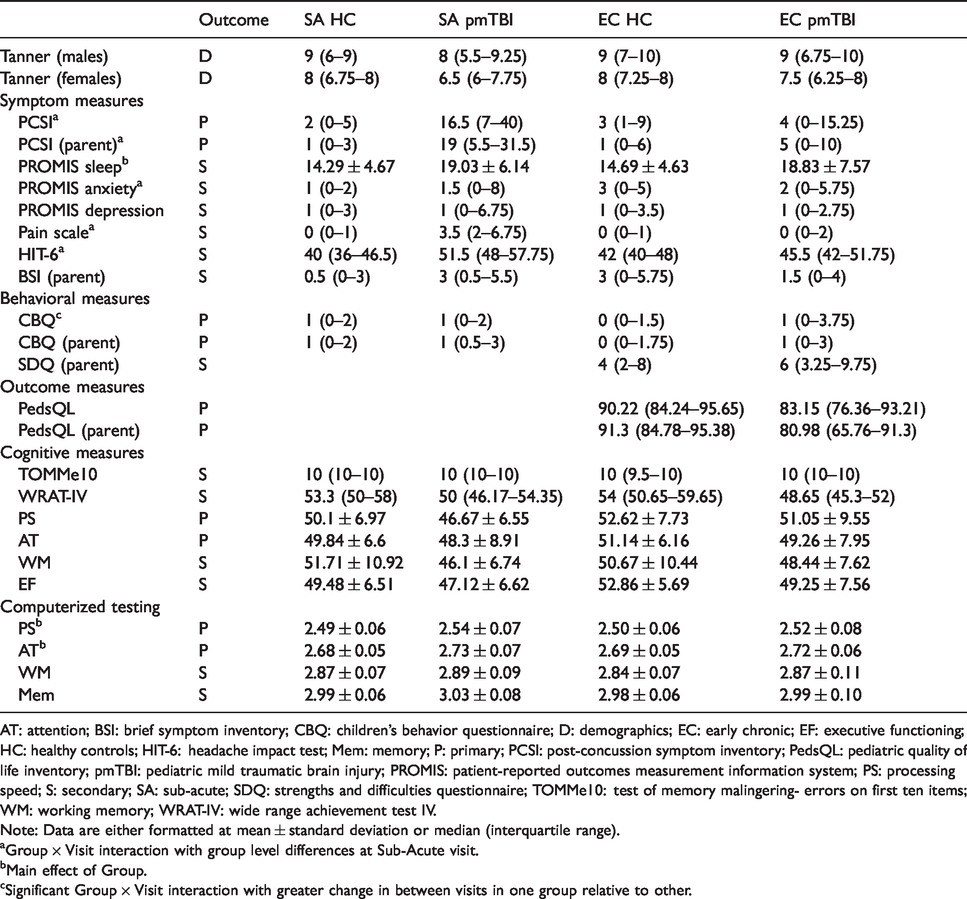
AT: attention; BSI: brief symptom inventory; CBQ: children’s behavior questionnaire; D: demographics; EC: early chronic; EF: executive functioning; HC: healthy controls; HIT-6: headache impact test; Mem: memory; P: primary; PCSI: post-concussion symptom inventory; PedsQL: pediatric quality of life inventory; pmTBI: pediatric mild traumatic brain injury; PROMIS: patient-reported outcomes measurement information system; PS: processing speed; S: secondary; SA: sub-acute; SDQ: strengths and difficulties questionnaire; TOMMe10: test of memory malingering- errors on first ten items; WM: working memory; WRAT-IV: wide range achievement test IV.
Note: Data are either formatted at mean ± standard deviation or median (interquartile range).
aGroup × Visit interaction with group level differences at Sub-Acute visit.
bMain effect of Group.
cSignificant Group × Visit interaction with greater change in between visits in one group relative to other.
Although providing critical insight into putative mTBI pathologies, several CVR studies have utilized heterogeneous age groups (i.e., some older patients in sample), a wide range of days post-injury, focused only on persistent symptoms, or have had relatively small sample sizes.13–15 In general, these results indicated group and individual level increases in CVR related to levels of post-concussion symptoms. Svaldi et al. 16 notably studied BOLD CVR changes in high school athletes as a function of sub-concussive head blows, showing persistent decreases in fronto-temporal areas of the brain. However, they specifically excluded participants sustaining a concussion during the course of the study.
Based on previous findings in mixed-age populations,12–14 we hypothesized increased amplitude of cerebrovascular reactivity (change in BOLD response per unit change in end-tidal CO2), increased maximal cerebrovascular fit (highest correlation between BOLD CVR data and a time-shifted end-tidal CO2 vector), and increased latency to maximal fit (amount of time-shift in vector) in pmTBI relative to healthy controls (HC) sub-acutely, with differences in all metrics resolving at four months post-injury. We predicted that these CVR alterations would manifest in areas prone to shear strain during injury such as grey-white interfaces.16,17 Based on recent data,12–14 we further hypothesized that regions demonstrating significant CVR deficits would not be associated with significant differences in static CBF as measured by ASL. Finally, we predicted that sub-acute CVR alterations would be sensitive and specific for diagnostic status (pmTBI vs. HC) and associated with prolonged symptom report and post-injury deficits on primary cognitive measures at four months post-injury.
Methods
Participants
CVR data collection was attempted on 38 adolescents (12–18 years old) recently diagnosed with pmTBI who were consecutively recruited from local Emergency Room and Urgent Care settings in this prospective cohort design. Inclusion criteria for pmTBI included presentation at the emergency room or urgent care with a closed head injury with Glasgow Coma Scale ≥ 13, loss of consciousness < 30 min (if present), post-traumatic amnesia < 24 h (if present), and an alteration in mental status or two or more emerging symptoms following injury. These criteria represent a combination of recommendations from the American Congress of Rehabilitation Medicine (upper injury bound) 18 and Zurich Concussion in Sport Group (lower injury bound). 19 In addition, 48 statistically matched (age and sex) HC were recruited from the local community.
Data for 8 pmTBI and 13 HC were lost secondary to CO2 data acquisition issues or quality assurance issues (described under Physiological Modelling and Analysis). None of the remaining participants were identified as motion outliers (more than three times the interquartile range on mean framewise displacement relative to group). The final cohort therefore included 30 pmTBI (20 males; mean age = 15.6 ± 2.2 years) and 35 HC (21 males; mean age = 15.5 ± 1.9 years). The pmTBI were first scanned during the sub-acute phase of their injury (6.9 ± 2.2 days) and again approximately four months from their first scan date (120.4 ± 11.7 days). HC were scanned at equivalent time points (119.8 ± 12.2 days between scans) to control for effects stemming from neurodevelopment and repeat assessment. An additional four HC and three pmTBI were excluded from ASL perfusion analysis as motion outliers. Supplemental Materials and Supplemental Table 1 detail full recruitment, exclusions, sample size, and demographic information for each analysis.
Exclusion criteria consisted of (1) a history of (a) neurological diagnosis, (b) previous moderate or severe TBI [greater than 30 min loss of consciousness], (c) developmental disorder [autism spectrum disorder or intellectual disability], (d) any psychiatric disorder other than adjustment disorder or (e) substance abuse/dependence, (2) contraindications for magnetic resonance imaging (MRI), including pregnancy, or (3) child or guardian non-fluency in English. In addition to the above, HC were excluded for a diagnosis of attention deficit hyperactivity disorder or learning disability. Urine-based drug screens were conducted for all participants at both visits, with any positive results exclusionary in the current sample.
All procedures followed were in accordance with the ethical standards of the responsible committee on human experimentation (institutional and national) and with the Helsinki Declaration of 1975, and the applicable revisions at the time of the investigation. This study was approved by the University of New Mexico Health Sciences Center Human Research Review Committee. All participants provided written informed assent or consent according to institutional guidelines at the University of New Mexico School of Medicine.
Clinical and neurosensory assessments
A common data element focused battery of clinical and neuropsychological measures was administered (see Supplemental Materials and Table 1 for full list and citation of a priori primary versus secondary measures). Retrospective (i.e., estimation for one month ago) clinical symptom ratings (Supplemental Table 2) were acquired for a subset of measures upon first visit for all participants. Raw scores for pen-and-paper neuropsychological measures were age-corrected and aggregated into composites for the domains of attention, processing speed, working memory and executive function, whereas computerized neuropsychological test reaction times were log transformed.
Task description
All participants completed a hypercapnia challenge modified from Lu et al. 20 while undergoing BOLD-based imaging (Figure 1(a); see Supplemental Materials). Following 15 s of room air, staff in the MR scanner environment were cued to toggle a gas intake valve between room air (inhalation duration 30 ± 5 s) and medical grade gas mixture (5% CO2, 21% O2, BAL N2; duration 35 s) over four on-off cycles (square wave in Figure 1(c)). A MP150 system (BIOPAC Systems, Inc., Goleta, CA) logged image acquisition times and measured exhaled CO2 data (1000 Hz sampling frequency), which were monitored in real-time for quality assurance purposes. Participants breathed both gas mixtures through a non-rebreathing valve.
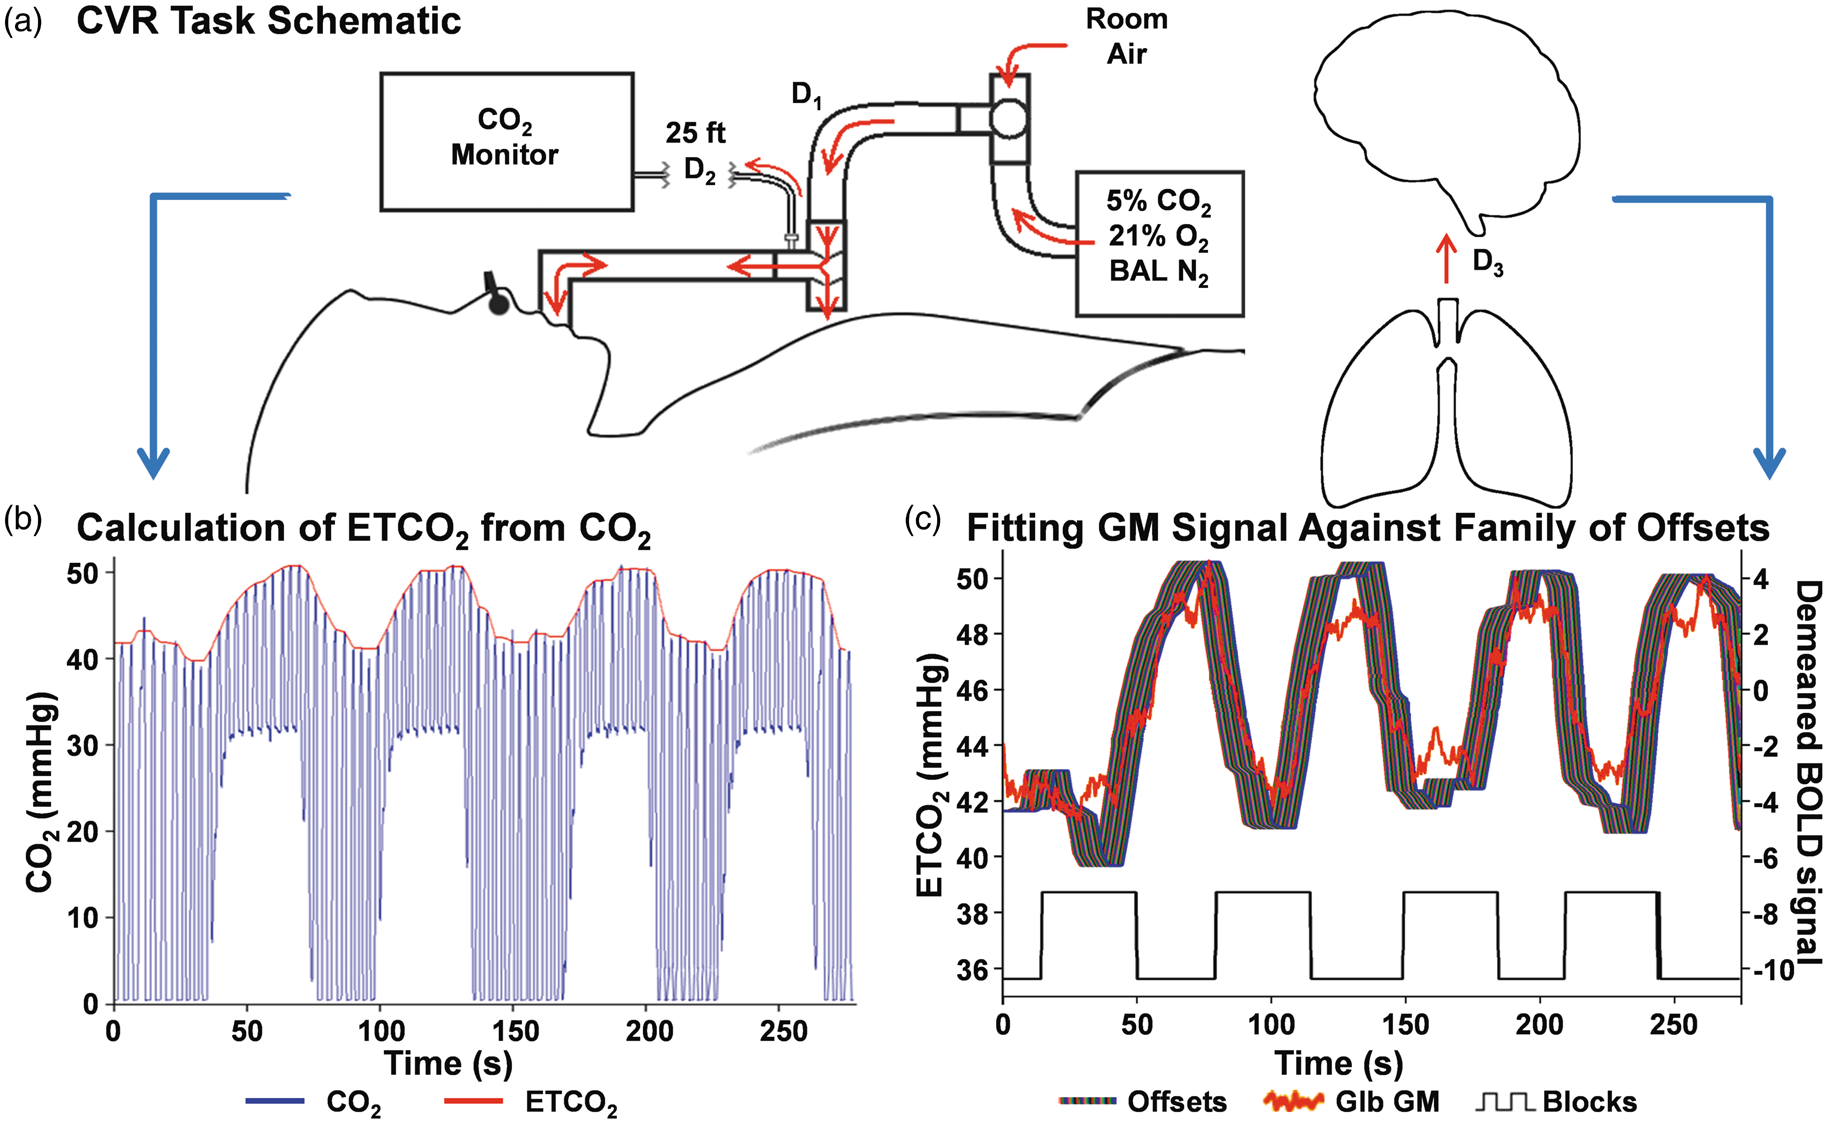
Panel (a) illustrates the equipment setup and airflow (red arrows) for the cerebrovascular reactivity (CVR) task. Briefly, participants breathe either room air of a medical gas mixture through a snorkel-like device connected to a non-rebreathing T-valve. Initial transit of air from the sources to the T-valve has a variable delay (D1) between participants due to differences in depth and speed of breathing. It is unnecessary to model for D1 because a change in air source does not represent an immediate change in composition of gas participants are inhaling. Gas is sampled at the T-valve and drawn outside the MR environment to a CO2 monitor (D2; known mechanical delay of 7.36 s). Panel (b) provides example data acquired from a healthy control in MATLAB following D2 (raw CO2 data = blue line; calculated end-tidal CO2 regressor [ETCO2] = red line). A final physiological delay (Panel (c); D3) between the lungs and brain is accounted for by fitting a family of offsets of the ETCO2 regressor (left y-axis; ribbon of colors; additional offset of 0.46–11.04 s) against global grey matter unitless raw EPI BOLD signal (Glb GM; right y-axis; red trace, demeaned here to better overlay on ETCO2 offsets) as a quality metric and on a voxel-wise basis for analyses. Pseudorandom, unscaled experimental block timing (black square wave; up: medical gas mixture, down: room air; y-axis scale does not apply) is presented below the physiological data in Panel (c).
Imaging and processing
MRI data were acquired on a 3 T Siemens Trim Trio scanner with a 32-channel head coil. High resolution T1-weighted (1 × 1 × 1 mm), T2-weighted (1.1 × 1.1 × 1.5 mm), susceptibility-weighted images (1.00 × 1.00 × 1.50 mm), and fluid-attenuated inversion recovery images (0.80 × 0.80 × 3.00 mm) were collected and reviewed by a blinded, board-certified radiologist. Hypercapnia challenge images were collected using a single-shot, gradient-echo echoplanar pulse sequence [TR = 460 ms; TE = 29 ms; flip angle = 44°; multiband acceleration factor = 8; number of excitations = 1; slice thickness = 3 mm; FOV = 248 mm; matrix size = 82 × 82; 56 interleaved slices; 3.02 × 3.02 × 3.00 mm voxels]. In addition, a single band reference image was acquired to improve grey-white matter contrast and facilitate registration with the T1 image. Two spin-echo field mapping sequences (3.02 × 3.02 × 3.00 mm) with reversed phase encoding directions (A → P; P → A) were generated to correct for susceptibility-related distortion (see Supplemental Materials for full details).
Multi-slice 2D pseudo-continuous arterial spin labeling (pCASL; 45 tagged/untagged images) and pseudo-proton density (PD) sequences were acquired with 20 interleaved slices for whole brain coverage (3.44 × 3.44 × 6.00 mm). The post-labeling delay (1800 ms) and labelling duration (1665 ms) were determined both on recommended values for adolescents 21 and predictions of trauma-related hypoperfusion.22,23 Clinical and imaging data will be available in FITBIR following the conclusion of the study.24
Physiological modelling and analysis
CO2 data were initially processed in MATLAB (detailed in Figure 2; Mathworks, Inc., Natick, MA; version R2014) using a 125 ms rolling maximum filter followed by post-collection recalibration based on solving a two-point linear equation to adjust for expected ambient and gas mixture levels. The majority of end-tidal CO2 (ETCO2) peaks were identified algorithmically, 25 with manual adjustments necessary in 15.7% of the data (see Supplemental Materials). An ETCO2 vector was then produced using a spline function, which was subsequently smoothed with a median filter (10-s window) and resampled to match image acquisition (Figure 1(b)). Based on previous methods, 26 this ETCO2 regressor was fit against global grey matter signal (subject-specific segmentation of T1-weighted image) using a family of offsets (7.82 to 18.4 s post-image collection) to account for individual differences in physiology (D3 in Figure 1(a); gas exchange in lungs, blood to brain time, etc.) and the transit time of exhaled breath in the CO2 sampling tube (D2 in Figure 1(a); estimated to be 7.36 s; Figure 1(c)). Participants with a correlation of less than 0.7 for their maximal global grey matter fit (two pmTBI; two HC) were excluded from further analyses as lower correlations generally indicated a mechanical failure during collection.
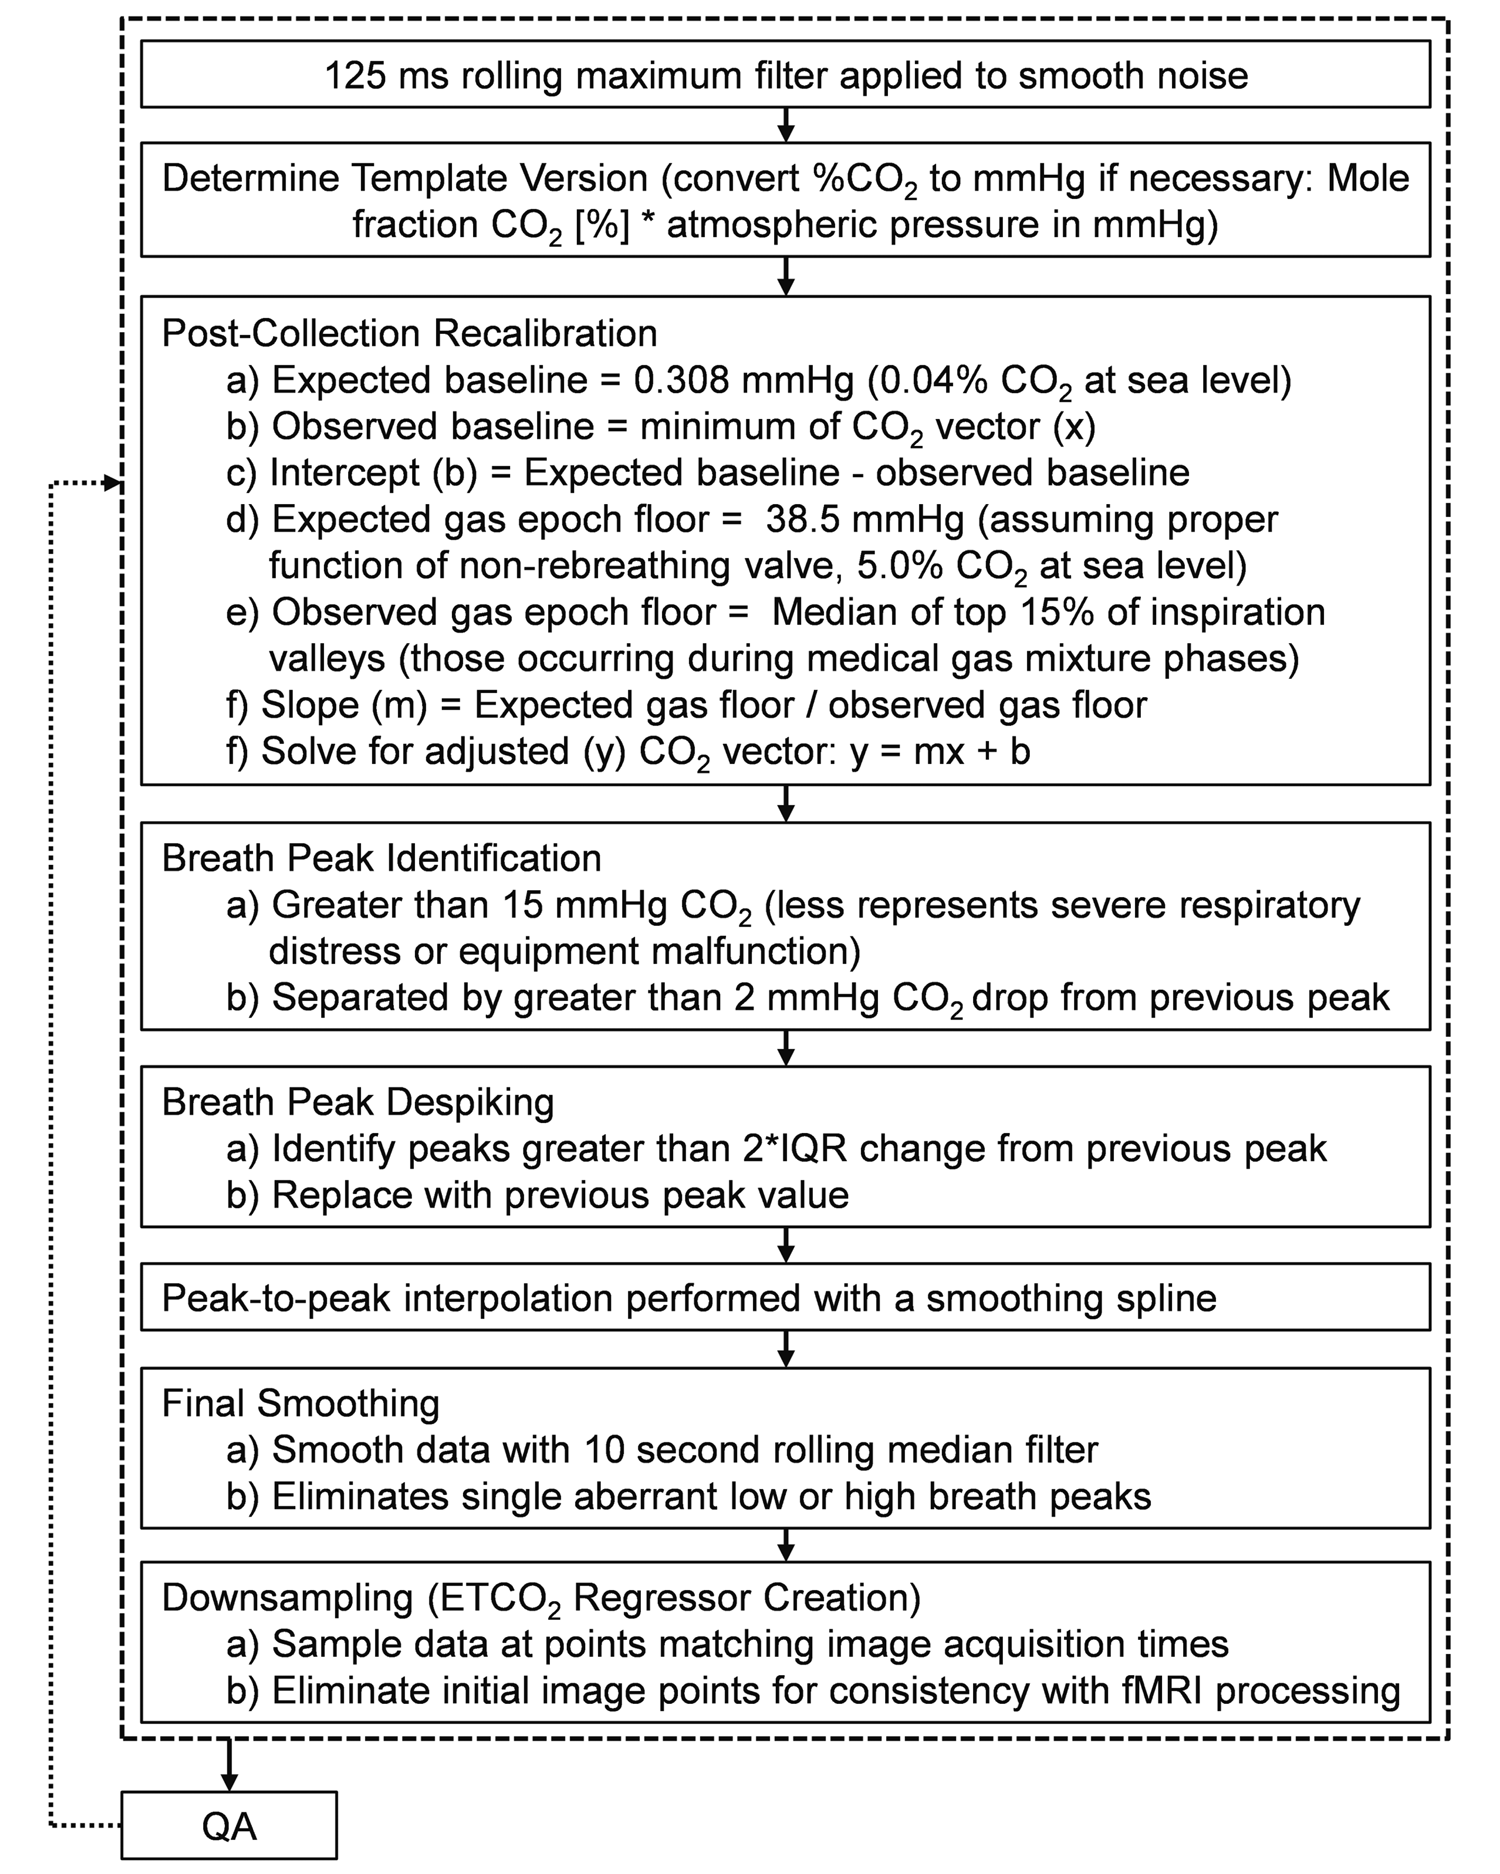
This figure illustrates the MATLAB processing pipeline for converting the raw CO2 data collected with BIOPAC into the end-tidal CO2 (ETCO2) regressor used in creating individual functional imaging maps. While expected mmHg CO2 values in this figure are given at sea level for clarity, it should be noted that data were collected at a high altitude (Albuquerque, NM) and expected values were adjusted accordingly. If visual quality assessment (QA) failed, values from post-collection recalibration through peak despiking could be adjusted manually to ensure correspondence to expectations. IQR: inter-quartile range. Example output is in Figure 1(b).
Additionally, respiratory rates for room air and medical gas experimental segments were determined algorithmically using average peak-to-peak times from the CO2 data (see Supplemental Materials).
MR processing and analysis
The first three images of the run were eliminated to account for T1 equilibrium effects, resulting in a total of 598 images for final analyses. Anomalous BOLD time-series data were first identified and replaced based on values from the previous and subsequent image using AFNI’s despiking protocol. 27 All data were then temporally interpolated to account for differences in slice acquisition and spatially registered in two- and three-dimensional space to the reference image to reduce the effects of head motion using AFNI tools. Susceptibility-induced field distortions were estimated and corrected using FSL Topup.28,29 Data were converted to standard stereotaxic coordinate space 30 using a non-linear algorithm (AFNI 3dQwarp), spatially blurred using a 6-mm Gaussian full-width half-maximum filter and detrended using a second-order polynomial function.
AFNI’s 3dfim+ was used to perform a whole-brain correlation analysis. Functional imaging maps were calculated using a family of time-lags of each participant’s ETCO2 regressor, with the module returning the highest Pearson correlation coefficient between any single time-lagged ETCO2 regressor and each voxel’s fMRI timeseries, as well as returning the associated latency index to this maximal fit.31,32 Importantly, no lower limit on fit (e.g. < 0.7) was imposed at the voxel-wise level as was done for global grey matter signal during quality assurance. Maximal fit Pearson correlation coefficient maps were transformed to Fisher’s Z scores and the index of maximal fit was converted to real time (7.36 s + index×0.46 s) for latency maps. Due to the extended block design, motion parameters were not included in the model. 33 Fisher’s Z score maps of maximal fit were analyzed due to their explicit ties to the index of maximal fit used in latency analysis. Voxel-wise CVR amplitude maps (%BOLD/mmHg) were also computed according to the published methods. 20
pCASL images were despiked and registered to the pseudo-PD image using two- and three-dimension motion correction algorithms from the AFNI suite. Both images were then spatially blurred using a 6-mm Gaussian kernel. Each pre-processed labeled image was next subtracted from the paired control image, after which CBF was quantified using in-house software based on established parameters [blood/tissue water partition coefficient = 0.9 mL/g; longitudinal relaxation time of blood = 1664 ms; labeling efficiency = 0.85; label duration = 1665 ms] and algorithms. 34 T1 magnetization correction and scaling of CBF were accomplished on a voxel-wise basis with the PD image. The quantified CBF data were then averaged and spatially transformed to stereotaxic space in a manner identical to BOLD data.
Statistical analyses
Groups were first compared on demographic measures, retrospective measures (Supplemental Table 2), and framewise displacement using parametric (independent samples t-test) or nonparametric (χ2 or Mann–Whitney U) tests. 2 × 2 [Group (pmTBI vs. HC) × Visit (Sub-Acute vs. Early Chronic)] generalized estimating equations (GEE) or generalized linear models (single time point data; see Table 1) were used to compare clinical data, with retrospective ratings used as a covariate when available. Clinical data were modelled with negative binomial, gamma, or normal distributions as appropriate. Simple effects testing of significant interactions were conducted with generalized linear models. Multiple regression investigated relationships between primary clinical and imaging measures.
2 × 2 [Group (HC vs. pmTBI) × Time (Sub-Acute vs. Early Chronic)] voxel-wise repeated-measures ANOVAs were conducted on CVR data (amplitude, maximal fit, and latency to maximal fit). Results were corrected to achieve an expected cluster-wise false positive rate of 5% (p < 0.05) based on 10,000 Monte-Carlo simulations with individual voxels required to have p < 0.001. The minimum recommended cluster size correction from these simulations was 657 µl. 35 The main effects of Time, included in Supplemental Materials for completeness, were considered to be of minimal interest. For any significant CVR results, CBF data were used to evaluate for similarities in vascular mechanisms between hypoperfusion and either maximal fit or latency to maximal fit.
Results
Self-reported injury characteristics
Among pmTBI included in analyses, the primary mechanisms of injury 36 were motor vehicle crashes (10/30; 33.3%) and falls (8/30; 26.7%), with strikes by objects (3/30) or people (5/30) accounting for an additional quarter of injuries (26.7%). In addition, 18/30 (60.0%) of reported injuries were a result of sports or recreation-related activities. 37
Clinical and neuropsychological analyses
The pmTBI and HC groups did not differ in terms of handedness, age, Tanner stage of development, biological sex, previous history of head injury, or time between visits (all p’s > 0.05). Tests indicated greater symptoms for pmTBI than HC on retrospective ratings of sleep and self-reported behavior problems (p’s < 0.05; Supplemental Table 2). At initial visit, groups also differed on premorbid reading ability (p = 0.043). Groups were statistically similar on initial visit effort and on retrospective ratings of post-concussion symptoms (PCS; child and parent), anxiety, depression, pain, headache, parental reports of behavior, self and parental quality of life ratings (all p’s > 0.05), and parental self-reported psychopathology (p > 0.05).
The analysis for both self- (Wald-χ2 = 24.59; p < 0.001; Table 1) and parent- (Wald-χ2 = 17.85; p < 0.001) report of PCS indicated a significant Group×Time interaction. In both cases, simple effects testing demonstrated increased PCS (pmTBI > HC) at the sub-acute (p’s < 0.001) but not early chronic phase (p’s > 0.05). Similarly, secondary measures of anxiety, headaches, and pain (all p’s < 0.010; see Supplemental Materials) indicated significant group differences (pmTBI > HC) at sub-acute but not early chronic phases. In contrast, a main effect of Group was observed for sleep (p = 0.039), suggesting prolonged symptomatology up to four months post-injury. Depression did not differ between groups (p > 0.05).
The analysis for self-report ratings of child behavior demonstrated a significant Group×Time interaction (Wald-χ2 = 6.83; p = 0.009), with simple effects testing indicating a greater increase in behavioral issues from sub-acute to early chronic phase in pmTBI relative to HC (Wald-χ2 = 4.50; p = 0.034). The primary parental report of child behavior ratings exhibited no significant main effect or interaction (p’s > 0.05). A secondary parental measure of behavioral issues/family dynamics was also not significant (p > 0.05). Neither primary self- nor parent report of quality of life significantly differed across groups (p > 0.05).
Neither primary (attention and processing speed) nor secondary (working memory and executive function) domains of cognitive functioning were affected on pen and paper tests (p’s > 0.05). There was a significant main effect of Group for the computerized test of attention (Wald-χ2 = 10.72; p = 0.001) and processing speed (Wald-χ2 = 6.20; p = 0.013), with pmTBI exhibiting increased reaction times relative to HC across both sub-acute and early chronic phases. Effects from both secondary computerized measures were null (p’s > 0.05). See Supplemental Materials for effects related to time and accuracy on computerized measures.
Anatomical imaging and motion results
A total of 18 pmTBI received a CT scan as part of routine care, with 3/18 pmTBI diagnosed with a positive intracranial finding. No additional patients were identified as having trauma-related findings on structural MRI scans (Supplemental Table 3). There were no significant differences between pmTBI and HC on mean FD (all p’s > 0.05) for either imaging modality following outlier exclusion.
Physiological modelling
There were no group differences on hypercapnia task parameters at either visit (minimum ETCO2, average grey matter fit, recalibration scalar, respiratory rates; all p’s > 0.05). However, there was an effect of epoch on respiration rate present in both groups such that participants breathed less often, but presumably more deeply, during the medical gas epochs (p < 0.001).
Functional imaging
A main effect of Group [Group (HC vs. pmTBI) × Time (Sub-Acute vs. Early Chronic)] for voxel-wise fit data was present (Figure 3(a)) in the right anterior corona radiata (2267 µl); right temporal pole (660 µl; BA 38); right superior longitudinal fasciculus (1193 µl); right (1089 µl; BA 20) and left (2470 µl; BA 20) medial temporal lobe; right retrolenticular limb of the internal capsule (IC)/posterior thalamic radiation (pTR; 739 µl); right pTR (1058 µl); right thalamus/putamen/posterior limb of IC (1132 µl); and right lateral aspect of middle cerebellar peduncle (1287 µl). In all regions, maximal fit was greater in pmTBI than in HC (Figure 3(b)). There was no significant Group×Time interaction.
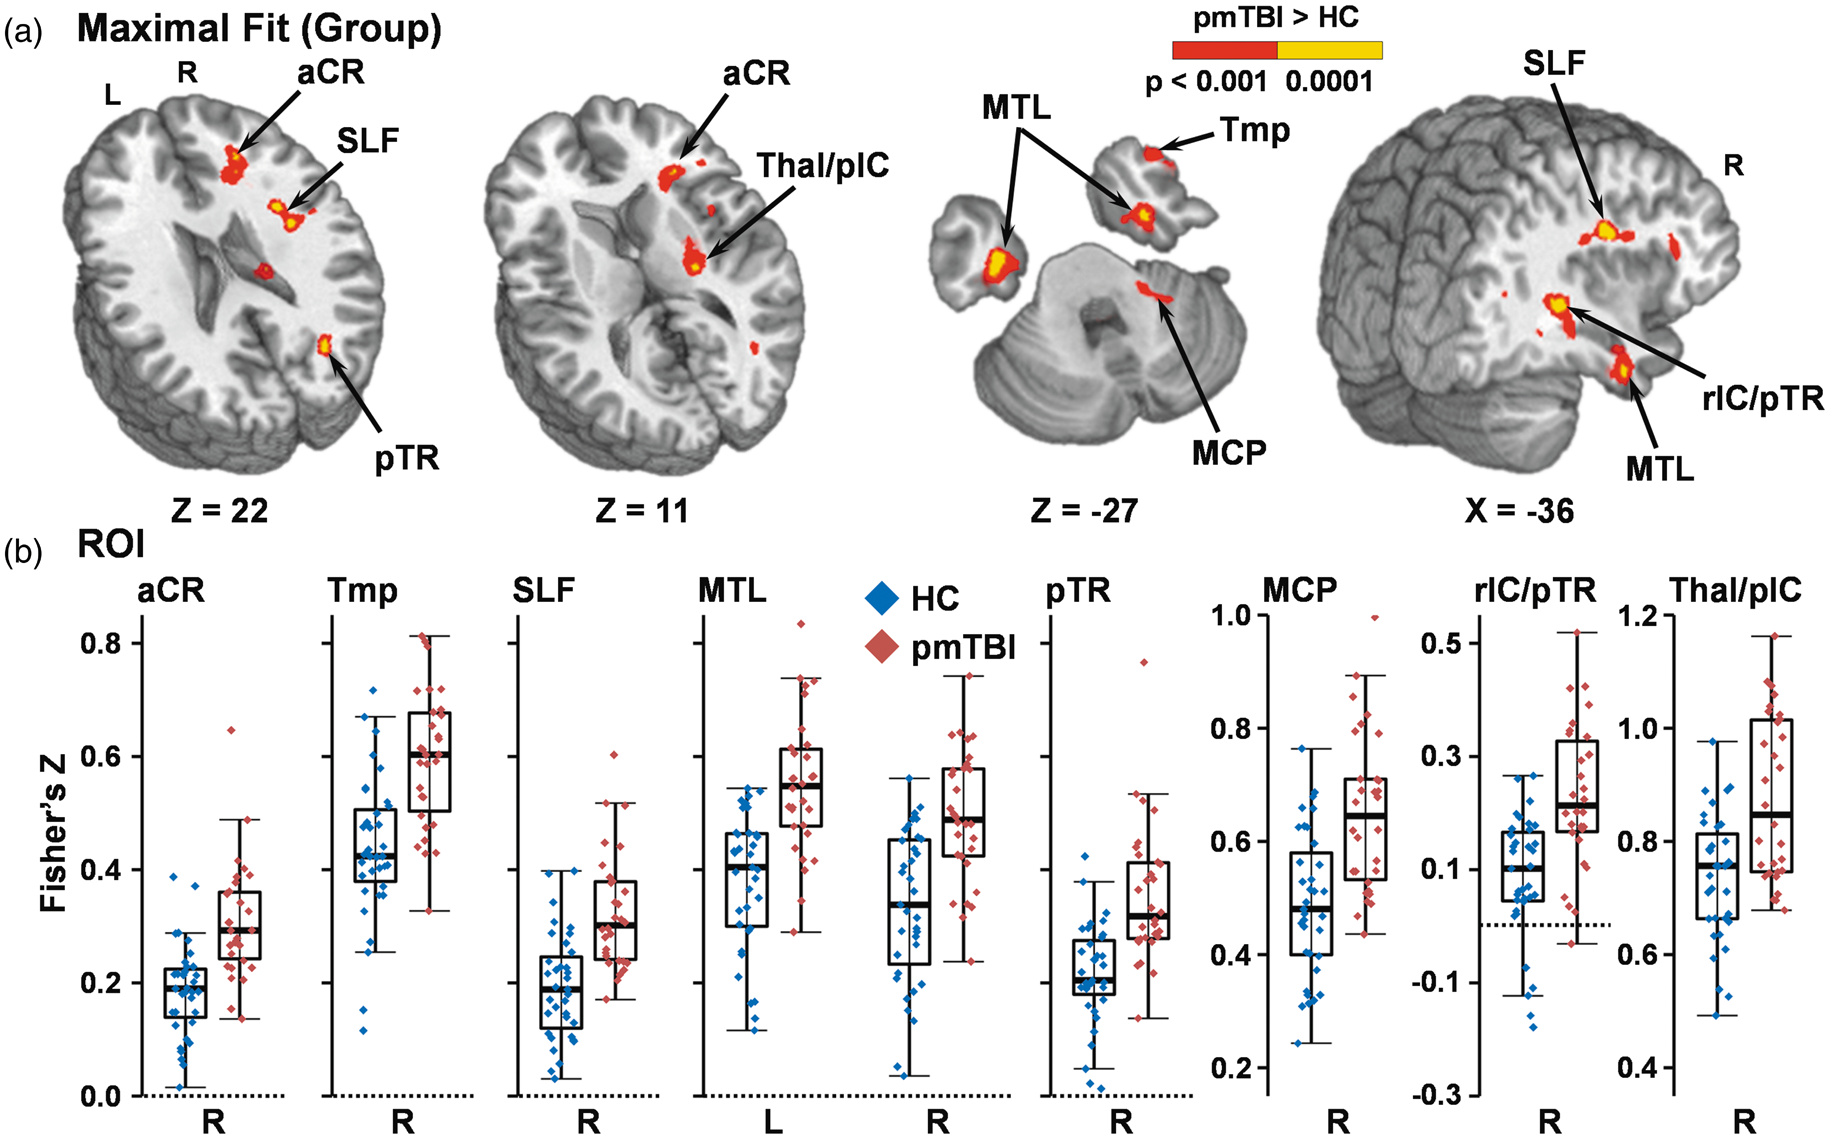
Panel (a) depicts a main effect of Group for increased maximal voxel-wise fit to the ETCO2 regressor matrix (red: p < 0.001; yellow: p < 0.0001) within the right (R) anterior corona radiata (aCR), R temporal pole (Tmp), R superior longitudinal fasciculus (SLF), R and left (L) medial temporal lobe (MTL), R posterior thalamic radiation (pTR), R middle cerebral peduncle (MCP), R retrolenticular limb of the internal capsule and posterior thalamic radiation (rIC/pTR), and R thalamus and posterior internal capsule (Thal/pIC) for pediatric mild traumatic brain injury patients (pmTBI) relative to healthy controls (HC) during the hypercapnia challenge. Coordinates for select axial (Z) and sagittal (X) slices are given according to the Talairach atlas. Panel (b) displays box and scatter plots of the Fisher’s Z for each region and group averaged across both visits (pmTBI: red; HC: blue).
A main effect of Group on CVR amplitude data was observed for the 2 × 2 [Group (HC vs. pmTBI) × Time (Sub-Acute vs. Early Chronic)] repeated-measures voxel-wise ANOVA that was present only in the right anterior corona radiata (664 µl) in the same location as for maximal fit analysis, with pmTBI exhibiting increased amplitude relative to HC. Overall, the unthresholded pattern of results between amplitude and fit analyses was similar (See Supplemental Figure 1), but only rose to the level of significance in the anterior corona radiata. The Group×Time interaction was null.
A main effect of Group on latency to maximal fit (Figure 4(a)) was also present, with pmTBI displaying an increased delay across all significant clusters, with most of the clusters centered in grey-white matter junctions. Affected areas included the left DLPFC and adjacent white matter (838 µl; BAs 9/46); right superior longitudinal fasciculus (1167 µl); the grey-white junction near both the right auditory cortex (939 µl; BA 41) and left temporoparietal junction (917 µl; BA 39); bilateral precuneus (2179 µl; BAs b. 7); right posterior thalamic radiation extending into the cuneus (1523 µl); left ventral visual stream (6372 µl; BAs l. 17–19); and left secondary visual cortex, brainstem and superior aspects of the cerebellum (2659 µl; BAs 18/19/30). In all regions, latency to maximal fit was longer in pmTBI than in HC (Figure 4(b)). There was no significant Group×Time interaction. All functional imaging findings remained significant (p’s < 0.001) when removing the three pmTBI with positive intracranial findings on CT or MRI (Supplemental Table 3).
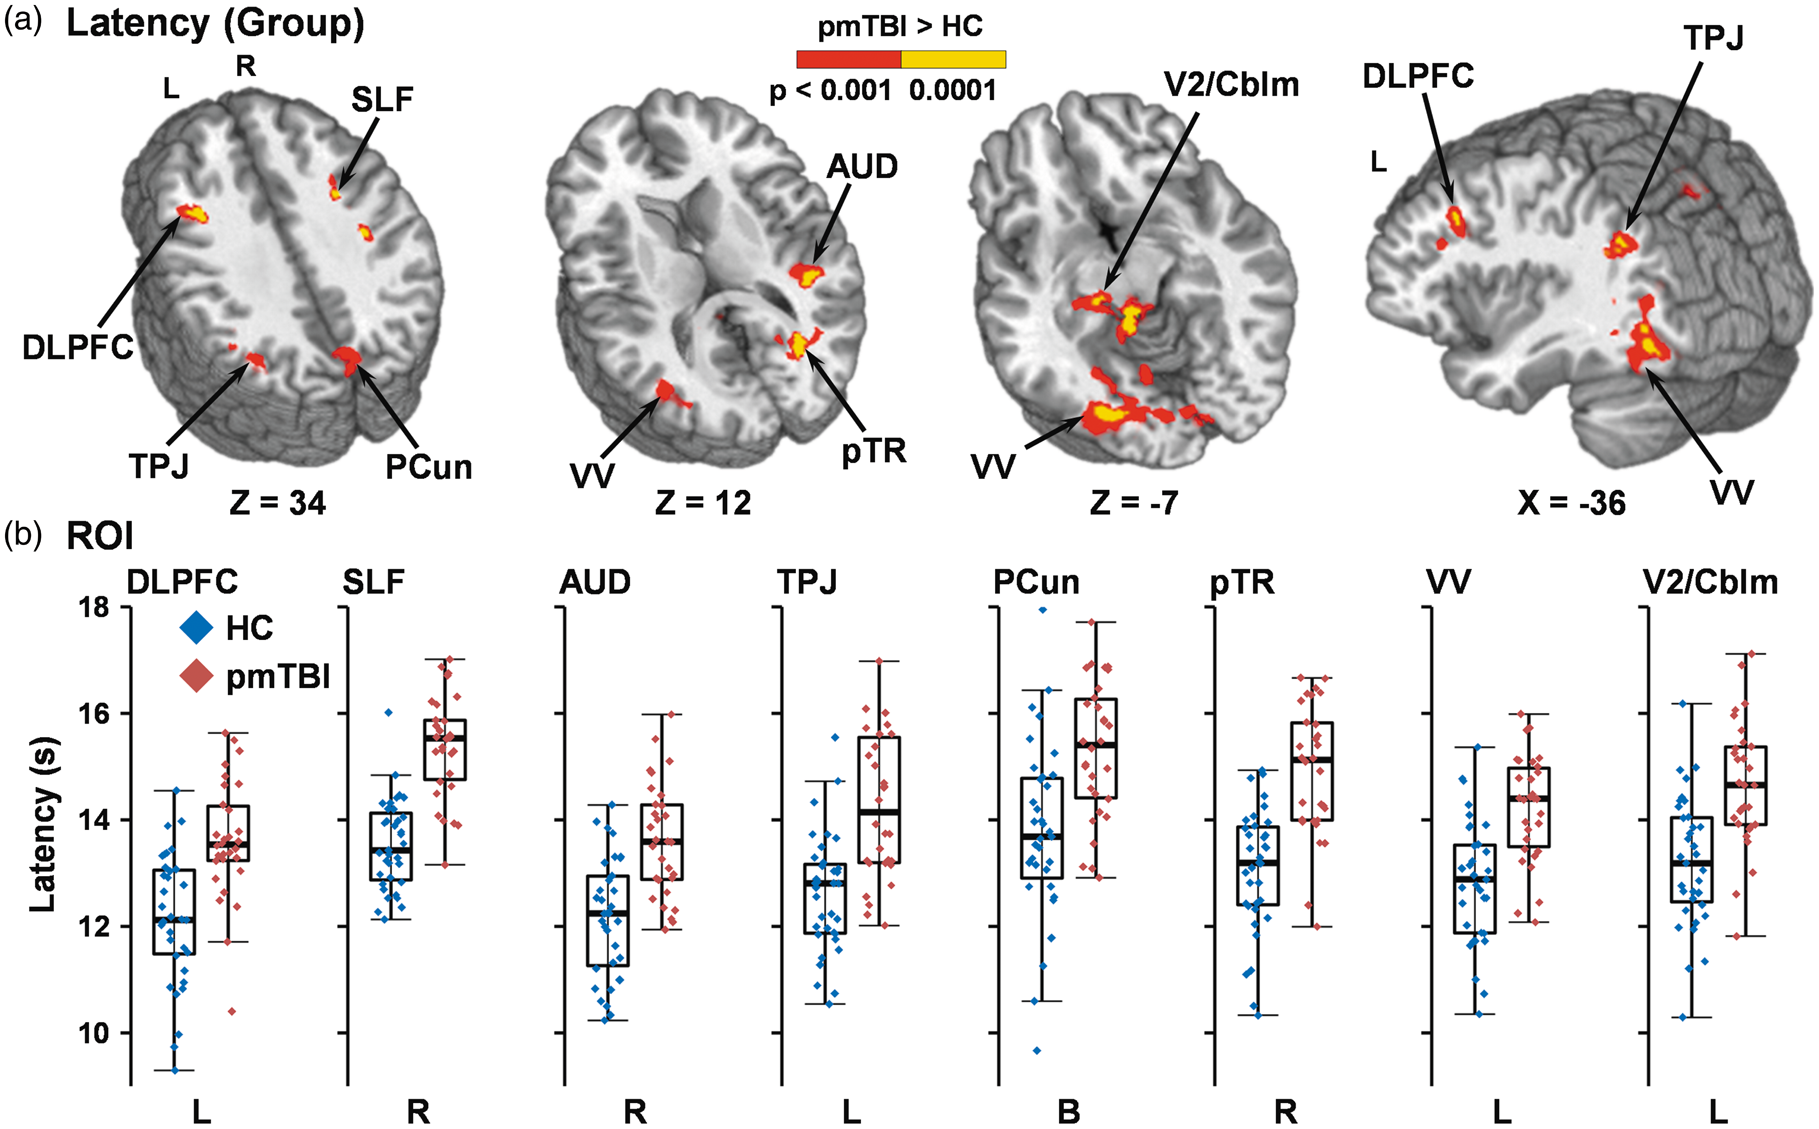
Panel (a) depicts a main effect of Group for increased latency to maximal voxel-wise fit in the ETCO2 regressor matrix (red: p < 0.001; yellow: p < 0.0001) within the left (L) dorsolateral prefrontal cortex (DLPFC), right (R) superior longitudinal fasciculus (SLF), R auditory cortex (AUD), L temporoparietal junction (TPJ), bilateral (B) precuneus (PCun), R posterior thalamic radiation (pTR), L ventral visual stream (VV), and L secondary visual cortex and superior aspects of the cerebellum (V2/Cblm) for pediatric mild traumatic brain injury patients (pmTBI) relative to healthy controls (HC) during the hypercapnia challenge. Coordinates for select axial (Z) and sagittal (X) slices are given according to the Talairach atlas. Panel (b) displays box and scatter plots of the latency in seconds for each region and group averaged across both visits (pmTBI: red; HC: blue).
CBF analyses
As a follow-up to significant CVR differences, perfusion data obtained during the pCASL scan were separately averaged across regions exhibiting either group differences in maximal fit or latency to maximal fit. Results from GEE analyses [Group (pmTBI vs. HC) × Visit (Sub-Acute vs. Early Chronic)] for both maximal fit and latency indicated that there were no significant main effects or interactions related to the group factor (all p’s > 0.10). The average CBF in regions exhibiting differences in maximal fit (HC: 31.9 ± 4.7 mL/min/kg; pmTBI: 31.9 ± 4.6 mL/min/kg) and latency to maximal fit (HC: 44.4 ± 7.2 mL/min/kg; pmTBI: 44.4 ± 6.7 mL/min/kg), nearly identical across groups, is reported here for completeness.
Relationship between cerebrovascular deficits and clinical outcomes
All brain areas exhibiting significant group differences for both maximal fit (thalamus, temporal pole, etc.; Figure 3) and latency to maximal fit (DLPFC, ventral visual stream, etc.; Figure 4) shared similar magnitude and direction of effect. When averaging across both study visits, only moderate correlation (r = 0.34) existed between means weighted across all significant areas by volume of activation for maximal fit and all significant areas for latency to maximal fit. Thus, weighted averages from both analyses were used in a binary logistic regression determining whether differences in maximal cerebrovascular fit or associated latency would classify pmTBI from HC. Results indicated that both weighted maximal fit (β = 45.77; Wald-χ2 = 8.01; p = 0.005; bounded at 1, OR not reported) and latency (β = 3.19; Wald-χ2 = 9.59; p = 0.002; OR = 24.40) improved model fit and classified patients (90.0%; 27/30) from HC (91.4%; 32/35) with a total accuracy of 90.8% (Δ = 37.0% relative to chance alone). Amplitude ROI proved less effective when used in place of fit at predicting membership of the pmTBI group (80.0%; 24/30), with inclusion of all three weighted ROI means in the model classifying only one additional HC correctly (total accuracy = 92.3%) relative to the latency/fit model.
Next, negative binomial (PCS, behavior) or Gamma (quality of life) regression models assessed relationships between the two aforementioned weighted means of cerebrovascular deficits and all primary outcomes at four months in pmTBI only. No model was significant when controlling for multiple comparisons. A post hoc model also examined the relationship with sleep given unpredicted persistence in symptomatology. Regression indicated a significant negative association between maximal cerebrovascular fit and clinical measures of sleep at the early chronic phase (i.e., as fit decreases, sleep issues increase; Wald = 7.03; p = 0.008), whereas cerebrovascular latency was not associated with sleep issues. Gamma regression models assessing relationships between cerebrovascular deficits and primary cognitive measures (computerized attention and processing speed) at four months were also negative when controlling for multiple comparisons.
Discussion
In recent years, increasing interest has been attached to CVR both as a potential biomarker for pmTBI2 and as a predictor of persistent post-concussive symptoms. 38 However, little evidence exists thus far on the effects of pmTBI on CVR during either the sub-acute or early chronic injury stages. Importantly, cerebral perfusion and vascular reactivity dynamically change as a function of neurodevelopment throughout adolescence, with both likely tied to decreased cerebrovascular reserve as a result of the lower blood pressure and commensurate increased vasodilation typically present in children.4,5 The current study, with its well-matched control cohort and prospective design, represents a step towards a more thorough understanding of CVR in a uniquely vulnerable population of pmTBI.
All participants were well-characterized using a common data element focused battery of clinical and neuropsychological measures. Patients reported increased PCS sub-acutely that was significantly reduced at four months post-injury, with similar findings observed for parental PCS measurements. Self-reported levels of anxiety, headaches, and pain also followed this pattern. In contrast, sleep disturbances, a common injury sequela in mTBI, 39 and deficits in processing speed and attention were elevated in pmTBI sub-acutely and at four months post-injury. These findings are consistent with previous reports in pmTBI by both our group 40 and others41,42 and represent a prolonged course of recovery for some symptoms not typically observed in adult populations. 43
As predicted based on adult and pediatric literature,12–14 current voxel-wise results indicated increased amplitude of CVR (i.e., greater change in BOLD per unit change of ETCO2) in the anterior corona radiata for pmTBI in response to changes in inhaled CO2. Similarly, there were a number of regions of the brain with increased maximal fit (i.e., higher correlation between BOLD fMRI signal and changes in ETCO2) and increased latency to maximal fit (i.e., longer time to achieve the highest correlation between fMRI signal and ETCO2) for pmTBI. Of note, these findings were in the absence of differences on CVR task parameters (i.e. minimum ETCO2, average grey matter fit, respiratory rates) and were consistent with predictions of deficits in areas of the brain more likely to experience increased shear strain during pmTBI (frontal and temporal poles, around the cerebellum, in grey-white matter interface).16,17 Similar to recent pediatric and adult studies,12–14 these BOLD CVR abnormalities occurred in the presence of normal resting state perfusion, suggesting that either the deficits due to pmTBI may only be apparent under the influence of an additional stressor (hypercapnia) or that BOLD CVR is more sensitive than resting state perfusion. Importantly, regions with significantly increased maximal fit and increased latency to maximal fit demonstrated overlap only in the right superior longitudinal fasciculus and posterior thalamic radiation (Supplemental Figure 2), raising the possibility that BOLD CVR may be used to measure two different mechanisms by which pmTBI affects the developing brain.
Specifically, regions exhibiting increased maximal fit occurred in the frontal poles and were located more frequently in white matter along grey-white interface regions. Many of the observed areas of significantly different maximal fit fell in what Bhogal et al. 44 referred to as outer white matter, or those areas that share a boundary with grey matter. While these regions likely share the same vasculature as those with increased latency to maximal fit in pmTBI, blood vessels pass through the grey matter prior to perfusing outer, or even deep, white matter. 45 The increased maximal fit in pmTBI in these regions may then stem from damages directly to the areas or from changes (e.g., altered endothelial cell function) to preceding regions along the vasculature (i.e., grey matter has greater vasodilation relative to white matter in relation to increased CO2). 46 Potentially, the increased maximal fit in pmTBI represents a fuller, and possibly overcompensatory, response to increased CO2. Increased CVR amplitude was observed in similar areas along the grey-white matter interface, though only rising to the level of significance in the anterior corona radiata (Supplemental Figure 1). This likely indicates that both metrics are measuring the same underlying physiological mechanism, but that the maximal fit metric is more sensitive to group changes.
In grey matter across the entire brain, HC (13.1 ± 1.7 s) displayed similar latency to maximal fit as pmTBI (13.7 ± 1.4 s), whereas for the average latency across all regions exhibiting group differences was increased for pmTBI (14.5 ± 0.9 s) relative to HC (13.0 ± 1.0 s). This constellation of findings suggests specific, localized changes in cerebrovascular function resulting from injury rather than widespread dysfunction which was significant only in certain regions. The limited sample size of the experiment, however, precludes our ability to correlate reported locations of injury (Supplemental Table 4) with locations of findings. Areas of increased latency in pmTBI occurred more frequently in sensory cortices, around the tentorium, and were located more frequently in grey matter along grey-white interface regions. The increased latency may therefore be the result of the speed of capillary distensibility and total capillary recruitment, 47 and, by extension, the heterogeneity of transit time in recruited capillaries, 48 with the capillary bed normally shown to be more homogenous during hypercapnia. 49
Even in healthy individuals, the mechanisms underlying the physiological response to alterations in CO2 are complex (for a thorough overview, see Ellis et al. 1 ). Briefly, gas exchange takes place between alveoli and capillaries in the lungs, with individual differences existing in time between alveolar transfer and arrival of oxygenated blood to the brain. Poulin et al. 50 and Wise et al. 51 showed an average delay between gas stimulus onset and maximal fit with middle cerebral artery blood flow of approximately 6 s in adults. Additional time elapses between maximal middle cerebral artery bloodflow fit and hypercapnic vasodilation of grey matter capillaries, with Birn et al.52,53 reporting that changes in respiratory volume and rate are most predictive of grey matter BOLD change with an 8 to 9 s offset in healthy adult subjects.
At the microscopic level within the brain, increased blood flow is largely driven by activation of neuronal and astrocytic feed-forward loops by synaptic release of nitric oxide, which in turn causes the smooth muscles around blood vessels to dilate.54,55 Preclinical research shows increased capillary dilation in response to hypercapnia, 56 though further research in adult humans exhibits that the degree of dilation is not uniform throughout the brain (e.g., frontal lobe faster relative to occipital).57,58 Impairment from mTBI at the microscopic level is believed to arise from disruption of the blood–brain barrier and subsequent hindering of the function of endothelial cells around the vasculature. 59 However, no group differences in resting CBF were observed within regions with either altered maximal fit or latency to maximal fit in the current study, nor were there any differences in perfusion across all grey matter (HC CBF: 53.1 ± 6.9 mL/min/kg; pmTBI CBF: 52.7 ± 8.0 mL/min/kg). These findings potentially suggest that HC and pmTBI brain function is similar at rest (i.e., normocapnia), but differentially affected in the presence of an outside stressor (i.e., hypercapnia). This finding potentially emphasizes the further need for a conservative return-to-play/study timeline following pediatric injury. 60 As previous studies have shown hemodynamic changes in response to hypercapnia between pmTBI and HC “upstream” (i.e., middle cerebral artery), 61 it may be difficult to fully disambiguate if any component of the timing of CVR and our observed differences between pmTBI and HC are due to changes within the brain versus leading to the brain.
Contrary to our a priori predictions, these alterations in CVR persisted at four months post-injury, outlasting many of the clinical measurements collected in this study. These findings are consistent with a recent systematic review by Kamins et al. 60 which suggested that full recovery of physiological biomarkers may require from months up to more than a year after the resolution of clinical symptoms. Importantly, while differences in both maximal fit and latency to maximal fit were predictive of group membership in a binary logistic regression (90.8%; pmTBI vs. HC), these differences were not associated with persistent processing speed or attention deficits in pmTBI. Although the significant association with sleep disturbances was not predicted, it represents an interesting and potentially more complicated consequence of pmTBI if results can be replicated. While pmTBI as a whole displayed increased maximal fit to CO2, this analysis showed that those with lower fit (i.e., those more similar to HC) experienced the most sleep issues. This may represent an inability to upregulate or downregulate vascular flow to meet target the diminished metabolic demand of the brain during sleep62,63 for the pmTBI group as a whole, which may be compounded by a second, unknown vascular mechanism acting as a limiter upon increased vascular reactivity in those pmTBI experiencing ongoing sleep issues.
Strengths of the current study include a uniform pediatric age group and statistically well-matched HC scanned at equivalent times to reduce potential confounds associated with neurodevelopment and/or other potential non-specific effects of repeat scanning.64,65 There are still a number of limitations to consider. First, data were lost due to patient refusal, acquisition issues, and poor quality. However, our successful collection rate across both visits (72.8%) is similar to previous rates reported in a single visit, large N (78.3%) adult study. 66 Second, although the current study represents the largest longitudinal study in pmTBI to date, sample size was still modest and potentially underpowered for detecting smaller effects. Third, Ravi et al. 67 suggest a shorter TE to eliminate negative BOLD artifact in deep WM and around ventricles related to displacement of CSF by blood vessel pulsatility. While a shorter TE would not necessarily affect reported findings, other potential positive findings (e.g., subcortical grey matter) may have had limited sensitivity. Similarly, our post-labeling delay was set at 1800 ms in our 2D pCASL sequence to potentially capture hypoperfusion, slightly long than published recommendations. 21 Lastly, resting CBF may be affected by exercise, 68 and there may have been different levels of activity between the two groups due to injury.
In summary, although head trauma continues to be a concern for children and adolescents given overall incidence rates and its potential to alter the trajectory of neurodevelopment, there is currently a paucity of research and little consensus on relevant biomarkers. 2 Current findings suggest that pmTBI may result in disruptions to the vascular system that may take at least four months to resolve despite resolution of many overt symptoms. These results require replication in larger independent samples at extended assessment periods post-injury to rule out sample bias, with larger sample sizes also required to examine for potential differences in biological sex. 69 If replicated, both increased maximal fit and increased latency to maximal fit in changes in CO2 may serve as promising and distinct biomarkers for pediatric head injury.
Supplemental Material
JCB896883 Supplemental Material - Supplemental material for Persistent alterations in cerebrovascular reactivity in response to hypercapnia following pediatric mild traumatic brain injury
Supplemental material, JCB896883 Supplemental Material for Persistent alterations in cerebrovascular reactivity in response to hypercapnia following pediatric mild traumatic brain injury by Andrew B Dodd, Hanzhang Lu, Christopher J Wertz, Josef M Ling, Nicholas A Shaff, Benjamin C Wasserott, Timothy B Meier, Grace Park, Scott J Oglesbee, John P Phillips, Richard A Campbell, Peiying Liu and Andrew R Mayer in Journal of Cerebral Blood Flow & Metabolism
Footnotes
Funding
The author(s) disclosed receipt of the following financial support for the research, authorship, and/or publication of this article: This work was supported by grants from the National Institutes of Health [![]() ; grant numbers NIH 01 R01 NS098494-01A1 and -03S1A1] to Andrew Mayer. The NIH had no role in study review, data collection and analysis, decision to publish, or preparation of the manuscript.
; grant numbers NIH 01 R01 NS098494-01A1 and -03S1A1] to Andrew Mayer. The NIH had no role in study review, data collection and analysis, decision to publish, or preparation of the manuscript.
Declaration of conflicting interests
The author(s) declared no potential conflicts of interest with respect to the research, authorship, and/or publication of this article.
Authors’ contributions
Data collection during experiments was performed by ABD, CJW, NAS, and BCW, with JPP, RAC, and ARM serving in an expert role in meeting with participants. HL and PL devised the original collection setup, with site-specific modifications made by ABD and ARM. Recruitment of injured participants was performed by GP and SJO. ABD and ARM drafted the manuscript. Data processing, analysis, and interpretation were performed by ABD, CJW, JML, NAS, TBM, and ARM. All co-authors read, contributed with comments and approved the final version of the manuscript.
Supplemental material
Supplemental material for this article is available online.
References
Supplementary Material
Please find the following supplemental material available below.
For Open Access articles published under a Creative Commons License, all supplemental material carries the same license as the article it is associated with.
For non-Open Access articles published, all supplemental material carries a non-exclusive license, and permission requests for re-use of supplemental material or any part of supplemental material shall be sent directly to the copyright owner as specified in the copyright notice associated with the article.