
Abstract
In rat brain dynamic susceptibility contrast magnetic resonance (MR) images, vessels visible on the same scan plane as the brain tissue were used to measure the characteristics of the input function of the MR contrast agent gadopentetate dimeglumine. MR images were acquired 30 and 60 minutes after intravenous injections of 3 mg/kg and 15 mg/kg NG-Nitro-L-arginine methyl ester (L-NAME) (n = 9). The time of arrival (TOA) and the mean transit time corrected for TOA of the input function were increased by 3 mg/kg or 15 mg/kg L-NAME. The area of the input function was increased by 15 mg/kg L-NAME. In two animals, similar modifications of the input function induced by 20 mg/kg L-NAME were reversed by infusion of sodium nitroprusside. In two other animals, MABP was increased by phenylephrine to a similar extent as in L-NAME experiments, but did not induce the same modifications of the input function, showing that the action of L-NAME on the input function was not simply caused by an effect on MABP. These results show that the input function can be significantly altered by manipulations widely used in cerebrovascular studies. These input function changes have important implications for calculation of cerebral blood flow.
Since the first descriptions of techniques allowing the assessment of hemodynamic parameters by using noninvasive T2*-sensitive nuclear magnetic resonance (NMR) bolus track measurements (Villringer et al., 1988; Majumdar et al., 1988; Belliveau et al., 1990; Moseley et al., 1991), this method has found widespread applications in the evaluation of neurological diseases and cerebrovascular perturbations. While passing through the microvascular bed, a bolus of paramagnetic contrast material such as gadopentetate dimeglumine alters the magnetic susceptibility of tissues and produces local field inhomogeneities, leading to reductions in T2 and T2* of the tissue. This results in transiently decreased signal intensities from T2*-weighted pulse sequences such as gradient-echoes. Acquiring a series of rapid T2*-weighted gradient-echo images during the first pass of the contrast agent bolus allows the reconstruction of a signal intensity-time curve that can be later converted into concentration-time curves. Using the indicator dilution theory, the concentration-time data can be used to calculate blood volumes and flows. In conditions where the blood-brain barrier is not impaired, gadopentetate dimeglumine remains intravascular in the brain, and the indicator dilution theory for intravascular tracers can be applied.
However, for calculation of CBF, this theory requires knowledge of the concentration-time curve of the tracer corresponding to the input of the observed tissue: the input function (Axel, 1980). Most of the previous magnetic resonance imaging (MRI) perfusion studies by dynamic susceptibility contrast experiments were performed in conditions where a constant input function could be assumed, such as the comparison of different areas of the same brain, allowing the calculation of relative values of cerebral blood volume (CBV) and CBF without measuring the input function.
The purpose of the present study was to determine whether changing physiological conditions would change the input function. In rat brain MR perfusion images, arteries and veins visible in the same scan plane as the brain tissue were used to measure the parameters of the input function. The physiological conditions were changed by injecting the nitric oxide synthase inhibitor NG-nitro-L-arginine methyl ester (L-NAME), already known to modify the resistance of cerebral arteries and CBF (Prado et al., 1992; Pelligrino et al., 1993). In two rats, the nitric oxide donor sodium nitroprusside (SNP) was given to reverse the modifications of the input function induced by 20 mg/kg L-NAME (Moncada et al., 1991; Smith et al., 1995). In two other rats, the MABP was increased by phenylephrine infusion to a similar extent as the hypertension induced by L-NAME injections, and the modifications of the input function compared with those of the L-NAME group. The implications of these input function changes were illustrated by evaluating CBV and CBF changes in the different conditions.
PRINCIPLES OF FLOW MEASUREMENT BY THE INDICATOR DILUTION THEORY
The indicator-dilution method using intravascular tracers converts the measurement of indicator concentration distal to an organ into flow and volume information about this organ (Zierler, 1965). This theory has been extended to the calculation of cerebral perfusion based on rapid sequence tomographies performed simultaneously with the bolus injection of a nondiffusible indicator (Axel, 1980): The Central Volume Theorem states that tissue blood flow (F) can be determined by the ratio

where V is the volume of distribution of the agent within the tissue (for an intravascular contrast agent, V is the tissue blood volume), and MTT is the mean transit time, or normalized first moment, of the outflow concentration-time curve Cout(t) resulting from a bolus injection.
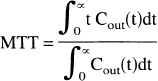
Assuming that the concentration of the contrast material is the same at both points, Cout(t) may be measured either at the outflow orifice (the vein) or within the central volume (the tissue level) (Axel, 1980). This assumption justifies the use of the first moment of C(t) measured in the tissue in most of the MR perfusion studies, but the accuracy of this approach has already been questioned (Hamberg et al., 1993; Weisskoff et al., 1993).
The definition of MTT involves the transit of an idealized narrow square-wave bolus from an instantaneous delta function injection. Practically, however, the intravenous injection of the MR contrast agent has finite duration and furthermore will be delayed and prolonged before reaching the artery supplying the observed tissue. Consequently, the actual observed tissue function Cobs(t) is the convolution of the input function Ca(t) and the residue function Ctissue(t), the tissue concentration-time curve that would have been achieved with an ideal instantaneous injection.

To find Ctissue(t), Cobs(t) should be deconvolved with Ca(t). However, the first moments of convolved functions are generally additive (Zierler, 1962), so that

which gives a simpler method for correcting MTT, as long as Ca(t) and its associated MTTa can be measured. This can be done from the MR signal of an artery feeding the organ and appearing in the scan plane.
Using an intravascular contrast agent, MTTtissue only defines the flow per unit vascular volume. To calculate the flow per unit tissue volume, the fraction of vascular volume in the tissue (CBV for cerebral perfusion studies) must be determined. The absolute value of CBV can be calculated by integrating the observed tissue concentration-time curve and normalizing to the integrated arterial input function, or to the integrated draining vein function Cv(t), as it can be shown that ∫Ca(t)dt = ∫Cv(t)dt (Axel, 1980). Thus
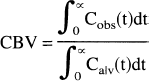
Cv(t) can be measured in a venous structure appearing in the scan plane, such as the superior sagittal sinus. Without knowing the area under Ca(t) or Cv(t), a constant value may be assumed and relative values of CBV may be estimated based on the measurement of ∫Cobs(t)dt alone. For comparisons of CBV measured under different physiological situations, the assumption of a constant input function may not always hold. Similarly, the knowledge of Ca(t) is required for the calculation of an absolute value of the tissue flow, as MTTobs (in the venous output or in the tissue itself as discussed above) must be corrected by MTTa. Other models incorporating the input function have been proposed (Larson, et al., 1994).
MATERIALS AND METHODS
Animal model
All animal procedures were approved by the University of Texas Medical Branch Animal Care and Use Committee. Male Sprague-Dawley rats (310 to 490 g body weight) were initially anesthetized with 4% halothane in balanced breathing air (30% O2/70% N2). Rats were then intubated and mechanically ventilated using a modified compressed air-powered clinical pressure ventilator (Monaghan, Littleton, CO, U.S.A.), with halothane maintained at 0.6 to 1% during the surgery and MRI procedures. A femoral arterial cannula was inserted for blood gas determination and MABP monitoring. A cannula was inserted in the femoral vein to deliver the bolus of gadopentetate dimeglumine (Magnevist, Berlex Imaging, Wayne, NJ, U.S.A.), the intravascular MR contrast agent, and of NG-Nitro-L-arginine methyl ester (L-NAME). A second intravenous femoral cannula was inserted when necessary for SNP (Elkins-Sinn, Cherry Hill, NJ. U.S.A.) or phenylephrine (Elkins-Sinn) continuous infusion. The rectal temperature was kept at 37°C with a warm-water blanket during surgery. During MRI, the rat temperature was maintained by circulating warm air through the magnet bore.
Total preparation time was about 2 hours. Then two perfusion measurements by bolus-tracking T2*-weighted sequences were performed at 30-minute intervals under control conditions. Considering the stability and reproducibility of the dynamic susceptibility contrast MRI method for sequential perfusion measurements, previous investigations showed a persistent modification of the signal intensity after a second injection of gadoteridol (ProHance, Bracco Diagnostics, Princeton, NJ, U.S.A.) (Levin et al., 1995). Consequently, only the second perfusion measurement performed under control conditions was used for comparison with the measurements performed after drug administration.
In a first group of rats (L-NAME, n = 9), a first intravenous bolus injection of 3 mg/kg L-NAME was given, followed after 1 hour by a second intravenous injection of 15 mg/kg L-NAME. Perfusion measurements were performed 30 and 60 minutes after each L-NAME injection. For L-NAME + SNP experiments, two rats underwent a perfusion measurement 30 minutes after a 20 mg/kg L-NAME injection. This dose was selected because reversal of CBF effect of 20 mg/kg L-NAME by SNP has been reported (Smith et al., 1995). Then a continuous infusion of SNP (0.1 mg/mL, 20 to 40 μL/kg/min) was started at the lower dose and gradually increased until MABP was restored to its pre- L-NAME value. The infusion was then continued at this rate. A perfusion measurement was performed after a stable MAP was achieved. For the phenylephrine experiments (n = 2), phenylephrine infusion (0.25 mg/mL, 5 to 50 μL/kg/min) was started after the control perfusion measurements. Once a new steady state at high MABP was achieved, a perfusion measurement was performed. Then the phenylephrine infusion was discontinued resulting in a decrease in MABP. We waited 30 minutes between measurements.
At the end of the experimental protocol, the rats were killed with an intravenous injection of 60 mg pentobarbital sodium (Nembutal, Abbott Laboratories, North Chicago, IL, U.S.A.).
Magnetic resonance imaging experiments
The proton MRI experiments were performed using a 4.7 Tesla, 33-cm horizontal bore magnet (SISCO/Varian, Palo Alto, U.S.A.). Excitation and signal detection were achieved with a 6-cm surface coil. Twelve contiguous spin-echo T2-weighted coronal images were acquired, with a 2-second repetition time, 65-millisecond echotime, 128 phase-encoding steps, 4-cm field of view, and 1.7-mm slice thickness. In this set of images, the coronal plane corresponding approximately to stereotaxic coordinates +7.6 mm interaural and −1.4 mm bregma, Paxinos coordinates (Paxinos and Watson, 1986) was chosen for the single-slice bolus tracking experiments. A T2*-sensitive fast low-angle shot pulse sequence (Frahm et al., 1987) was used, with 11- millisecond repetition time, 2.5 millisecond echotime, 8-cm field of view, and 1.9-mm slice thickness. Thirty T2*-weighted images were recorded consecutively. For each perfusion measurement, a first reference movie of 30 T2*-weighted images with a matrix 128 × 128 and 2 averaged acquisitions was performed. Then a second movie was acquired with 30 T2*-weighted images with a matrix of 128 × 64 and 1 acquisition, resulting in a recording time of 0.7 seconds per image. During this second acquisition, a bolus of 0.3 mmol/kg of gadopentetate dimeglumine was injected into the femoral vein synchronously with the start of the 6th image, over a 1.5 second interval. A reconstruction algorithm used the higher phase-encoding steps of the high spatial resolution reference movie and the lower phase-encoding steps of the low spatial but high temporal resolution bolus-tracking movie to yield a 128 × 128 matrix image where the signal intensities corresponded to the bolus-tracking movie.
Data analysis
The time-course of the signal intensity was calculated for each pixel. Signal intensities were transformed into relative concentrations C(t) of the tracer (Belliveau et al., 1990).
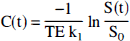
where TE is the echotime, SO is the baseline signal intensity, S(t) is the time-dependent signal intensity, and k1 is a proportionality factor related to tissue, pulse sequence, and field strength characteristics (Quast et al, 1993).
Cb(t) was determined for a region of interest covering the whole brain tissue, excluding the sagittal sinus and the basal area displaying the large vessels. To measure Ca(t), a single pixel was chosen in an area corresponding to a transversally cut artery in the circle of Willis. Compared to the brain tissue, the arteries were characterized in T2*-weighted images by a higher baseline signal intensity, and an earlier decrease and recovery of the signal intensity with the passage of the contrast agent. To minimize the partial volume effect, the arterial pixel with the highest intensity achieved was chosen. Cv(t) was measured in the superior sagittal sinus both in a single pixel chosen for its highest value of ∫Cv(t)dt, and in a region of interest covering the whole area of the superior sagittal sinus.
Concentration-time curves from dynamic-susceptibility contrast MR images are usually fitted to a gamma variate model. In the present study, the data did not conform readily to this model, especially after L-NAME administration, which deformed the curve, and, in the sagittal vein, showed multiple compartments. For this reason, numerical integration was used. Cb(t), Ca(t), and Cv(t) were integrated between the time of arrival (TOA) of the contrast agent, defined as the initial point of significant deflection from baseline, and the end of the first pass of the contrast agent, the signal corresponding to recirculation being cut off. This calculation yielded the values of ∫Cb(t)dt, ∫Ca(t)dt, and ∫Cv(t)dt. For the calculation of MTT by Equation 2, t = 0 was set at the time of injection of the contrast agent. To better characterize the shape of the concentration-time curves, the MTT corrected for TOA was also calculated, and called MTTsh. For the venous curve, MTTv, TOAv, and MTTshv were calculated with the single pixel measurement of Cv(t), which minimized the partial volume effect, but ∫Cv(t)dt was calculated from a combined group of several pixels within the superior sagittal sinus, as this value of the integral was more reproducible than in a single pixel.
Although the purpose of this experiment was to assess modifications of the input function, calculations of CBV and CBF were attempted. Cerebral blood volume was calculated according to Equation 4, by the ratio of ∫Cb(t)dt to ∫Cv(t)dt (preferred to ∫Ca(t)dt whose variability was higher because of the single pixel measurement of Ca(t)). The results (mean and SD) were converted to percents of the mean value at baseline. MTTtissue was corrected for the input function according to Equation 3, by subtracting MTTa from MTTv, the MTT of the outflow concentration-time curve. Cerebral blood flow (CBF) was calculated by the ratio of CBV to MTTtissue. Because of limited temporal resolution, the variations of MTTtissue were large compared with the small absolute values of this parameter used as a denominator; therefore, the actual calculation of individual CBF values was subjected to large errors. However, CBF could be evaluated as the ratio of the mean values of CBV and MTTtissue. The SD of those ratios were calculated according to Raj (1968). The absolute values of the ratios and SD were converted to percents of the ratio calculated at baseline.
Data are expressed as mean ± SD. Statistical differences were obtained using a repeated measurement analysis of variance, followed by a Bonferroni t-test for multiple group comparisons, using the statistical software SigmaStat 1.0 (Jandel, San Rafael, CA, U.S.A.). A value of P < 0.05 was considered to be significant for drug effects.
RESULTS
Blood gas parameters did not change immediately before and after MR imaging experiments in the L-NAME (n = 9), L-NAME + SNP (n = 2), and phenylephrine (n = 2) groups. Those parameters remained in the physiological range for rats during the whole observation period (Baker et al., 1979). L-NAME injection induced a significant increase of MABP (Table 1). The MABP for the SNP and phenylephrine-treated rats are also shown.
Mean arterial blood pressure
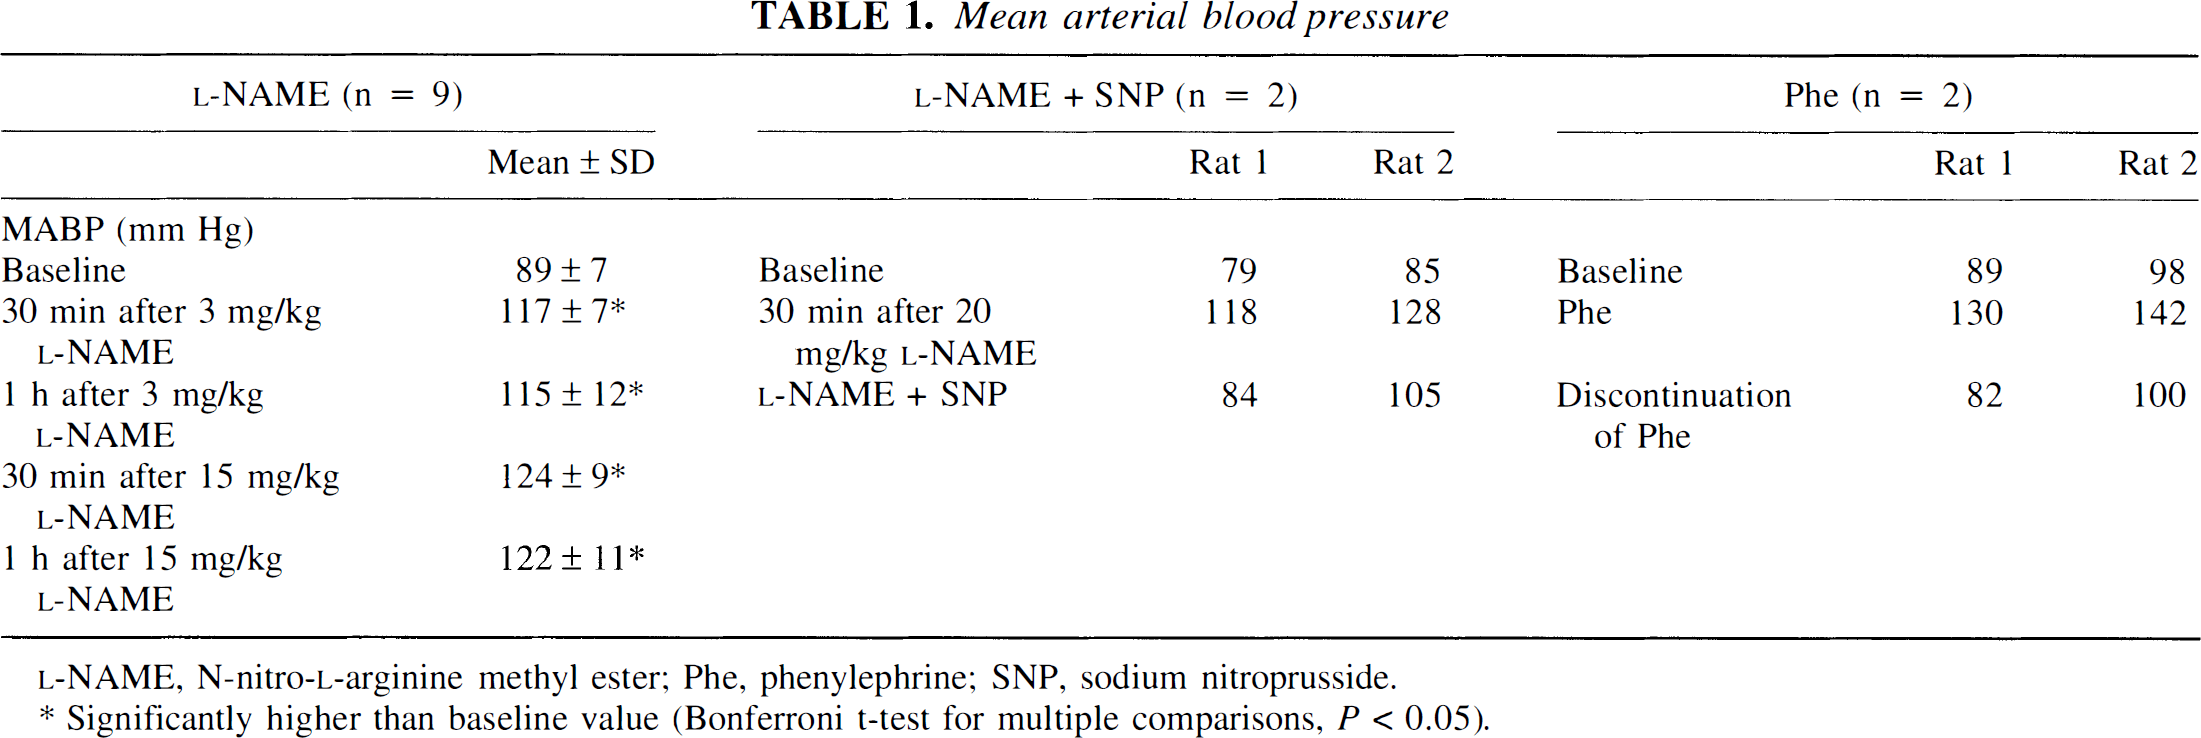
Significantly higher than base line value (Bonferroni t-test for multiple comparisons. P < 0.05).
Representative images out of a sequence of 30 dynamic susceptibility contrast images acquired during baseline conditions are displayed in Fig. 1 for illustration of the time-course of signal intensity in arteries, brain tissue, and sagittal sinus. Signal intensities were converted to concentration-time curves (C(t)) of the contrast agent.
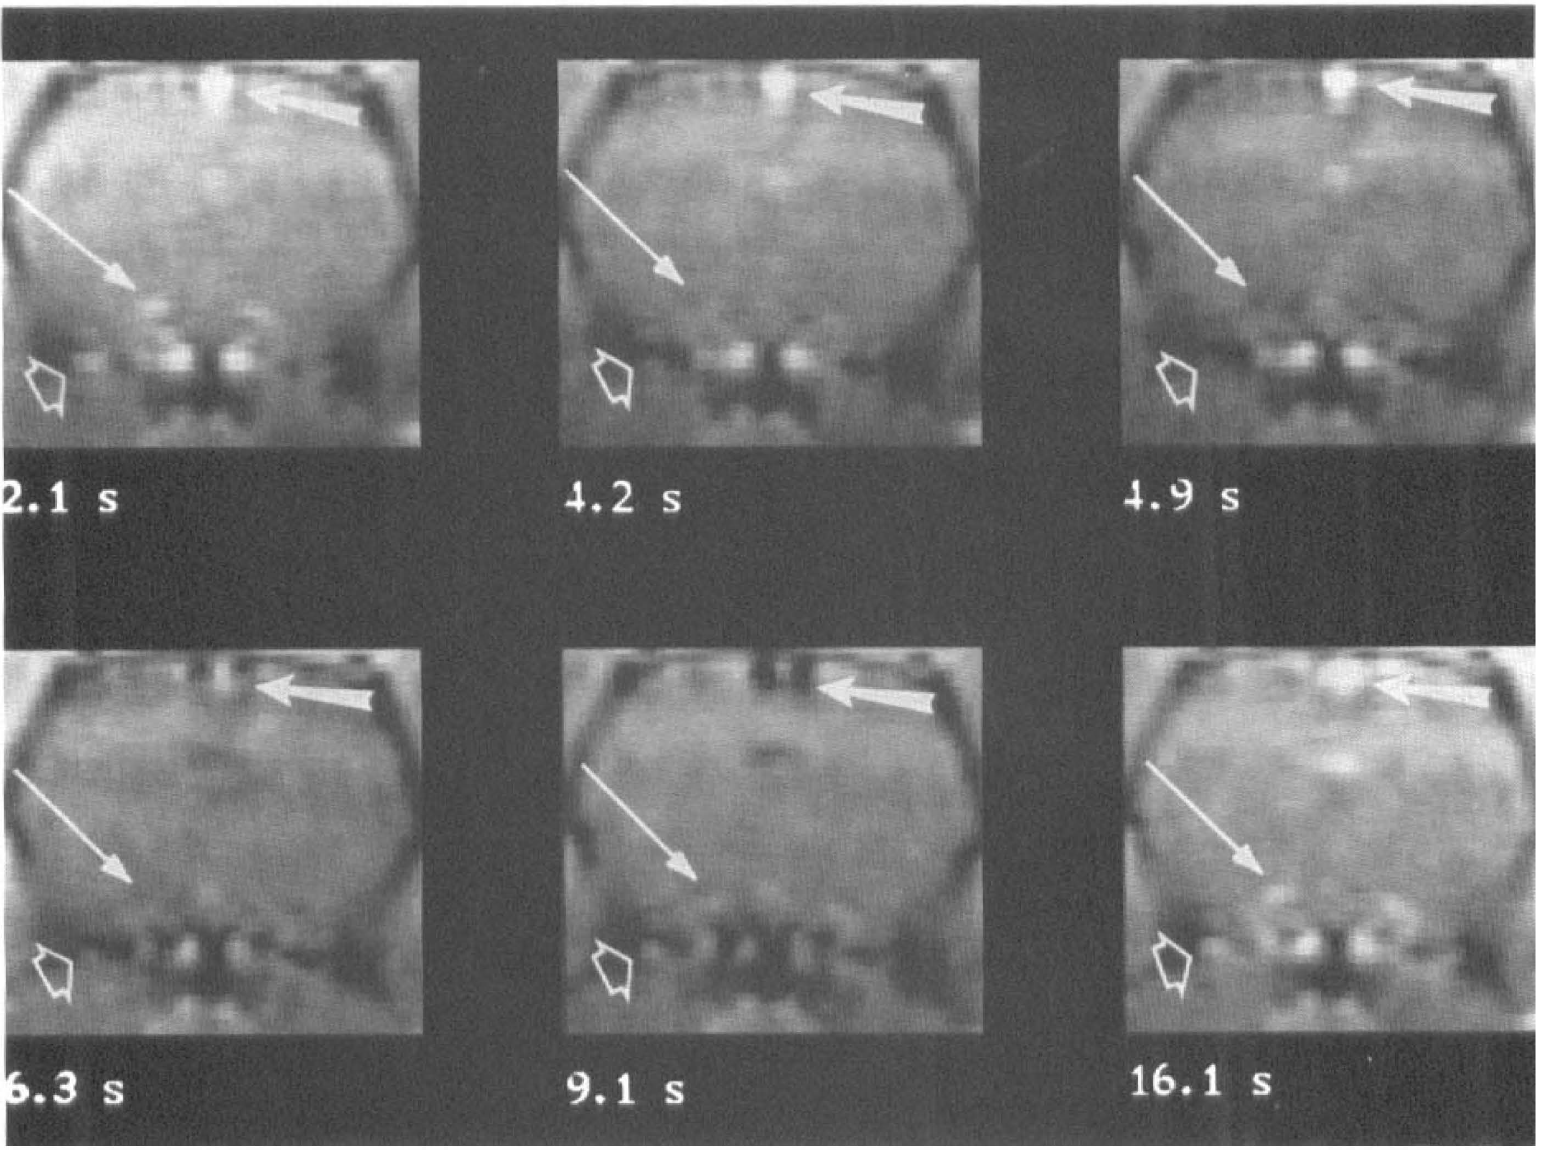
Dynamic susceptibility contrast images chosen out of 30 gradient-echo images acquired every 0.7 seconds before and after injection of 0.3 mmol/kg gadopentetate dimeglumine. The first image corresponds to 2.1 seconds after injection of the contrast agent, which did not reach the brain yet. The arteries (intracerebral artery: long thin arrow, and artery of the Willis circle: short empty arrow), and the sagittal sinus (thick arrow) are brighter than the cerebral tissue. The arteries become darker 4.2 seconds after injection, followed by the cerebral parenchyma at 4.9 seconds. After 6.3 seconds, the contrast agent reached the sagittal sinus. At 9.1 seconds, the first pass of the contrast agent had left the arteries, which reappeared brighter, while the sagittal sinus was still dark. After 16.1 seconds, the contrast agent had also left the sagittal sinus.
The effect of 3 mg/kg and 15 mg/kg L-NAME on perfusion parameters are presented in Fig. 2. After injection of L-NAME, MTTa increased significantly, reflecting an augmentation of both TOAa (significant 30 minutes after the low dose, and 30 and 60 minutes after the high dose of L-NAME), and MTTsha (significant only after the high dose). ∫Ca(t)dt did not change significantly, although a trend toward an increase was suggested. The arterial curve seemed especially affected by limited spatial resolution. An increase of MTT, TOA, and MTTsh was observed after L-NAME in the venous and the brain functions, reaching statistical significance after 15 mg/kg L-NAME, except that TOAv already significantly increased 30 minutes after the low dose, and MTTshv did not reach statistical significance. Unlike ∫Ca(t)dt, ∫Cv(t)dt increased significantly after 15 mg/kg L-NAME, but the increase of ∫Cb(t)dt was not significant.
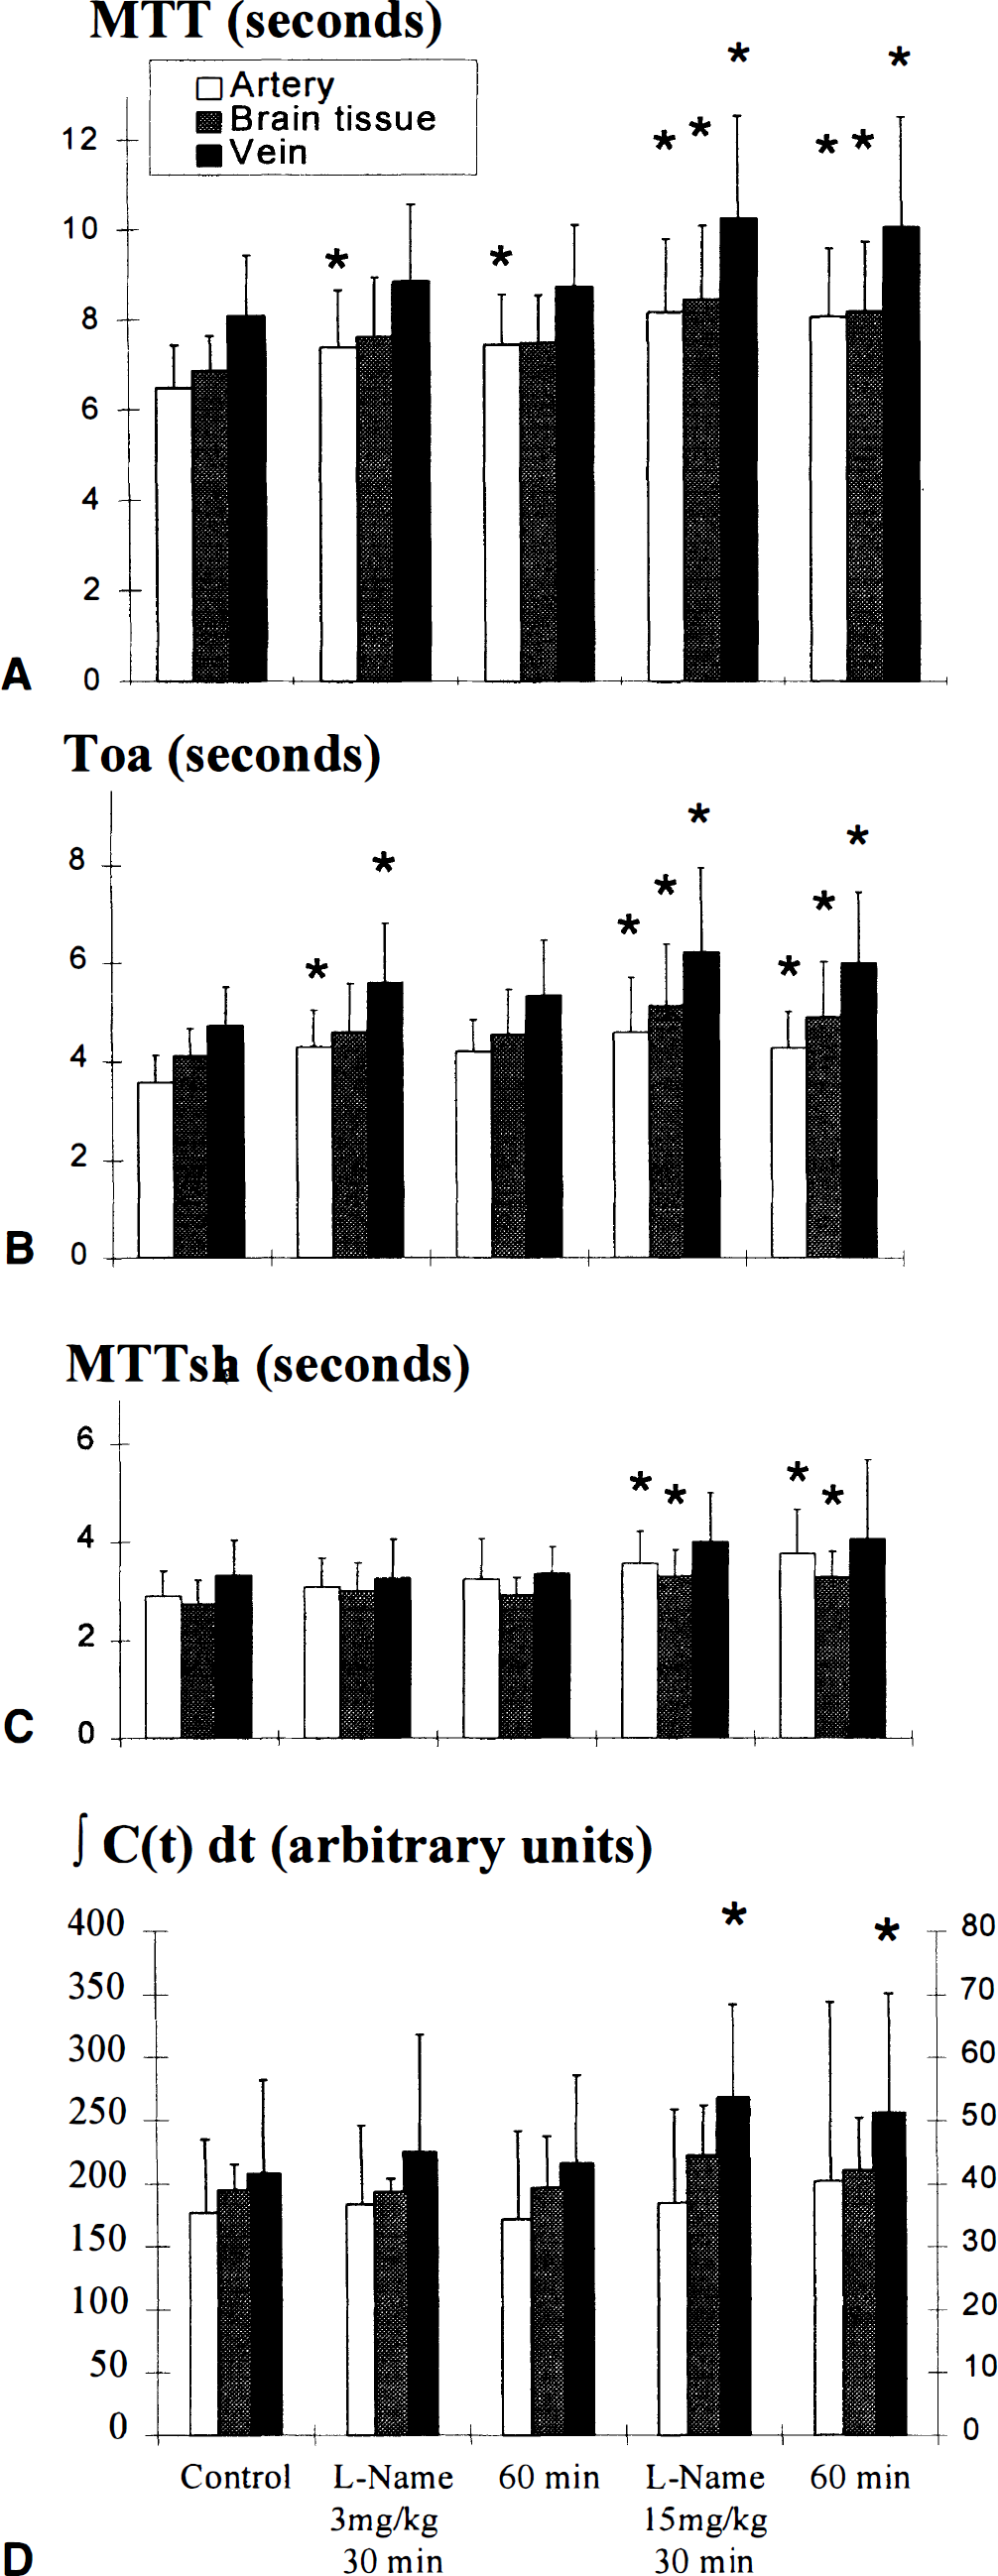
Mean transit time (MTT),
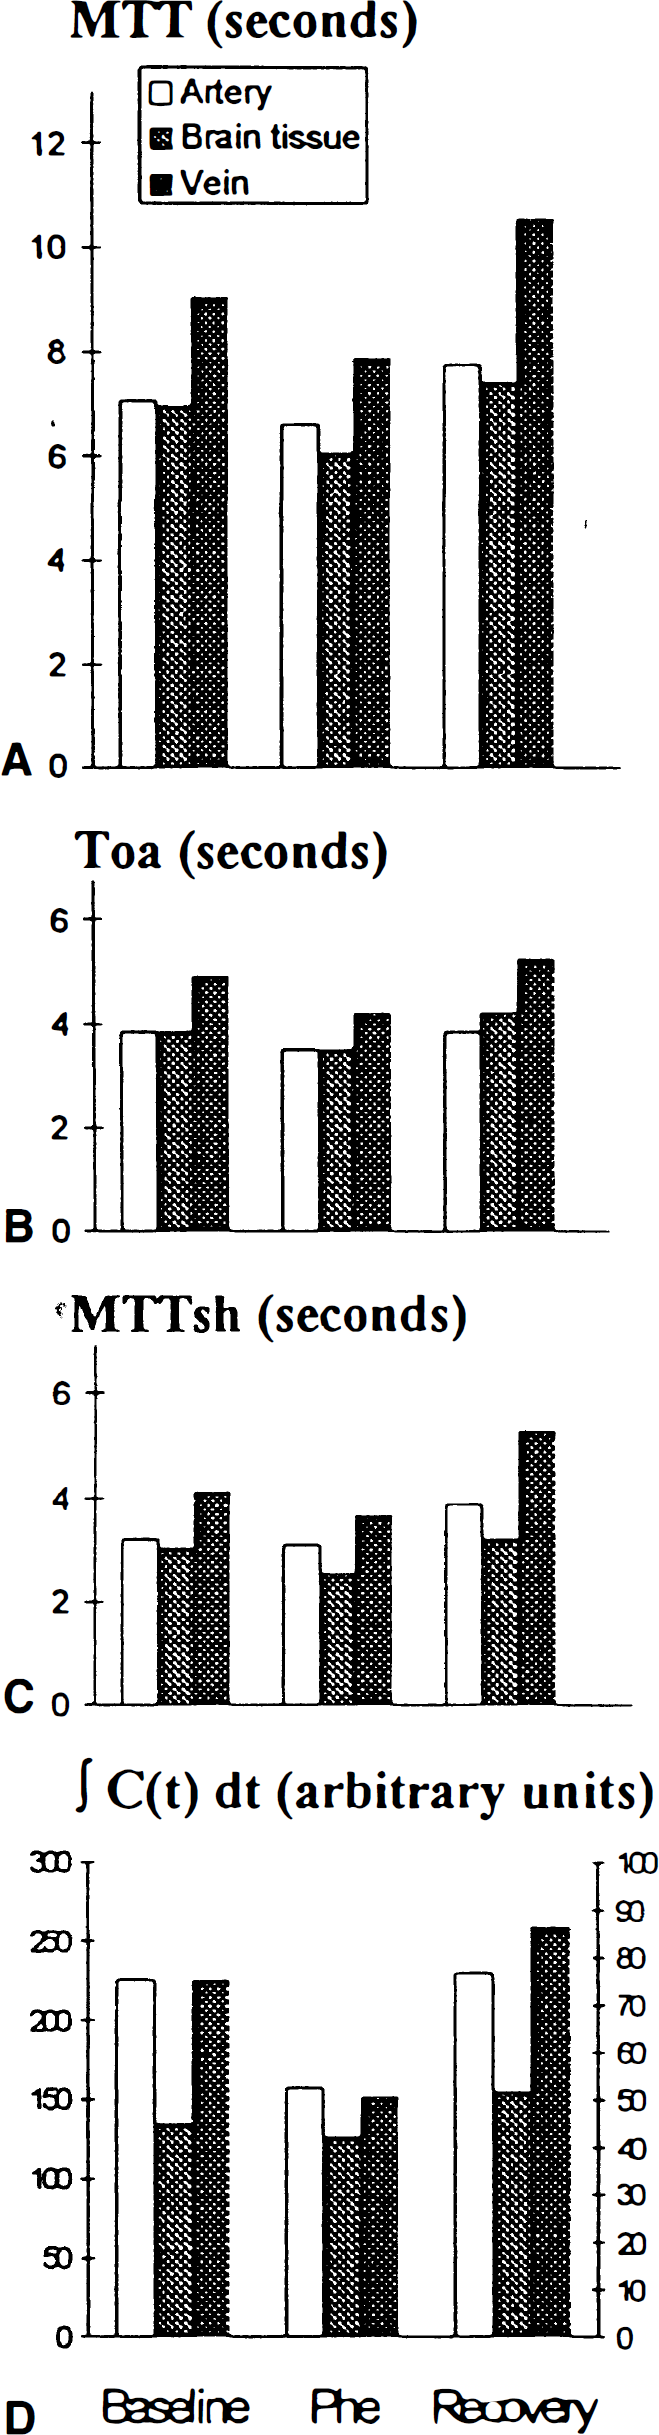
In the two animals tested, SNP infusion reversed the effects of 20 mg/kg L-NAME on MTT, TOA, and MTTsh of the arterial, brain, and vein functions (Fig. 3). Sodium nitroprusside also reversed the increase of ∫Cv(t)dt induced by L-NAME. In the two animals studied, MTT, TOA, and MTTsh did not increase, or even decreased during phenylephrine infusion in the arterial, brain, and vein functions (Fig. 4). Compared to L-NAME, phenylephrine had also an opposite action on ∫Cv(t)dt, which decreased. Stopping phenylephrine infusion reversed these parameters.
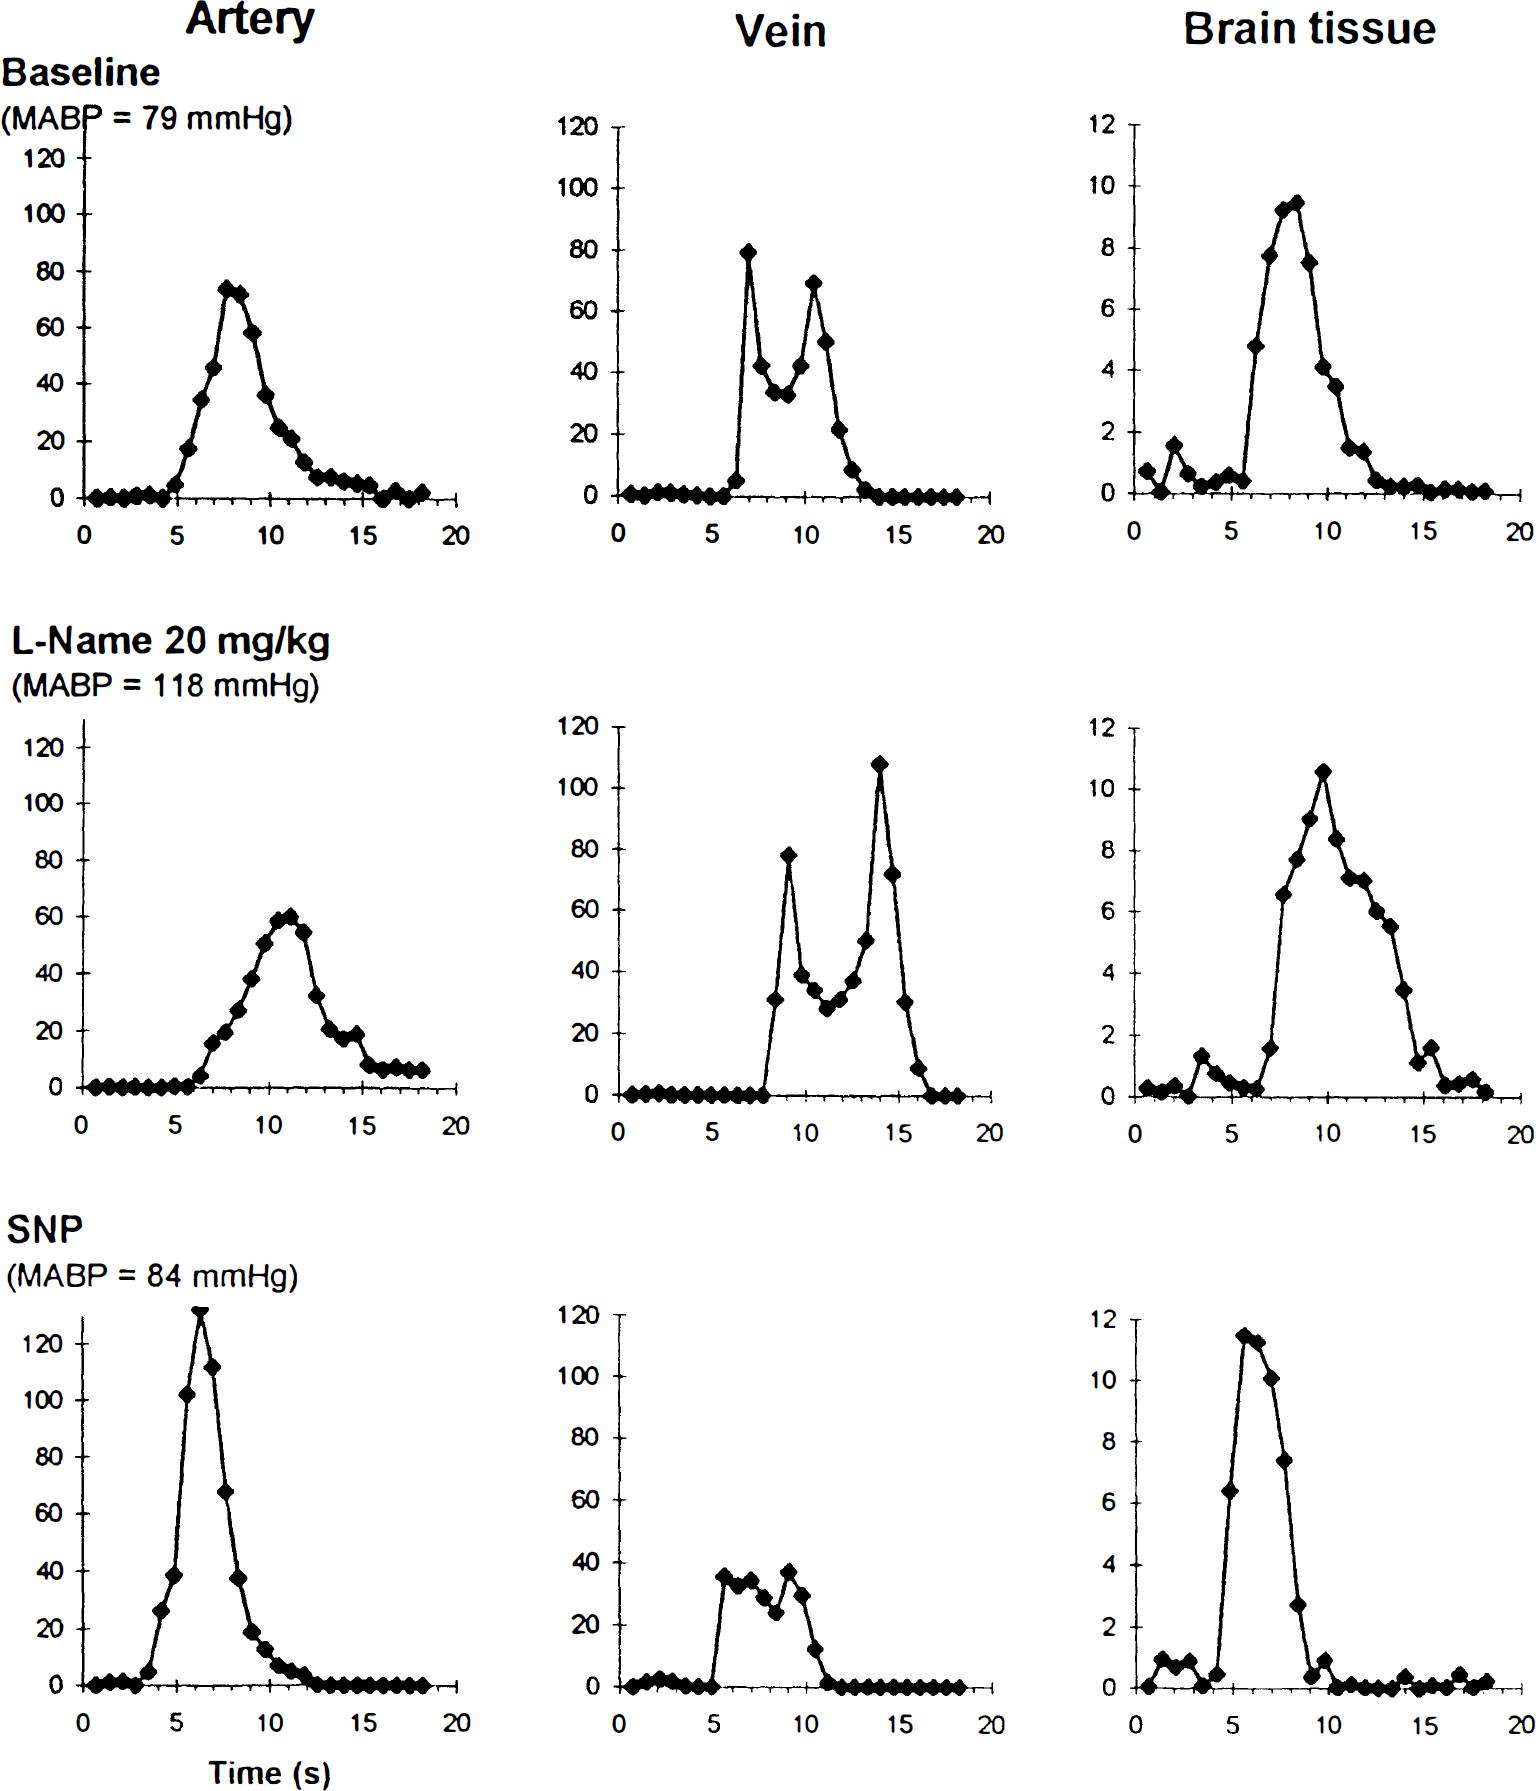
Arterial, brain tissue, and venous concentration-time curves of a rat administered 20 mg/kg L-NAME followed by sodium nitroprusside (SNP) infusion (0.1 mg/mL, 20 to 40 μL/kg/min). L-NAME increased the MABP, the time of arrival, and mean transit time of all curves, and SNP reversed these modifications. These results indicate that the alterations seen with L-NAME (Fig. 2) were not simply caused by the effect of serial injections.
Mean values of
The purpose of this study was to illustrate that the input function can be affected by changes in systemic physiological conditions. However, we did preliminary calculations of CBV and CBF with and without consideration of the input function and evaluated the direction of effects. Cerebral blood volume values were calculated by Equation 4. The results are presented as percent of the baseline value. Cerebral blood volume tended to decrease after L-NAME injection (95 ± 38% and 86 ± 29% 30 minutes after 3 mg/kg and 15 mg/kg L-NAME, respectively), but did not reach statistical significance because of variance. Sodium nitroprusside infusion restored CBV after the decrease induced by 20 mg/kg L-NAME or increased it to higher values than during the control period (from 81 and 83% to 95 or 137%, respectively in 2 rats). Phenylephrine infusion increased CBV which came back to baseline when the phenylephrine infusion was discontinued (170 and 115% to 105 and 95%, respectively in 2 rats). If the input function correction of ∫Cv(t)dt had not been taken into account, the values of ∫Cb(t)dt would have shown a trend for increased CBV after 15 mg/kg L-NAME (114 ± 20% after 30 minutes and 108 ± 21% after 60 minutes), contrary to the results found by Equation 4, where CBV is corrected for ∫Cv(t)dt (86 ± 29% after 30 minutes and 90 ± 38% after 60 minutes).
MTTtissue was calculated by subtracting MTTa from MTTv (Equation 3). There was large interindividual variations when MTTtissue were calculated, but interesting trends were observed. MTTtissue decreased slightly after 3 mg/kg L-NAME (from 1.59 ± 0.61 seconds at baseline to 1.47 ± 0.89 and 1.27 ± 1.02 seconds at 30 and 60 minutes after 3 mg/kg L-NAME respectively) but increased to 2.07 ± 1.06 and 2.00 ± 1.46 seconds at 30 and 60 minutes after 15 mg/kg L-NAME, respectively. Considering that CBF is the ratio of CBV to MTTtissue (Equation 1), the decreased CBV and increased MTTtissue observed after 15 mg/kg L-NAME suggests that CBF was decreased in these conditions. Fig. 5 illustrates that the decrease of CBF after 15 mg/kg L-NAME would not have been appropriately recorded if the input function had not been taken into account: CBV/MTTtissue decreased to 66 ± 17% and 72 ± 25% at 30 and 60 minutes after 15 mg/kg L-NAME compared with 100 ± 22% at baseline, while ∫Cb(t)dt/MTTb remained at 93 ± 9% and 91 ± 8% for the same conditions compared with 100 ± 5% at baseline. The smaller numbers of data in L-NAME ± SNP and phenylephrine groups did not allow the calculation of mean MTTtissue and CBF, but the individual values of CBF were calculated. They indicated that SNP reversed the decrease of CBF induced by the L-NAME injection, and that phenylephrine infusion increased CBF, which decreased again when the phenylephrine infusion was stopped (Table 2).
Estimation of cerebral blood flow*
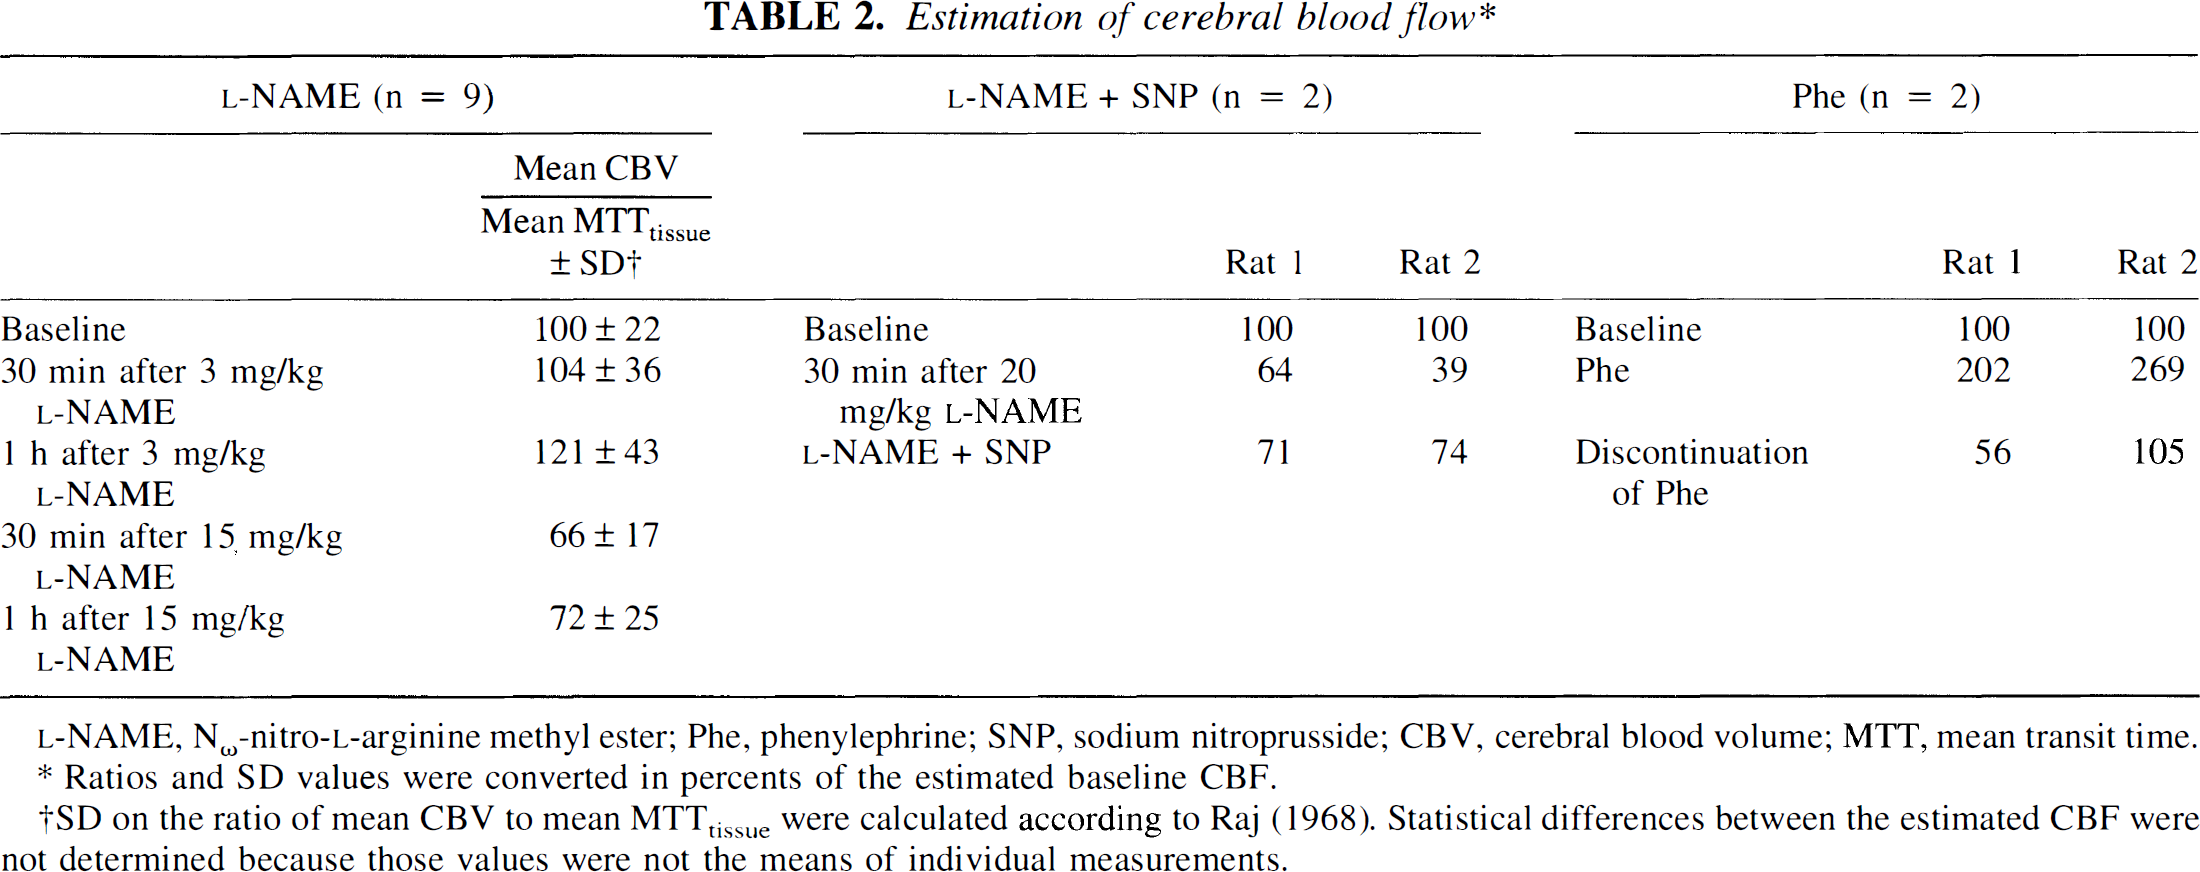
Ratios and SD values were converted in percents of the estimated baseline CBF.
SD on the ratio of mean CBV to mean MTTtissue were calculated according to Raj (1968). Statistical differences between the estimated CBF were not determined because those values were not the means of individual measurements.
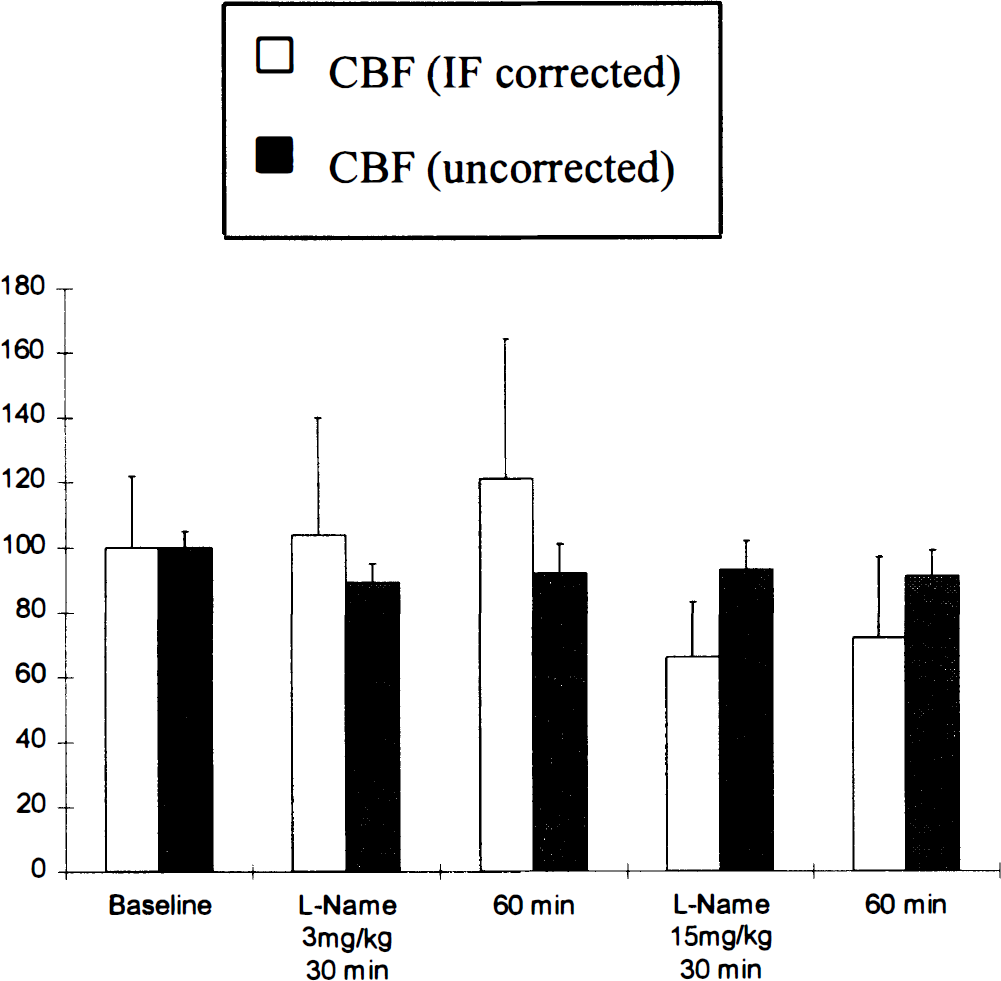
Assessment of CBF changes after L-NAME injections, with correction by the input function (CBV/MTTtissue) or without this correction (∫Cv(t)dt). The displayed results are the ratios of mean values of CBV and MTTtissue, ∫Cv(t)dt and MTTb. Error bars are the SD of these ratios (Raj, 1968).
DISCUSSION
The present study showed that changes in the physiological state of the rats investigated here can modify the input function. The assumption of a constant input function allows the comparison of different brain regions within one individual at a time. Under constant physiological conditions, the validity of this assumption has already been shown by others (Wittlich et al., 1995). This previous investigation also proved that input function can be used as a constant for a group of genetically homogeneous animals, provided the physiological and the imaging conditions of the animals remain unchanged. In an MR human study, input function measured in arteries visible on the scan plane showed a strong interindividual variation, although none of the investigated subjects had a history of intracranial abnormality (Rempp et al., 1994), suggesting that among humans input function differs even if the individuals are subjected to the same conditions.
The modifications of the concentration-time curves observed in the brain tissue and in the sagittal vein after administration of L-NAME were partly caused by their convolution with a modified input function. This was illustrated by the decreased calculated CBV, resulting from an increase of the area under Cb(t), but a stronger increase of the area under Cv(t), used to correct ∫Cb(t)dt. Ignoring the correction by the input function would have led to the calculation of increased CBV after 15 mg/kg L-NAME.
With this correction, the CBF calculated for 30 minutes after 15 mg/kg L-NAME was reduced to 66 ± 17% of the baseline value. This result is consistent with previous laser Doppler measurements showing that CBF decreased to 67.6 ± 8.1% in rat cerebral cortex after 15 mg/kg L-NAME (Prado et al., 1992) or to 74 ± 2% after 20 mg/kg L-NAME (Smith et al., 1995), with radioactive microsphere measurements showing a global CBF decreased to 74 ± 12% after 20 mg/kg L-NAME (Huang et al., 1994), and with [14C]-iodoantipyrine autoradiography showing a decrease of CBF between 53 ± 3% and 86 ± 6%, depending on the cortical area, after 30 mg/kg L-NAME (Kelly et al., 1994).
The shape and TOA of the input function depends on the way the intravenous contrast agent bolus has been delayed and deformed between the site of injection and the observed feeding artery. The lower dose of 3 mg/kg L-NAME induced a 31% increase of the MABP, close to the 39% increase caused by the higher dose, but less consistent modifications of the concentration-time curves, suggesting that those modifications were more related to the level of nitric oxide synthase inhibition rather than to the consequent hypertension. The reversal of these modifications by SNP infusion would thus be more likely caused by the direct supply of nitric oxide synthase rather than to the reversal of MABP changes. Phenylephrine infusion caused a comparable hypertension, but did not increase TOA, MTT or MTTsh, or even decreased those parameters.
Modifications of cerebral vascular resistance (CVR), and the relative value of CVR compared with the vascular resistance in other organs, could affect the bolus distribution to brain during its course in the aorta and likely influence the size and shape of the cerebral input function. Calculating CVR as the ratio of MABP to CBF, we found that CVR reached 211% of the control value 30 minutes after 15 mg/kg L-NAME. This increase of CVR induced by L-NAME injection is comparable with the values calculated with MABP and CBF values of previous studies: CVR = 183% (Huang et al., 1994) or 164% (Smith et al., 1995) after 20 mg/kg intravenously, and 156 to 253% depending on the cortical area after 30 mg/kg intravenously (Kelly et al., 1994). However, during phenylephrine infusion, our calculations suggested that CBF actually increased, as would be the case if there was a breakthrough of autoregulation. Consequently, the hypertension induced by phenylephrine infusion was accompanied by a smaller CVR increase than the hypertension induced by L-NAME. The distribution of the contrast agent bolus to the brain would thus be less (or differently) affected, contributing to the difference in input function modifications between both conditions. The trend of increasing CBF with phenylephrine, suggesting a partial breakthrough of autoregulation, would be in agreement with previous laser Doppler measurements of increased CBF in urethane anesthetized rats subjected to phenylephrine (Tsai et al., 1989), and with the previously reported impairment of the cerebral autoregulation during phenylephrine infusion in halothane-anesthetized rabbits (Mutch et al., 1990). The dependence of input function on CVR relative to other vascular beds would also suggest that the measurement of input function in blood samples withdrawn from a peripheral artery, as practiced in single pass CBF measurements techniques, could be misleading if it does not reflect the input function in the carotid bed.
The indicator dilution theory states that the integrated input function = ∫Ca(t)dt = ∫Cv(t)dt, but the present study found larger areas under the vein curves than under the arterial curves. This finding may be explained by a partial volume effect affecting the arterial pixels more than the venous pixels, because of the smaller size of the arteries compared with the superior sagittal sinus. Although showing larger areas under the curves, ∫Cv(t)dt was still apparently underestimated. The ratio of ∫Cb(t)dt to ∫Cv(t)dt yielded an absolute value of 21 ± 2% for CBV under control conditions, which is too high compared with the values measured previously in rat brains by other methods (3.4% (Shockley, 1988; Kent, 1989)). Thus, volume averaging may not be the only cause of signal loss and both flow and susceptibility effects may be occurring.
Most previous CBF studies calculated CBF by the ratio of CBV to the MTT of the tissue concentration-time curve by first pass bolus tracking. But Hamberg et al. (1993) and Weisskoff et al. (1993) expressed reservations about the use of MTT measured with MRI tissue concentration-time curves for the calculation of CBF by the central volume principle. Weisskoff et al. showed that the first moment of the concentration-time curve of the tracer at the outlet of the system, which relates CBV to CBF, may not be substituted by the first moment of the concentration-time curve measured in the tissue, R(t), which expresses the amount of the bolus that remains in the tissue. They showed that the first moment of R(t) depends on the topology of the vessels. In the present study, we calculated CBF by using MTTv, the first moment of the concentration-time curve in the superior sagittal sinus, i.e. the MTT actually measured at the outlet of the system, in agreement with the central volume principle. But the drawback of using MTTv (corrected by MTTa to take into account the deconvolution with input function), is that it gave only the value of a global CBF, and did not allow the calculation of regional CBF in the different anatomical structures of the brain.
Weisskoff et al. (1993) also suggested that the ratio of MTT measured by R(t) could give a reasonable estimate of the relative flow changes either between two regions of the brain with similar vascular physiology, or between the same region before and after some perturbation, if the perturbation changes the vascular structure only moderately. It must be kept in mind also, that in this case, MTT from the input bolus must be subtracted from MTT of R(t). In our study, this estimation could not be calculated because of too small differences between MTTb and MTTa. In addition to relative poor temporal resolution, this effect was probably caused by underestimation of MTTb, because of the low signal to noise ratio of Cb(t) which could have hidden the extremes of the curve into an apparent baseline.
In conclusion, significant changes of the brain input function were found after intravenous injection of L-NAME. These input function changes were not simply caused by an effect on MABP, but possibly involved the complex effects of L-NAME on vascular resistance in the brain and other organs. The important implications of input function modifications for accurate measurements of CBV and CBF were illustrated by calculating their changes after L-NAME injection.
Footnotes
Abbreviations used
Acknowledgements
We thank Douglas Barstow, Dr. Pitchaiah Mandava, Bernard Kim, Charmaine Rea, and Benoit Leroy for their technical help; and Tatsuo Uchida, MA, Office of Biostatistics, University of Texas Medical Branch, for important statistical advice.