
Abstract
Knowledge about the topological and structural heterogeneity of the microvasculature is important for diagnosis and monitoring of glioma. A vessel caliber and type-dependent temporal shift in the magnetic resonance imaging signal forms the basis for vascular architecture mapping. This study introduced a clinically feasible approach for assessment of vascular pathologies in gliomas using vascular architecture mapping. Sixty consecutive patients with known or suspected gliomas were examined using vascular architecture mapping as part of the routine magnetic resonance imaging protocol. Maps of microvessel radius and density, which adapted to the vasculature-dependent temporal shift phenomenon, were calculated using a costume-made software tool. Microvessel radius and density were moderately to severely elevated in a heterogeneous, inversely correlated pattern within high-grade gliomas. Additionally, three new imaging biomarkers were introduced: Microvessel type indicator allowing differentiation between supplying arterial and draining venous microvasculature in high-grade gliomas. Vascular-induced bolus peak time shift may presumably be sensitive for early neovascularization in the infiltration zone. Surprisingly, curvature showed significant changes in peritumoral vasogenic edema which correlated with neovascularization in the tumor core of high-grade gliomas. These new magnetic resonance imaging biomarkers give insights into complexity and heterogeneity of vascular changes in glioma; however, histological validations in more well-defined patient populations are required.
Introduction
Gliomas comprise a group of tumors that originate from glial cells in the central nervous system (CNS). High-grade gliomas (HGGs) include anaplastic glioma (WHO grade III) and glioblastoma (GBM, WHO grade IV), which are the most common and aggressive form of glioma with a median survival of only 14 months. 1 GBMs are among the most vascularized of all solid tumors, and vascular proliferation is a pathological hallmark of HGGs. 2 Tumor vessel formation, however, is highly defective, resulting in an abundant and aberrant vasculature with vessels of variable diameter, heterogeneous distribution, and increased blood–brain barrier (BBB) permeability. 3 Neovascularization in gliomas is of high clinical relevance as it correlates with biological aggressiveness, degree of malignancy, clinical recurrence, and the postoperative survival.4,5
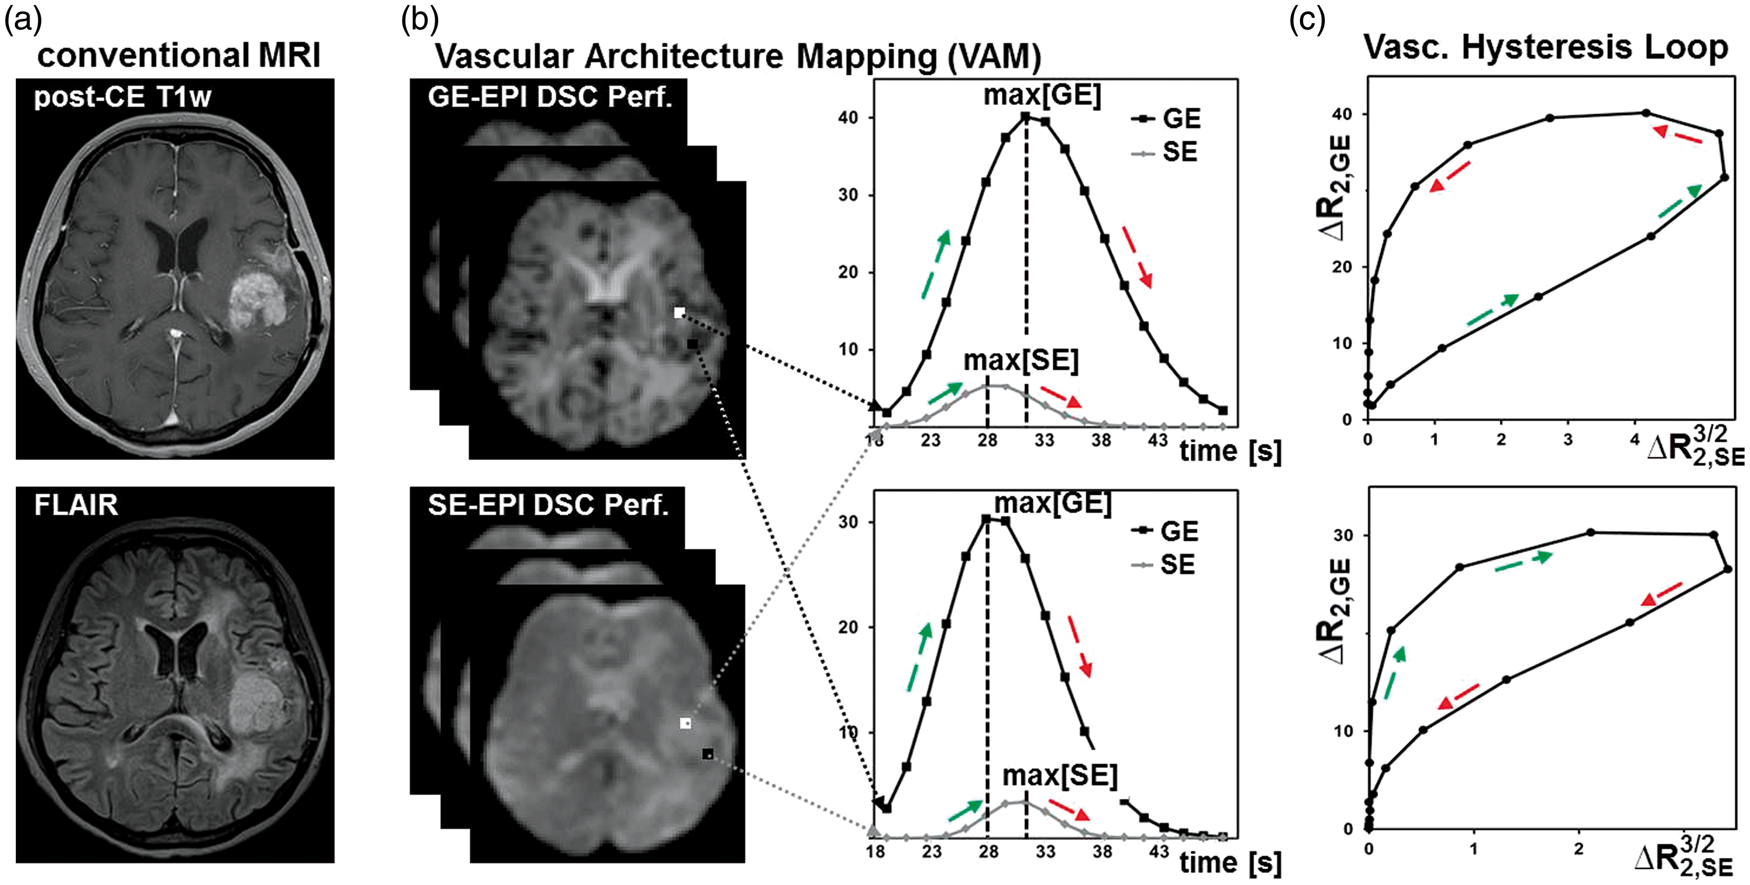
Magnetic resonance imaging (MRI) including measures of perfusion and blood volume is the modality of choice for the non-invasive examination of brain tumors. Computer simulations and experiments in animals and humans have demonstrated that more advanced MRI techniques can estimate microvascular vessel caliber, thereby providing further insight into tissue microvascularity.6–9 The physical basis for MR-based vessel caliber estimation is the different sensitivity of gradient-echo (GE) and spin echo (SE) MRI to magnetic susceptibility, i.e. the degree of magnetization induced in a material in response to an applied magnetic field.6–8 The highly susceptibility-sensitive GE signals are dominated by both microscopic and macroscopic vessels, whereas SE signals are predominantly sensitive to microscopic vessels (radius < 10 µm).6,10,11
Kiselev et al.
8
were the first who reported about a “loop” in the parametric plot of the relaxation rates for GE (
The aims of this study were threefold: (i) the development of an MRI sequence protocol for vascular architecture mapping (VAM) which is compatible to and practicable for clinical diagnosis; (ii) the introduction of new MR imaging biomarkers for the assessment of vascular pathologies in gliomas by development of novel evaluation strategies of VAM data; (iii) testing of the approach regarding feasibility and usefulness for the assessment of the microvascular architecture in a consecutive series of glioma patients in clinical routine.
Materials and methods
Patients
Patient demographics and diagnosis.
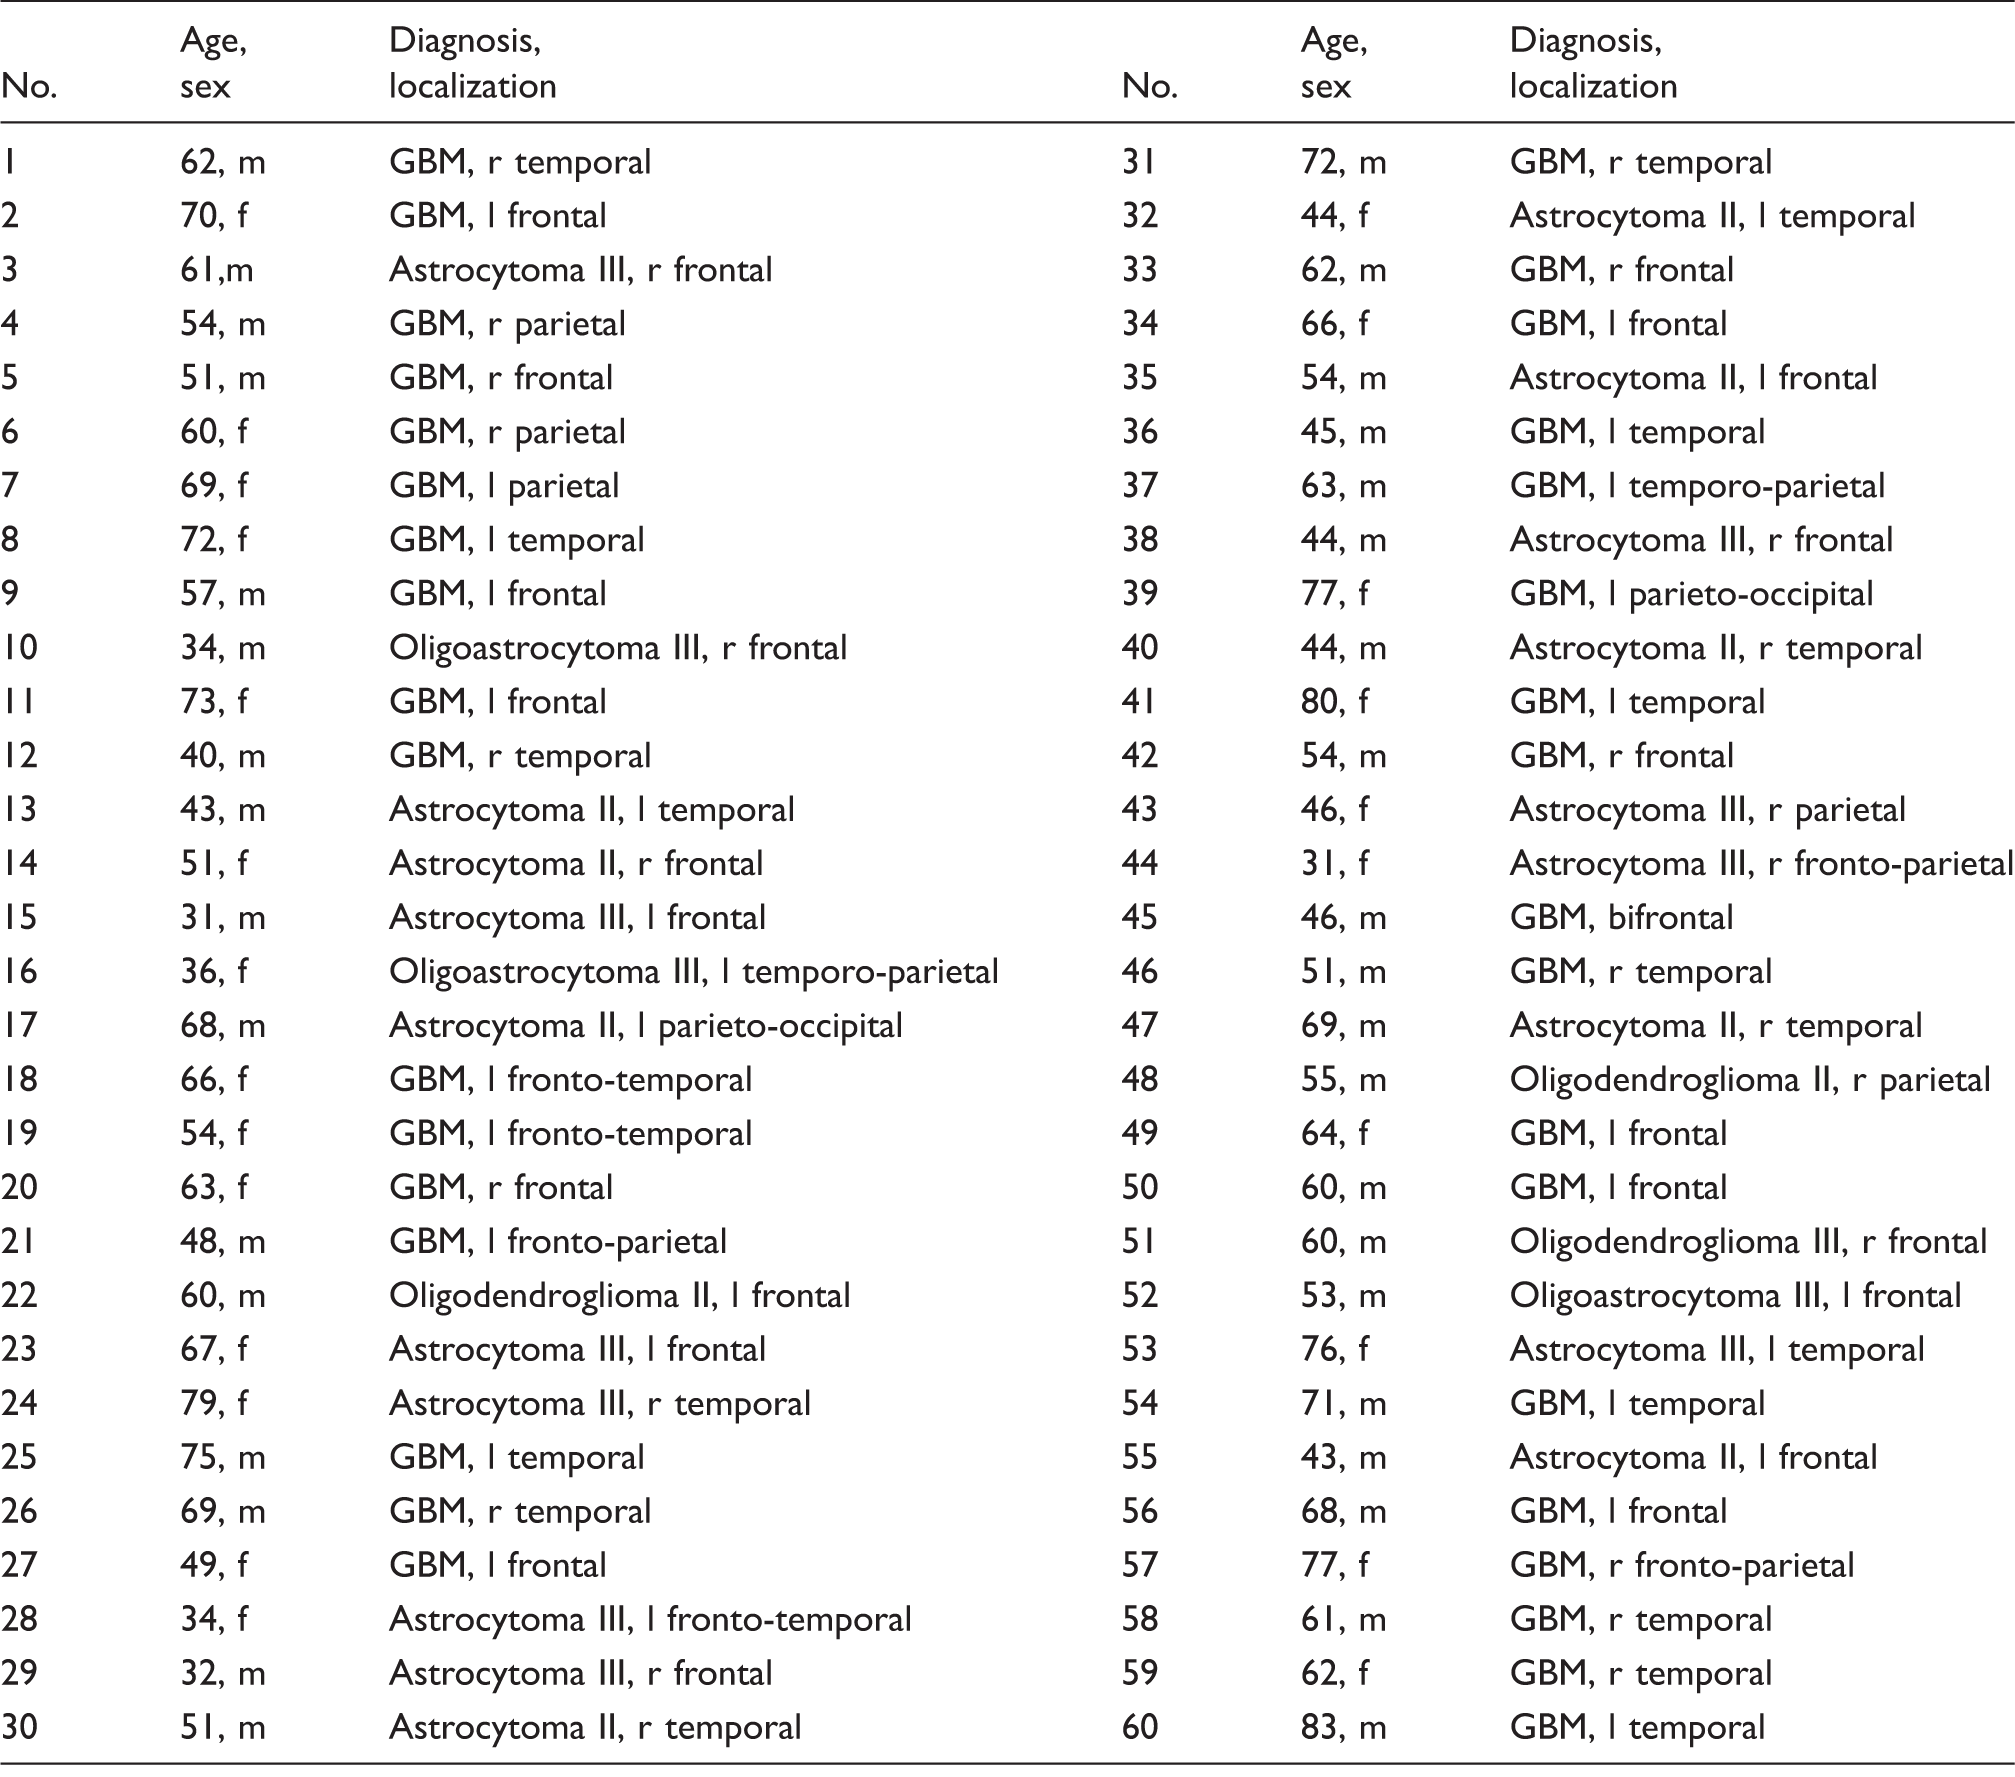
m: male; f: female; GBM: glioblastoma; r: right; l: left.
MR imaging
All MRI studies were performed on a 3 Tesla clinical scanner (Tim Trio, Siemens AG, Erlangen, Germany) equipped with a standard eight-channel head coil. The MRI protocol included an axial fluid-attenuated inversion-recovery (FLAIR) sequence (TR/TE/TI: 5000/460/1800 ms; in-plane resolution: 0.45 × 0.45 mm, slice thickness: 3 mm; 48 slices; 2 averages), a single-shot diffusion-weighted echo-planar imaging (DW-EPI) sequence (TR/TE: 5300/98 ms; in-plane resolution: 1.2 × 1.2 mm, slice thickness: 4 mm; 29 slices; 4 averages; parallel imaging using generalized autocalibrating partially parallel acquisition (GRAPPA) factor of 2, b-values of 0 and 1000 s/mm2), and a pre-contrast enhanced T1-weighted GE sequences (TR/TE: 250/2.8 ms; in-plane resolution: 0.5 × 0.5 mm, slice thickness: 4 mm; 29 slices; 2 averages).
For vessel architecture mapping, we used a dual contrast agent injections approach in order to obtain DSC perfusion MRI data using SE and GE EPI sequences with high signal-to-noise ratio (SNR), high spatial resolution, and coverage of the whole brain. However, patient motions between the two scans as well as differences in the time to first-pass peak may significantly affect the data evaluation.
13
To minimize the probability of these sources of error, we used the following strategies:
To prevent patient motion, special caution was made to properly fix the head and provide clear and repeated patient instructions before and during the MRI examination. Due to the fact that patient motions during or between the SE- and GE-EPI DSC perfusion scans may significantly affect a pixel-based analysis, we used the approach described by Hsu et al.
13
During data preprocessing, dynamic masks for the contours from the SE-EPI and GE-EPI perfusion raw data were created. By matching the contours, we checked for patient motion between and during the scans.
13
A mismatch of more than one pixel was defined as “severe patient motion” and the patient was excluded from the analysis. This was necessary in three patients as mentioned above. For the remaining patients we did not observe significant motions, i.e. contour mismatch was not more than one pixel, and thus no image coregistration was applied during data analysis. To prevent time differences of the first-pass peak signal between the contrast agent boluses, a peripheral pulse unit (PPU) was fitted to a finger of the patients in order to monitor heart rate and cardiac cycle. Special attention was paid to perform the two injections at the same heart rate and exactly at the same phase of the cardiac cycle (at PPU’s peak systole signal). Due to the fact that timing differences between the SE- and GE-EPI DSC perfusion scans may significantly affect a pixel-based analysis, we additionally checked for any error in injection timing. During data preprocessing the arterial input functions (AIFs) for the SE- and GE-EPI DSC perfusion data were verified for correct timing, i.e. were checked for differences in the time to peak (TTP) between the two AIFs. For all 56 patients, we did not observe differences between the SE- and GE-AIFs.
Geometric parameters (section orientation, angulation, field-of-view, etc.) and measurement parameters were chosen identical for the SE-EPI and GE-EPI DSC perfusion MRI sequences (TR: 1740 ms; in-plane resolution: 1.8 × 1.8 mm, note: SE-EPI were spatially interpolated to a 128 × 128 matrix to obtain this resolution; slice thickness: 4 mm; 29 slices; GRAPPA: 2; and 60 dynamic measurements) except for TE (33 ms for SE-EPI and 22 ms for GE-EPI). Both DSC perfusion MRI examinations were performed with administration of 0.1 mmol/kg-bodyweight gadoterate meglumine (Dotarem, Guerbet) at a rate of 4 ml/s using an MR-compatible injector (Spectris, Medrad) and with utmost caution for the injection time (see above). A 20 ml bolus of saline was injected subsequently at the same rate. The first DSC MRI was obtained by the SE-EPI technique since SE-EPI DSC perfusion MRI is less sensitive to CA leakage.15,16 Post-contrast-enhanced T1-weighted images in axial, sagittal, and coronal orientation were performed between two DSC perfusion MRI acquisitions. The total acquisition time of these three sequences was 8 min. Thereafter, the second DSC MRI was obtained using the GE-EPI technique during a bolus injection under the same conditions as for the SE-EPI DSC perfusion MRI acquisition.
MRI data processing
VAM analysis was performed using custom-made in-house software developed using MatLab (The MathWorks, Inc., Natick, MA). SE- and GE-EPI DSC perfusion MRI were loaded into the software tool and firstly checked for motion artefacts during or between the acquisitions by using the contour approach described above and by Hsu et al. 13 Next, AIFs for the SE- and GE-EPI DSC perfusion, MRI data were automatically identified, respectively, using a method described previously. 17
ΔR(t)2,SE and ΔR(t)2,GE were calculated from the signals of the SE and GE perfusion data using the following equation
Calculation of the vascular hysteresis loops. (a) Conventional MRIs of a 54-year-old female patient suffering from a recurrent glioma. (b) The principle of the VAM technique by using a dual contrast agent injections approach. (c) Calculation of 
MR imaging biomarkers of microvascular architecture
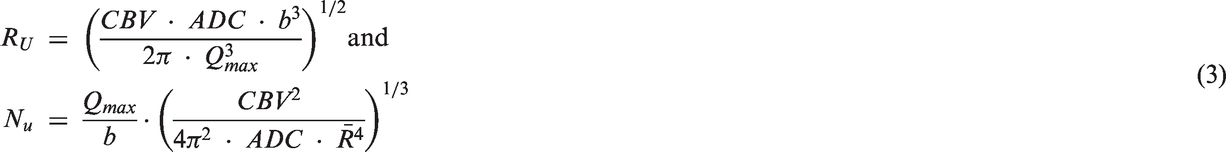
The VHL of each voxel was evaluated by the following five parameters: (i) microvessel radius (RU) and (ii) density (NU), which were adapted to the temporal shift phenomenon; as well as (iii) microvessel type indicator (MTI) as the signed area of the VHL; (iv) vascular-induced bolus peak time shift (VIPS) between the SE- and GE-EPI first passage bolus signal courses; and (v) the curvature (Curv) of the long-axis of the VHL.
Specifically, the new versions of the known parameters upper limit of microvessel radius (RU) and upper limit of microvessel density (NU)
21
were adapted to the temporal shift phenomenon between the SE- and GE-EPI DSC perfusion MRI signal time courses. With this in mind, we calculated in a first step a maximum Q-index
Calculation of the VAM biomarker. (a) Calculation of the upper limits for microvessel radius (RU) and density (NU) adapted to the temporal shift phenomenon. Calculation of (b) the microvessel type indicator (MTI), (c) vascular-induced peak shift (VIPS), and (d) the curvature (Curv) of the VHL. The color codes are depicted at the right image margins.
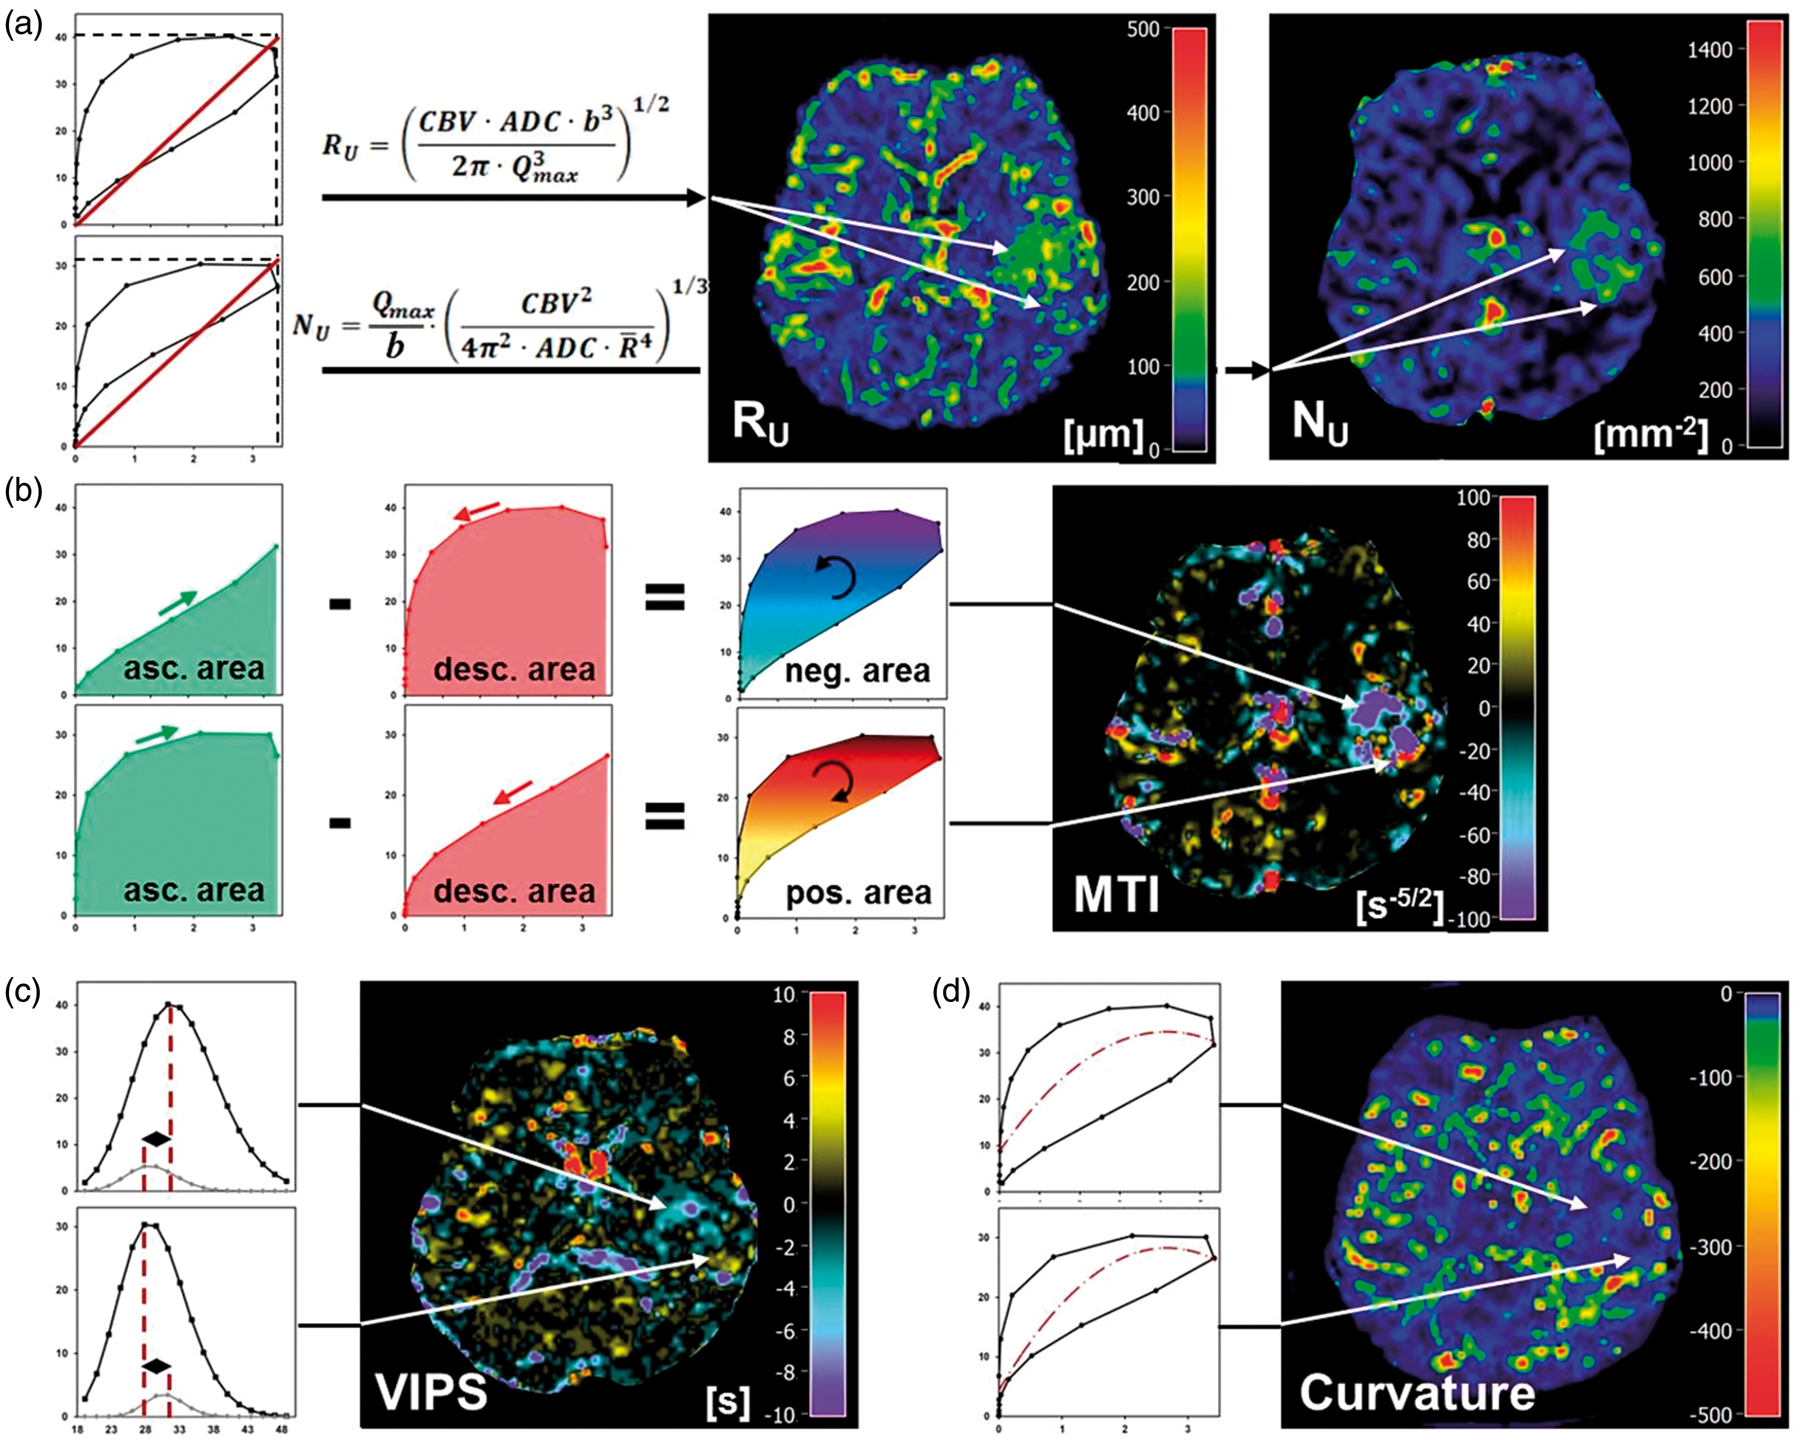
The Curv parameter was introduced to assess the shape of the VHL deviating from a symmetric ellipse which is associated with differences in the width of the GE- and SE-EPI perfusion boluses. The Curv values were calculated by fitting of the long-axis of the VHL with a quadratic polynomial followed by determination of the second derivative (Figure 2(d)).
Quantitative analysis
For quantitative analysis of the VAM approach in glioma patients, the mean MR imaging biomarker value within five regions of interest (ROI) was calculated. These ROIs were manually defined by a radiologist and an MR physicist in consensus for each patient based on features seen in the FLAIR and the contrast-enhanced T1-weighted images, respectively. ROIs were located in: (i) tumor core (for GBM: enhancing tumor region on CE T1-weighted MRI and for glioma WHO° III and II: hyperintense tumor region on FLAIR images); (ii) immediate peritumoral non-edematous tissue (predominantly gray matter); (iii) peritumoral edema (predominantly white matter); (iv) ipsilateral and (v) contralateral normal appearing brain tissue (iNAB and cNAB) of predominantly white matter. For GBM, we additionally defined ROIs in necrotic regions.
Statistics
Software (SPSS 14, IBM, Chicago, IL, USA) was used for statistical evaluation. Differences in VAM biomarkers between WHO grades were determined using analysis of variance (ANOVA). Additionally, a Dunnett-T3 test was used as post hoc procedure to be consistent with the assumption that homogeneity of variance was not met as well as for correction for multiple comparisons. Homogeneity of variance was tested using the Levene’s test. VAM biomarker values in lesions were compared with related values in peritumoral regions (non-edematous and edema) and NAB (ipsi- and contralateral) using a Wilcoxon signed-rank test. The Pearson’s correlation coefficient (R) was calculated as a measure of the strength of the linear relationship between two variables. P-values less than 0.05 were considered to indicate significance.
Results
Qualitative interpretation of VAM biomarker maps
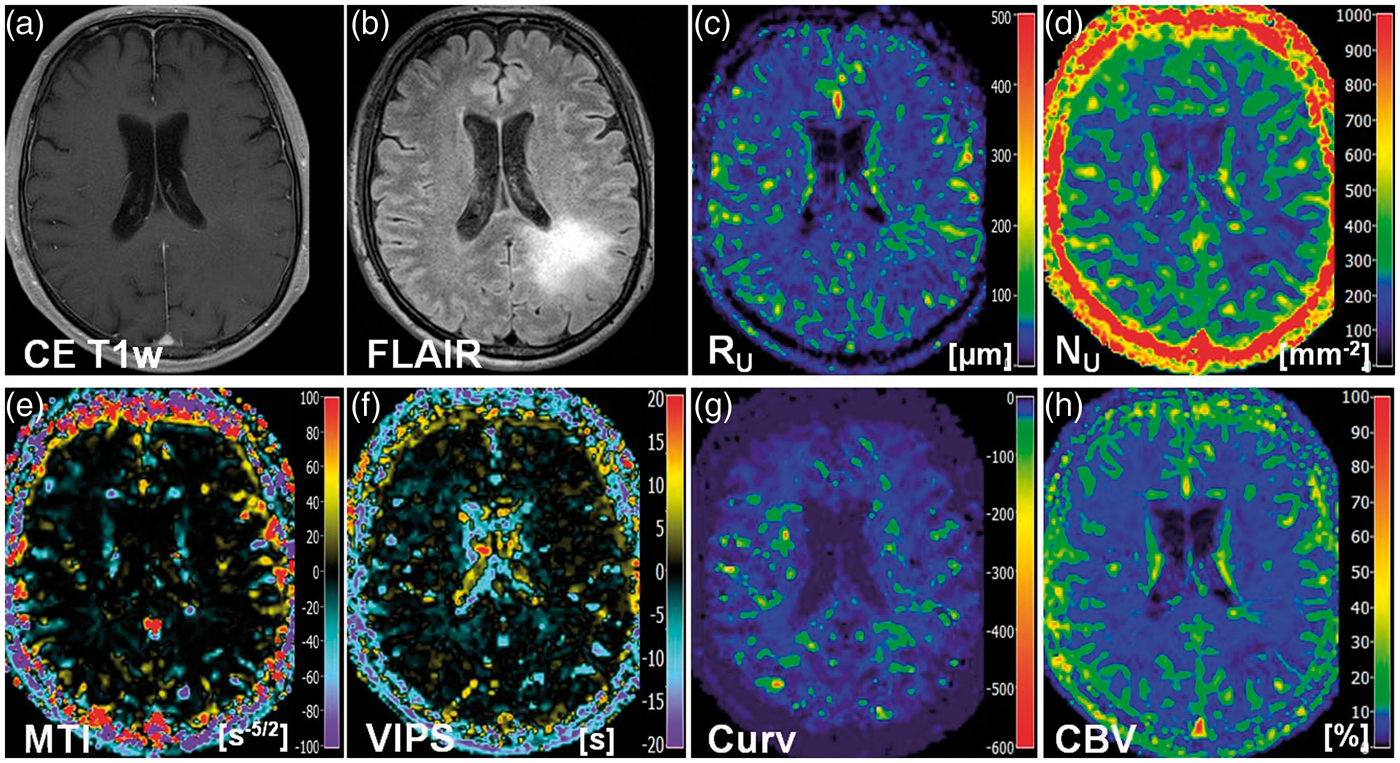
Maps of microvessel radius RU and microvessel density NU showed heterogeneous patterns of mildly to severely increased levels in anaplastic glioma and GBM. Areas with severely increased NU showed rather mildly increased to normal RU and vice versa, i.e. maps of RU and NU provided complementary information about the heterogeneity of the microvasculature in high-grade glioma (Figures 2(a), 3(c) and (d), 4(c) and (d)). In LGG, however, RU was found to be only moderately increased and NU values were even slightly decreased (Figure 5(c) and (d)).
Maps of the MTI were interpreted based on the findings of Emblem et al.
14
and Xu et al.
12
The VHL in a voxel of the VAM data set transverses in the counterclockwise direction if the vascular system in this voxel contains venule- and capillary-like vessel components,
14
i.e. in case of a relatively higher venous blood volume,
12
whereas the VHL transverses in clockwise direction if vascular system consist of arterioles and capillaries,
14
i.e. in case of relatively higher arterial blood volume.
12
Accordingly to our definition for the calculation of MTI values, a counterclockwise VHL-direction was associated with a negative signed VHL-area, i.e. a negative MTI, and vice-versa for the clockwise VHL-direction. In the MTI maps, negative MTI values were assigned to cool colors and positive to warm colors, respectively. Consequently, maps of MTI enabled differentiation between supplying arterial (areas with warm colors in Figures 2(b), 3(e), and 4(c)) and draining venous microvasculature (areas with cool colors in Figures 2(b), 3(e), and 4(c)) within high-grade glioma. More specifically, a voxel with high-arterial blood volume, for example shows a high positive MTI value (MTI > + 60) and an orange to red color in the MTI maps; a capillary voxel shows a very low MTI value around 0 ( − 5 < MTI < + 5) and a black color in the MTI maps; and a voxel with high venous blood volume shows a high, negative MTI value (MTI < − 60) and a purple color in the MTI maps. In line with the findings for LGG in the RU and NU maps, MTI maps showed no substantial changes compared to high-grade glioma and cNAB (Figure 5(e)).
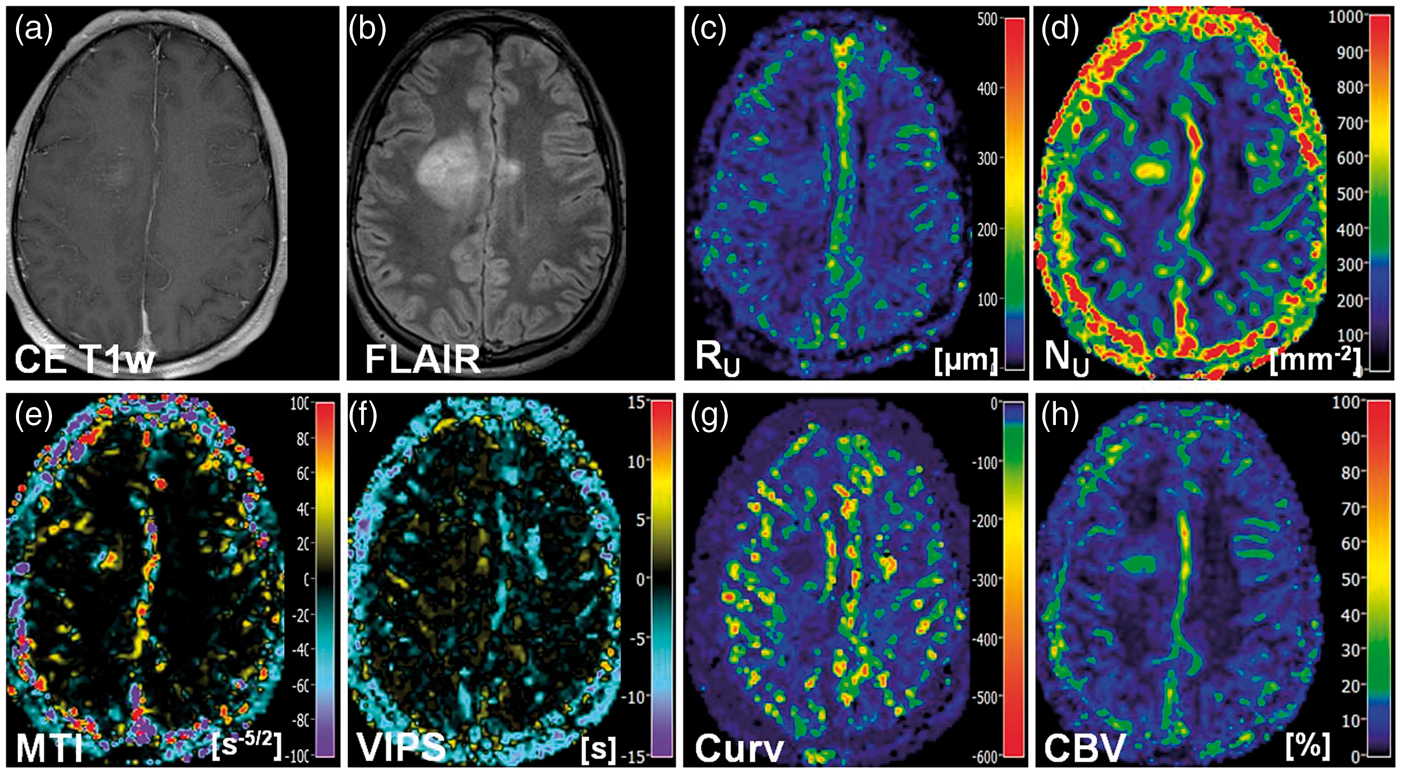
New VAM biomarkers for a 51-year-old male patient (no. 5 in Table 1) suffering from a recurrent glioblastoma. Conventional MR images of (a) contrast-enhanced T1-weighted and (b) FLAIR sequences. Maps of (c) the upper limit for microvessel radius (RU) and (d) density (NU), (e) the microvessel type indicator (MTI), the (f) vascular-induced peak shift (VIPS), (g) the curvature (Curv), and (h) the cerebral blood volume (CBV). The color codes are depicted at the right image margins. New VAM biomarkers for a 34-year-old male patient (no. 10 in Table 1) suffering from an oligoastrocytoma (WHO°III). Conventional MR images of (a) contrast-enhanced T1-weighted and (b) FLAIR sequences. Maps of (c) the upper limit for microvessel radius (RU) and (d) density (NU), (e) the microvessel type indicator (MTI), the (f) vascular-induced peak shift (VIPS), (g) the curvature (Curv), and (h) the cerebral blood volume (CBV). The color codes are depicted at the right image margins. New VAM biomarkers for a 68-year-old male patient (no. 17 in Table 1) suffering from an astrocytoma (WHO°II). Conventional MR images of (a) contrast-enhanced T1-weighted and (b) FLAIR sequences. Maps of (c) the upper limit for microvessel radius (RU) and (d) density (NU), (e) the microvessel type indicator (MTI), the (f) vascular-induced peak shift (VIPS), (g) the curvature (Curv), and (h) the cerebral blood volume (CBV). The color codes are depicted at the right image margins.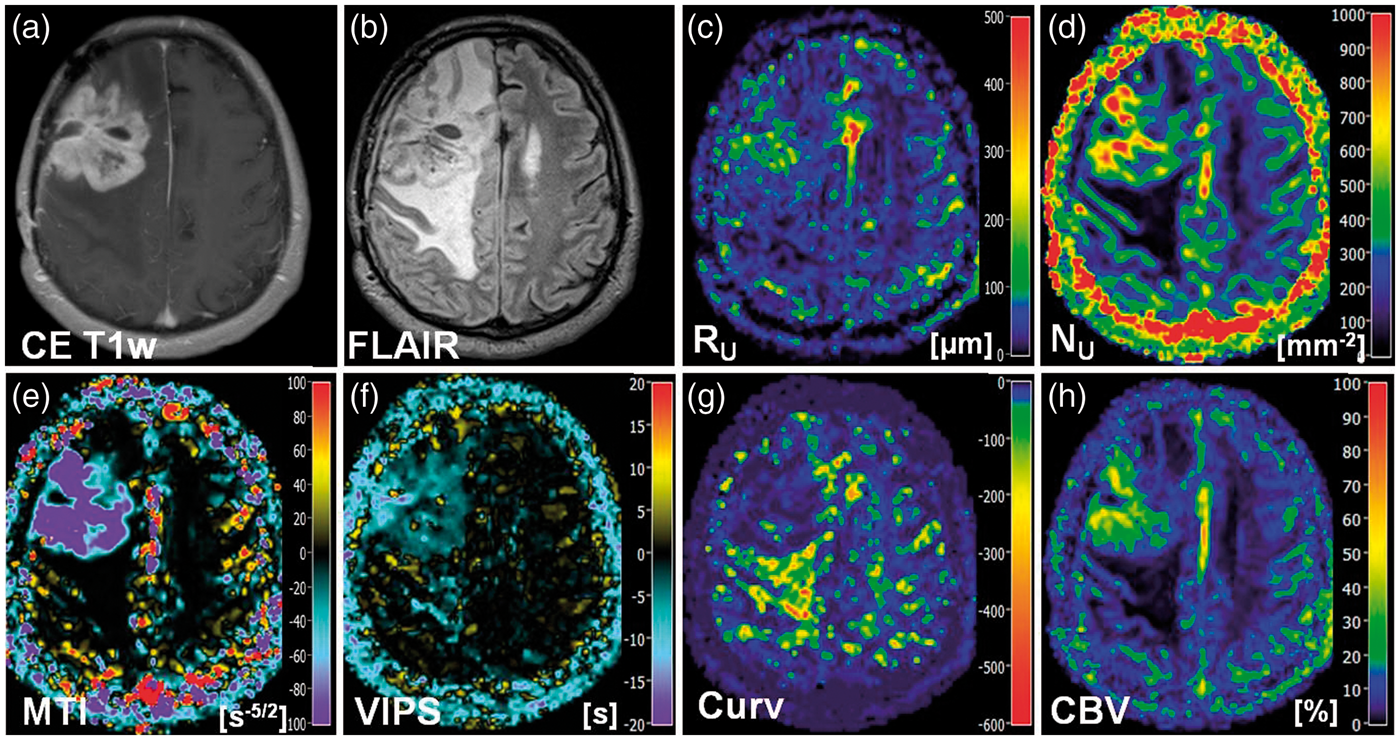
The interpretation of the maps of the vascular-induced peak shift (VIPS) was also based on the findings of Emblem et al. 14 In areas with slower blood flow velocities, e.g. venules and capillaries, the SE-EPI perfusion signal peaks earlier than the GE-EPI perfusion signal. Based on our definition, this corresponded to a negative VIPS value and vice-versa for arteriole-dominated microvasculature with faster blood flow velocities. In the VIPS maps, similarly to MTI, negative VIPS values were assigned to cool colors and positive to warm colors, respectively. VIPS provided additional information to MTI about microvessel type especially at the tumor periphery. Presumably, VIPS is more sensitive to early neovascularization activity in areas in the infiltration zone characterized by a blood supply still within the normal volume range. VIPS, as a time-based parameter, is less sensitive to blood volume unlike MTI. The changes in MTI and VIPS in combination extended the contrast-enhancing tumor areas.
The Curv parameter showed almost exclusively negative values. Curv values in the tumor core of HGG (WHO grade III and IV) were similar compared to ipsi- and contralateral NAB. Curv was moderately decreased, i.e. showed moderately larger negative values, in peritumoral non-edematous tissue and was severely decreased, i.e. showed severely larger negative values, in peritumoral vasogenic edema. LGG, however, showed slightly decreased Curv values in the tumor core and in the peritumoral structures (non-edematous tissue and edema) when compared to ipsi- and contralateral NAB.
Quantitative evaluation of VAM biomarkers
ROI-based quantitative analysis revealed that RU, NU, and Curv were significantly increased (P-value range: < 0.001 to 0.013) and MTI and VIPS were significantly decreased (all P-values < 0.001) in the tumor core of GBM compared to peritumoral regions (non-edematous and edema) and ipsi- and contralateral NAB (red boxes in Figure 6). For anaplastic tumor core (HGGs), we found similar results for NU and MTI only (P-value range: 0.001 to 0.019). RU and Curv were significantly increased to peritumoral edema (P = 0.004 and 0.001) and ipsi- and contralateral NAB (P-value range: 0.001 to 0.038) but not to peritumoral non-edematous tissue (yellow boxes in Figure 6). VIPS was significantly decreased to ipsi- and contralateral NAB only (P = 0.008 and 0.019). Curv values in edema were significantly decreased compared to all other evaluated brain regions for GBM and anaplastic glioma WHO grade III (P = 0.001 to 0.01). For LGG, however, RU was increased as well as NU and Curv were decreased in the tumor core compared to ipsi- and contralateral NAB (green boxes in Figure 6), but these changes did not reach significance (P-value range: 0.05 to 0.131). All other parameter showed also no significant differences between brain regions in LGG. Interestingly, we found positive linear correlations between MTI and VIPS values in tumor core and the Curv values in peritumoral vasogenic edema of GBM (MTI: R = 0.756, P < 0.001; and VIPS: R = 0.608, P < 0.001) and anaplastic glioma WHO grade III (MTI: R = 0.737, P = 0.003; and VIPS: R = 0.558, P = 0.038). This might be interpreted as a relationship between the extent of neovascularization in the tumor and microvascular changes in edema, i.e. possibly severity of edema. LGGs showed no significant correlations.
Box-whisker plots (whiskers: minimum, maximum; box: 25th to 75th percentile; line: mean value) for (top-down) the upper limit for microvessel radius (RU) and density (NU), the microvessel type indicator (MTI), the vascular-induced peak shift (VIPS), and the curvature (Curv) in (left-right) necrosis (only for glioblastoma), tumor core; immediate peritumoral non-edematous tissue, peritumoral edema; ipsilateral and contralateral normal appearing brain tissue (iNAB and cNAB) of predominantly white matter. Note: green boxes for low-grade glioma WHO grade II, yellow boxes for anaplastic glioma WHO grade III, and red boxes for glioblastoma WHO grade IV.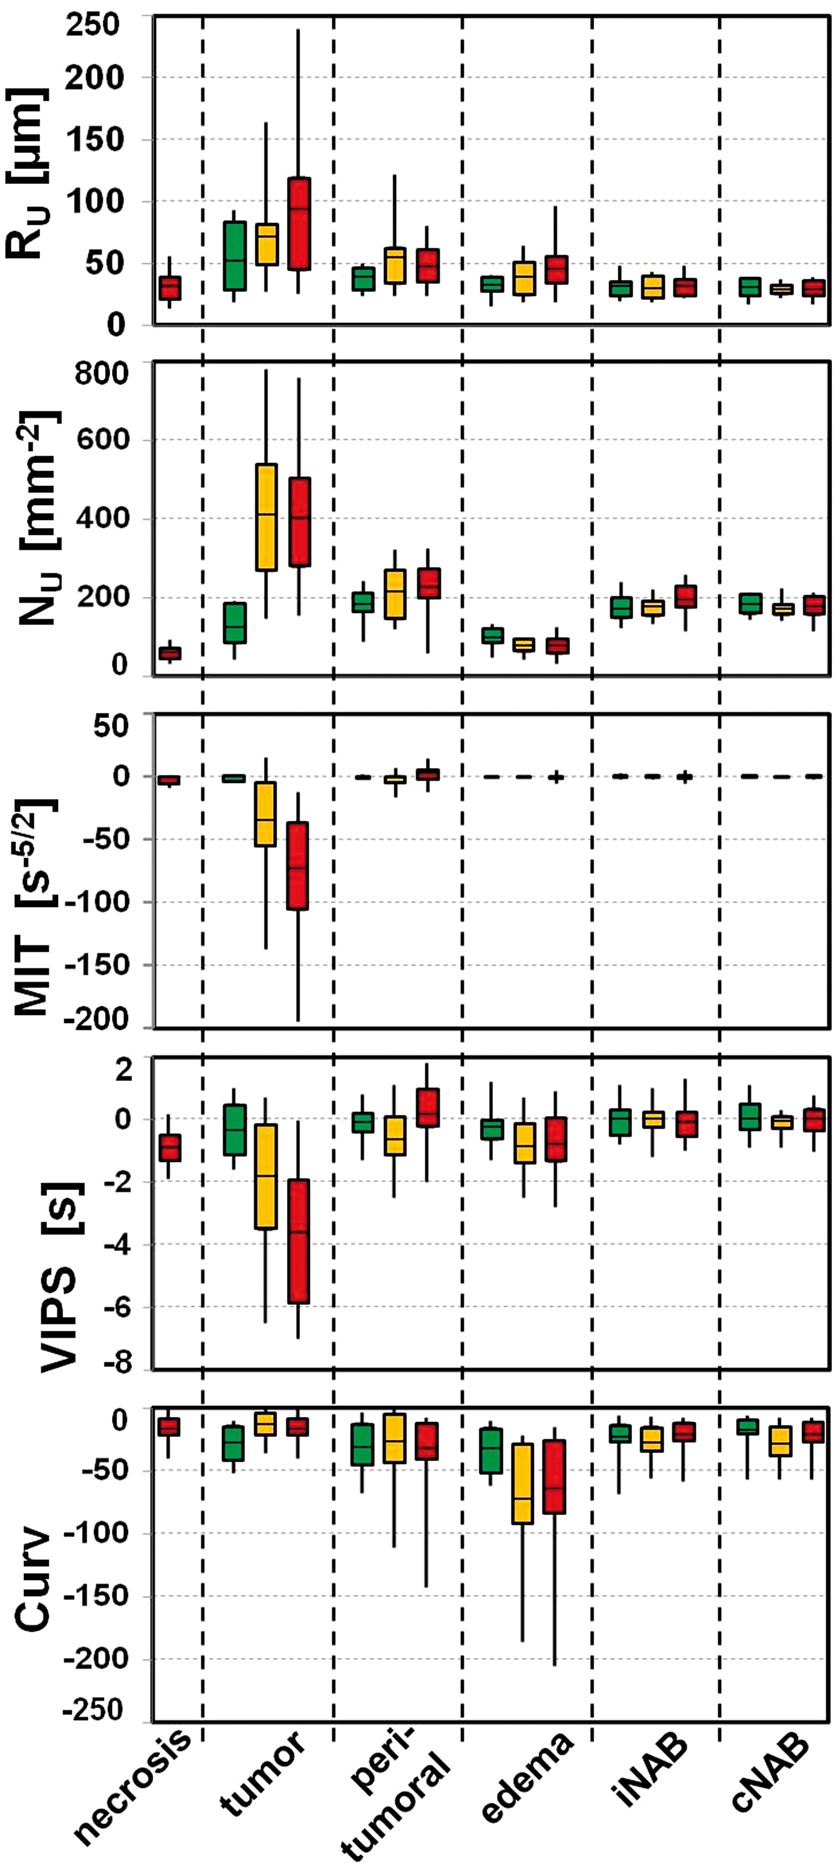
Overview of the quantitative evaluation of the VAM biomarkers.
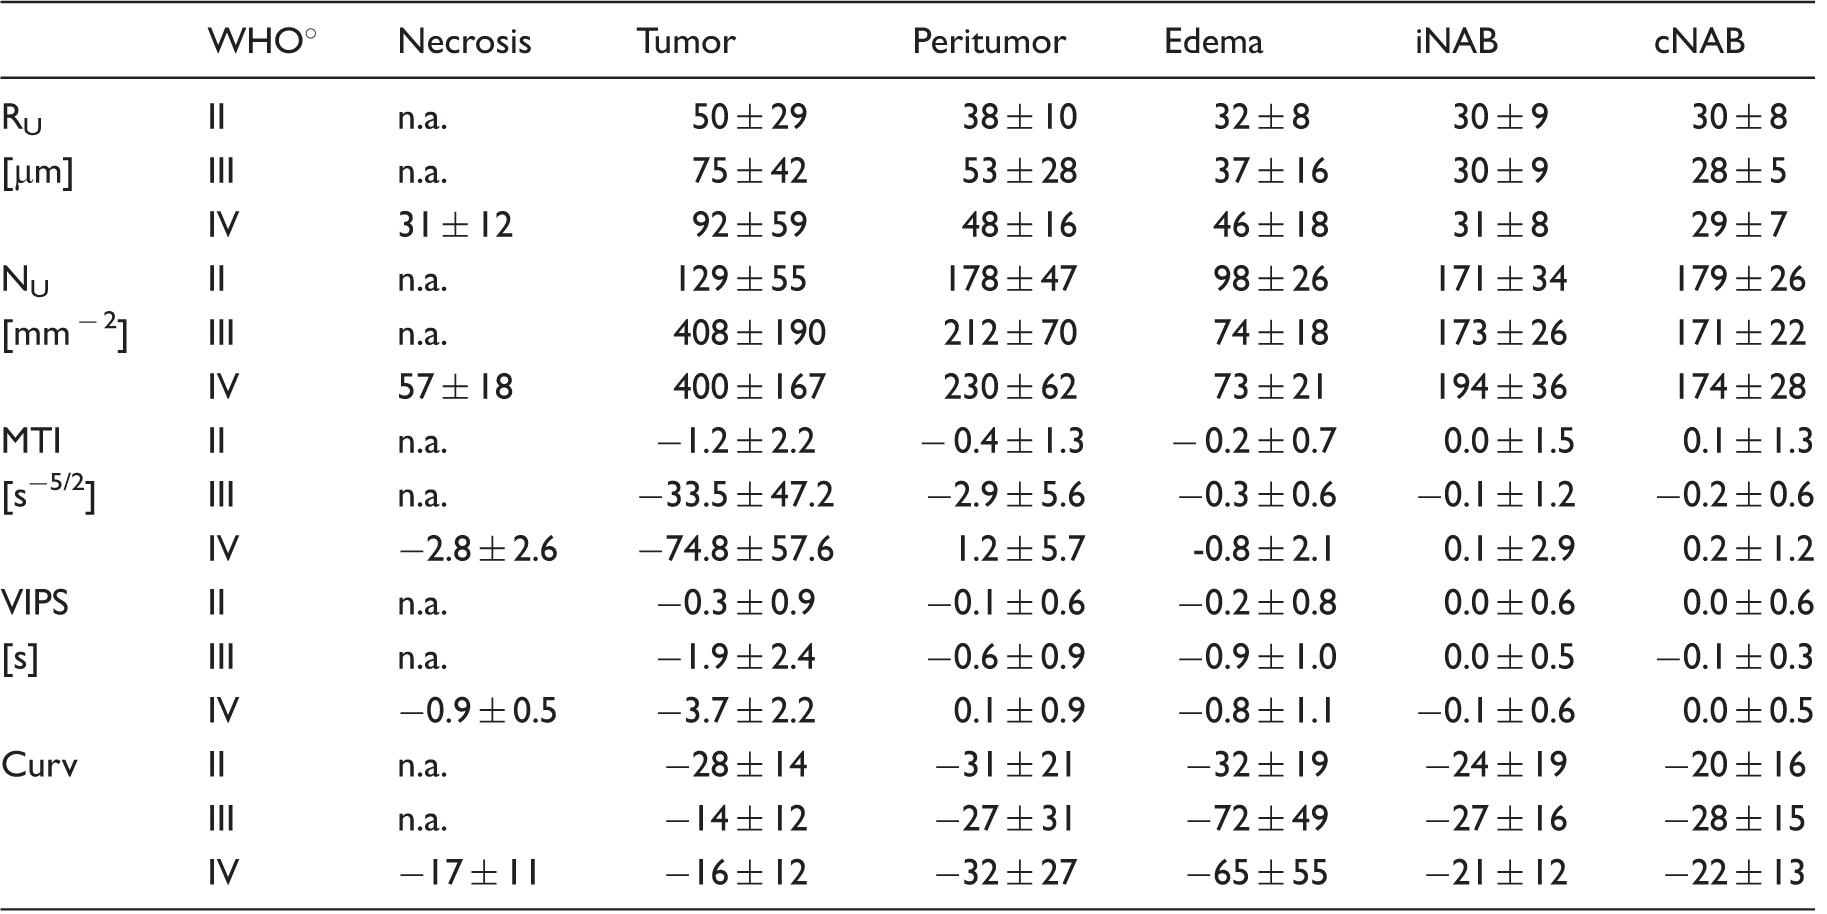
RU: upper limit for microvessel radius; NU: sdensity; MTI: microvessel type indicator; VIPS: vascular-induced peak shift; Curv: curvature; iNAB and cNAB: ipsilateral and contralateral normal appearing brain tissue.
Discussion
In this study, we developed an approach for assessment of microvascular architecture in glioma which is compatible to and applicable in clinical routine. By using two separate DSC perfusion MRI sequences (GE-EPI and SE-EPI) in combination with a dual contrast agent injections approach, 13 we were able to ensure that the DSC perfusion MRI sequence (GE-EPI), which is essential for clinical brain MRI, was kept unchanged regarding spatial and temporal resolution. We additionally introduced new VAM biomarkers (MTI, VIPS, and Curv) and adapted known parameters (RU and NU) 21 to the temporal shift phenomenon by development of a dedicated software tool. Finally, our VAM approach was tested in 60 consecutive glioma patients and an initial quantitative analysis was performed.
The compatibility and applicability of our approach were demonstrated since VAM data of good quality were obtained from over 94% of the consecutively recruited patient cohort. Furthermore, it was well accepted by both the staff and the patients. The use of the PPU, for example, did not increase the complexity of the procedure in clinical routine. The positioning of the PPU took only few seconds and had the side benefit that the patients kept still than without a PPU. The VAM biomarker maps provided a complementary insight into the heterogeneous structure of the microvasculature pathologies in glioma as consequence to angiogenetic activities initiated by the lesions. Microvessel radius RU and density NU were found to be inversely related, i.e. microvasculature in tumor areas showed vessels with small lumen and high density or with larger lumen and lower density. Statistical evaluation, however, did not reveal a significant negative correlation between RU and NU in the tumor core because the biomarker values for the tumor core were averaged over one large ROI during this initial quantitative analysis. Consequently, the heterogeneity of the vasculature within the tumor core as demonstrated in the RU and NU maps for high-grade glioma was not considered. MTI and VIPS maps color-coded with warm to cool colors enable differentiation of vessel type (arterioles/capillaries/venules) and might thus allow for detection of early neovascularization activity in the tumor periphery, respectively. MTI values are sensitive to both the blood volume and the vascular architecture-induced temporal shift between the SE- and GE-perfusion MRI signals. In lesions with marked hyperperfusion, the MTI maps are dominated by the strongly increased blood volume. VIPS, on the other hand, is a time-based parameter and is, therefore, less sensitive to blood volume. Based on our findings, we suppose that VIPS might be more sensitive to minor changes occurring during the early stages of neovascularization such as vascular co-option by infiltrative tumor cells.
The features of the Curv parameter, however, were surprising and unexpected. Curv values in peritumoral vasogenic edema of high-grade glioma (WHO grade III and IV) were significantly decreased compared to normal brain regions (iNAB and cNAB) as well as to tumor. Furthermore, the Curv values in peritumoral edema of HGGs correlated with both the MTI and the VIPS values in the tumor core of these lesions. These findings may be an indication for an interrelationship between the degree of neovascularization in the tumor, the severity of breakdown of the tight endothelial junctions that make up the BBB, and changes in tissue structure or microvasculature in peritumoral vasogenic edema. 3 The Curv parameter might be a marker for the severity of vasogenic edema. However, there is no verified scientific basis for an interrelationship. Correlations with DTI data, histologic parameters, and Monte Carlo simulations for VHL formation could be informative.
Comparisons regarding WHO grade revealed significant differences in the mechanism of glioma-associated neovascularization between low- and high-grade glioma. While LGGs grow along preexisting vessels via vascular co-option, HGGs start to generate own tumor vessels in the process of growing. Vascular co-option is the first mechanism by which gliomas achieve their vasculature, e.g. in LGGs or in the infiltration zone of HGGs. Vascular co-option is followed by the development of new vessels in HGGs via four additional mechanisms of neovascularization which are known as angiogenesis, vasculogenesis, vascular mimicry, and transdifferentiation. 1 Our results are in line with the known fact that neovascularization is a key characteristic that distinguishes low- and HGGs, i.e. it is absent in LGGs, but prolific in HGGs, providing the tumor with ample blood supply for exponential growth. 22
This study has several limitations. First of all, the dual contrast agent injections approach in combination with two separate SE and GE DSC acquisitions is significantly more sensitive to both patient motions and variations in injection timing compared to the single GE-SE double echo EPI sequence, which was used in the most previous studies. Our developed strategies help to minimize the probability of these sources of error but cannot eliminate them entirely, however. A comparison and validation of our motion correction scheme using brain contours 13 with available freeware like statistical parametric mapping (SPM) 23 are necessary. Furthermore, the injection of a double dose of contrast agent with two separate injections is required.
However, the application of separate SE and GE DSC sequences allowing the acquisition of VAM data with high SNR, high spatial resolution, and coverage of the whole brain because the entire EPI train is exclusively available for GE- or SE-EPI DSC data collection, respectively. For the combined, parallel GE-SE perfusion the EPI acquisition is shared between GE and SE perfusion data. This limits coverage and resolution or SNR. Both, a high in-plane resolution and the coverage of the whole brain are mandatory for routine GE-EPI perfusion. These features are especially important for detection of small or multi-centric lesions. The combined parallel GE-SE perfusion sequence used in previous studies,14,24–26 however, does not meet these requirements due to insufficient spatial coverage (too few or too thick slices) or resolution (too small matrix size). This may necessitate performing the routine GE perfusion in addition or in a separate study, which consequently requires a further contrast agent injection. Additionally, most studies published so far used a double dose for the combined GE-SE perfusion8,14,24,25 and/or applied a second injection for DCE perfusion14,24,26 or correction of leakage effects. 25 This resulted in the application of up to a triple-dose. The efforts to upgrade the combined GE-SE perfusion sequence with the promising Simultaneous MultiSlice (SMS) technique for full coverage 27 may help to overcome these limitations. The interpolation to the target resolution, which potentially influences the magnitude of the measured susceptibility effect, and the short TE, which reduces contrast agent sensitivity and hence SNR, of the SE-EPI perfusion sequence are a further limitations. An increasing of the acquisition matrix would dramatically increase TR and consequently the temporal resolution. This is also true for a longer TE. The accuracy of the hysteresis quantification, however, is critically dependent on a high temporal resolution. Finally, validations of the biomarkers are required to enable rational interpretation.
In Conclusion, this study introduced new MRI biomarkers for clinical routine assessment of microvascular architecture in glioma. The VAM biomarker maps provided insights into the complexity and heterogeneity of vascular changes in brain tumors. However, investigations in more well-defined patient populations, histological validations, and more costly evaluations are required considering the heterogeneity of the vasculature especially in high-grade glioma.
Footnotes
Funding
The author(s) disclosed receipt of the following financial support for the research, authorship, and/or publication of this article: This work was supported by the German Research Foundation (Deutsche Forschungsgemeinschaft – DFG; Grant Numbers STA 1331/3-1 and DO 721/8-1) and by the ELAN program (Erlanger Leistungsbezogene Anschubfinanzierung und Nachwuchsförderung; Grant Number 14-05-21-1-Stadlbauer).
Declaration of conflicting interests
The author(s) declared no potential conflicts of interest with respect to the research, authorship, and/or publication of this article.
Authors’ contributions
AS, GH, AD, MB, and KR conceived the study. AS and MZ involved in analysis of data. AS and MZ contributed to the development of the MRI biomarkers of microvascular architecture. AS, GH, AD, and KR involved interpretation of data. AS, GH, and SO contributed to acquisition of data. All authors reviewed the manuscript critically for intellectual content, and read and approved the final manuscript.