
Abstract
The single photon emission computed tomography (SPECT) radiotracer [123I]iomazenil is used to assess benzodiazepine receptor binding parameters. These measurements are relative indices of benzodiazepine receptor concentration (B′max). To evaluate the ability of such indices in accurately accessing the B′max the authors compared them with absolute values of B′max, measured using positron emission tomography (PET). The authors performed SPECT, PET, and magnetic resonance imaging (MRI) studies on a group composed of seven subjects. For SPECT studies, the authors administered a single injection of [123I]iomazenil and estimated the total and specific distribution volumes (DVT SPECT, DVS SPECT) and the binding potential (BP) using unconstrained (BPSPECT) and constrained (BPC SPECT) compartmental models. For PET studies, the authors used a multiinjection approach with [11C]flumazenil and unlabeled flumazenil to estimate absolute values of receptor concentration, B′max, and some other binding parameters. The authors studied the correlation of different binding parameters with B′max. To study the robustness of the binding parameter measurements at the pixel level, the authors applied a wavelet-based filter to improve signal-to-noise ratio of time-concentration curves, and the calculated kinetic parameters were used to build up parametric images. For PET data, the B′max and the DVPET were highly correlated (r = 0.988). This confirms that it is possible to use the DVPET to access benzodiazepine receptor density. For SPECT data, the correlation between DVSPECT estimated using a two-and three-compartment model was also high (r = 0.999). The DVT SPECT and BPC SPECT parameters estimated with a constrained three-compartment model or the DVT″SPECT parameter estimated with a two-compartment model were also highly correlated to the B′max parameter estimated with PET. Finally, the robustness of the binding parameters allowed the authors to build pixel-by-pixel parametric images using SPECT data.
The central benzodiazepine site is an integral part of the gamma-aminobutyric acid (GABA) supramolecular receptor complex that plays a regulatory role on GABA-mediated neurotransmission (Schoch et al., 1985; Haefely, 1985a, 1985b). Most GABA neurotransmission studies in vivo in the human brain have been performed using positron emission tomography (PET) and [11C]flumazenil (FMZ), an antagonist of the benzodiazepine receptors. Various quantitative methods have been developed with PET to measure the density (B′max) and affinity (Kd) of the benzodiazepine receptors (Pappata et al., 1988; Persson et al., 1989; Abadie et al., 1992; Lassen et al., 1995; Delforge et al., 1995). However, the main drawbacks of these quantitative methods are the relatively long durations required and the complexity of experiments, which require several injections of radioligands at different specific activities and the use of an arterial catheter for blood sampling. In addition to these quantitative methods, indirect approaches based on simplified models have been developed to calculate indices of B′max, such as the distribution volume (DV) or binding potential (BP) (Mintun et al., 1984; Koeppe et al., 1991).
Single photon emission tomography (SPECT), which can also map the benzodiazepine receptors using [123I]iomazenil, is considered less accurate than PET at providing absolute measures of biologic parameters. Only a few quantitative studies (mainly in primates) to measure B′max have been performed using this technique (Zoghbi et al., 1992; Laruelle et al., 1993, 1994a, Laruelle et al., 1994b). For the human brain, SPECT studies have used indirect approaches to access information on receptor density (Laruelle et al., 1994a, 1994b; Abi-Dargham et al., 1994, 1995).
Because SPECT is more readily available in clinical settings and is less expensive than PET, it would be helpful to determine the accuracy and the robustness of binding parameters estimated from SPECT data. Furthermore, SPECT protocols usually are simplified for routine clinical use, and binding parameters thus derived should be validated through comparison with PET data. In this regard, Westera et al. (1996) studied the DV for specific binding (DVs) from PET and SPECT data in the same subjects and found a good correlation between DVS PET and DVS SPECT values (r = 0.76). However, they did not compare measurements of DVs with absolute measures of B′max. This issue is important because deriving accurate receptor binding information from the DV depends largely on the pharmacokinetic properties of the tracer (Koeppe et al., 1991).
Another issue concerns the robustness of estimating SPECT binding parameters from the high noise level of SPECT data. To overcome this problem, large regions of interest (ROIs) have been used to estimate the binding parameters (Laruelle et al., 1994b; Abi-Dargham et al., 1994, 1995; Bremner et al., 2000), but parametric imaging studies for SPECT data, in which high noise levels can be critical, have not been developed.
The current study set out to measure PET and SPECT binding parameters, BP and DV, in the same subjects and to determine if these parameters accurately reproduce the absolute values of B′max. Furthermore, the authors investigated how these parameters allow for a robust pixel-by-pixel implementation, yielding images of binding parameters for analysis.
MATERIALS AND METHODS
Subjects
Seven normal subjects, aged 23 to 36 years (mean 27.4 ± 5.6), participated in the current study. Positron emission tomography and SPECT experiments were performed on all subjects within 2 to 3 months. All subjects gave informed consent before scanning. The study was performed with the approval of the Research Ethics Committee of Geneva Hospital.
Positron emission tomography experiments
The subject's head was positioned in a head holder so that transaxial slices were obtained parallel to the orbito-meatal line. Scan acquisitions were performed on a whole body scanner (ADVANCE, GE Medical System, Waukeska, WI, U.S.A.). The transaxial images of the brain were reconstructed using a filtered back-projection (128 × 128 matrix, 35 slices, 2.34 × 2.34 × 4.25 mm3 voxel size). Photon attenuation was corrected with a 10-minute transmission scan and data were corrected for decay.
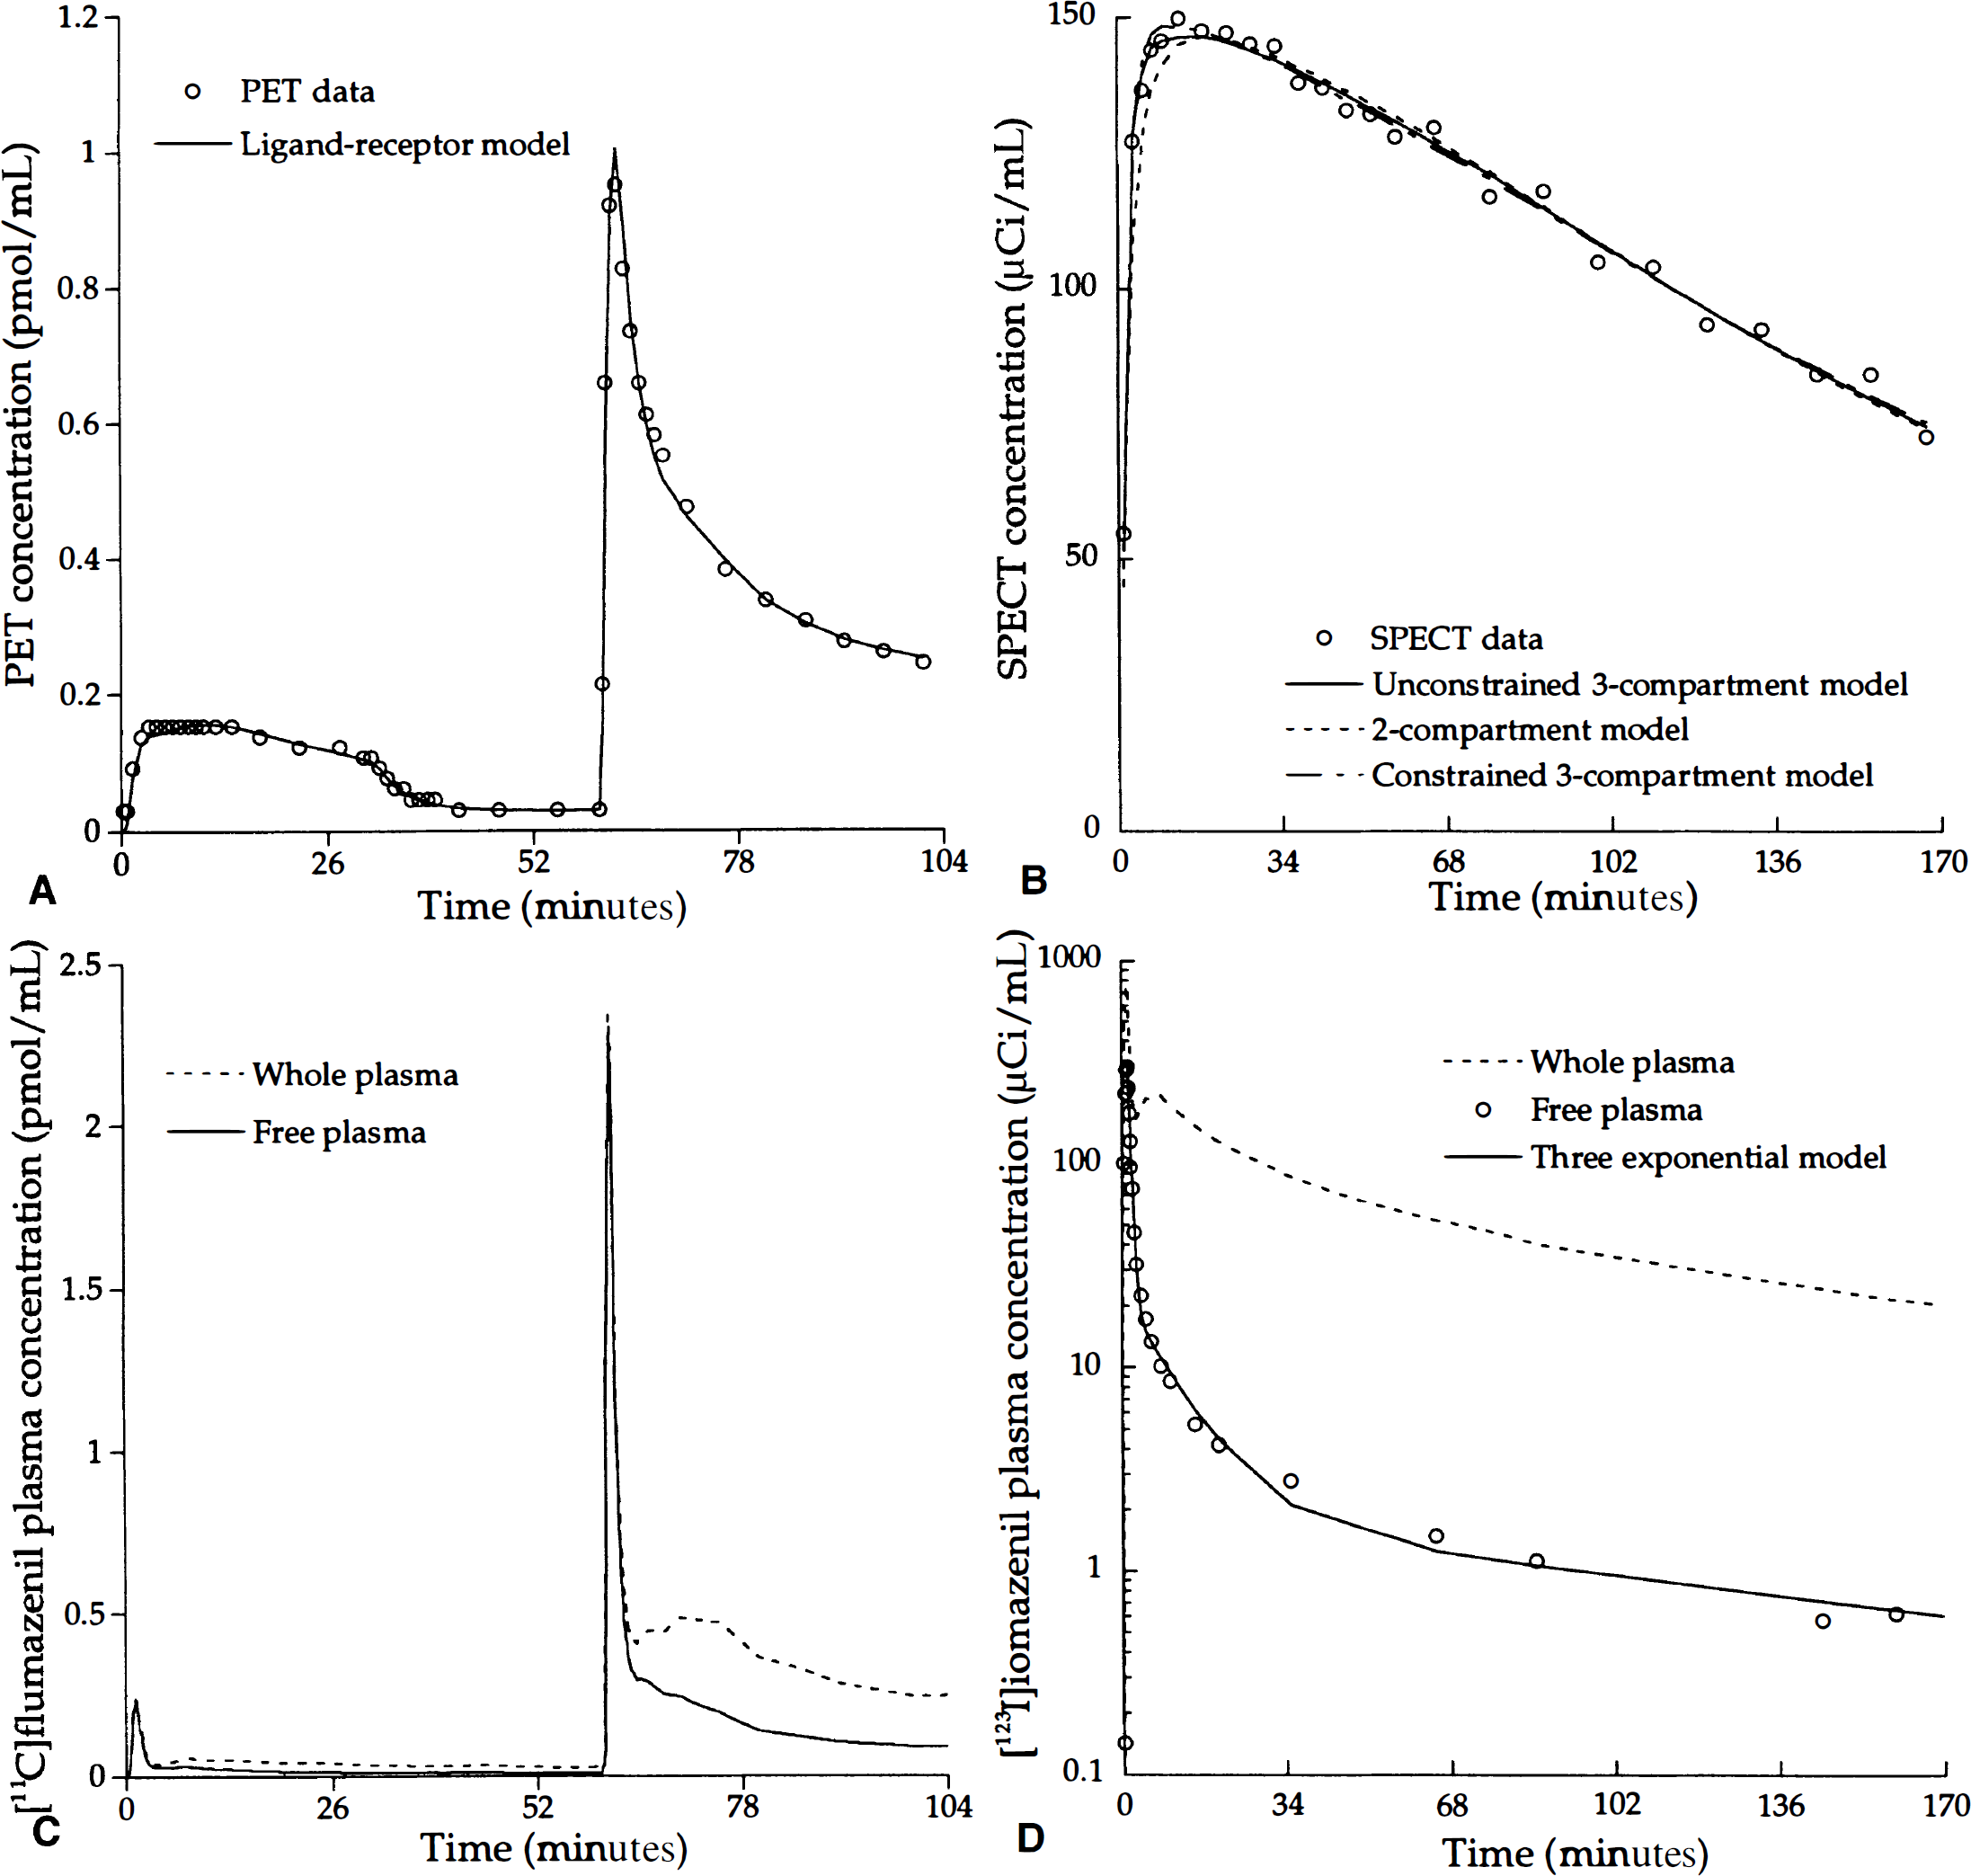
Positron emission tomography scanning experiments were performed using a three-injection protocol (tracer injection; unlabeled FMZ injection; coinjection of labeled and unlabeled FMZ) (Delforge et al., 1995) (Fig. 1A). An injection of approximately 4 mCi [11C]FMZ was given intravenously at the scan start time. At 30 minutes, an intravenous injection of 0.01 mg/kg of unlabeled ligand was administered (displacement injection). At 60 minutes, a mixture of labeled (4 mCi) and unlabeled flumazenil (0.02 mg/kg) was injected (coinjection). All injections were administered over a 1-minute period using an infusion pump. Details of injected doses and specific activities are listed in Table 1. A set of 48 sequential PET scans was obtained over 104 minutes according to the following protocol: 2 × 0.5 minutes; 10 × 1 minute; 2 × 2 minutes; 3 × 5 minutes; 10 × 1 minute; 2 × 5 minutes; 1 × 10 minutes; 4 × 0.5 minutes; 7 × 1 minutes; 7 × 5 minutes.
Numeric values of the PET and SPECT protocol parameters corresponding to the seven experiments
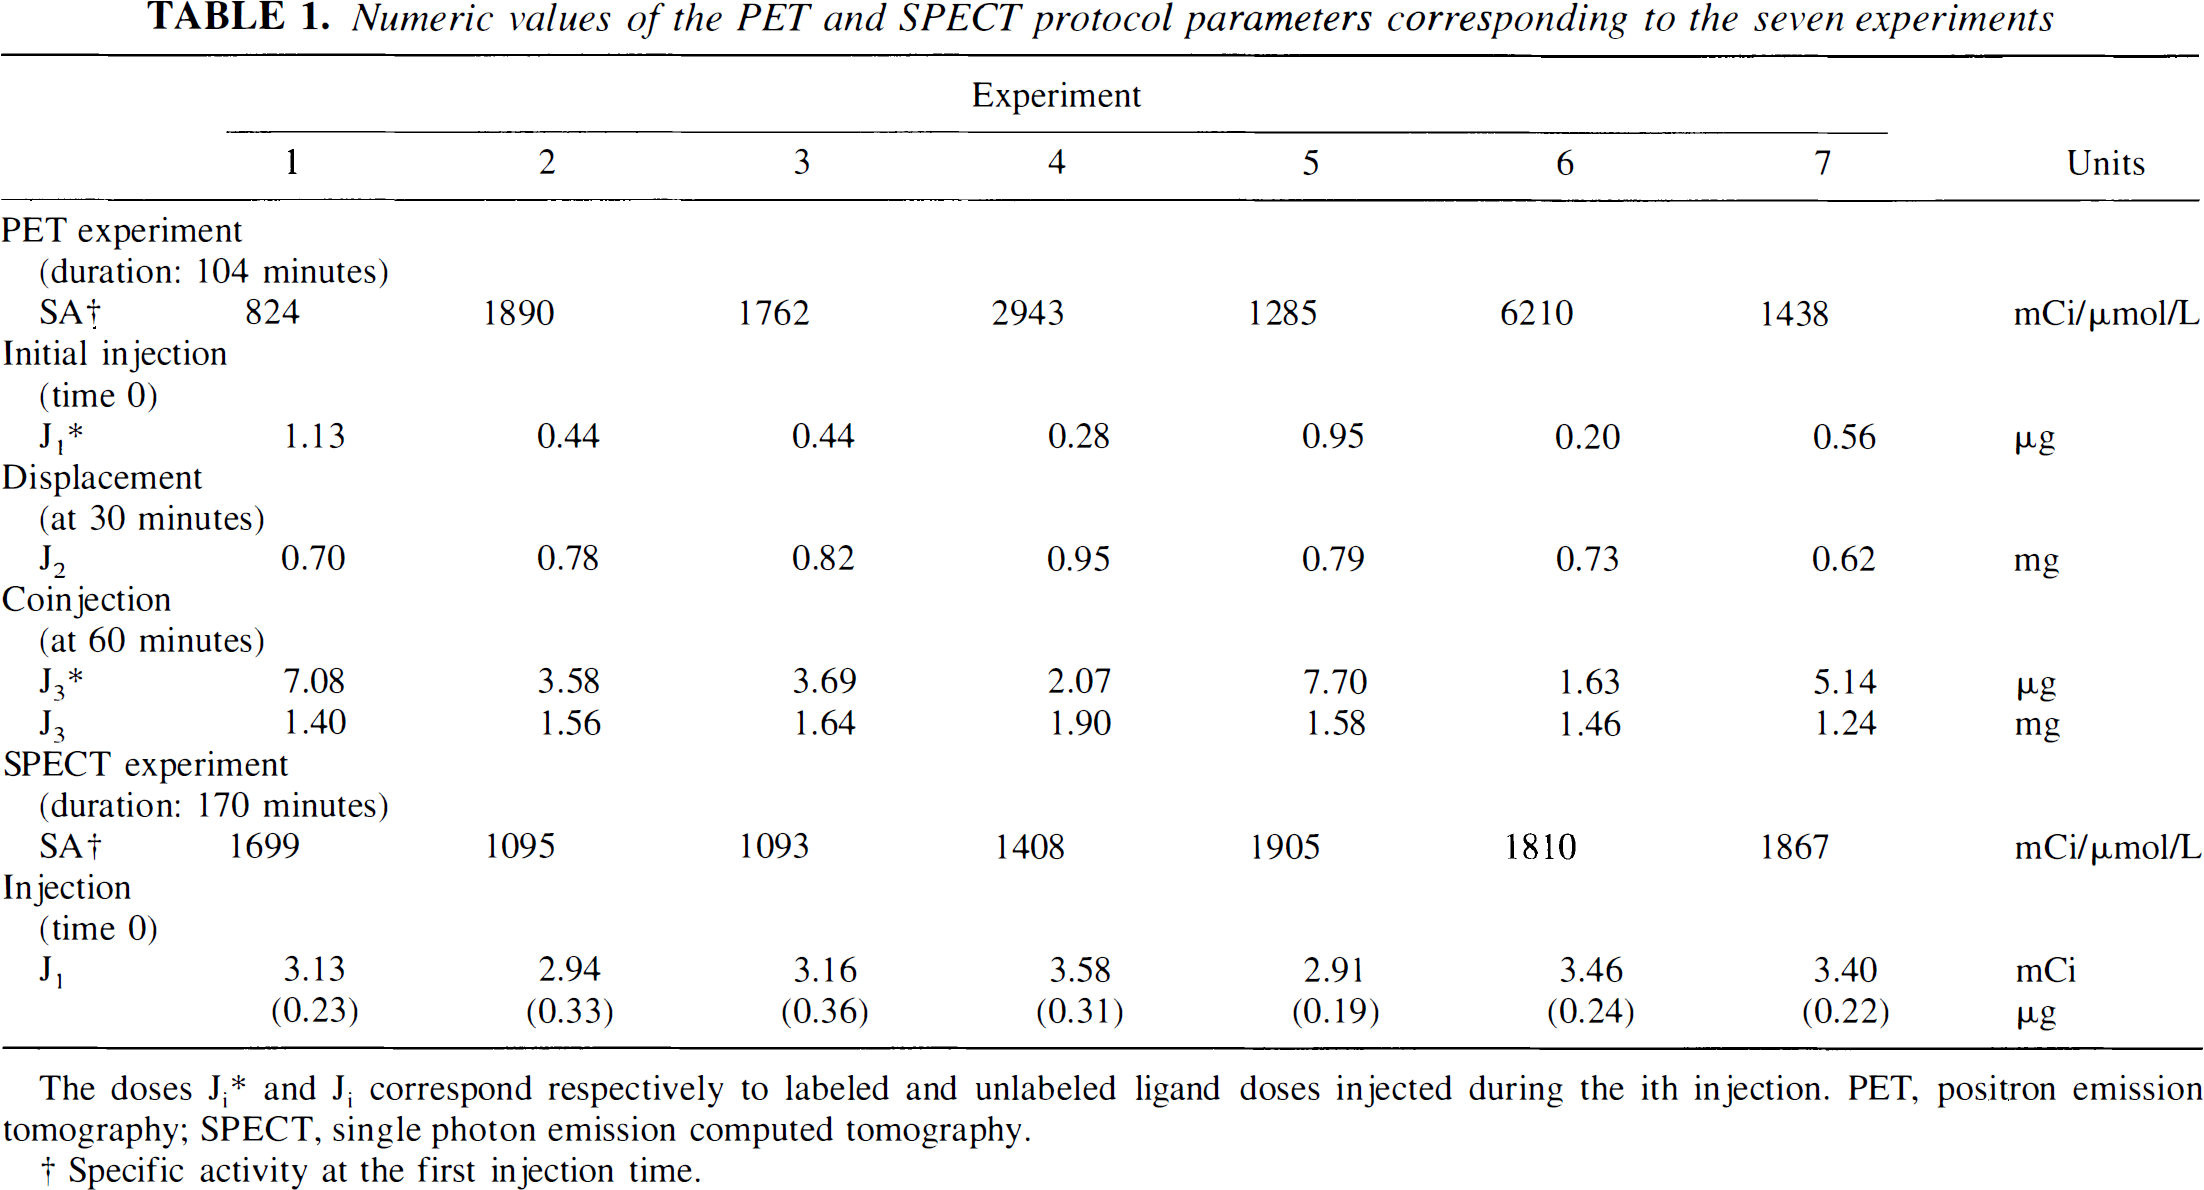
The doses Ji* and Ji correspond respectively to labeled and unlabeled ligand doses injected during the ith injection. PET, positron emission tomography; SPECT, single photon emission computed tomography.
Specific activity at the first injection time.
Time-concentration curves of [11C]flumazenil
Single photon emission computed tomography experiments
Scan acquisitions were performed using a Toshiba GCA-9300A/HG triple-headed SPECT system in continuous rotation mode, using a super-high-resolution fan beam (SHR-FB) collimator (Kouris et al., 1993; Mahmood et al., 1994). The tomographic spatial resolution at the center, with 132 mm radius of rotation, is 7.8 mm at full width at half maximum (FWHM) with the SHR-FB collimator. Three energy windows were defined, one for the photopeak (159 keV ± 20%) and two for scatter correction (159 keV ± 7%). Data were reconstructed by filtered back-projection (Shepp and Logan filter) after the raw data were corrected by the triple-energy window method of scatter correction and the Chang filtered method of attenuation correction. Attenuation correction was performed, assuming a uniform attenuation equal to that of water (attenuation coefficient μ = 0.150 cm2/g) within an ellipse drawn around the transaxial plane. Images were displayed on a 128 × 128 × 46 matrix. The activity in cpm/pixel was then expressed in μCi/pixel using a calibration factor of 0.00095 μCi/cpm obtained with phantom experiments performed at regular intervals. The phantom was an 123I distributed source (50 MBq) of a 6-cm diameter acquired for 15 minutes and reconstructed with the same protocol used in the current study. The average cpm/pixel was measured in a large ROI positioned in the phantom image (Abi-Dargham et al., 1995). One sample (1 mL) of the phantom solution was measured with the gamma-counting system to determine the calibration factor between SPECT and gamma-counting system measurements.
Single photon emission computed tomography data were acquired using a single injection protocol (Fig. 1B). Approximately 3 mCi [123I]iomazenil was intravenously injected as a single bolus over 1 minute. Details of injected doses and specific activities are listed in Table 1. A set of 25 sequential frames was collected during 170 minutes according to the following protocol: 5 × 2 minutes; 10 × 5 minutes; 10 × 11 minutes.
Arterial plasma analysis
For the PET and SPECT studies, a catheter was inserted into the radial artery under local anesthesia, after clinical control of satisfactory collateral circulation.
During PET acquisition, 57 arterial whole blood samples (3 mL each) were withdrawn from the radial artery at a rate of 1 sample every 15 seconds for the first 4 minutes after each injection of labeled FMZ, to progressively longer time intervals (30 seconds, 1, 2, and 5 minutes). After rapid blood centrifugation, the plasma 11C radioactivity was measured using a gamma counting system. Measurements (in cpm/mL) were transformed into μCi/mL using a calibration factor estimated before each experiment with a calibrated phantom (50 MBq) acquired and reconstructed using the same PET protocol. The plasma time-activity curves were then corrected for physical decay of 11C activity, and the plasma radioactivity concentrations were transformed in FMZ time-concentration curves, using the corresponding specific radioactivity of [11C]FMZ. Thirty blood samples were analyzed for [11C]flumazenil metabolites after extraction using chloroform separation (Debruyne et al., 1991; Barre et al., 1991; Westera et al., 1996). After each injection of [11C]FMZ, the rate of metabolite measurements was one measurement every 30 seconds during the first 3 minutes, at 6, 8, 10, 15, and 20 minutes, then every 10 minutes. The percentage of unmetabolized [11C]FMZ in plasma was calculated from these measurements using a monoexponential curve, Pnm(t) = A+(100-A)e−Bt, where t is the time expressed in minutes. The metabolite-corrected arterial plasma curve was calculated using Pnm(t) (Fig. 1C).
During SPECT acquisition, 33 arterial whole blood samples (3 mL each) were withdrawn from the radial artery, at the same rate of 1 sample every 15 seconds for the first 3 minutes, to progressively longer time intervals (30 seconds, 1, 2, and 5 minutes).
Twenty-four blood samples were analyzed for [123I]iomazenil metabolites using the same procedure as described above. The radioactivity in the chloroform layer represented the amount of remaining unmetabolized plasma iomazenil: Ca(t) (Westera et al., 1996). Metabolite measurements were performed on all samples during the first 10 minutes and approximately every 5 minutes until the end of the experiment. The free fraction (Ca(t)) was fitted to a sum of three exponentials (Fig. 1D) (Abi-Dargham et al., 1994, 1995).
Image processing
For anatomic localization of the cortical structures, a T1-weighted MR brain image volume was obtained for each subject (PICKER Eclipse 1.5T; TR = 15 milliseconds; TE = 4 milliseconds; pixel size: 0.98 × 0.98 × 1.10 mm3). For realignment, PET frames 16 and 17 and SPECT frames 23 and 24 were averaged to produce mean PET and SPECT images, respectively, to provide satisfactory whole-brain anatomic definition. Each subject's MRI and the mean SPECT image were aligned to the mean PET image, using the Automated Image Registration software (AIR v3.08) (Woods et al., 1992, 1993) using a six-rigid-body algorithm. The resulting transformation matrix of the mean SPECT image was applied to the dynamic SPECT images to realign SPECT frames to the mean PET images (Fig. 2).
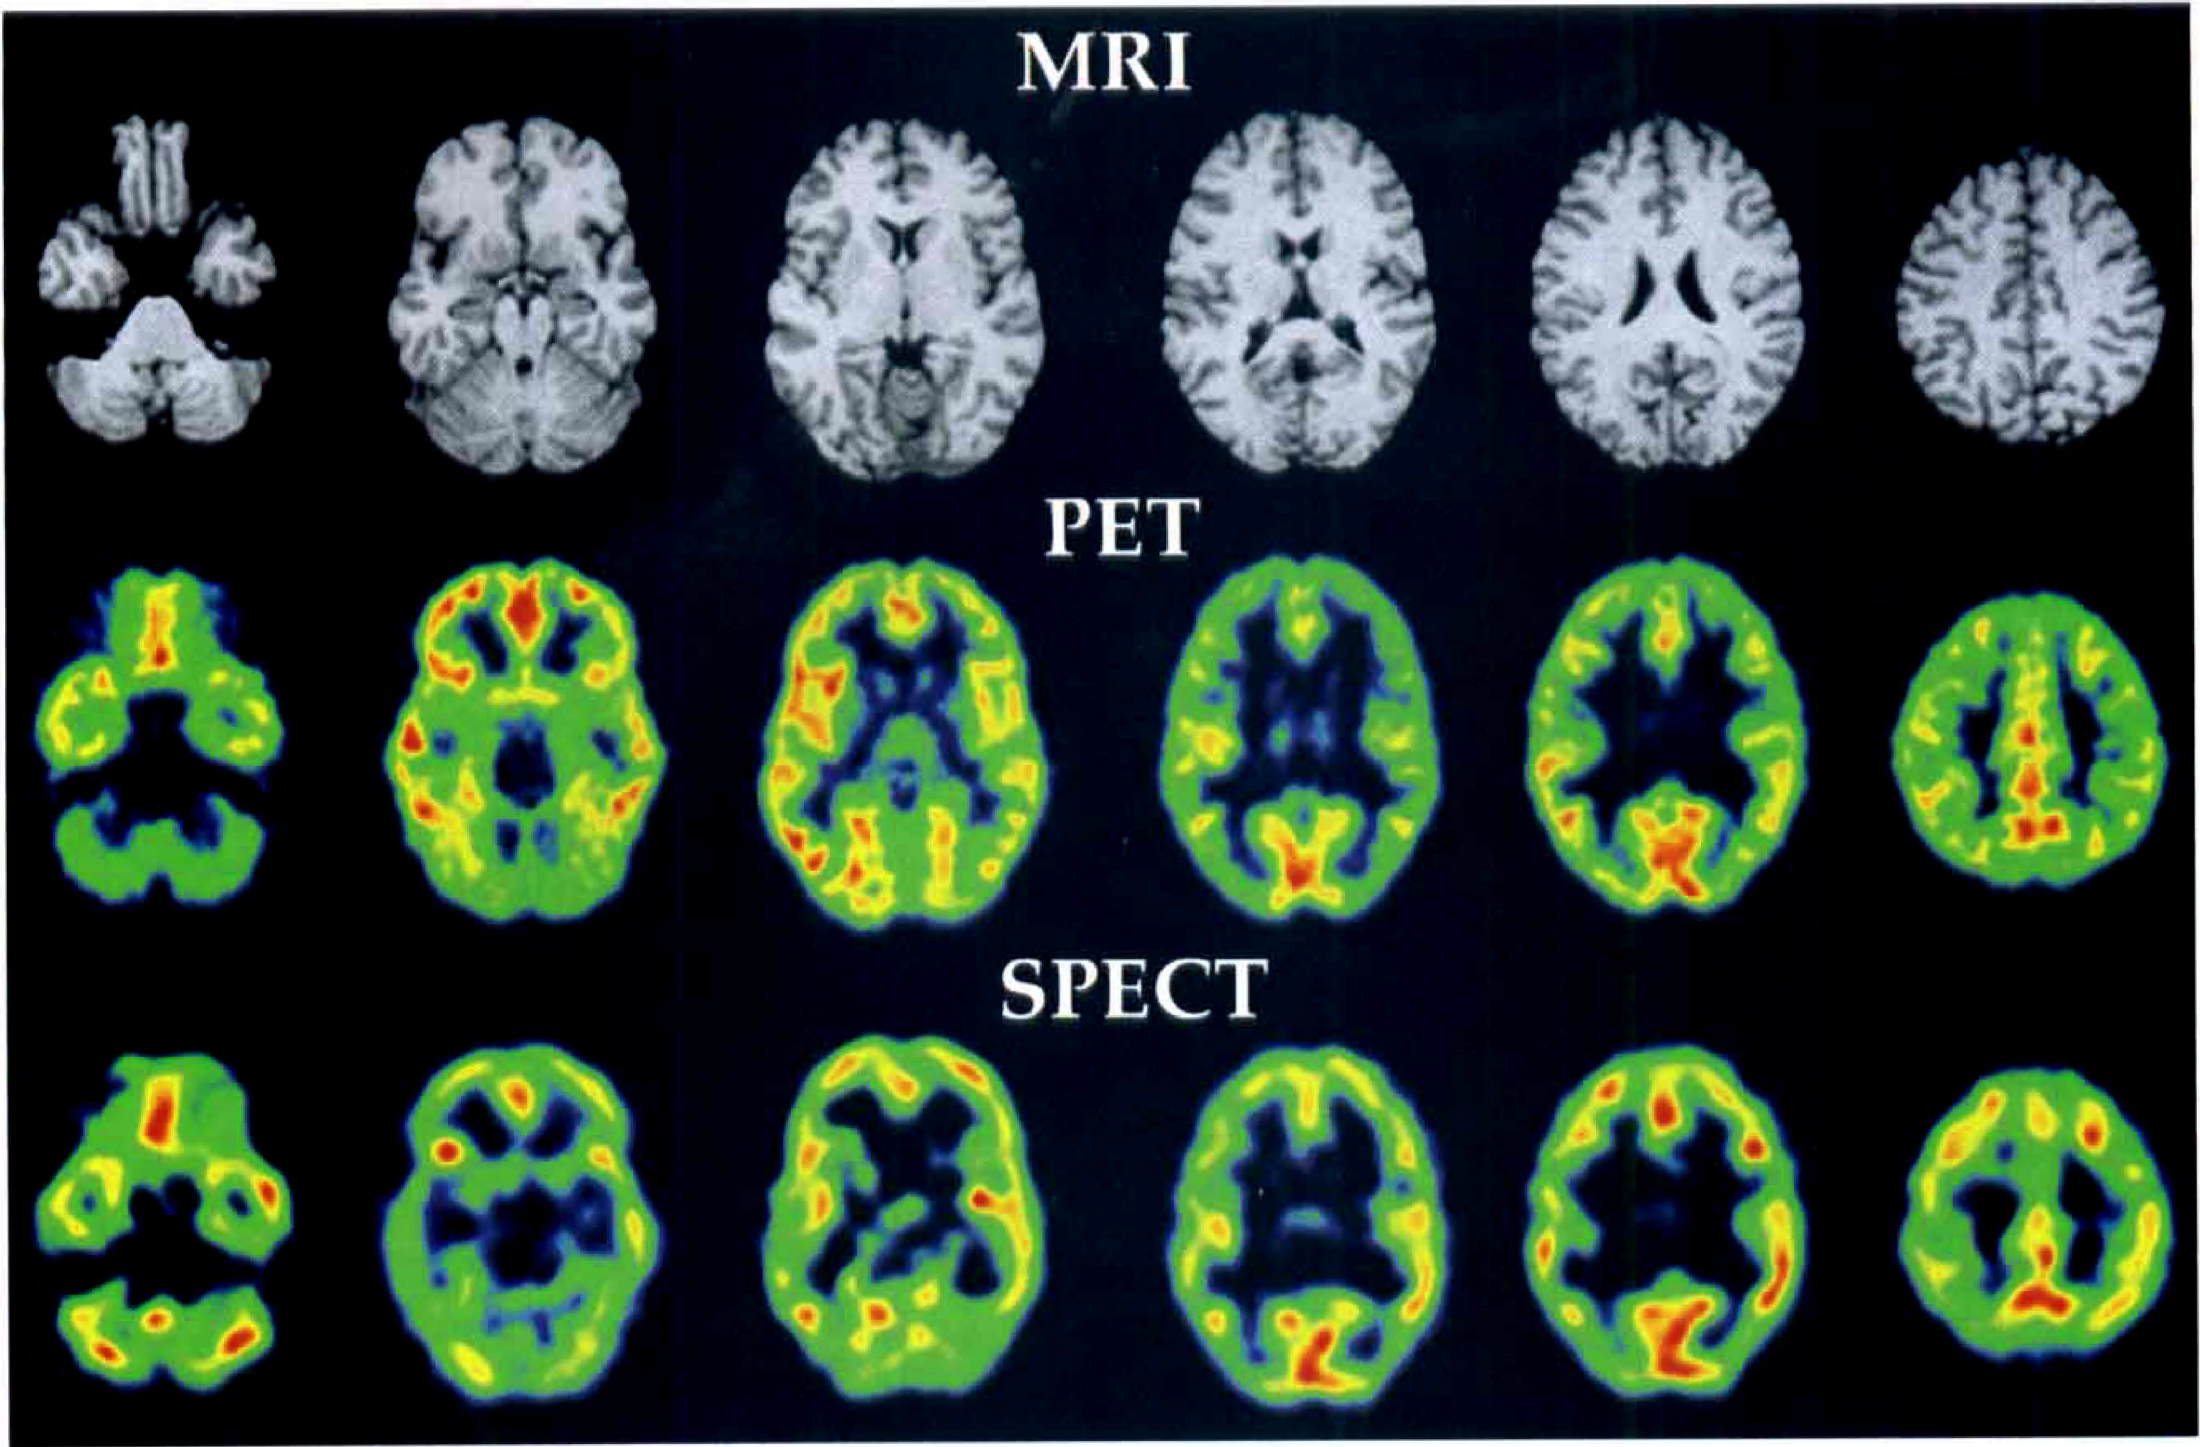
Magnetic resonance imaging (MRI) and delayed-activity positron emission tomography (PET) and single photon emission computed tomography (SPECT) images of one subject at different anatomic levels. The MRI and SPECT images are realigned to the PET images. The SPECT spatial transformation coordinates calculated to realign SPECT to PET were applied to the dynamic SPECT images.
Data analysis
Twenty-seven circular ROIs (r = 7.02 mm) were used to obtain PET and SPECT time-concentration curves from structures identified on the MR images by visual inspection. Then these ROIs were applied to the dynamic PET and SPECT images. Twenty-two ROIs were placed on the left and right hemispheres for cerebellum, lateral frontal cortex, somatosensory cortex (SMC), posterior parietal cortex, inferior and superior temporal cortex, hippocampus, amygdala, caudate, putamen, and thalamus. Five ROIs were placed on pons, median frontal cortex, median parietal cortex, anterior cingulate, and occipital cortex.
The authors used four different methods (A, B, C, and D) to estimate the benzodiazepine receptor-binding parameters. A complete description is presented in Appendices A to D and is summarized in Table 2. In Method A, a three-compartment model, the metabolite-corrected arterial plasma curve, and the metabolite-uncorrected whole blood curve were used to fit PET data acquired with the multiinjection protocol (Fig. 1A) (Delforge et al., 1995). The BP and the total (DVT) and specific (DVS) distribution volumes were calculated from the estimated parameters B′max, k1, k2, kon/VR, koff (Appendix A). This first fitting strategy can only be applied to dynamic PET data because the three-injection protocol allows one to estimate all model parameters. These binding parameter estimations were used as reference values to study indices of receptor density using PET and SPECT data. In Method B, unconstrained and constrained three-compartment models were used to estimate BP, DVT, DVS, and BPC (DVf+ns = 3.2) (Abi-Dargham et al., 1995) from SPECT data corresponding to the single-injection protocol (Appendix B). In Method C, a two-compartment model was used to calculate DVT” = k1/k2” from SPECT and PET data acquired after the first labeled injection (Koeppe et al., 1991) (Appendix C, Fig. 1A and B). In Method D (Appendix D), delayed-activity (DA) images were calculated from averaged PET (16, 17) and SPECT (23, 24) frames, corresponding to a duration of 10 and 20 minutes, respectively.
Fitting strategies
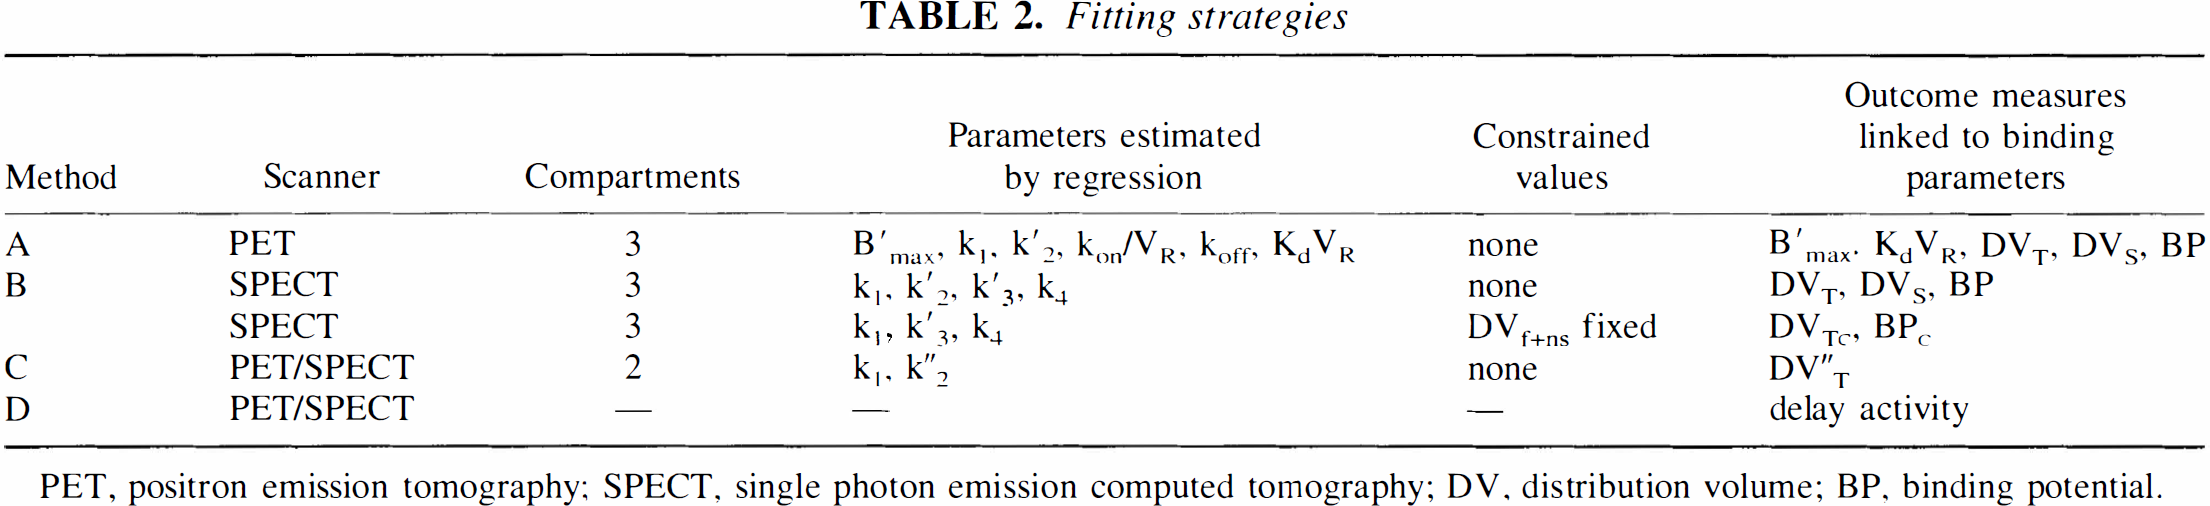
PET, positron emission tomography; SPECT, single photon emission computed tomography; DV, distribution volume; BP, binding potential.
For each model configuration, parameters were identified by minimization of a weighted least-squares cost function, using Marquardt's algorithm (Marquardt, 1963). The authors used a weight defined by Wi = (ti-ti-1)/y(t), where y(t) corresponds to the PET or SPECT measure at time ti. This is a reasonable choice in experiments involving radioactivity counts (Mazoyer et al., 1986).
Parametric images
Parametric images were obtained using model estimates calculated from filtered pixel-by-pixel kinetic curves. The authors used a temporal filter based on the wavelet transform that allows one to conserve the original spatial resolution of PET and SPECT images (Millet et al., 2000). The wavelet analysis procedure was performed using the discrete wavelet transform and a Daubechies filter of order 10 (number of coefficients = 20) (Daubechies, 1989). When applying this filter, the pixel-by-pixel PET and SPECT kinetic data are decomposed to their essential components, namely the detail signals and its approximation. The original signal can be recovered by summing the approximation and all the detail signals (Castleman, 1996; Mallat, 1998). However, before reconstruction, some of the detail signal can be shrunk to a particular threshold without substantially affecting the main features of the data set. Therefore, the authors applied a threshold of the detail signals, using statistical criteria described by Millet et al. (2000). The shrunken signals were then transformed back to the domain of the original data to obtain a time-frequency–filtered signal.
The filtered PET and SPECT pixel-by-pixel kinetic curves were used to estimate model parameters. The resulting estimate sets were used to build parametric images at the pixel level.
RESULTS
Positron emission tomography binding parameters
Average ROI values from seven subjects are described in Table 3 and Fig. 3 to Fig. 5. Results of the PET correlation analysis for each subject are shown in Table 4.
Binding parameters derived from PET data
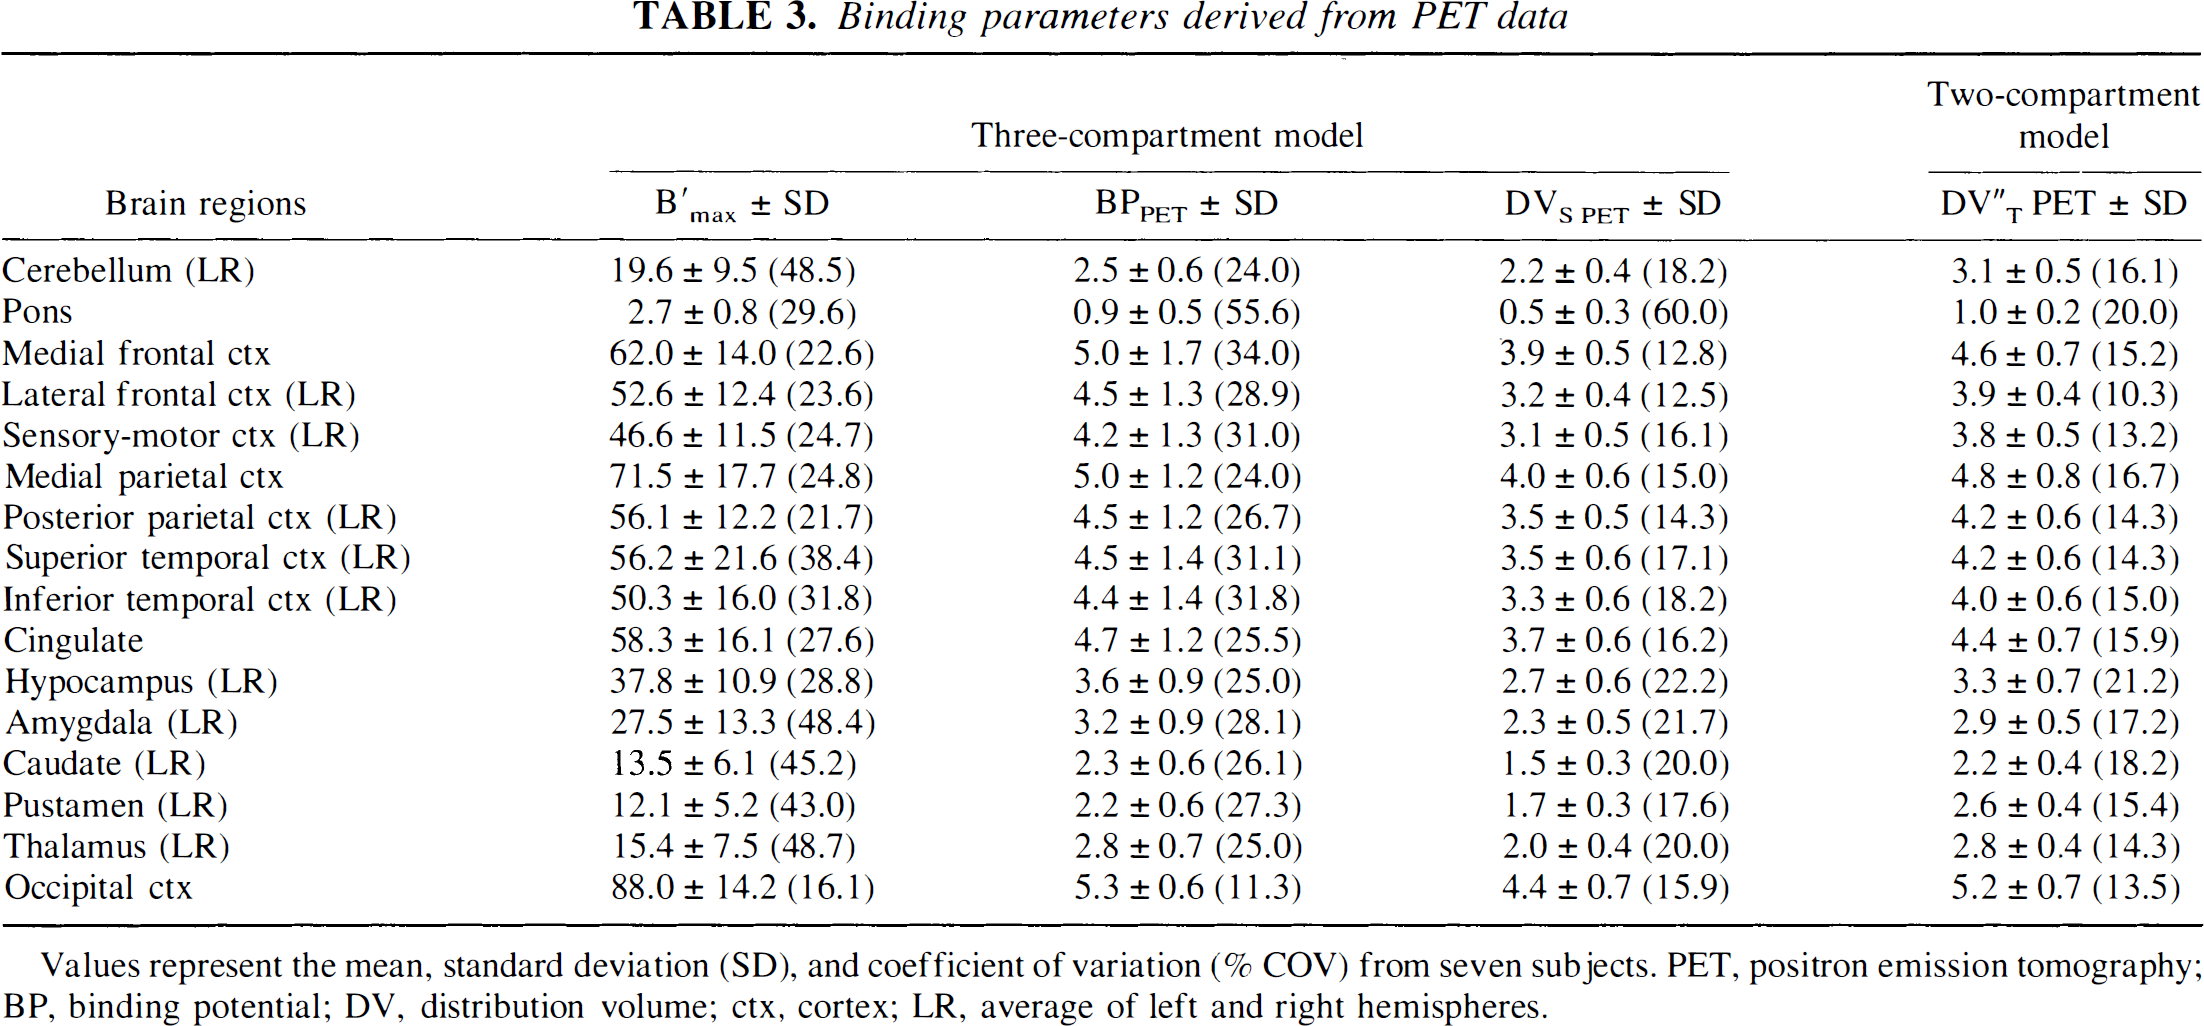
Values represent the mean, standard deviation (SD), and coefficient of variation (% COV) from seven subjects. PET, positron emission tomography; BP, binding potential; DV, distribution volume; ctx, cortex; LR, average of left and right hemispheres.
Detailed results of correlations obtained using PET data with seven subjects
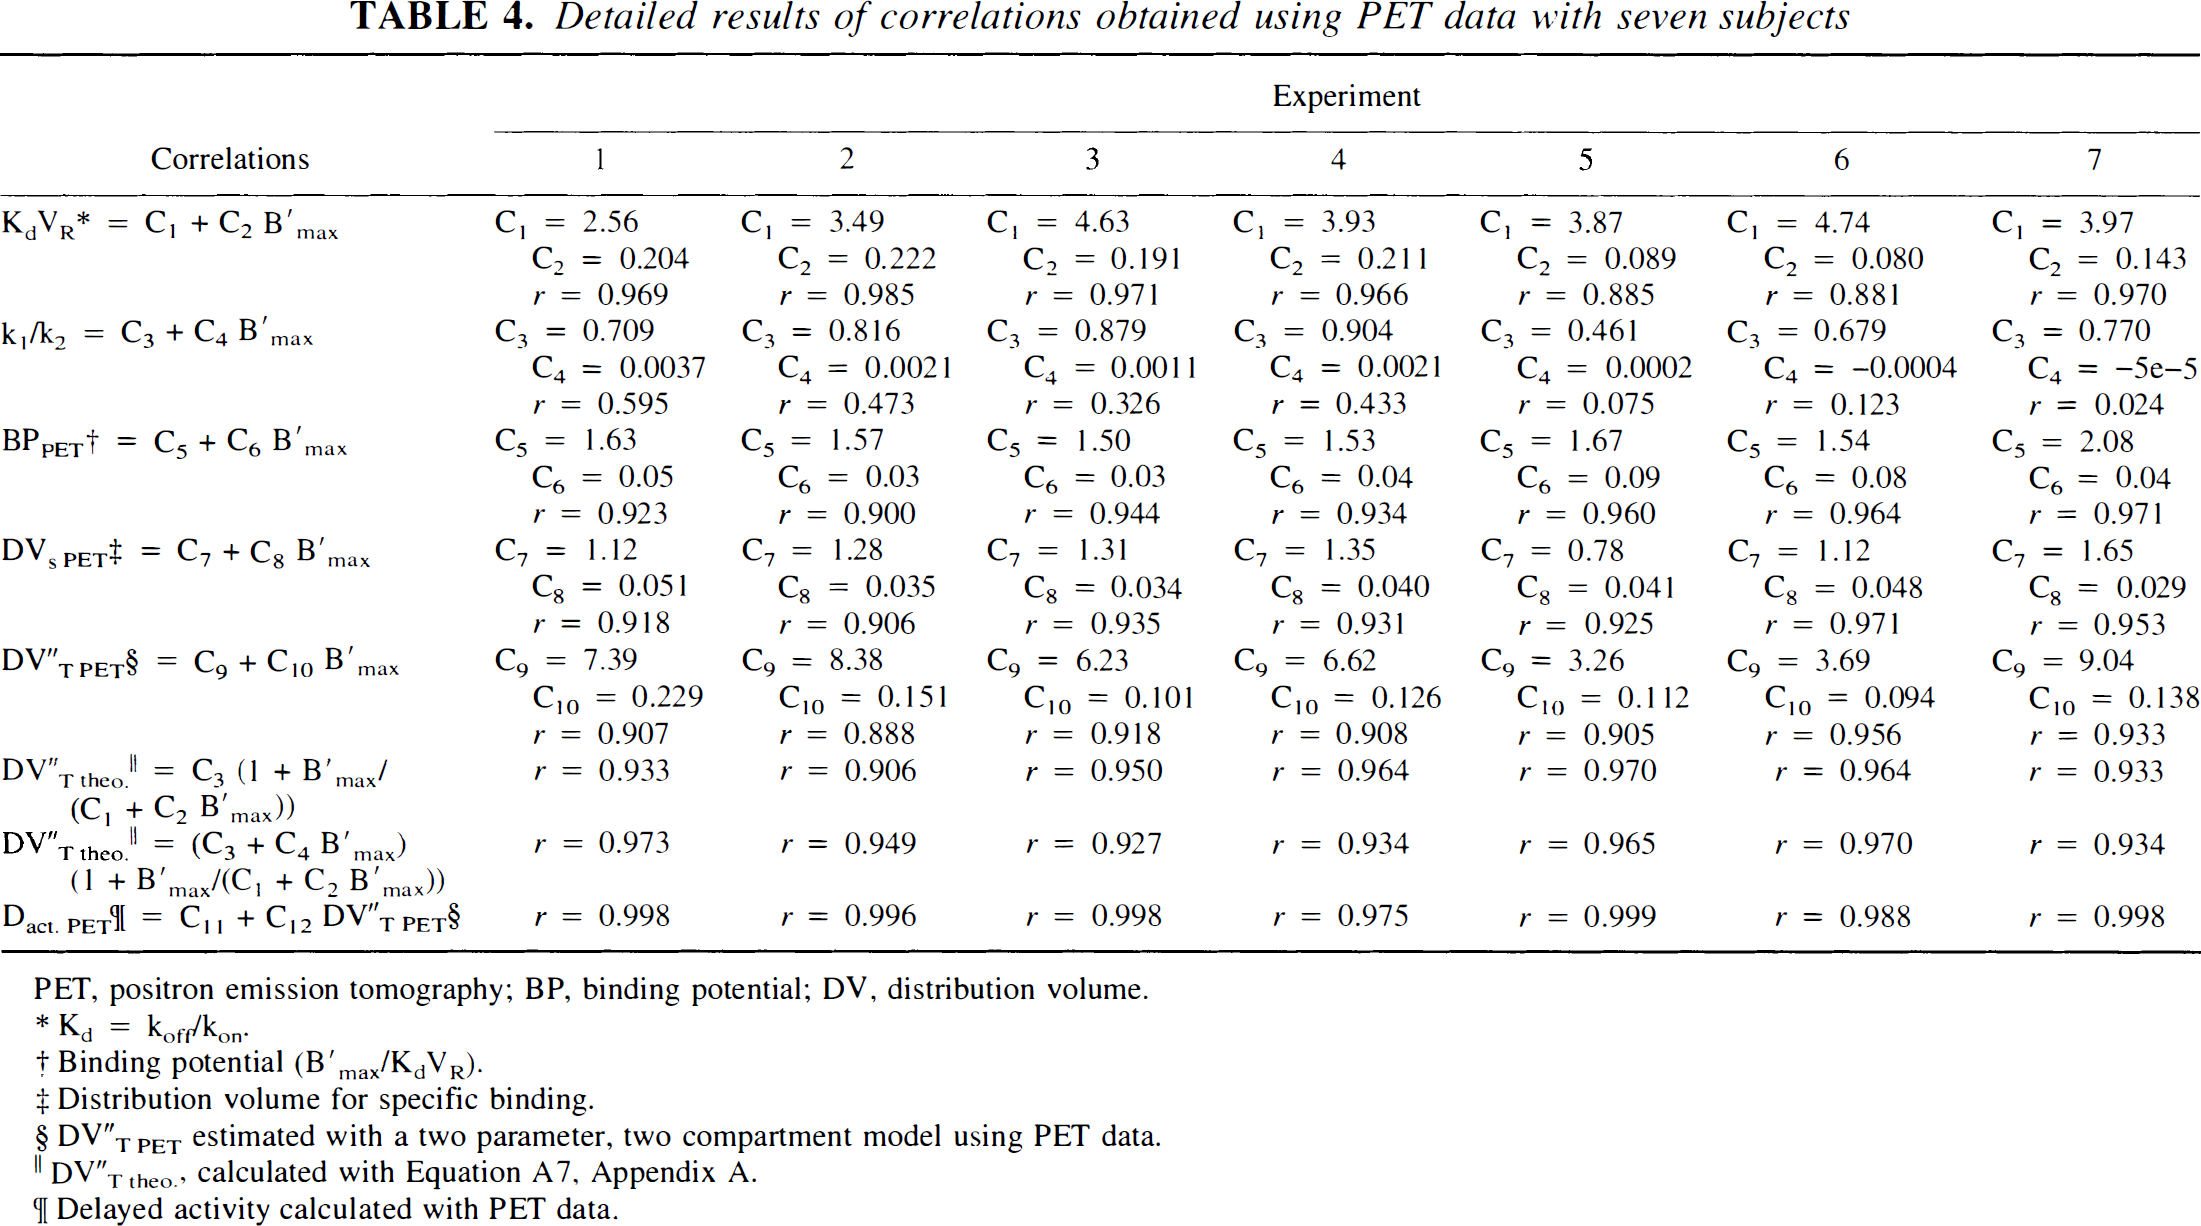
PET, positron emission tomography; BP, binding potential; DV, distribution volume.
Kd = koff/kon.
Binding potential (B′max/KdVR).
Distribution volume for specific binding.
DV″T PET estimated with a two parameter, two compartment model using PET data.
DV″T theo., calculated with Equation A7, Appendix A.
Delayed activity calculated with PET data.
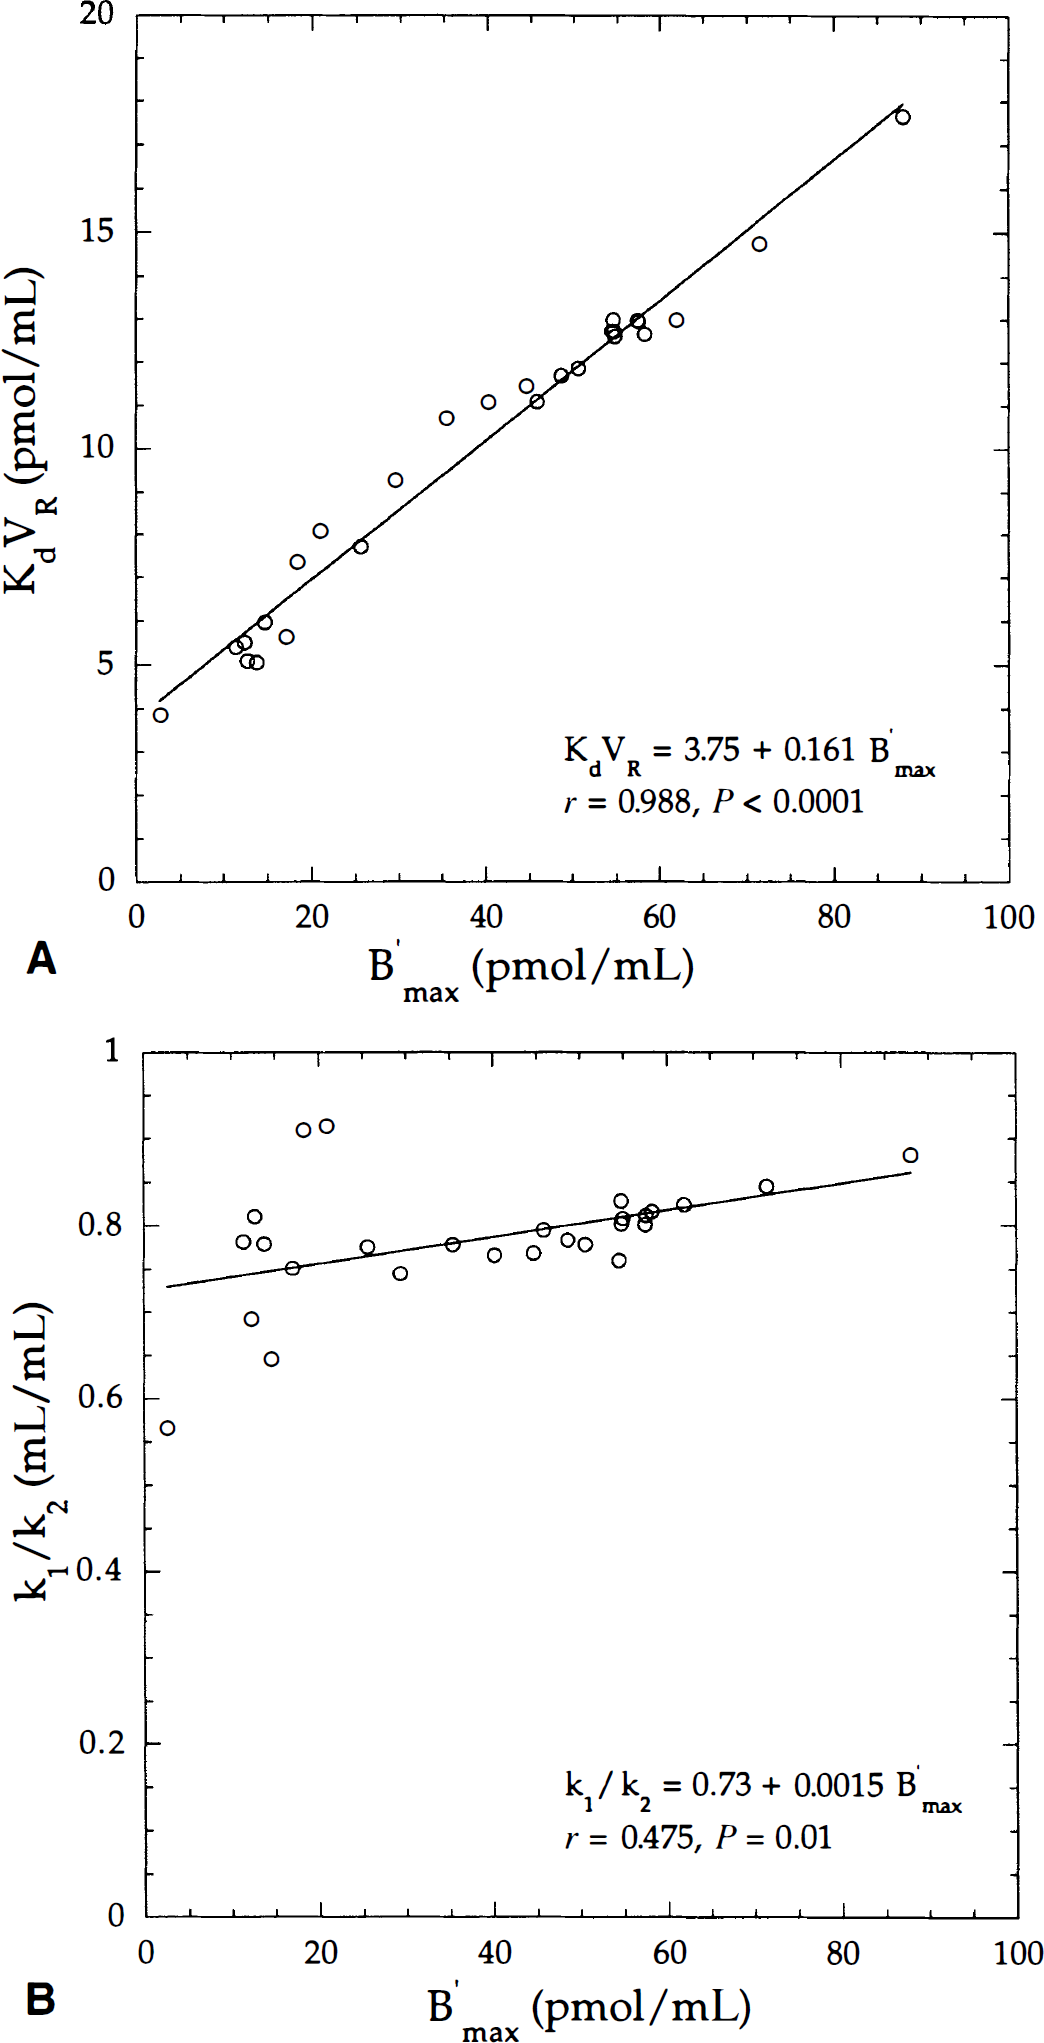
Correlation of KdVR with B′max parameters
Five parameters (B′max, k1, k2, kon/VR, koff) were estimated using Method A. The ranges of values for all model parameters were in accordance with those published elsewhere (Price et al., 1991, 1993; Lassen et al., 1995; Delforge et al., 1995). Fig. 3 shows the main correlations between model parameters as a linear correlation between receptor density (B′max) and ligand affinity (Fig. 3A), and the k1/k2 ratio versus B′max values (Fig. 3B). The authors found a weak correlation between k1/k2 and B′max values, and coefficients of correlation from individuals ranged from 0.024 to 0.595 (Table 4).
High correlations were found between BPPET and B′max values (r > 0.900) and between DVS PET and B′max values (r > 0.906;Table 4). The distribution volume values were similar with a two-compartment model (Method C) and a three-compartment model (Method A) as previously reported (Koeppe et al., 1991). The correlation coefficient across all regions for the seven subjects is r = 0.997 (DVT″PET= −0.082 + 0.989 DVT PET). Therefore, the authors used only DVT″PET values for further analysis in the current study.
The relation between DVT″PET and B′max values was analyzed using a simple linear regression fit and a nonlinear univariate regression, fitting equation A7 to DVT″PET-B′max data (Fig. 4). In the latter case, equation A7 can be expressed as follows: DVT PET = (C3 + C4B′max[1 + B′max/(C1 + C2B′max)]), where coefficients C1, C2, C3, C4 were replaced by C1 = 3.75, C2 = 0.161 (Fig. 3A), C3 = 0.73, C4 = 0.0015 (Fig. 3B). Using a simple linear regression, the coefficient of correlation was r = 0.954. With the nonlinear relation, the coefficients of correlations were r = 0.967 and r = 0.942 in fixing the k1/k2 ratio to a constant value (C4 = 0). In all experiments, the C4 coefficients were weak (Table 4), but the quality of the fit was significantly improved using a C4 value different from zero. In fitting equation A7 to data from all subjects (not shown) using a direct least-squares method, the coefficient correlation was slightly improved (r = 0.978).
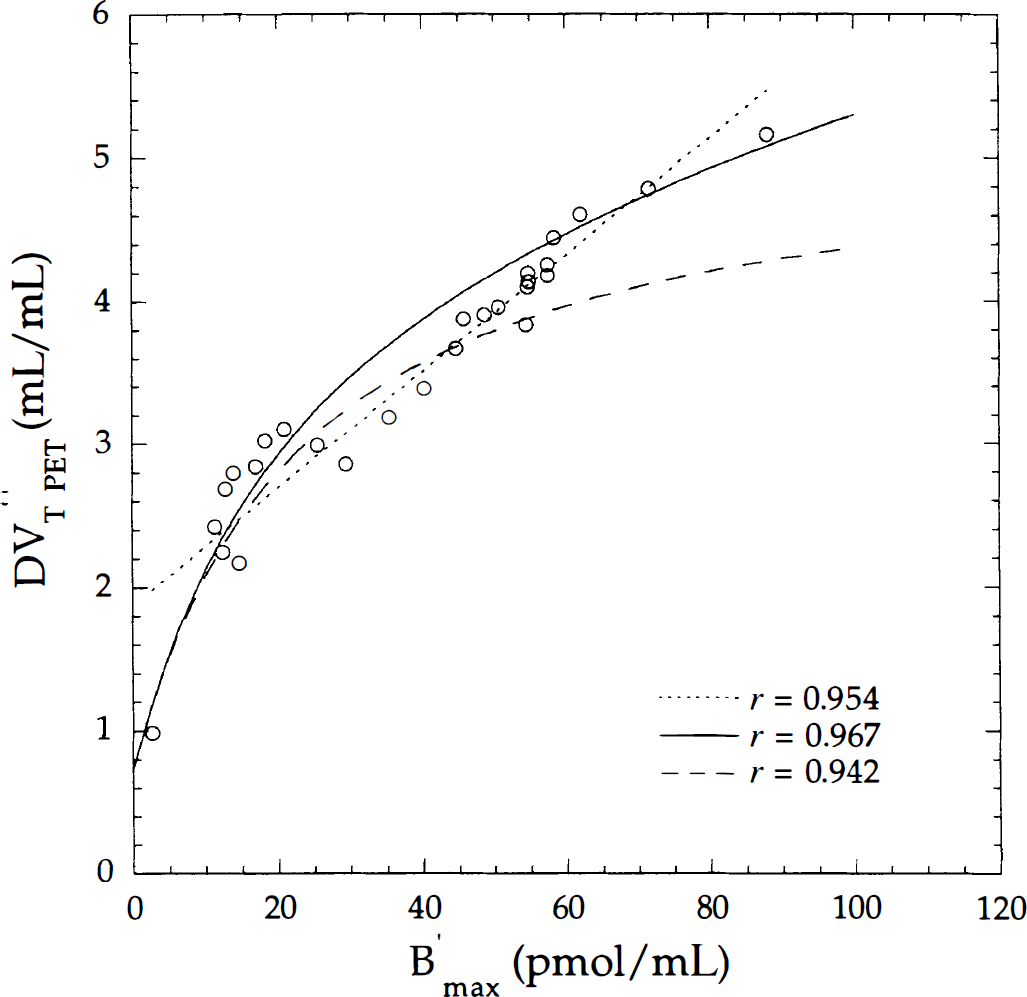
Correlation between the distribution volume (DV″T PET) estimated with a two-compartment model and the B′max parameter. Open circles correspond to mean values across subjects depicted in Fig. 3. Correlation was calculated using a simple linear regression (dotted line) and a nonlinear relation in fixing (long dash line) or not fixing (solid line) the k1/k2 ratio.
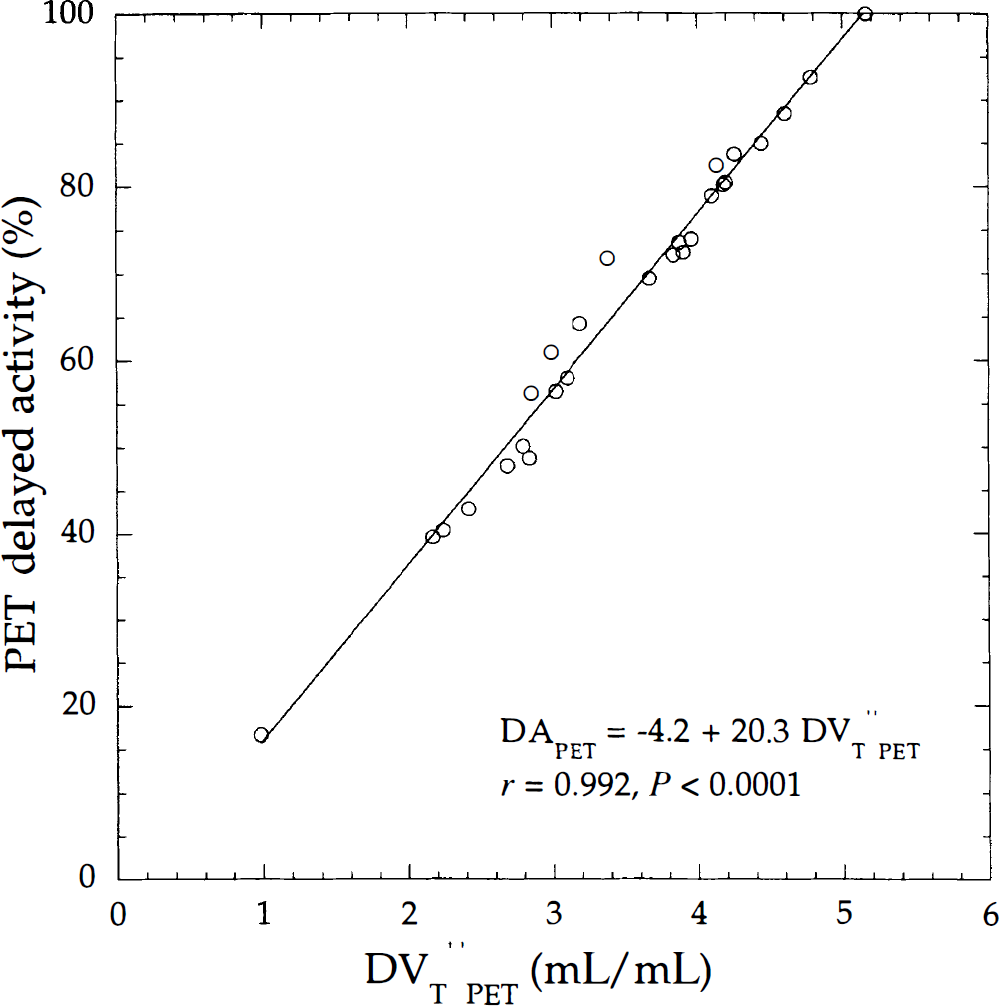
Correlation between positron emission tomography (PET) delayed activity and the distribution volume (DV″T PET) calculated using a two-compartment model and the same regions of interest used in Fig. 3. Solid line is the linear regression line.
Relation between PET delayed activity and distribution volume
Positron emission delayed activity (DAPET) was correlated with DVT “PET as shown in Fig. 5 (r = 0.992). For individuals, there was an excellent correlation between the two parameters, with coefficients of correlation ranging from r = 0.975 to 0.999 (Table 4). In the current study, the intercept value that corresponds to λFVCa(t) (Appendix D1) was negative (Fig. 5). A partial volume effect could underestimate the delayed activity of the small ROIs with low-receptor density and modify the slope, and thus the intercept of the regression line. The ROIs with less activity were the hippocampus, amygdala, caudate on the left and right hemispheres, and pons (Fig. 5).
Correlation between distribution volumes (DV″PET) and DAPET calculated versus acquisition times (frames from the beginning of the experiment to 30 minutes after the first injection) led to coefficients of correlation close to unity (r ≈ 1) with data acquired 17 minutes from the start of the scan.
Estimation of model parameters from SPECT data
Average ROI values from seven subjects are described in Table 5 and Fig. 6 to Fig. 8. Results of the PET and SPECT correlation analysis for each subject are shown in Table 6.
Binding parameters derived from SPECT data
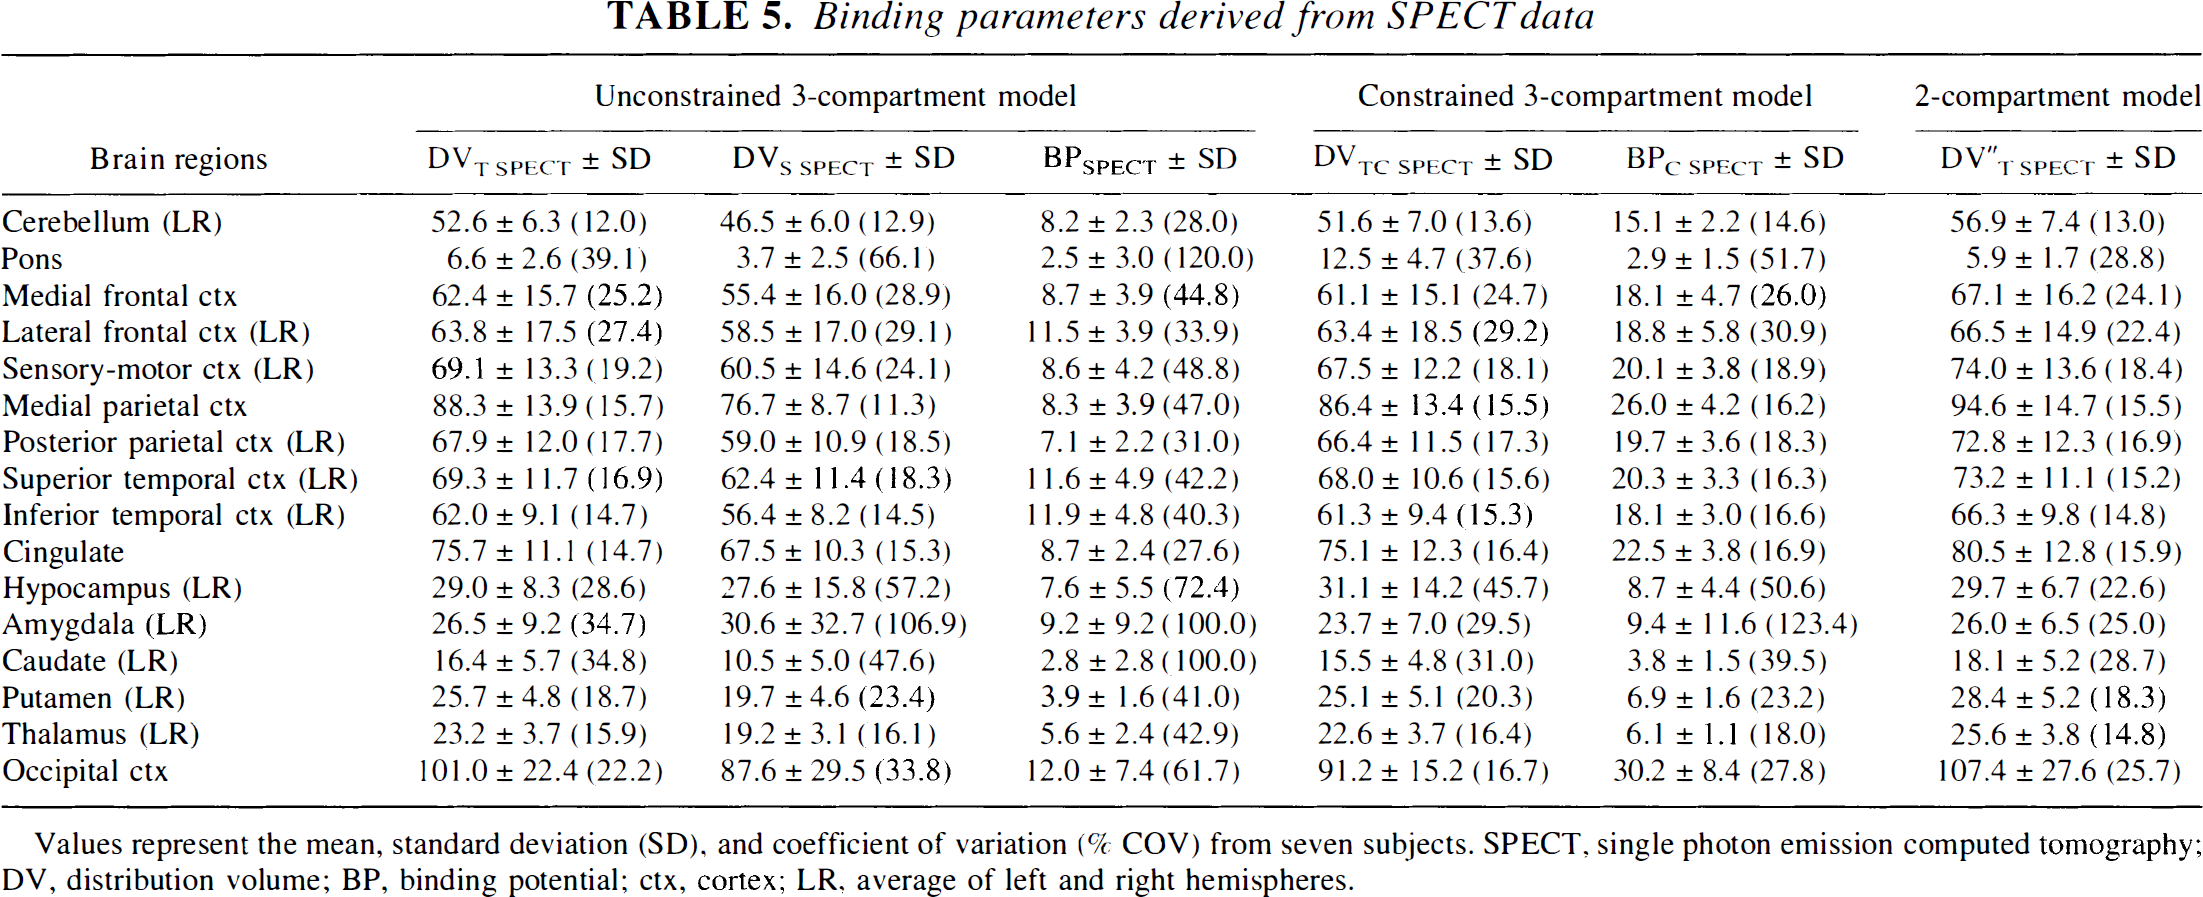
Values represent the mean, standard deviation (SD), and coefficient of variation (% COV) from seven subjects. SPECT, single photon emission computed tomography; DV, distribution volume; BP, binding potential; ctx, cortex; LR, average of left and right hemispheres.
Detailed results of PET and SPECT correlations obtained with seven subjects
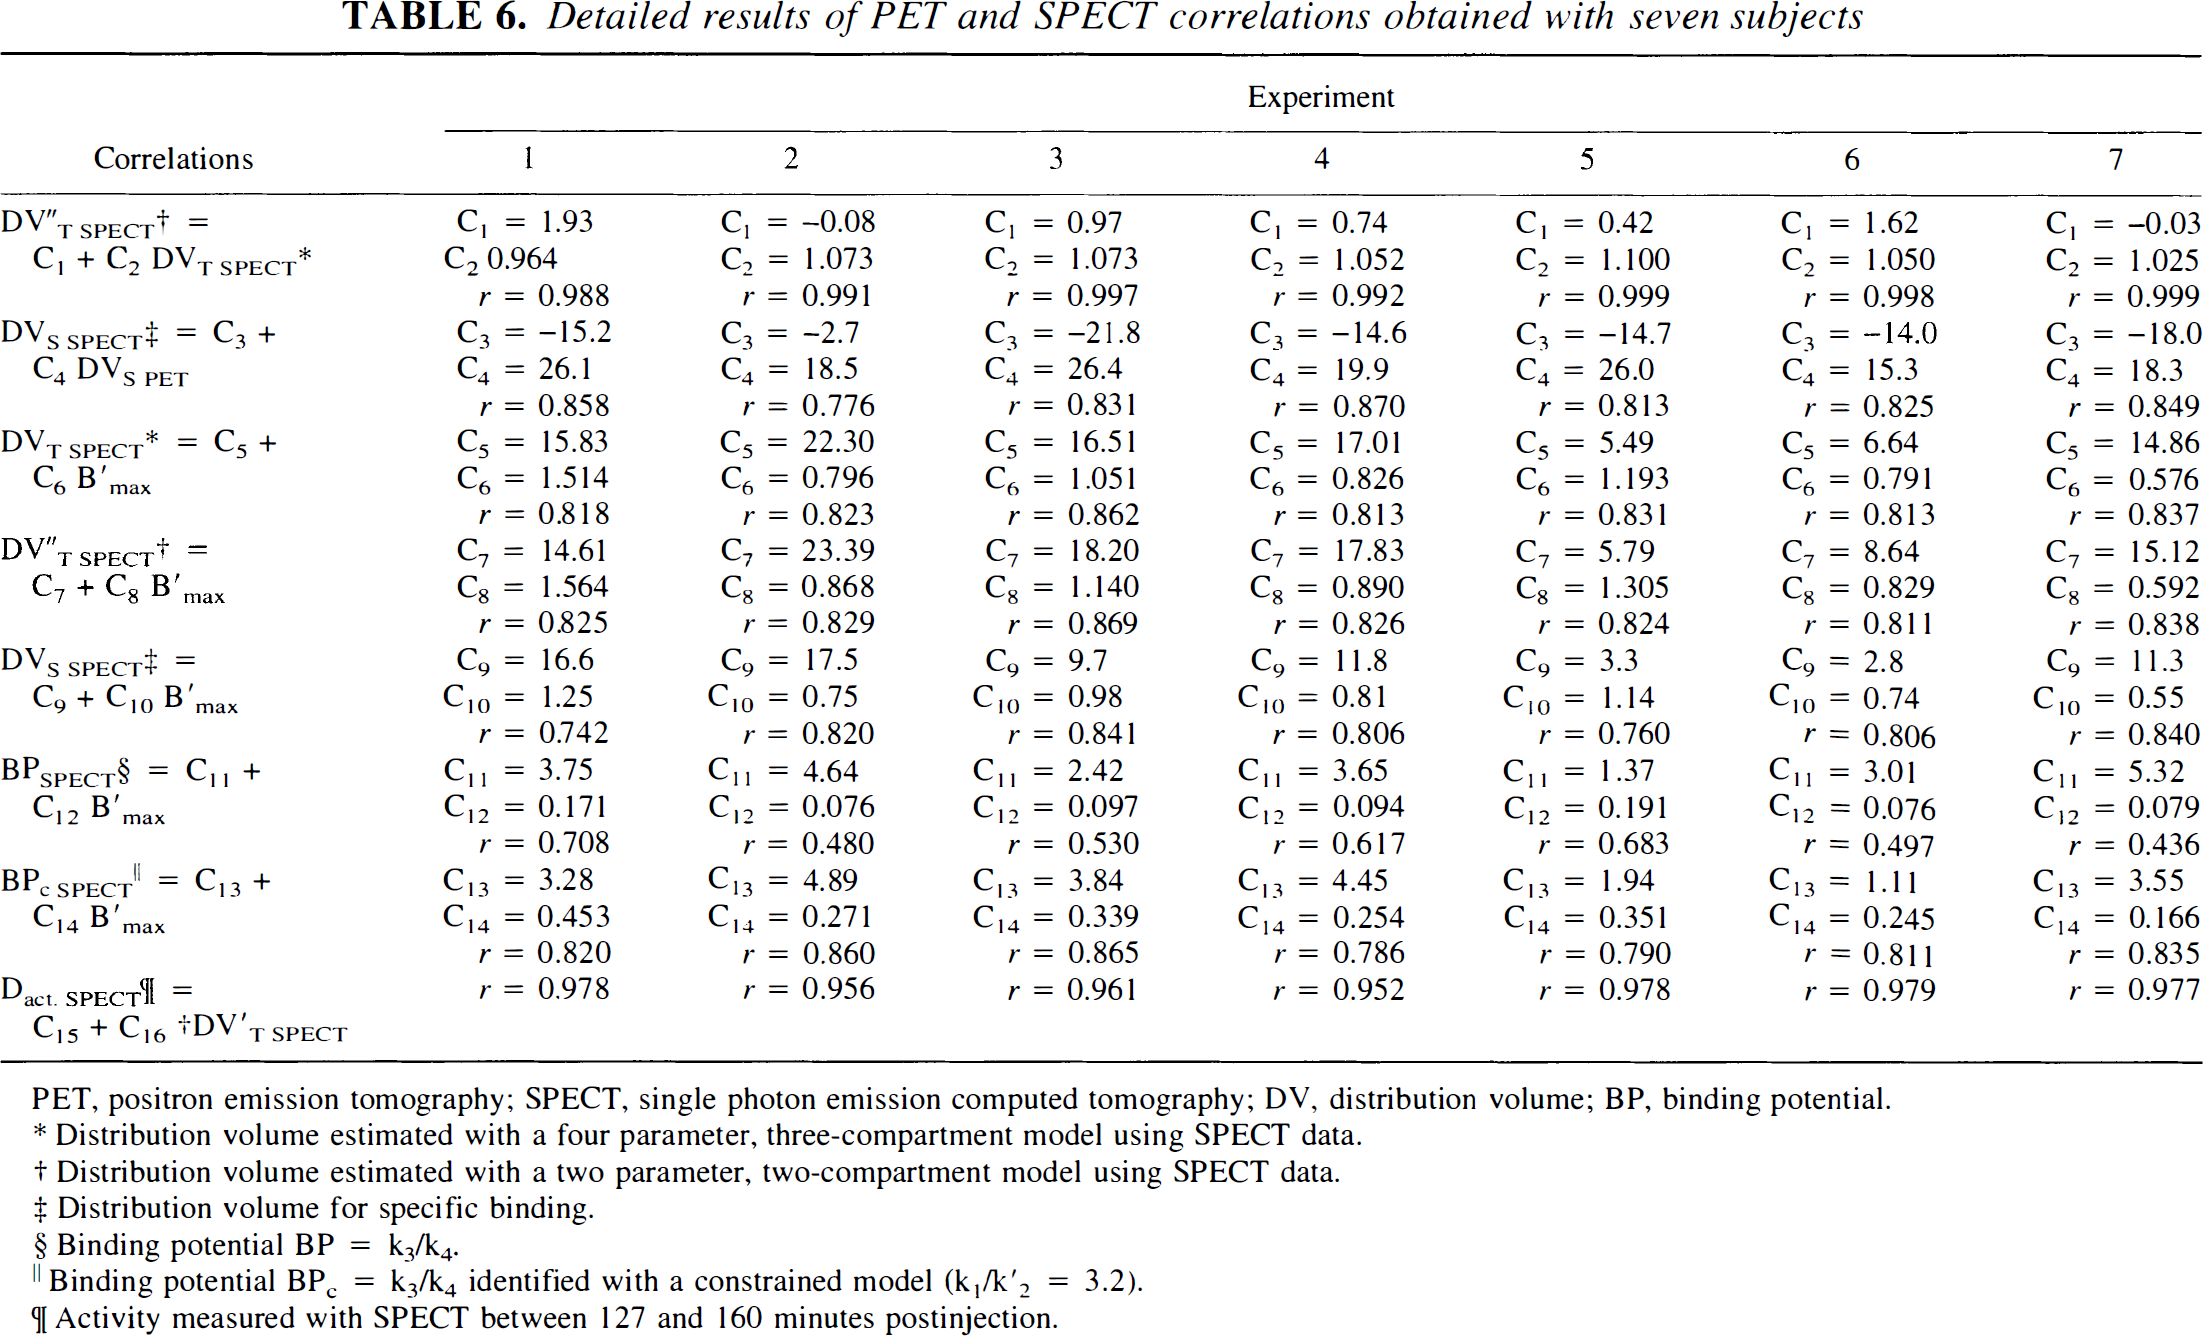
PET, positron emission tomography; SPECT, single photon emission computed tomography; DV, distribution volume; BP, binding potential.
Distribution volume estimated with a four parameter, three-compartment model using SPECT data.
Distribution volume estimated with a two parameter, two-compartment model using SPECT data.
Distribution volume for specific binding.
Binding potential BP = k3/k4.
Binding potential BP c = k3/k4 identified with a constrained model (k1/k′2 = 3.2).
Activity measured with SPECT between 127 and 160 minutes postinjection.
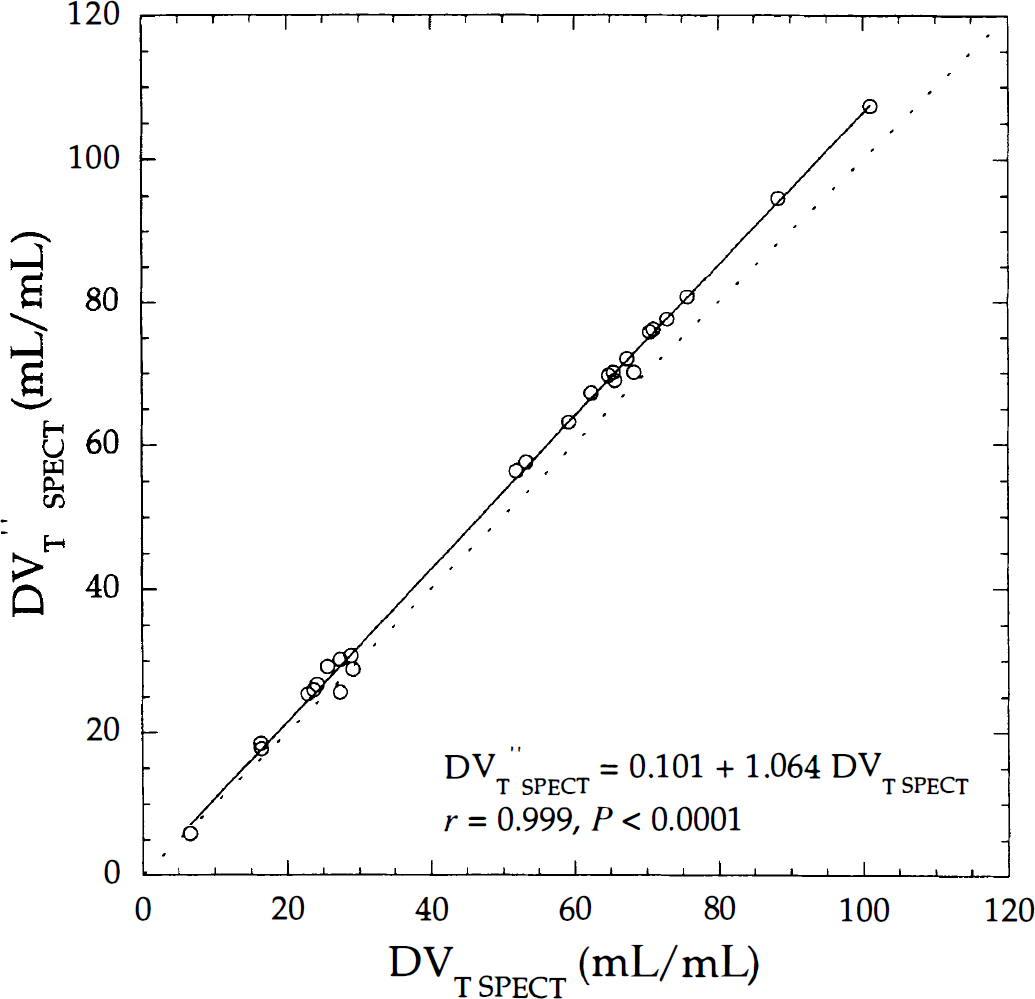
Linear correlation between single photon emission computed tomography (SPECT) distribution volumes estimated with a two- (DV″T SPECT) and three- (DVT SPECT) compartment model using the same data depicted in Fig. 3. Calculated linear regression line (solid line) is near the identity line (dotted line).
Single photon emission computed tomography data were analyzed using an unconstrained three-compartment model, described in Appendix B. The BPSPECT, DVT SPECT, and DVS SPECT values were calculated with the four estimated parameters. As previously reported (Laruelle et al., 1994b; Abi-Dargham et al., 1994, 1995), the authors encountered many convergence problems during the identification procedure because of difficulties in estimating k3 and k4 parameters. These parameters were identified with aberrant relative standard errors greater than 100%, especially in poor receptor regions with a low signal-to-noise ratio. Consequently, BPSPECT, DVT SPECT, and DVS SPECT values had large relative standard errors.
For the above reasons, the authors used a constrained three-compartment model (k1/k2 = 3.2) to estimate DVT SPECT and BPSPECT (DVTC SPECT and BPC SPECT, respectively). With this constrained model, the standard errors for k3 and k4 parameters are smaller, thus a better estimation of DVTC SPECT and BPC SPECT parameters exists, particularly in poor receptor regions such as the pons (Table 5).
DVT″SPECT and DVT SPECT values were strongly correlated (r = 0.999), with a bias for high DVT values (Fig. 6). Individual correlation coefficients ranged from 0.988 to 0.999 with slopes ranging from 0.964 to 1.1 and intercepts ranging from −0.08 to 1.93 (Table 6).
Relation between SPECT delayed activity and distribution volume
Fig. 7 shows a high correlation between DVT″SPECT and DASPECT values calculated from Methods C and D, respectively. For the seven subjects, this correlation ranges from r = 0.952 to r = 0.979 (Table 6). Coefficients of correlation between DVT″SPECT and DASPECT show an optimal value of r ≈ 0.960, within 90 to 160 minutes. Activity values of subcortical ROIs were underestimated compared with those obtained in cortical ROIs. This underestimation might be explained by the partial volume effect due to the limited spatial resolution of SPECT or by the weak sensitivity of SPECT.
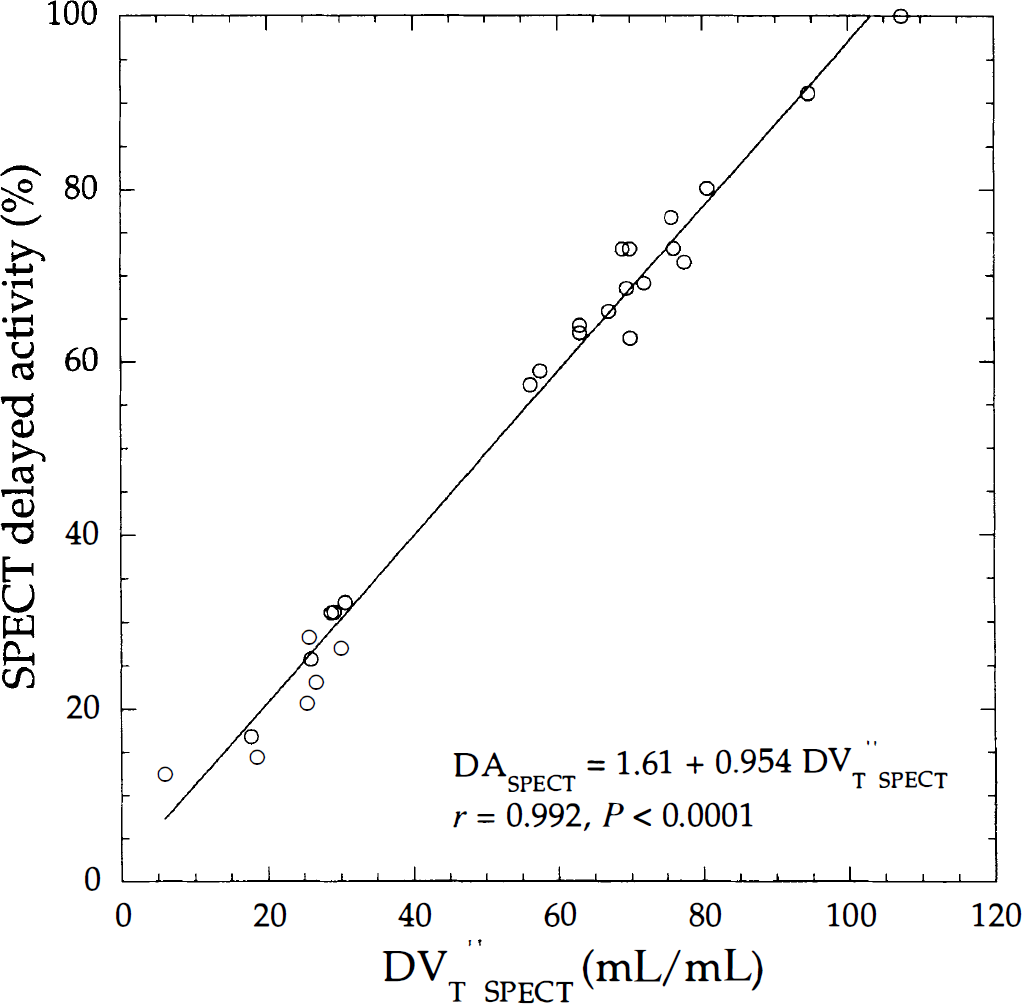
Correlation between single photon emission computed tomography (SPECT) delayed activity and distribution volume (DV″T SPECT) using the same data depicted in Fig. 3. Solid line is the linear regression line.
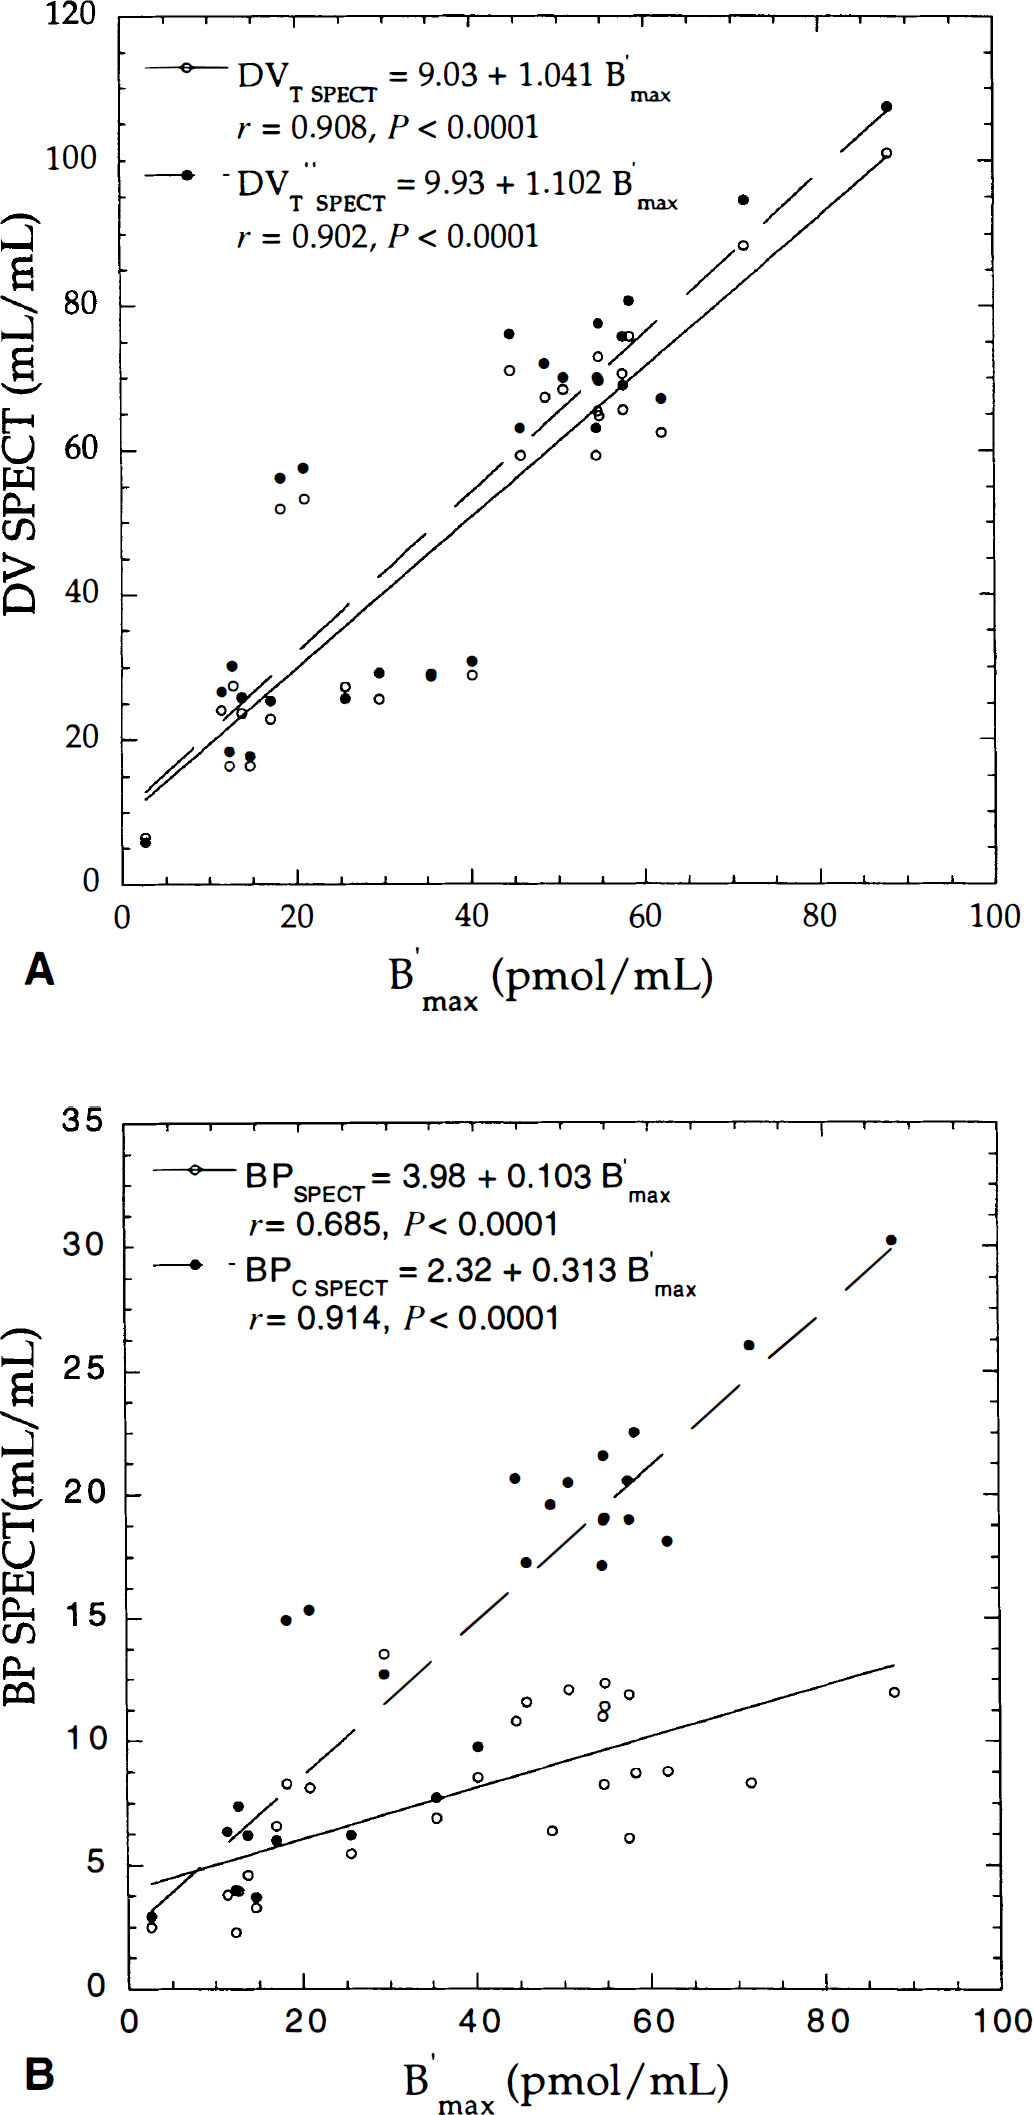
Correlation between the B′max parameter and single photon emission computed tomography (SPECT) distribution volumes (DVSPECT)
Direct PET/SPECT comparison
Binding parameters derived from SPECT data were directly compared with their corresponding absolute values B′max, estimated with PET (Method A). Strong correlation was found between DVT SPECT and B′max, and DVT″SPECT and B′max, despite a bias for DVT″SPECT parameters (Table 6; Fig. 8A). Fig. 8B shows correlation between B′max and BP values estimated from an unconstrained (BPSPECT) and constrained (BPC SPECT) three-compartment model. The low coefficient of correlation between BPSPECT and B′max values was mainly because of convergence problems of the k4 parameter. Table 6 shows variable individual correlation between these two parameters, with a range of coefficients from r = 0.436 to r = 0.708. The best correlation between indices and B′max values was found for BPC SPECT (r = 0.914), followed by DVS SPECT (r = 0.911), DVT SPECT (r = 0.908), DVT″SPECT (r = 0.902), and BPSPECT (r = 0.685).
Mapping of binding parameters
Fig. 9 shows how PET and SPECT binding parameters can be used for a pixel-by-pixel implementation using a wavelet filtering method (Millet et al., 2000), leading to parametric maps of the entire brain. The B′max and KdVR images correspond to the estimated parameters, whereas DV and BP images were calculated from those estimated parameters. The BPPET and DVS PET images were visually similar to the B′max image in most cortical structures. In low-receptor regions and white matter, the BPPET values were slightly higher. The DVT PET and DVT”PET images were close to the DAPET map, as shown in Fig. 5. For SPECT studies, DVTC SPECT, BPC SPECT, DVT″SPECT, and DASPECT parametric images appeared very similar, as previously described in Fig. 6 to Fig. 8. The convergence problems during estimation that were encountered with ROI analysis were confirmed and increased with parametric images at the pixel level (see BPSPECT, aberrant values in red and white). The DVS SPECT and DVT SPECT images, calculated with equations B6 and B8, respectively, have not been obtained with correct standard errors.
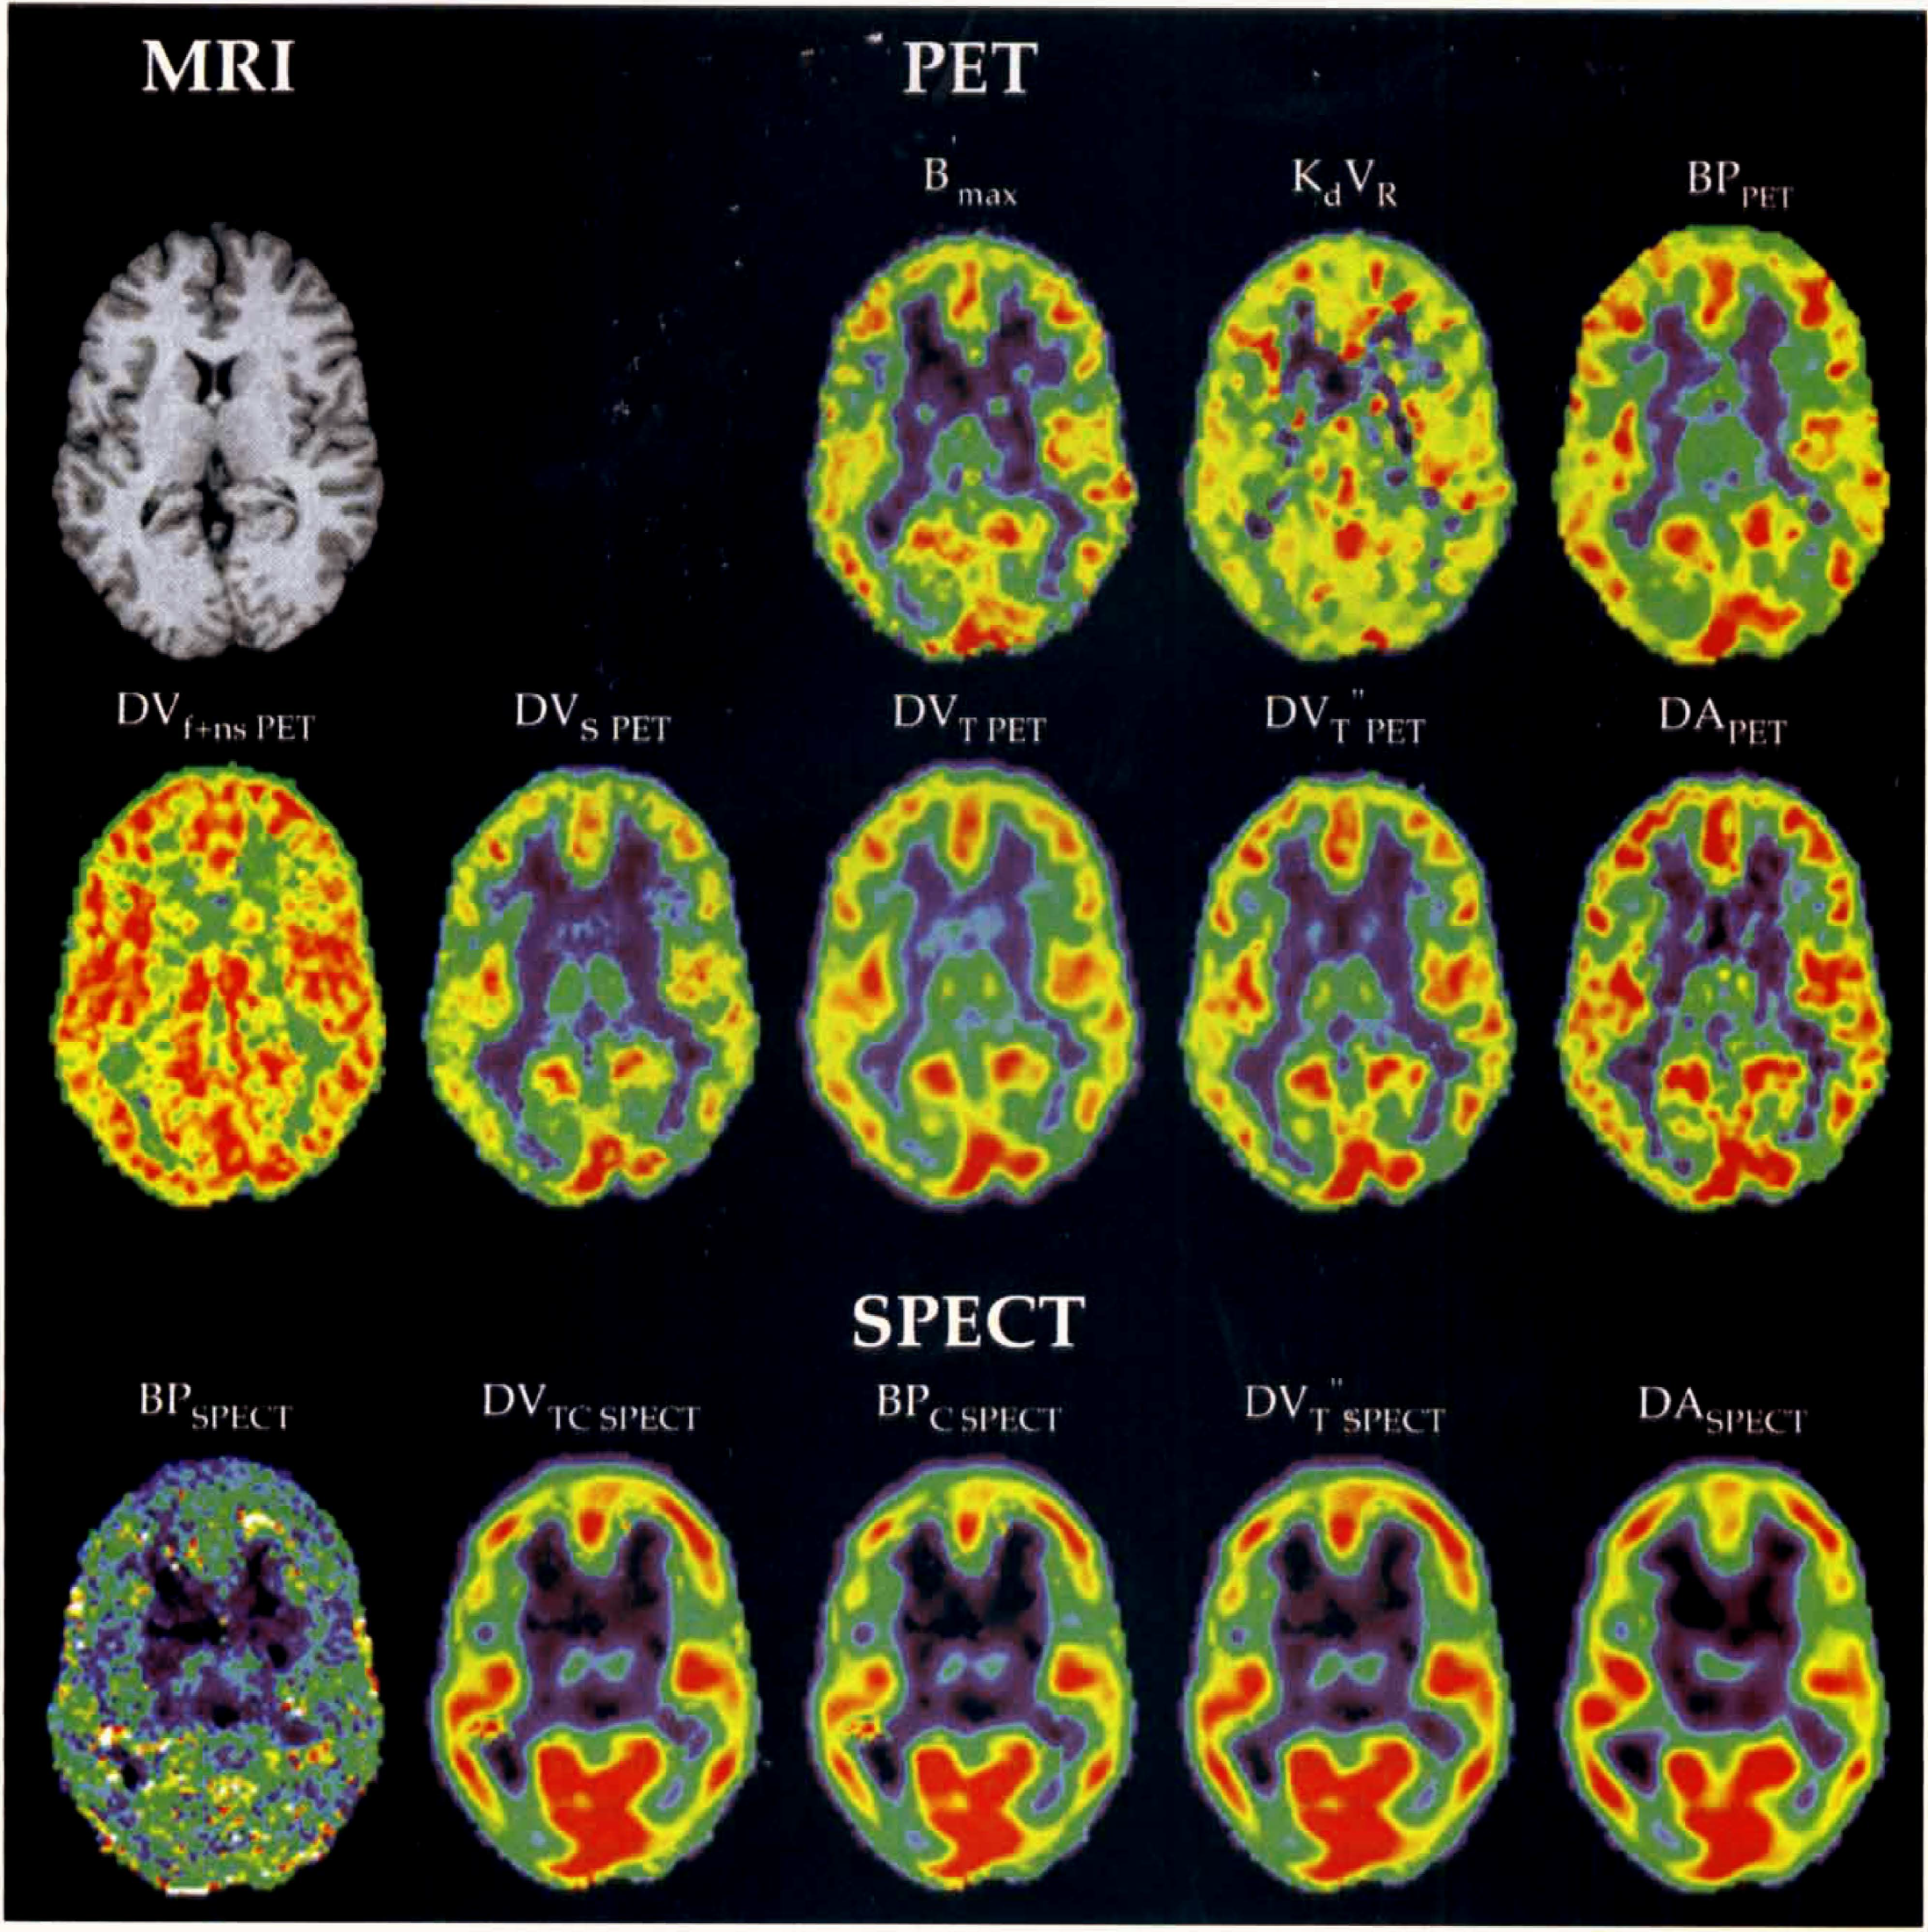
Pixel-by-pixel parametric images of binding parameters estimated from positron emission tomography (PET) and single photon emission computed tomography (SPECT) data corresponding to a slice of one normal subject brain. Anatomic magnetic resonance imaging (MRI) corresponds to the same PET and SPECT slices. This tomographic slice passes through the basal ganglia, thalamus, and frontal, temporal, and occipital cortices. B′max and kdVR parameters correspond to absolute values estimated from PET data with the multiinjection protocol. Binding potential (BP, BPC), total and specific distribution volumes (DVT, DVS), and delayed activity (DA) correspond to indices of receptor concentration. Each image has been rescaled to its own maximum.
In Fig. 10, B′max parametric images obtained in one normal subject are directly compared with the delayed-activity maps using PET and SPECT data. These images show obvious similarities, despite the poorer resolution of SPECT images.
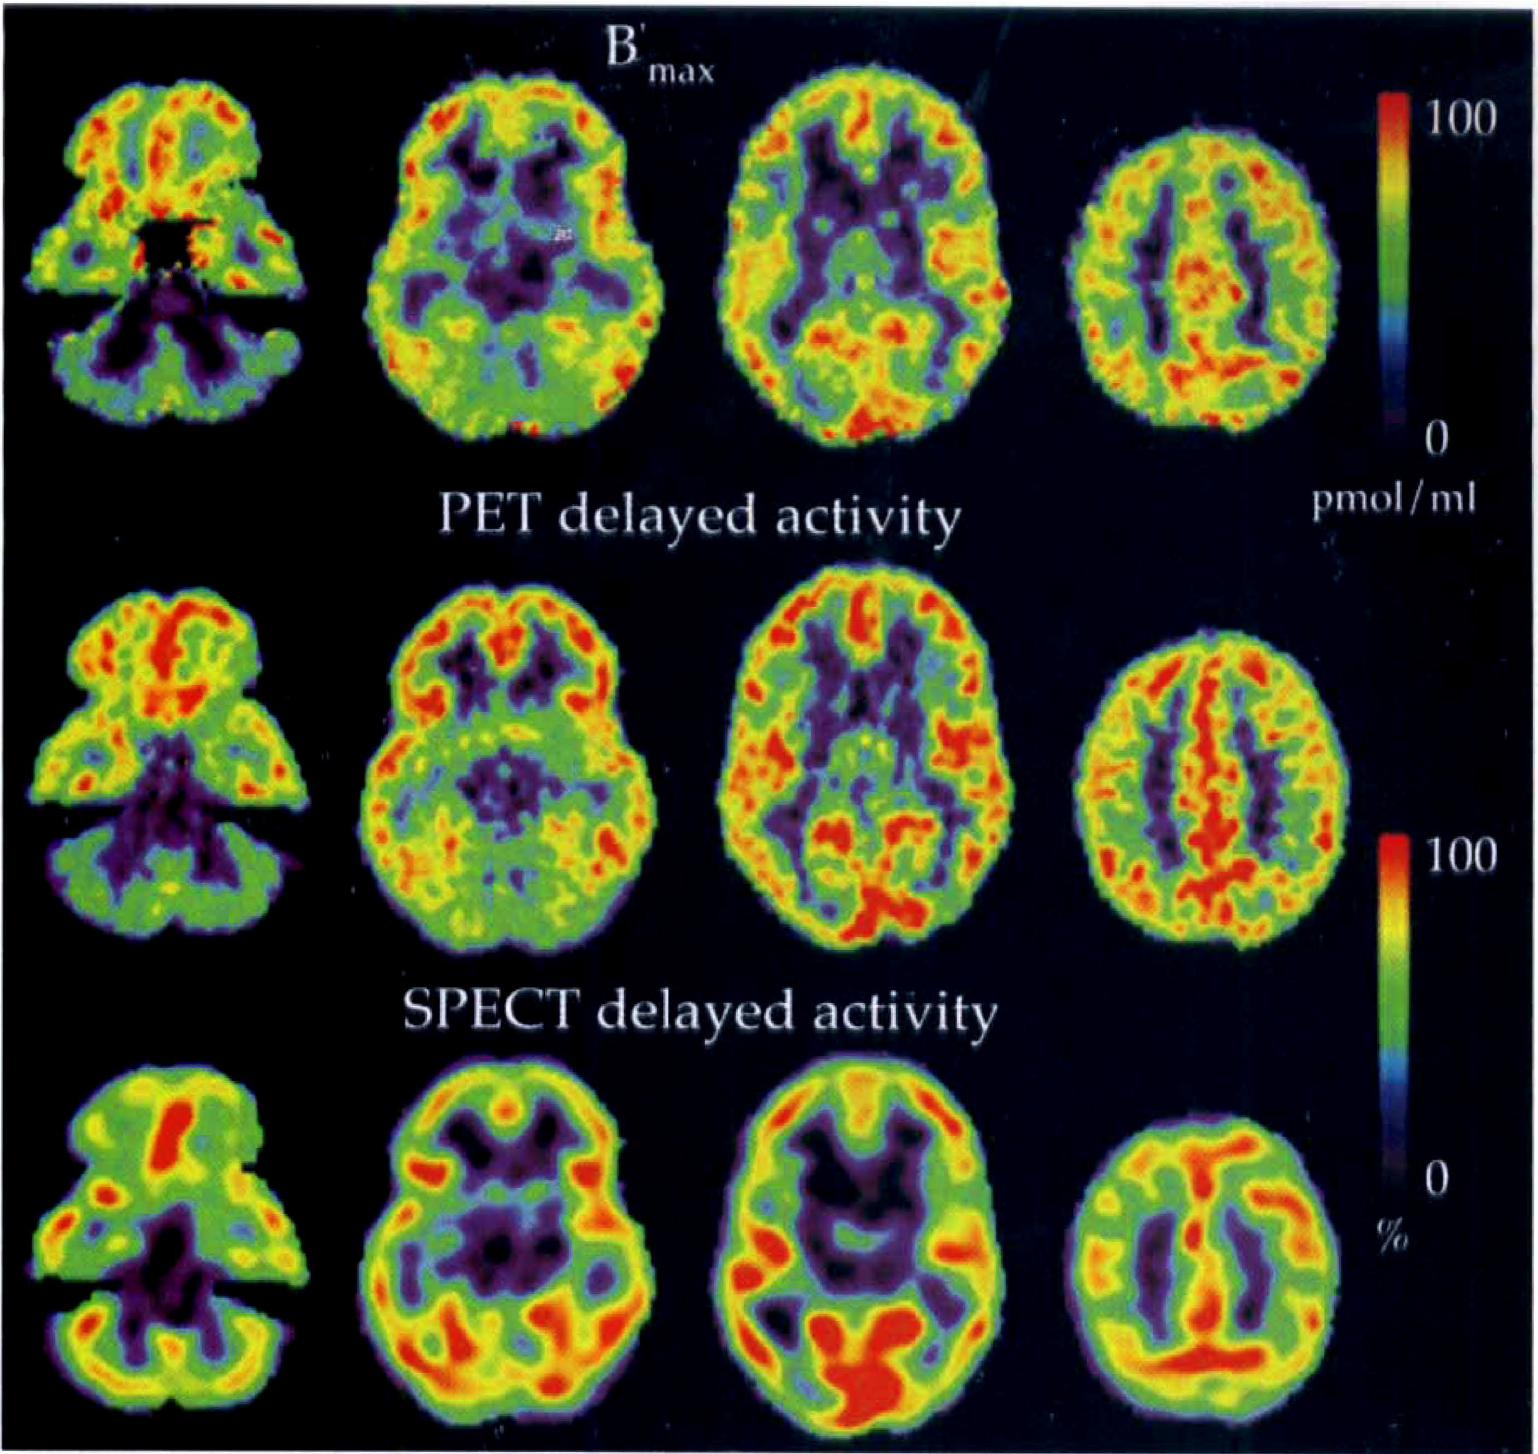
Absolute values of B′max (top row) and indices of delayed activity (middle and bottom rows) of receptor concentration estimated with positron emission tomography (PET) and single photon emission computed tomography (SPECT) data. B′max parameter is estimated with the multiinjection approach, whereas PET and SPECT images are calculated from averaged PET (16, 17) and SPECT (23, 24) frames corresponding to a duration of 10 and 20 minutes, respectively. Images represent 4 matching transaxial levels selected from sets of 35 simultaneously scanned planes. The images show the distinction between areas of highest benzodiazepine receptor numbers within the cerebral cortex and regions of fewer benzodiazepine receptors, including the thalamus, basal ganglia, cerebellar cortex, and the pons.
DISCUSSION
The current study focused on the possibility of extracting binding information from SPECT data. Several studies have demonstrated the usefulness of indices such as BP or DV to measure receptor density (Laruelle et al., 1994b; Abi-Dargham et al., 1994, 1995). However, whereas the methodology for studying ligand-receptor interactions has been widely developed with various radioligands, only one study has correlated binding parameters estimated from PET and SPECT data (Westera et al., 1996). Furthermore, the binding parameters studied corresponded only to DV and BP indices of receptor concentration (B′max). No studies have directly compared the relations between B′max and indices of binding parameters estimated using simplified methods. A comparison between indices of binding parameters and an absolute value, the receptor concentration, seems appropriate to evaluate the efficiency and robustness of these parameters. The analysis of PET and SPECT data in this article is based on the search for a simplified method, giving such robust information about receptor density. Many studies have been performed using ROIs to determine which may be the best strategy to fit the data; thus, statistical tests to compare different model configurations have been widely developed (Laruelle et al., 1994b; Abi-Dargham et al., 1994, 1995; Buck et al., 1996). The current study was primarily restricted to the analysis of correlation between indices used in clinical routine and the B′max parameter. Furthermore, the authors' analysis allowed them to determine the robustness of these indices when they are used to build parametric images at the pixel level, where noise levels of dynamic data are greater than those encountered using large ROIs.
In the current study, the multiinjection approach was used to estimate quantitative values of binding parameters (B′max, KdVR) from [11C]FMZ data. This method, used with various radioligands, was efficient in identifying receptor concentration and ligand affinity with a single experiment, without restriction on model parameters (Delforge et al., 1995). The B′max values estimated in the current study were in concordance with those published previously (Price et al., 1991, 1993; Lassen et al., 1995; Delforge et al., 1995).
The first part of this article was devoted to clarify relations between B′max and indices of receptor concentration using only PET data. The authors have shown, using such data, that the distribution volume (DVT″PET) estimated using a two-compartment model and a single-injection protocol was a good index of receptor density in the context of ligand-receptor interaction using [11C]flumazenil. Furthermore, the distribution volume (DV) values estimated using a two- (DVT″PET) and three- (DVT PET) compartment model are highly correlated. This result is explained by the rapid equilibrium of radioligand between tissue compartments after [11C]FMZ injection. Thus, the DVT″PET parameter can be described by a combination of parameters from a three-compartment model (Eq. A7). As Koeppe et al. (1991) pointed out, the ability to derive binding information from DVT″PET of [11C]FMZ studies is due largely to the tracer's high rate of specific binding and low level of nonspecific binding. Using relations between model parameters estimated from PET data, the authors demonstrated theoretically the relation between B′max and DVT″PET. The first result, shown in Fig. 3A, is the linear relation between B′max and KdVR parameters, widely described for in vivo measurements by several authors (Millet et al., 1995; Delforge et al., 1995). This linear relation derives from the VR term, defined as the 'reaction volume,” and introduced by Delforge et al. (1996) to account for the heterogeneity of the free ligand concentration. Therefore, the equilibrium dissociation rate constant estimated by PET data corresponds to KdVR and not kd alone. Furthermore, this relation has been recently confirmed in the human brain with in vitro studies (Nagy et al., 1999). The second result concerns the correlation between the B′max and k1/k′2 ratio shown in Fig. 3B. For several authors, this ratio is independent of B′max values. However, attempts to fix the k1/k′2 ratio to a constant value to improve parameter estimates produce larger B′max values (Price et al., 1993). The authors found a correlation between the B′max and k1/k′2 ratio, suggesting that these two parameters are not totally independent. Nevertheless, the simplification of the model by combining the free and nonspecific compartments in a single compartment concerns the k′2 parameters (Appendix A). This simplification, valid with rapid equilibrium condition between free and nonspecific compartments, may not be justified in poor receptor regions (Koeppe et al., 1991). However, this problem with the k1/k2′ ratio does not perturb the correlation between DVT″PET and B′max as shown in Fig. 4, and this relation can be easily approximated, in this instance to a linear relation (r = 0.954).
Using SPECT data, the DVT and BP values calculated differed by a constant value from published results (Abi-Dargham et al., 1994, 1995). This difference was essentially because of the method used to access input function, in particular, the free fraction (f1) of unmetabolized iomazenil not bound to protein (Westera et al., 1996). However, the method used to determine [123I]Iomazenil arterial plasma activity did not influence coefficients of correlation results.
Using SPECT data, the authors used two-and three-compartment models to estimate binding parameters. The unconstrained three-compartment model led to serious convergence problems during the estimation procedure. The difficulty in estimating four parameters correctly from a three-compartment model with SPECT data, using a single injection protocol, has been reported frequently in the literature (Laruelle et al., 1994b; Abi-Dargham et al., 1994, 1995). Therefore, several authors proposed that this model should be simplified by constraining the k1/k2 ratio to a constant value (Laruelle et al., 1994b; Abi-Dargham et al., 1994, 1995). This simplification, when applied to the current data, canceled the convergence problems and improved standard errors on parameter estimates. The use of a two-compartment model to fit SPECT data produced a slight bias on DVT values, which can be explained by the longer time needed for equilibration of [123I]iomazenil between the tissue compartments. Although better fits were obtained with a three-compartment model (Abi-Dargham et al., 1995; Buck et al., 1996; Bremner et al., 2000), the authors showed a strong correlation, close to unity, between DVT SPECT and DVT″SPECT values, and no divergence problems were noted during the fitting process using a two-compartment model.
The similarity between SPECT binding indices and the B′max parameter suggests that the DVT″SPECT parameter, estimated with a two-compartment model, is a robust method to access receptor density information. The authors showed that it is impossible to build correct parametric maps using an unconstrained three-compartment model because of divergence problems. The use of constrained three-compartment and two-compartment models led to similar maps of binding parameters. As shown with the correlation analysis, the authors did not observe significant differences between these images. In contrast to the usual SPECT studies (Laruelle et al., 1994a, 1994b; Abi-Dargham et al., 1994, 1995), the current SPECT data have been obtained with only 4 mCi [123I]iomazenil. This recommended low dose (Verhoeff et al., 1993) can lead to low signal-to-noise ratios in dynamic data, and thus will tend to increase divergence problems during the estimation procedure. For example, the BPSPECT parameter is nonidentifiable with the current SPECT data using an unconstrained three-compartment model, because of difficulties in identifying k3 and k4 parameters with acceptable standard errors. The unconstrained three-compartment model can be used to analyze SPECT data with a high signal-to-noise ratio, but becomes unreliable with noisy data obtained using SPECT. This noise problem is important because it is a limiting factor in parametric imaging. With the wavelet filtering, the authors were able to build PET and SPECT parametric images at the pixel level (Millet et al., 2000). Parametric imaging has also clearly confirmed the results of correlations between these binding parameters. The authors observed large similarities between DV, BP, DA maps, and the B′max images. The only difference can be noted in poor receptor regions, such as cerebellum, where the SPECT delayed activity values are larger than those in B′max images. A possible explanation is that in the poor receptor regions, the equilibrium state is reached later and the measured delayed activity can be overestimated (Frey et al., 1991).
This work has focused on methods that can be used in clinical routines in which a compromise between accuracy and simplicity of the method used is important. Results of the comparison between delayed-activity and distribution volume values in PET and SPECT are essential. Correlation coefficients are slightly different from unity (Figs. 5 and 7). It is possible to gain access to information on receptor density directly with delayed-activity images without measuring the input function (arterial catheter) and without acquiring the whole set of kinetic data of the radioligand. Therefore, the long time needed for equilibration of [123I]iomazenil, as compared with that of [11C]flumazenil, is not a restrictive problem because only 20 to 30 minutes of summed data are required, 90 minutes after injection. The delayed-activity index is a relative measure directly obtained from PET or SPECT data. However, it is possible to have an absolute index, for intersubject comparisons, by dividing PET or SPECT values by the specific activity and by the injected dose.
Moreover, these indices of benzodiazepine receptor density are independent of cerebral blood flow and glucose metabolism changes. Indeed, it has been shown recently (Meyer et al., 1995; Ohyama et al., 1999) that the receptor density and distribution volume values are normal in Alzheimer's disease patients, with a decrease of cerebral blood flow and glucose metabolism.
Footnotes
Abbreviations used
APPENDIX A
Fig. A1 shows a three-compartment model (unmetabolized FMZ in plasma, free and nonspecific ligand, and ligand bound to receptor sites) used to estimate five parameters (B′max, k1, k′2, kon/VR, koff) with the multiinjection approach (Syrota et al., 1984; Delforge et al., 1993). The parameters k1 and k′2 are associated with the exchanges between the plasma and the free and nonspecific ligand compartment. In the context of FMZ studies, the authors used a simplified configuration of the model that combines the free and nonspecific compartments in a single compartment (Goeders and Kuhar, 1985; Koeppe et al., 1991). Therefore, the k2 parameter is modified and can be expressed by the following expression: k′2 = k2/(1+k5/k6), where k5 and k6 correspond to the rate constants describing exchanges between nonspecific and free compartments. B′max represents the concentration of receptors available for binding (effects of endogenous ligands are not included in model); kon and koff are the association and dissociation rate constants, respectively; and VR is the volume of reaction, which accounts for tissue inhomogeneity (Delforge et al., 1996). The kon and VR parameters cannot be estimated separately, and only the kon/VR ratio is identifiable. Consequently, only the apparent equilibrium dissociation constant, KdVR, can be estimated. Kd is the equilibrium dissociation constant, defined as the ratio of koff to kon. The parameter FV represents the fraction of blood present in the tissue volume and is assumed to be 0.05 in this study.
The multiinjection protocols include injection of unlabeled ligand (with or without simultaneous labeled ligand injection). The kinetics of the unlabeled ligand affects the local concentration of free receptor sites and therefore must be taken into account. The unlabeled and labeled ligand kinetics are assumed to be similar. Thus, the model contains two components with the same structure and parameters. The plasma concentration of the unmetabolized unlabeled ligand was simulated from the curve corresponding to the labeled ligand. Parameter identification and simulations of labeled and unlabeled ligand kinetics were performed using the equation system corresponding to the model diagram of Fig. A1 (Delforge et al., 1993):
and the unlabeled ligand kinetic is described by,
where B′max, k1, k2′, kon/VR, koff are the unknown parameters.
In PET studies, experimental data [denoted by M*T(t1)] collected between times ti-1 and ti are given by the following integral relation:
From the model parameters estimated, some binding parameters can be calculated (Mintun et al., 1984; Koeppe et al., 1991):
APPENDIX B
Figure B1 shows a three-compartment model used to analyze kinetics of [123I]iomazenil in the brain. It includes the arterial plasma compartment concentration (Ca(t)); the nondisplaceable compartment concentration (Cf+ns(t)), which corresponds to the free, nonspecific compartment concentrations; and the specifically bound compartment concentration (Cs(t)). The tracer concentration over time in each compartment is given by:
where k1 and k2′ parameters define rate constants (min−1) for transfers across the blood–brain barrier (BBB) (k2′ = k2/(1 + k5/k6)), and k3′ and k4 are rate constants (min−1) for transfers between free and bound compartments (k3′ = k3/(1 + k5/k6)). The k5 and k6 parameters are the rate constants for transfers between the free and nonspecific compartments. The total activity in a region of interest (CROI(t)) is described by:
where Fv is the vascular fraction fixed to 5% in the current study.
The equilibrium volume of distribution of a compartment, i, relative to the free tracer (DVi), was defined as the equilibrium ratio of the tracer concentration, Ci, to the free tracer concentration in the arterial plasma (Ca) (Mintun et al., 1984),
Equilibrium distribution volumes can be calculated from model parameters using Eq. B4. Only definitions are given in this Appendix because the theory is widely described in the literature (Laruelle et al., 1994b; Abi-Dargham et al., 1994, 1995).
DVf+ns, DVs, and DVT are the nondisplaceable (free + nonspecific), specific, and total equilibrium distribution volumes, respectively, relative to the arterial tracer concentration. BP corresponds to the binding potential.
APPENDIX C
Figure C1 shows a two-compartment model used to analyze brain uptake of [11C]FMZ and [123I]iomazenil. This configuration has been proposed by Koeppe et al. (1991) to describe the kinetics of [11C]FMZ. A single tissue compartment that involves the three tissue components: CT′ = Cf + Cns + Cs, can be used because of a rapid equilibrium state between all tissue compartments with [11C]FMZ data. The equilibrium volume of distribution is given by:
where k1 = k1′ = k1” and k2” = k2′(1 + k3′/k4).
APPENDIX D
The distribution volume concept assumes that equilibrium is reached between the tissue compartments. In this case, using the model equations at the equilibrium state, the following relation is immediately obtained (Millet et al., 1995):
where DA(t) is the delayed activity, λ is a constant, and Ca(t) is the input function. The main interest of the activity image approach is to avoid excessive blood sampling.