
Abstract
An accurate
INTRODUCTION
Myelin is a layered tissue wrapping the axons of neurons. The function of myelin is crucial for a proper transmission of the electric impulses in the central (CNS) and peripheral nervous system. Myelin acts as an axonal electrical insulator, enhancing the neuronal impulse speed as well as balancing the system energy.
1
Chemically, myelin is defined as a lipid–protein complex. In human CNS, myelin is composed by a high proportion of lipids (70% to 85%) and a low amount of proteins (15% to 30%), whose composition is simpler than that of other brain membranes.
2
The major lipids of myelin are glycolipids, phospholipids, and cholesterol3 while the proteins are the
The presence of myelin is fundamental for enabling a correct functioning of the CNS, 6 brain maturation, 7 as well as nervous tissue plasticity. 8 Alteration and damage of the myelin sheaths are linked to several brain disorders such as multiple sclerosis and leukodystrophies. 9 A reliable measure of the tissue myelin content would allow us to significantly improve our understanding of the physiopathological mechanisms underlying these disorders and would offer the opportunity to evaluate the effects of neuroprotective or pro-myelinating therapies.10–12
Positron emission tomography (PET) represents a well-established tool for imaging the CNS at the molecular level,
13
and therefore it has the potential for detecting ongoing demyelination and remyelination processes
Myelin-binding properties and uptake of [11C]BMB, [11C]CIC, [11C]MeDAS, and [11C]PIB have been studied in preclinical models of demyelinated diseases,14,27 but only [11C]PIB has been validated to image myelin and demyelinated lesions in humans. 15 The PIB staining of CNS myelin brain sections, both in mice and in baboon postmortem sections, has been shown to be proportional to the tissue myelin content. 15 In preclinical models, [11C]PIB tissue uptake reflected the ability to separate normal myelinated tracts, demyelinated lesions, and remyelinated regions15,27 across the whole brain. In humans, examination of demyelinated plaques in two relapsing-remitting multiple sclerosis patients showed a significant decrease for [11C]PIB uptake compared with the normal-appearing white matter (NAWM) tissues and a different behavior between active and nonactive lesions. 15
Analysis of [11C]PIB PET images is well described in the literature and a number of quantitative approaches have been presented. Compartmental modelling and graphical kinetic methods have been employed for the quantification of the tracer binding with arterial input functions. 19 Subsequently, simplified kinetic approaches using reference regions (e.g., the cerebellum or gray-matter (GM) voxels selected via statistical clustering of tissue kinetics) have been suggested to avoid arterial cannulation and blood analysis during the PET acquisition.28,29 Both plasma and reference region approaches provide reliable parametric maps that can be used with high sensitivity to discriminate between the healthy and the pathological state of the tissues. To date, amyloid imaging is the unique context in which the use of [11C]PIB PET methods have been validated.
This work proposes a specifically-designed protocol of data acquisition and analysis aimed at the voxelwise quantification of [11C]PIB PET employed as a specific tracer for myelin in brain tissues.
Two of the major requirements that need to be fulfilled by this methodology are (1) general applicability to a wide range of dysmyelinating pathologies, a condition that is satisfied by avoiding the use of blood sampling during the PET examination; and (2) the generation of reliable and reproducible high-resolution parametric maps to allow application in both cross-sectional and longitudinal studies.
In this work, we have used a high-resolution PET scanner and paid particular attention to the selection of appropriate reconstruction settings to find the best compromise between spatial resolution and data variability. The relationship between resolution (lesion size) and sensitivity of [11C]PIB myelin imaging as well as the partial volume effect on the [11C]PIB uptake were also assessed. Finally, we used the normal [11C]PIB data to construct a myelin density brain template in standardized coordinates and tested its fidelity to the patterns predicted by an atlas of mRNA expression of myelin-associated proteins in the same anatomic space.
MATERIALS AND METHODS
Data Set
Ten healthy control subjects (3 male, 7 female, age: 29.5 ± 6.2 years) were enrolled in this study. Ethical approval was granted by the ethics committee of the Pitie-Salpetriere Hospital (Approval No. P080503) and informed written consent was obtained from all participants. This study was conducted according to the Declaration of Helsinki. Inclusion criteria consisted in an age between 18 and 55 years and the exclusion of any known neurological or psychiatric condition.
Each volunteer involved in the study was scanned twice, with the retest scan performed within approximately 1 month from the baseline.
Positron Emission Tomography and Magnetic Resonance Imaging Data Acquisitions
All PET exams were performed on the high resolution research tomograph (HRRT) (CPS Innovations, Knoxville, TN, USA). This brain dedicated PET scanner achieves an intraslice spatial resolution of ~2.5 mm full width at half maximum, with 25 cm and 31.2 cm of axial and transaxial field of view, respectively. 30
The 90-minute emission scan was initiated coincident with a 1-minute intravenous bolus injection of [11C]PIB (mean 358 ± 34 MBq). Images were reconstructed using the 3D ordinary Poisson ordered subset expectation maximization algorithm (POSEM). 31 Different number of POSEM iterations (1, 2, 3, 4, 6, and 10) were implemented to find an appropriate trade-off between image resolution, quality of the data, and reliability of results. An additional smoothing filter implementing the point spread function (PSF) was applied to the 10-iteration reconstructed image. This range of reconstruction setting was selected among the common approaches used for HRRT PET scanner in dynamic brain PET imaging. 32
All the resulting dynamic PET images consisted of 25 frames of data (6 × 1, 6 × 2, 4 × 3, 6 × 5, 3 × 10 minutes) with a voxel size of 1.22 mm × 1.22-mm × 1.22 mm. Interframe subject motion correction was applied by realigning each PET frame to a common reference space through a procedure similar to those reported by Montgomery
In addition to the PET scans, all subjects underwent a 3D anatomic brain magnetic resonance imaging (MRI) using a 3T Siemens system (Siemens, Erlangen, Germany; TRIO 32-channel TIM system): T1-weighted MPRAGE (echo time/inversion time/repetition time = 2.9/900/2,300, flip angle = 8°, pixel resolution = 1 × 1 × 1.1 mm). Gray matter, white matter (WM), and basal ganglia (BG) were automatically extracted from MRI image by combining outputs from VBM8 toolbox (http://dbm.neuro.uni-jena.de/vbm/download/) and FIRST (http://fsl.fmrib.ox.ac.uk/fsl/) using a probability threshold of 90%. Segmented MRI images were hence coregistered to PET using rigid transformation estimated using Flirt (http://fsl.fmrib.ox.ac.uk/fsl/) maintaining PET data in its original space and avoiding further loss of resolution due to interpolation.
Voxelwise [11C]PIB Positron Emission Tomography Quantification: Analysis Pipeline
To make the procedure of general applicability, hence avoid blood sampling, we focused our methodology development toward reference region approaches.19,28 In general, a reference region method consists of a two-step procedure that requires: (1) the selection of a brain tissue region containing no or negligible amount of specific binding and (2) the use of a quantification model in which the plasma tracer information can be replaced with the tracer activity in the reference region.
In this work, for the extraction of the reference time-activity curve (TAC), we exploited the supervised clustering method developed by Turkheimer
For this particular study, three classes were defined: normal GM, high-specific binding GM (e.g., amyloid bound fraction), and blood pool. The reference class of choice was normal GM. Details on the definition of the kinetic classes and on the implementation and validation of the procedure may be found in the original methodological work. 29 Since the original method was defined on different scanners using filtered back-projection reconstructions we also evaluated the fidelity of the kinetic classes used as a standard to normal GM in this novel context.
Once the reference TAC was extracted, [11C]PIB binding was calculated by application of a kinetic operator to the measured dynamic PET activity. Several quantification approaches based on the reference input are available in the literature: the simplified reference tissue model, 35 the rank-shaping spectral analysis, 36 and the Logan graphical methods. 37 All these methodologies can be applied at the voxel level and can return the distribution volume ratio (DVR), defined as the ratio of the total distribution volume between the target and the reference region. Distribution volume ratio is the parameter of interest because it is directly linked to tracer-target affinity as well as the target density. 35 In the instance here, in which [11C]PIB is used as a myelin marker, the DVR becomes a proxy of myelin density.
For the Logan analysis, we chose to apply both the standard Logan with reference (
In parallel to the quantitative PET analysis, maps of standardized uptake value (SUV), defined as the measured activity (from 30 to 70 minutes) normalized by the injected activity and subject weight, were also computed. This implementation was optimized to maximize the contrast between WM and GM. 15 A comparison between SUV and DVR parametric maps was performed to understand whether static [11C]PIB PET scans could be used as a surrogate of dynamic [11C]PIB PET imaging.
Statistical Analysis
Quantification methods were evaluated in terms of reliability and reproducibility of the estimates. The first was assessed looking at the failure rate (i.e., fraction of voxels where methods did not converge to solution) and the outlier rate (i.e., fraction of voxels where the methods did not provide a biologically meaningful solution). Voxels with negative estimates for SUV analysis and DVR estimates with coefficient of variation > 100% were considered as outliers. Reproducibility was assessed looking at the test–retest repeatability of the results and was measured by the intraclass correlation coefficient (ICC) and the mean relative differences. Both repeatability and reproducibility analyses were performed with varying number of POSEM iterations to assess the impact of reconstruction setting on quantification metrics. To indicate the level of noise produced by each reconstruction setting, the mean of tracer activity over its standard deviation measured across the image voxels was used as proxy of the signal-to-noise ratio (SNR).
Analysis of Local Contrast and Reproducibility
The processing of PET-derived myelin density maps potentially allows the analysis of WM density changes at the local level from large regions to areas of few millimeters size, up to the voxel level. However the technique, in order to be applicable, needs to be sensitive and reproducible at these high resolution levels. Thus, we reanalyzed test–retest reproducibility as well as GM/WM contrast in small regions with volumes equivalent to spheres of 2.5, 5, 7.5, and 10 mm diameter. The procedure was the following:
Given a particular subject, two regions (with volume comparable to a sphere of a given diameter), one in WM and one in GM, were randomly drawn on the individual structural T1-weighted MR image.
These GM and WM regions were moved to the parametric PET space, both in test and in retest images, by coregistering the individual MR on the test and retest PET spaces.
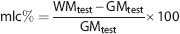
The mean of voxel estimates within each region (respectively GMtest, GMretest, WMtest, and WMretest) was computed. From these results, mean local contrast (mlc%) and mean local reproducibility (mlr%) were defined as:
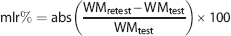
Similarly, mlr% was computed also for GM simulated regions (using GMtest and GMretest, respectively).
The procedure was repeated 500 times for each subject considering all the tested reconstruction settings and all the preselected region diameters for both SUV and DVR maps. Mean and variability of mlc% and mlr% distributions were compared to determine the effect of region size and reconstruction on analysis.
To combine both contrast and reproducibility in a unique measure, a performance score index (p-index) was defined by normalizing the mean contrast to the test–retest mean and variability as:
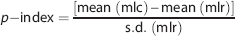
where
The spatial variability of DVR voxel estimates across the brain was investigated to assess the impact that regions with low activity concentration (like ventricles or brain sinus) might have on the tracer quantification for the highly myelinated adjacent tissues. Specifically, the mean DVR voxel estimates for GM and WM were analyzed as function to the cerebral spinal fluid (CSF) distance, to estimate the partial volume effect of this tissue on the rest of the brain.
[11C]PIB Positron Emission Tomography Binding: Correlation with Myelin-Associated Protein Gene Expressions
To complement the analysis above and enable comparison of the methodologies used with an independent predictor of myelin density, we tested the spatial brain profile of the myelin maps produced versus the one predicted by the brain mRNA expression maps of a set of myelin-associated proteins contained in the Allen Human Brain Atlas.
38
We have previously shown that these maps are highly predictive of protein levels in vivo measured with PET for all those transcripts that do not undergo significant posttranscriptional modifications (
For the purpose, we created from the 10 subjects a [11C]PIB DVR template in stereotaxic MNI (Montreal Neurological Institute) space. We then tested the [11C]PIB binding spatial profile obtained from this standardized map, versus the mRNA protein expression profiles of PLP1, PLP2, MBP, CNP, MAG, MOG, MOBP, and MPZ. These proteins were selected based on their prevalence in the myelin sheath. 4 The comparison was performed by correlation analysis at the regional level according to the anatomic segmentation of the Hammersmith anatomic atlas as described in our original reference. 39
RESULTS
Impact of Poisson Ordered Subset Expectation Maximization Algorithm Reconstruction Setting on Data Quality
Figure 1 provides an example of the effect of different settings used for POSEM reconstruction on the raw PET images. The images refer to the 60-minute frame of a transaxial brain slice at the cortical level in a representative subject of the data set. As expected, increasing the number of iterations improves the spatial resolution at the cost of higher noise. In the range of POSEM iterations that we considered, the image evolved from a smooth appearance (POSEM 1 iteration, SNR1-iteration = 43
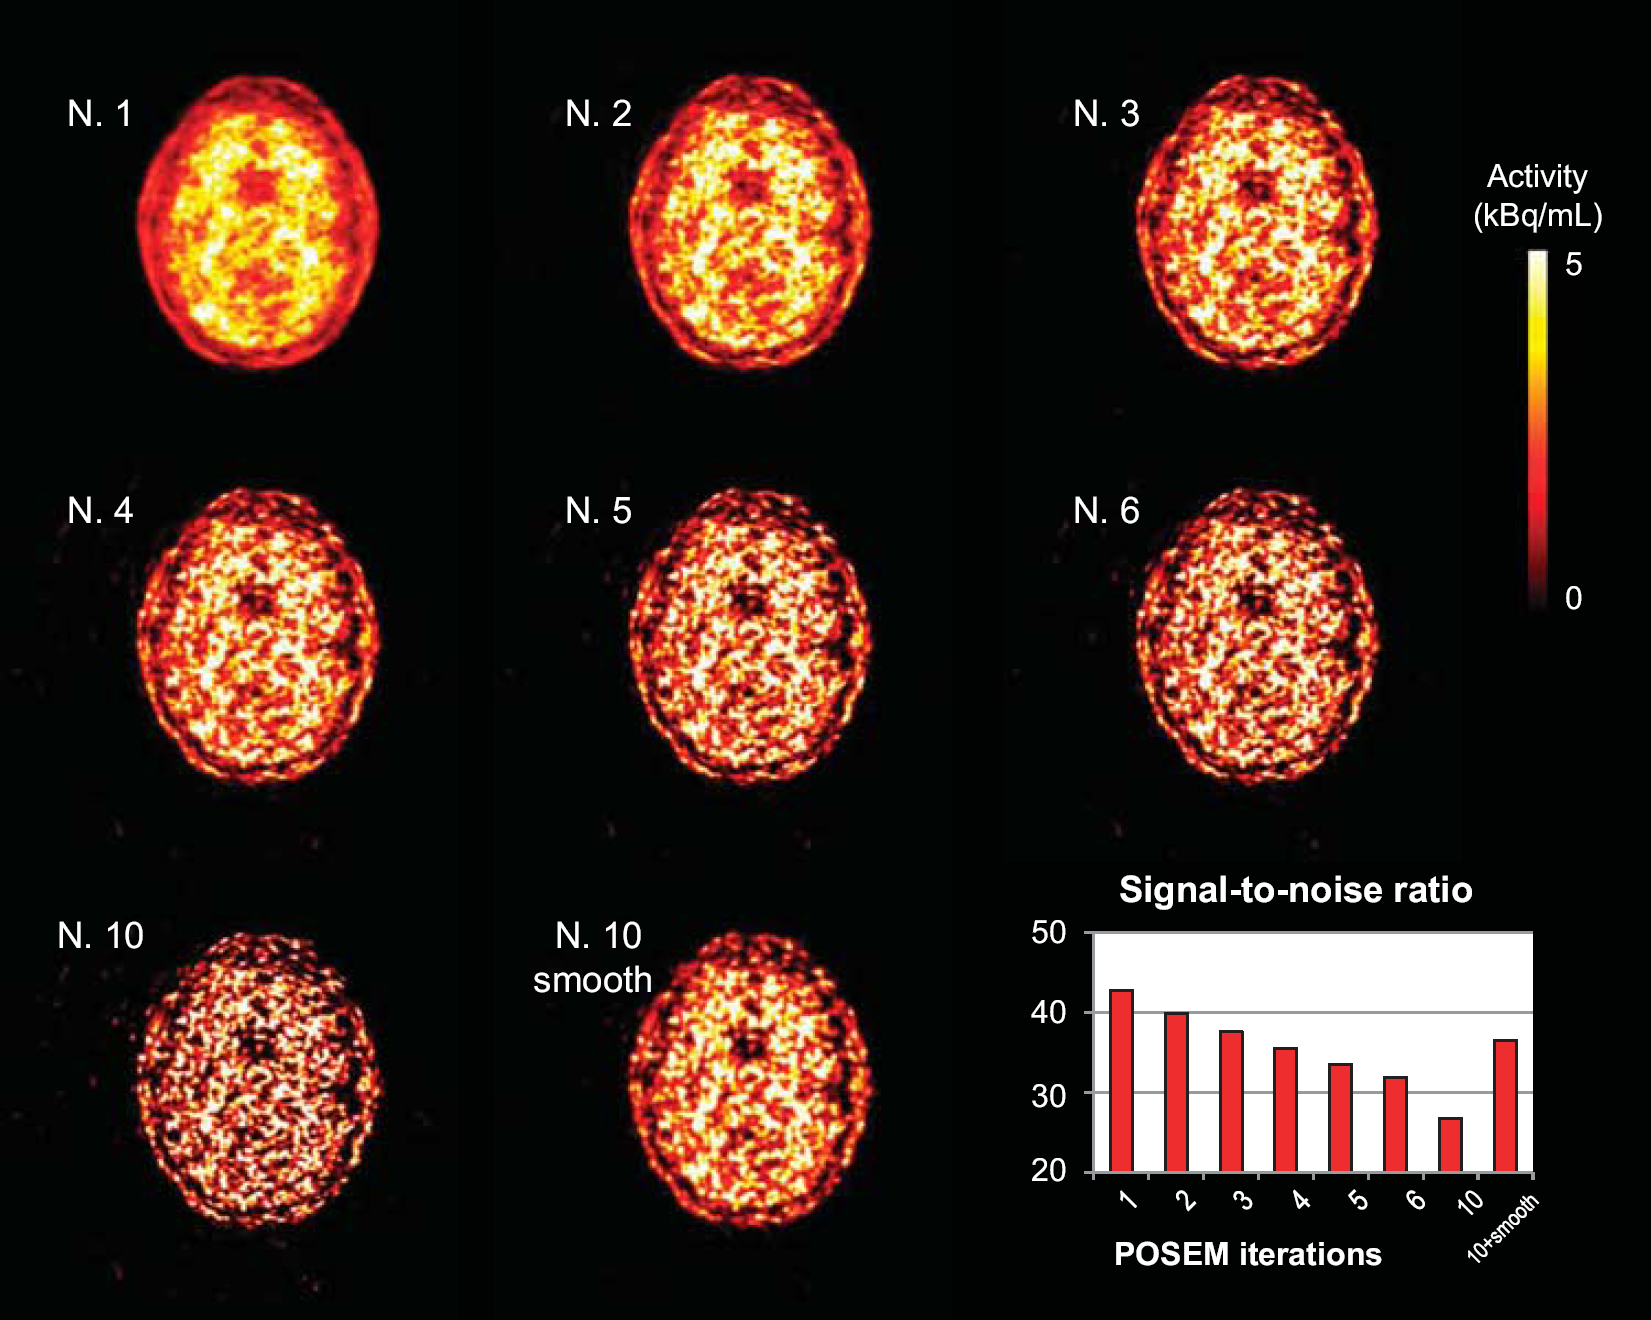
Impact of the reconstruction setting on positron emission tomography (PET) image quality. The figure shows an example of PET images obtained from the same acquisition by modifying the reconstruction setting: Poisson ordered subset expectation maximization algorithm (POSEM) 1, 2, 3, 4, 5, 6, 10 iterations and POSEM with 10 iterations combined with point spread function (PSF) smoothing. Maps refer to the same transaxial slice, 60 minutes after tracer injection, obtained from one representative subject of the study. Trend of SNR (SNR = mean/s.d. of the voxel activity) levels calculated from each image is reported in the bar graph as function of reconstruction setting. SNR, signal-to-noise ratio.
The differences in the noise content of the reconstructed image directly impact on the ROI TAC definitions (Figure 2). Moving from the 1-iteration to the 10-iteration scenario, it can be noticed how GM, BG, and reference regions present a sharpened peak (range 15% to 25%) and a lower tail (range 7% to 15%), while for the WM TACs the opposite is true. The POSEM iterations impact also on the supervised clustering results in term of number and the position of the voxels associated with the reference class (Figure 2). Notably, the higher the number of iterations, the better the agreement of the normalized reference TAC with the reference GM class (Supplementary Material—Figure 1). This consistency between extracted references and GM class supports the use of the supervised clustering even with data acquired with HRRT PET scanner.
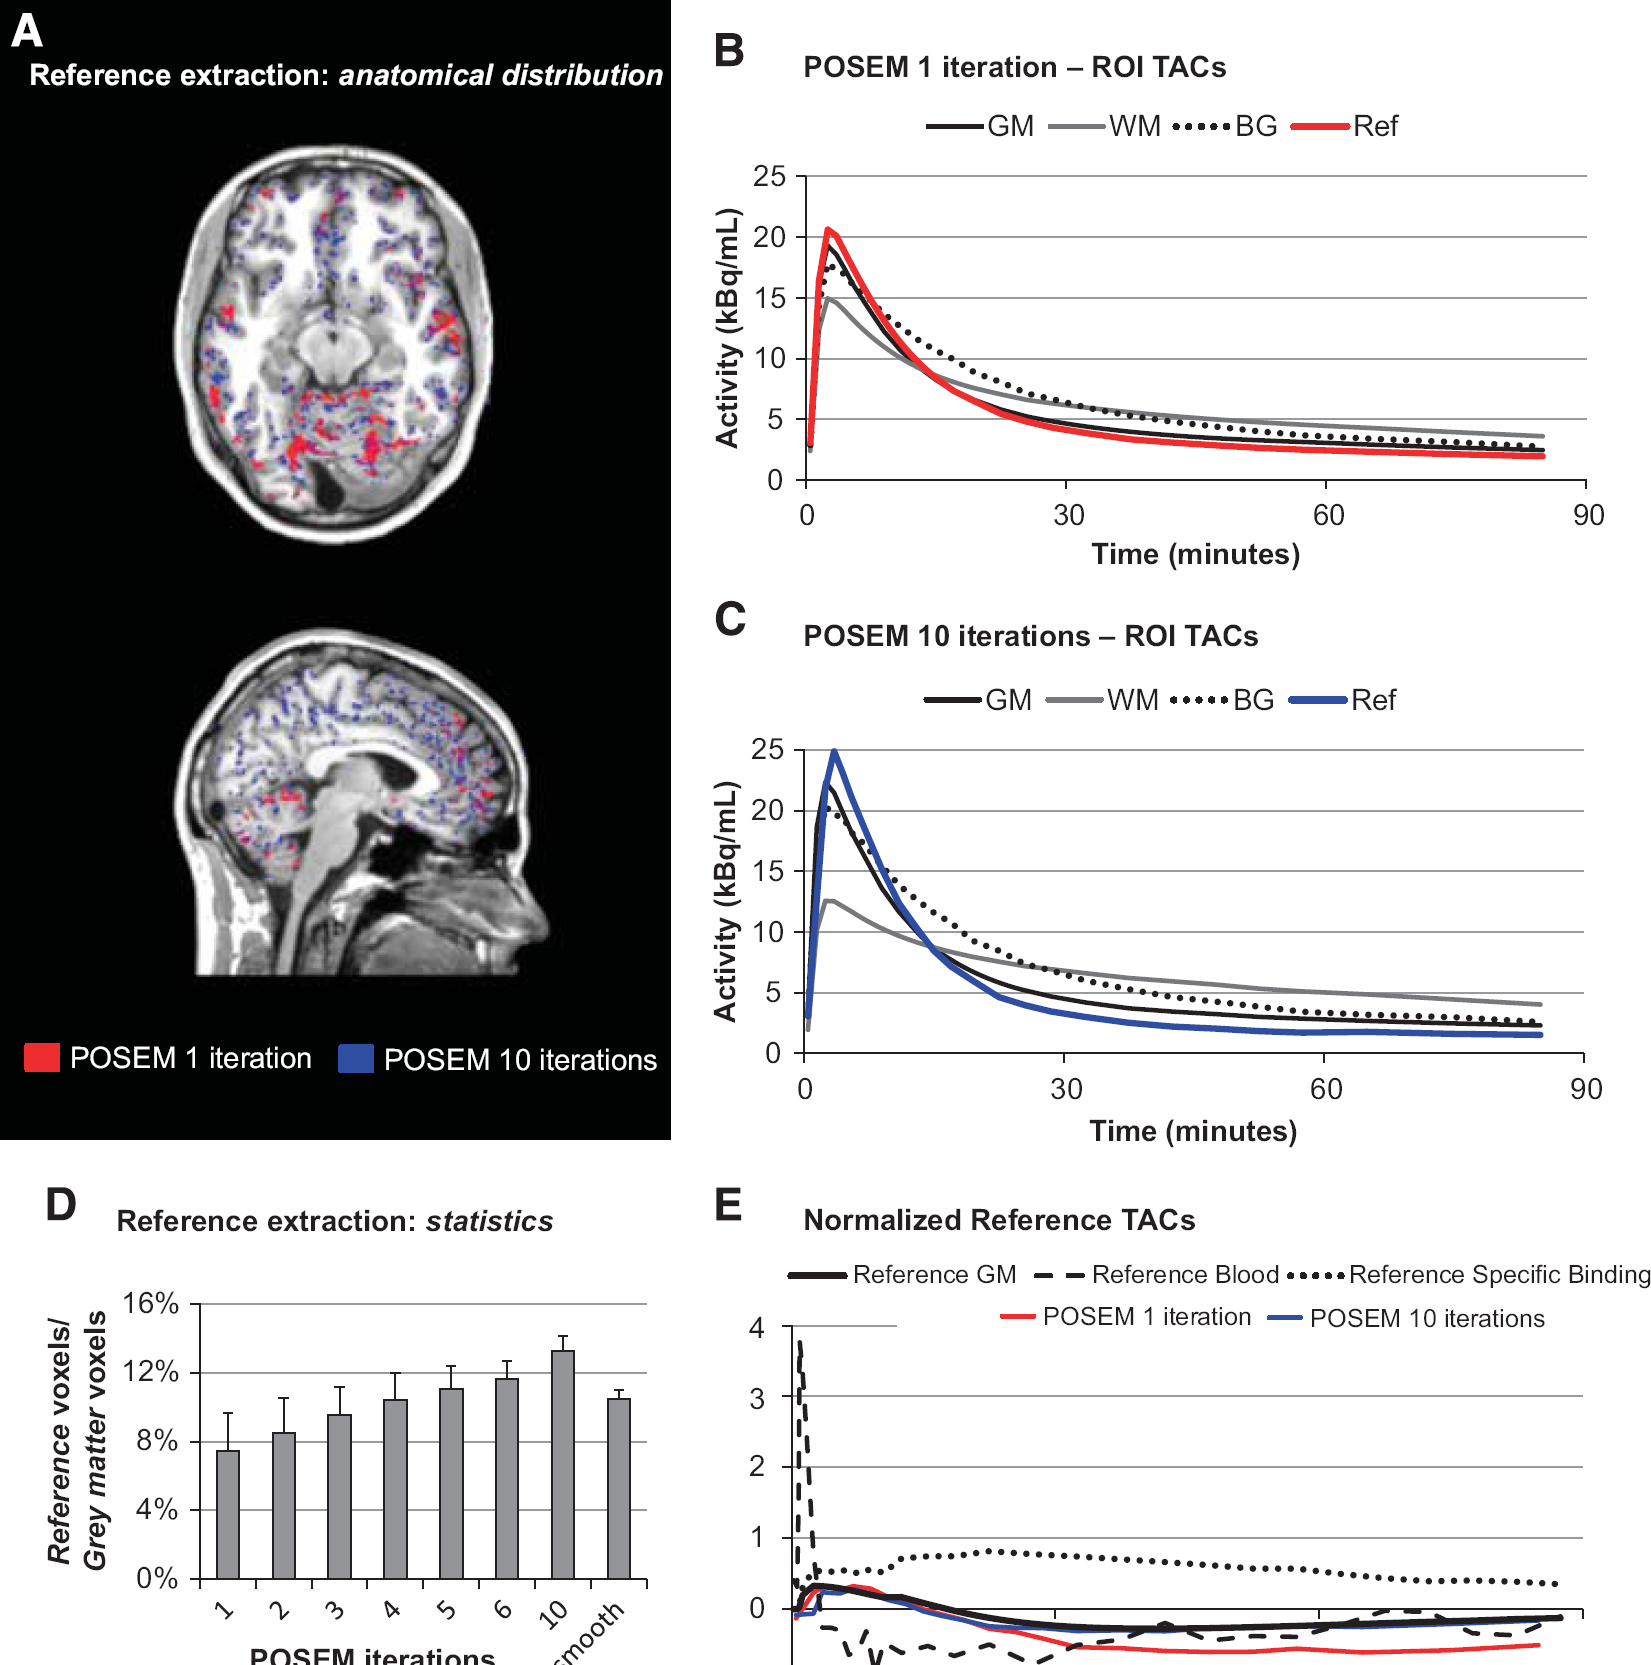
Impact of reconstruction setting on reference region extraction. (
[11C]PIB Positron Emission Tomography Data Quantification
The use of different POSEM reconstruction settings led to a plurality of parametric maps for both Logan and SUV. Depending on the number of iterations used for POSEM, it can be observed that the spatial and intensity pattern of the voxel estimates tends to follow the noise in the raw dynamic PET data (Supplementary material—Figures 2 and 3). This effect is more remarkable in SUV maps compared with those obtained from the Logan as the latter methodology exploits the entire kinetic of measured TACs to provide a DVR value.
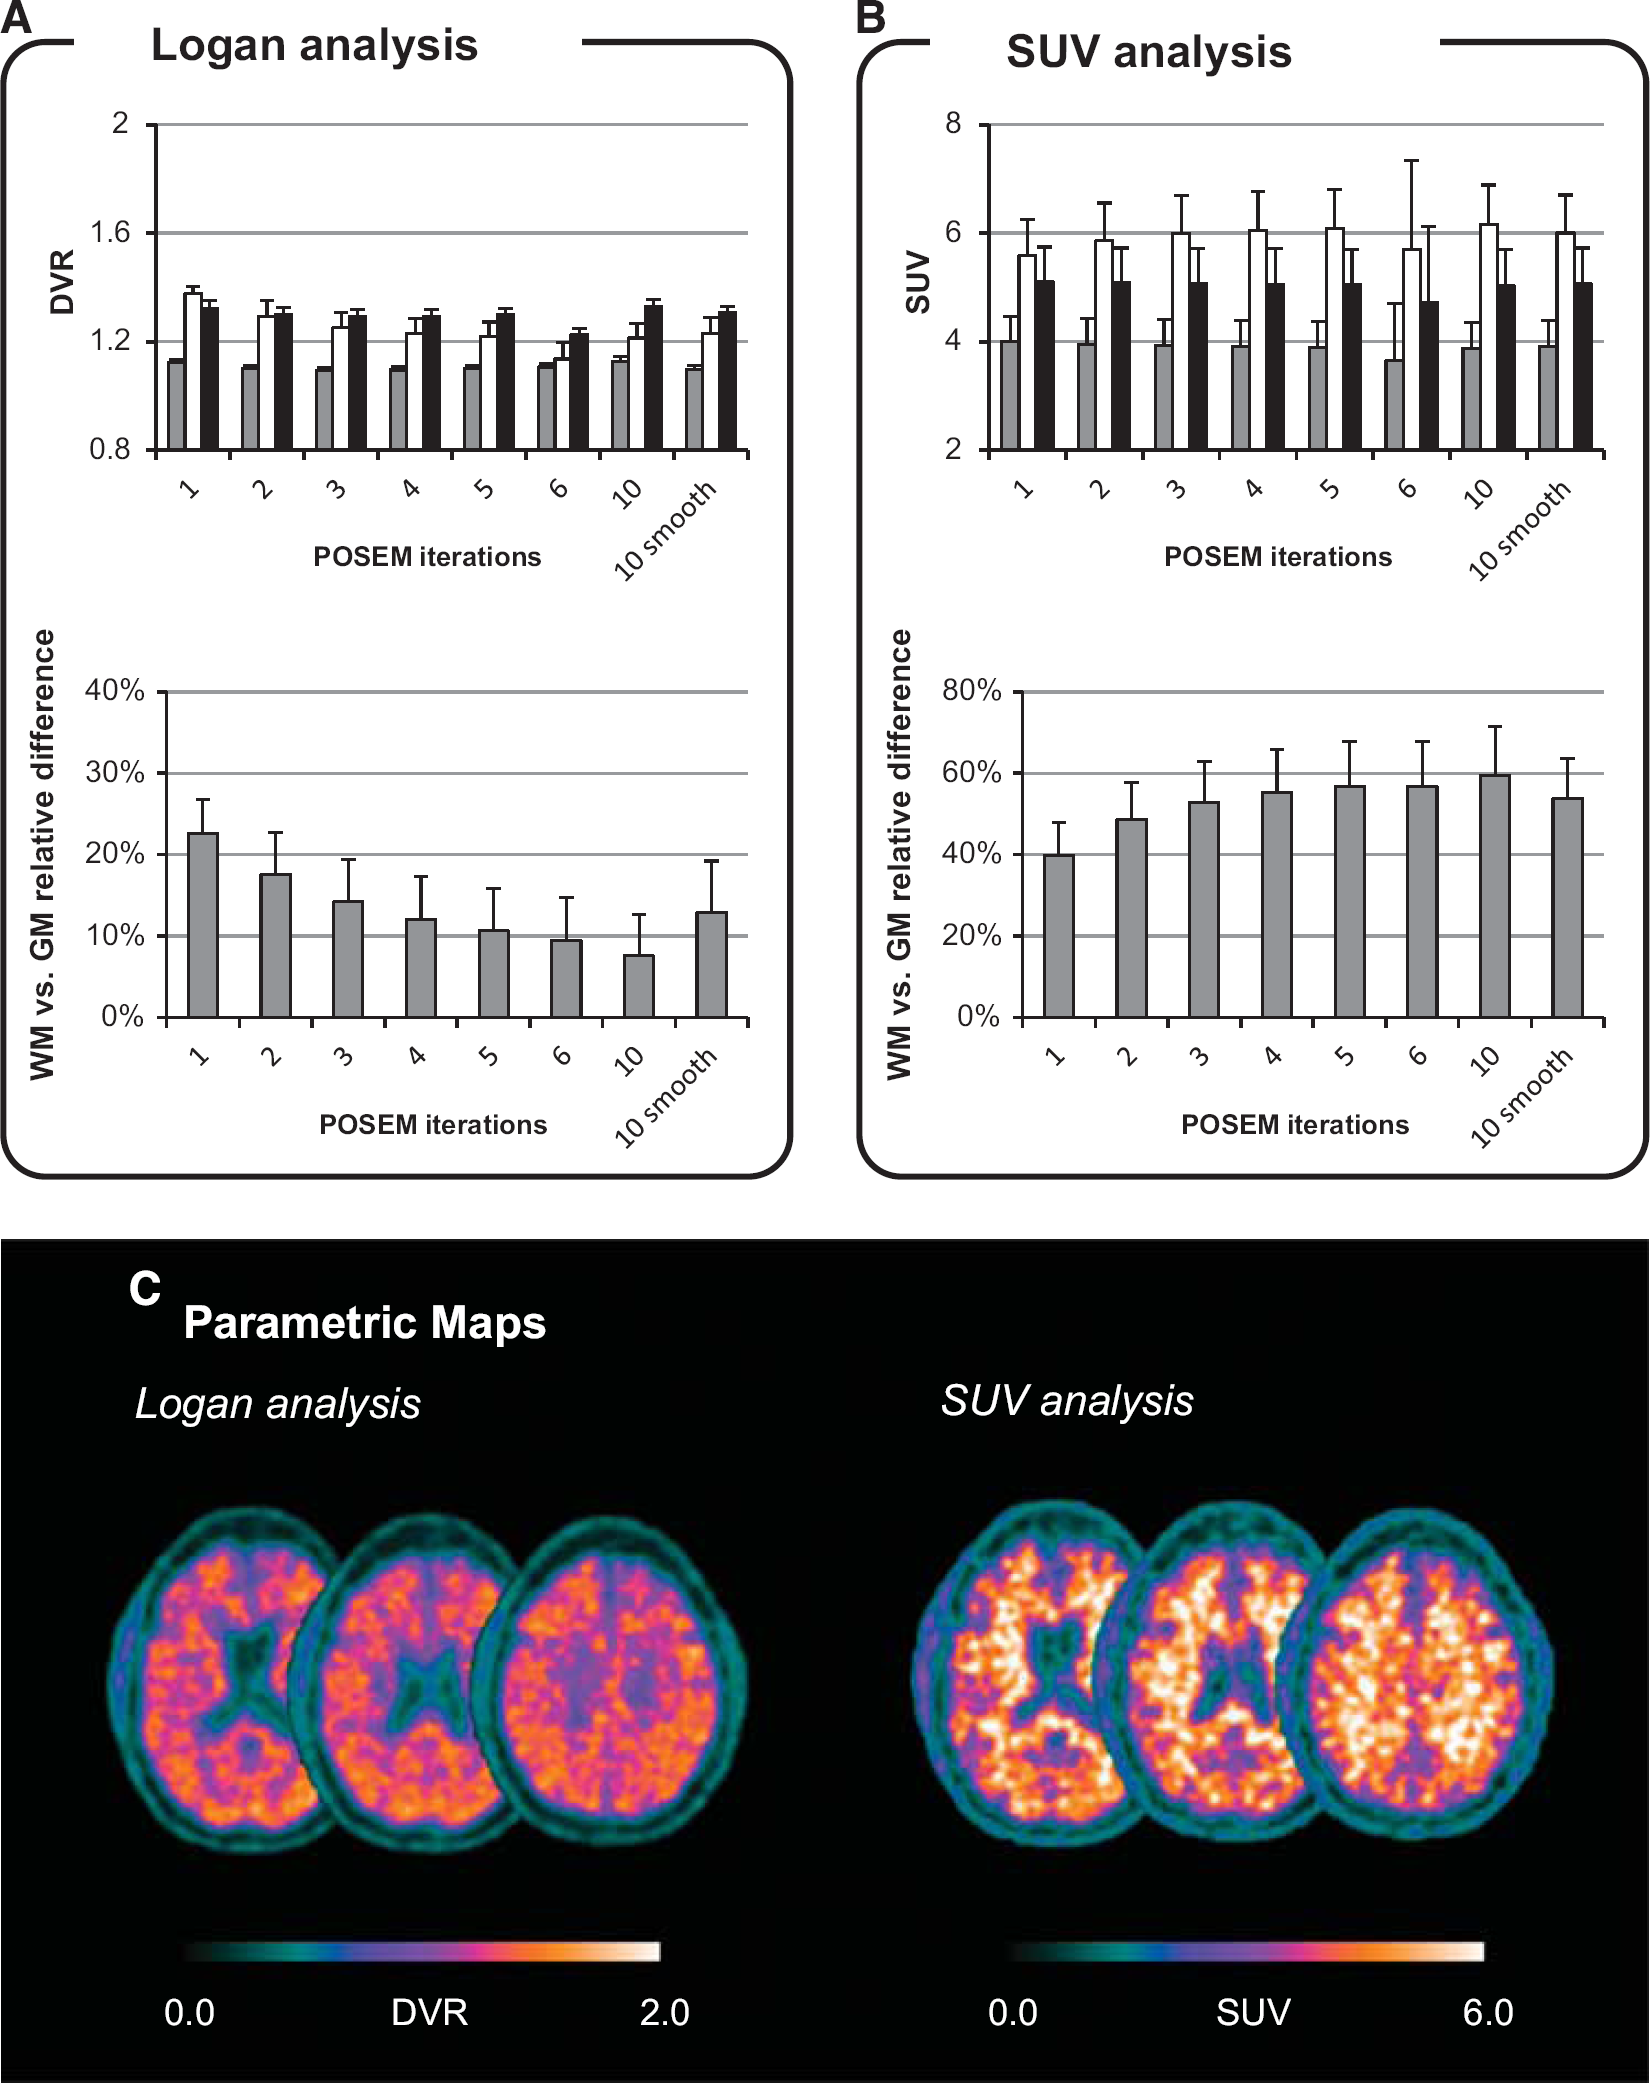
Quantification results. (
Analysis of failures and outliers showed that both Logan and SUV were characterized by a negligible rate of not reliable voxel estimates (< 0.1% in all the subjects and with all the reconstruction settings). In Logan, this fraction corresponded entirely to not precise DVR estimates, whose coefficients of variation calculated a posteriori were higher than 100%. In the SUV analysis instead, the discarded voxels were those in which the calculated values were negative. Interesting, the application of rank-shaping spectral analysis and simplified reference tissue model (solved with basis function approach) methods for [11C]PIB PET image quantification returned a high number of voxel outliers (up to 80% with POSEM 10 iterations), suggesting the inapplicability of these two methods for the particular data set (Supplementary Material—Figure 4). The result was quite expected as the image noise for some of the reconstruction settings was remarkably higher that what is commonly reported by standard dynamic [11C]PIB PET acquisitions. In light of these results, Logan graphical approach was selected as the method of choice for DVR quantification, due to its superior robustness to measurement noise.
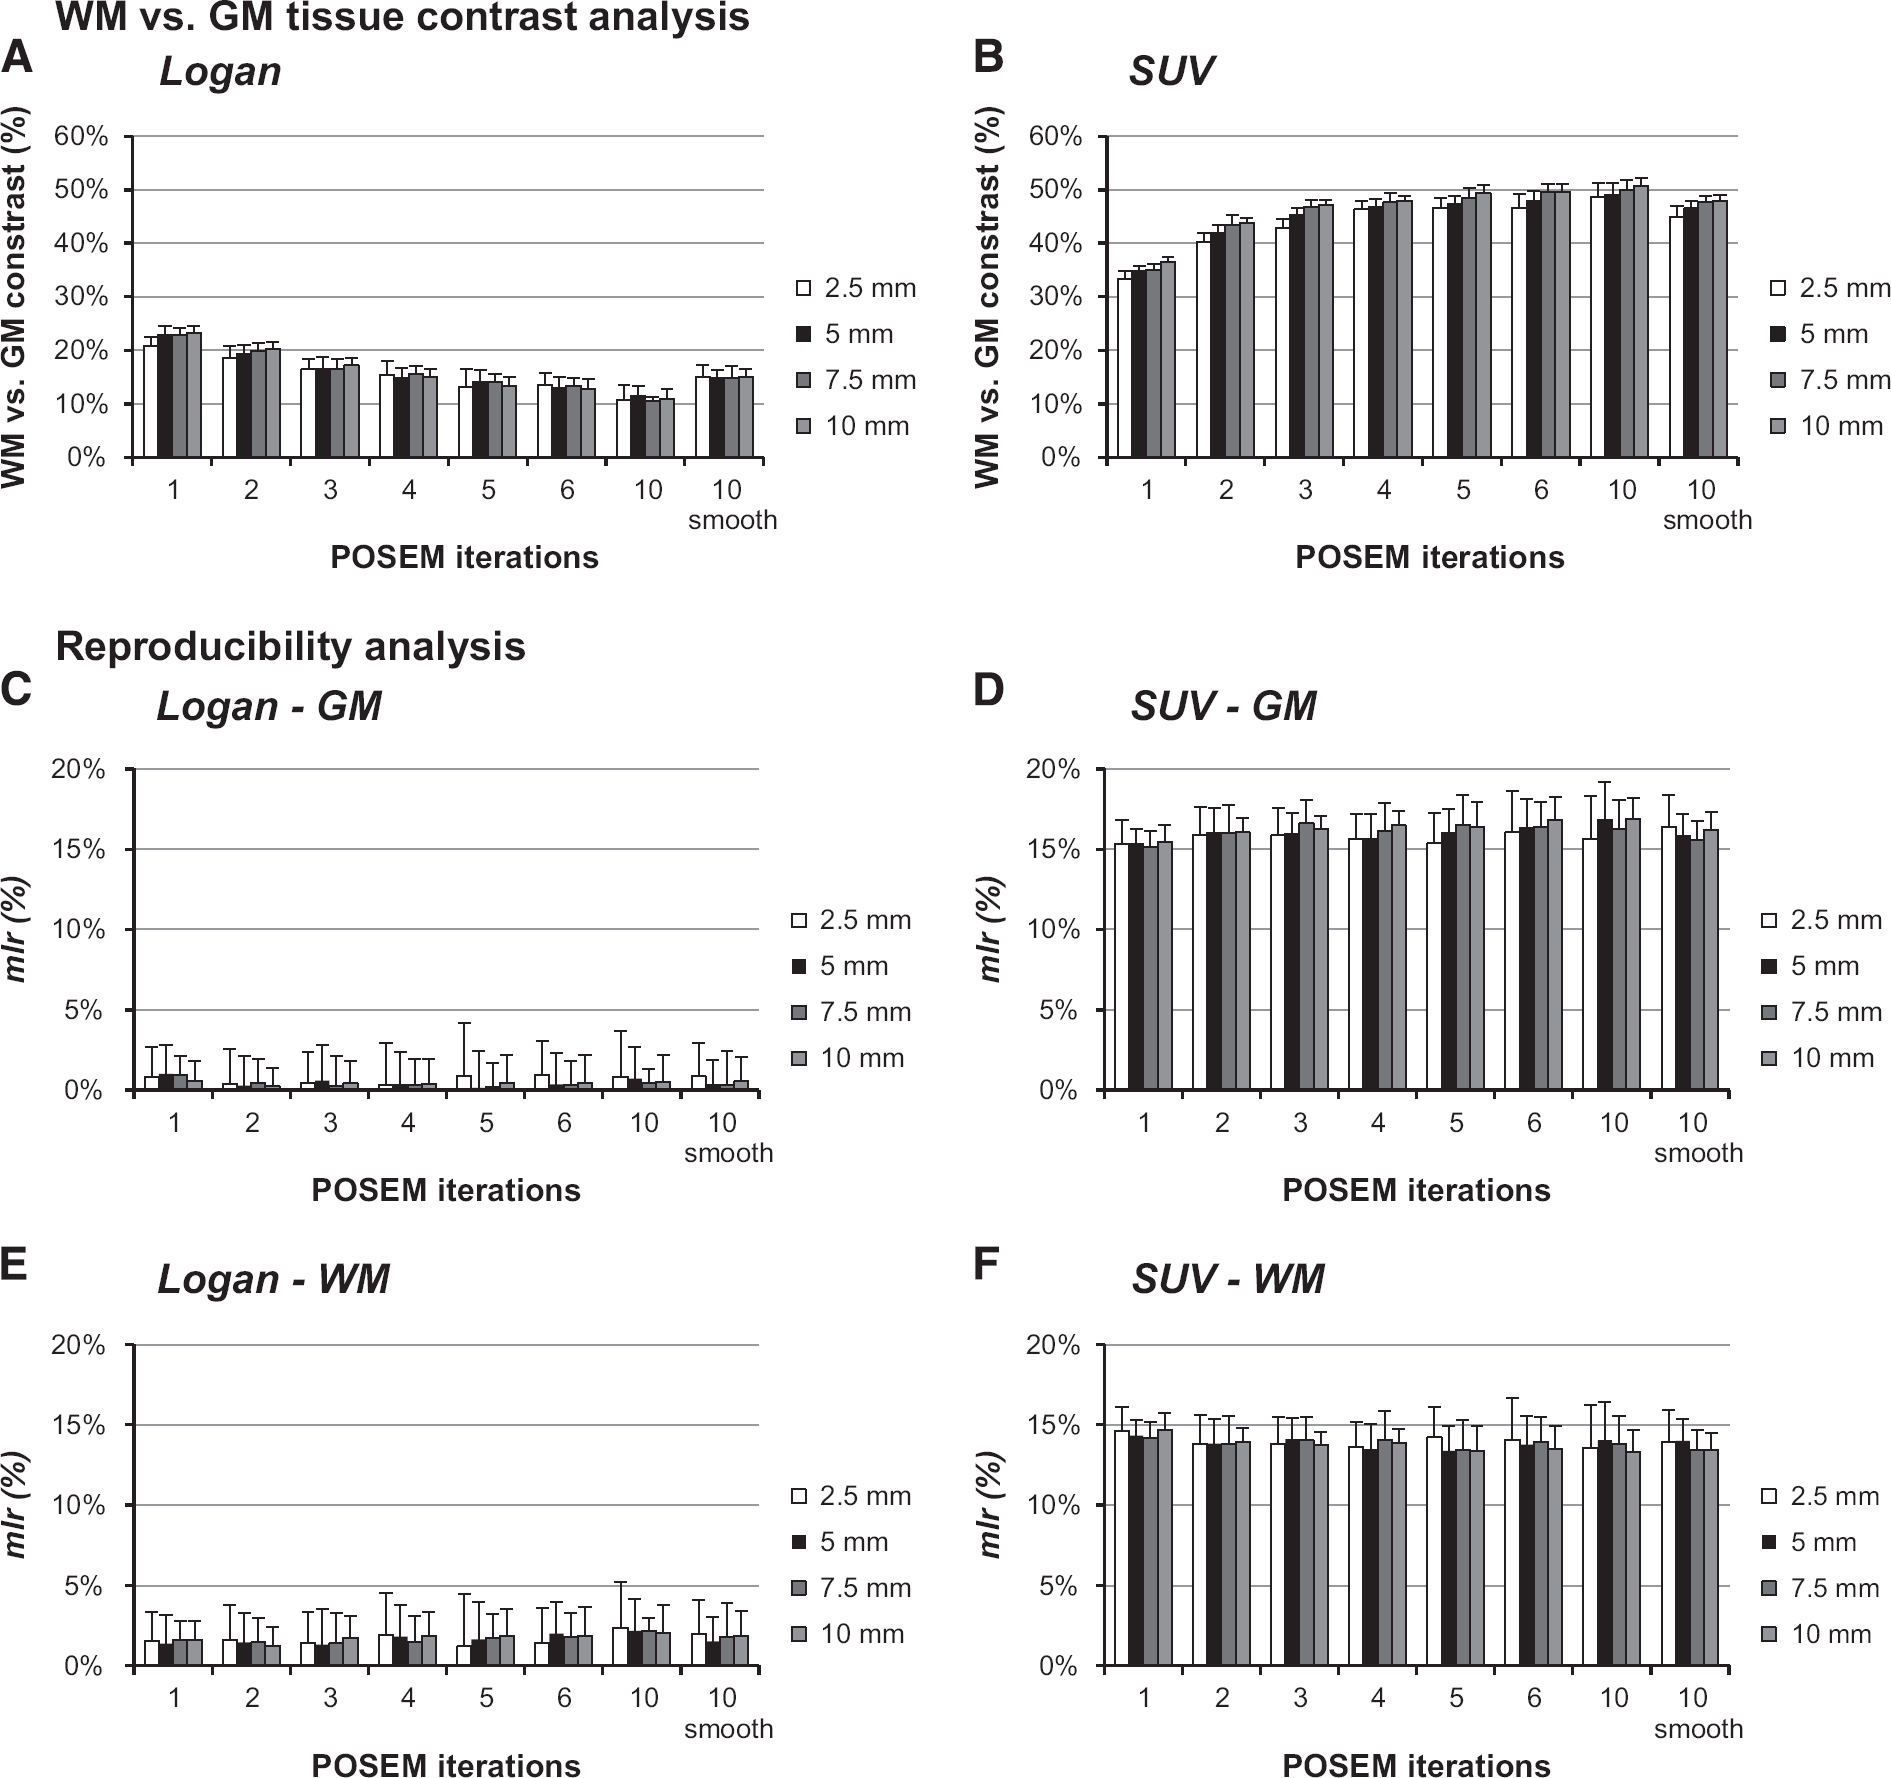
Local analysis: contrast and reproducibility. The mean and s.d. of white matter (WM)/gray matter (GM) contrast values for Logan distribution volume ratio (DVR) and standardized uptake value (SUV) analysis are reported as function of the positron emission tomography (PET) reconstruction setting and simulated region dimensions (
Despite the methodological differences, both Logan and SUV approaches provide a consistent description of PIB uptake across the different subjects (Figures 3A and 3B,). In Logan analysis, DVR ranged from 1.10 to 1.13 in GM, from 1.22 to 1.33 in BG, and from 1.14 to 1.37 in WM. Standardized uptake value, instead, ranged from 3.65 to 4.00 (g/mL) in GM, from 4.73 to 5.11 (g/mL) in BG, and from 5.59 to 6.15 (g/mL) in WM. Between-subject variability of Logan DVR estimates was ≤ 6% for all the ROIs and all the reconstruction settings while for SUV it was consistently around 12%. A summary of the results is reported in Supplementary Table 1 in the Supplementary Material.
Comparing [11C]PIB binding in the GM and in the WM, we found a variable contrast depending on the quantification method and reconstruction setting. In Logan analysis, mean voxel DVR differences ranged from 23 ± 4% (POSEM 1 iteration) to 8 ± 5% (POSEM 10 iterations); with SUV, WM–GM relative differences ranged from 40 ± 8% (POSEM 1 iteration) to 59 ± 12% (POSEM 10 iterations). As for the absolute quantification, the WM–GM contrast showed higher variability in SUV maps compared with the Logan ones. It is noteworthy that, while for Logan analysis the relative differences between WM and GM DVR tended to decrease with increasing number of POSEM iterations, for SUV an opposite effect was observed, with the tissue contrast increasing at higher image resolutions. In both instances, the tracer binding measured in GM was significantly lower than that measured in WM (
The Logan approach with k2 correction produced comparable estimates with the standard Logan approach with the reference region: the means of voxel estimates within ROIs were almost identical (DVRLogan-k2 = 0.98·DVRLogan+0.01,
Out of the 10 subjects analyzed, only 2 subjects presented a pattern that was remarkably different from the others (Supplementary material—Figure 5). In particular, both DVR and SUV measured in WM were lower to those measured in the rest of dataset (−12 ± 4% and −39 ± 5% for DVR and SUV, respectively) but comparable to the tracer uptake measured in GM (4 ± 2% DVR and −7 ± 5% SUV relative difference, respectively). Notably, these results were consistent for both test and retest scans. The experimental protocol for these two subjects was the same as the one conducted in the rest of the group and [11C]PIB injected dose and tracer-specific activity were in the overall range. These subjects were considered outliers and therefore excluded from the statistical analysis. It is important to note that none of the 20 scans analyzed presented a [11C]PIB uptake consistent with the presence of amyloid plaques in the brain.
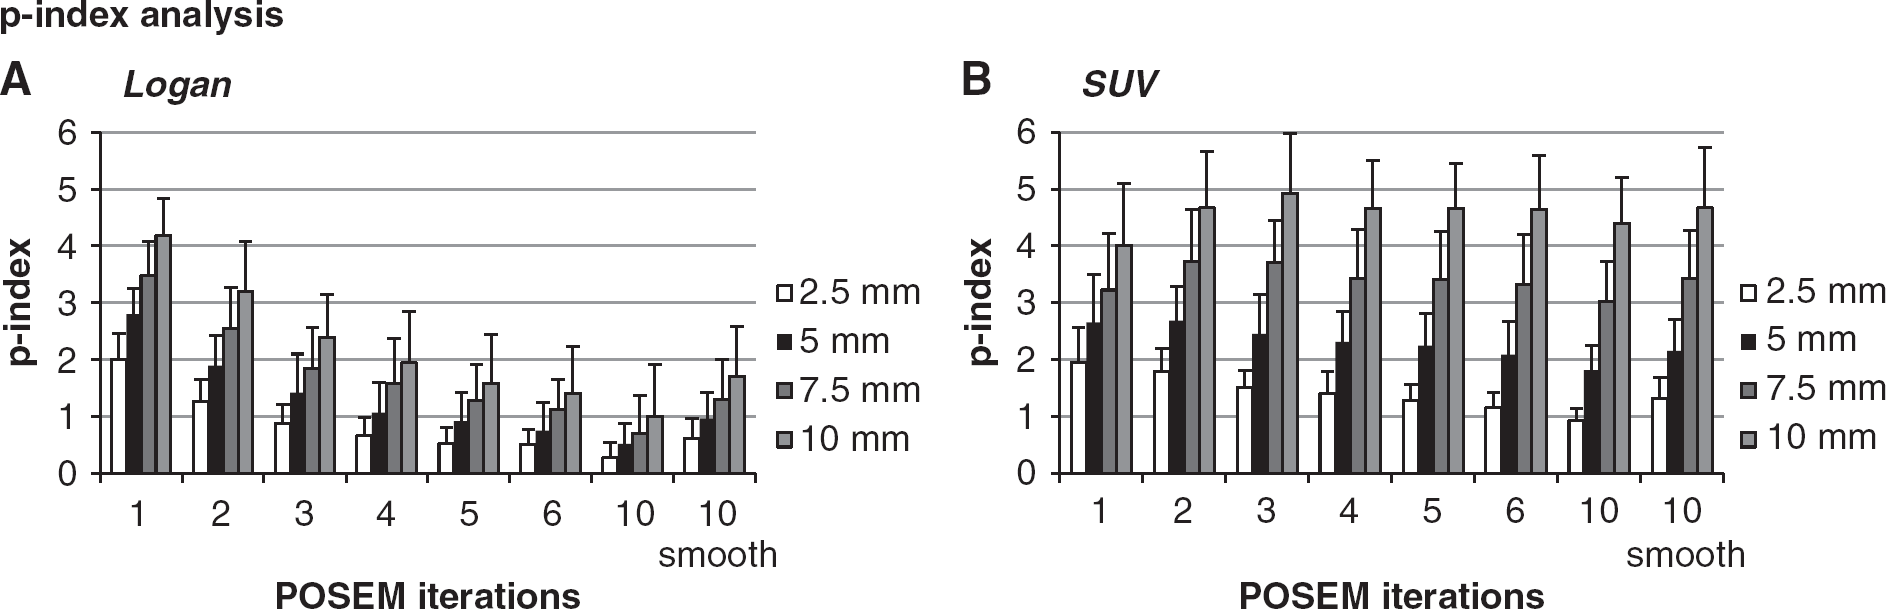
Local analysis: performance index. The mean and s.d. of the p-index values for Logan and standardized uptake value (SUV) analysis are reported as function of the positron emission tomography (PET) reconstruction setting and simulated region dimensions. Results refer to white-matter normalization for Logan (
Reproducibility
In term of reproducibility, Logan outperformed SUV independently of the reconstruction setting used. For DVR estimates, ICC was always > 0.90 while test/retest absolute mean of relative differences was equal to 2 ± 1%. For SUV results instead, ICC ranged from 0.65 up to 0.76, depending on the number of POSEM iterations, with a test/retest mean relative difference of 14 ± 10%. For both methods, both WM and GM showed comparable test/retest repeatability to those found a whole brain scale. For Logan analysis test–retest, mean DVR differences were 1 ± 1% in GM and 2 ± 2% in WM, while for SUV 14 ± 11% in GM and 12 ± 9% in WM.
Regional Analysis
Local contrast analysis confirmed the results obtained at whole brain level: (1) SUV reported the highest contrast (mlc% from 41 ±32% for 2.5 mm region diameter up to 44 ± 17% for 10 mm region diameter) compared with Logan (mlc% from 13 ±24% for 2.5 mm region diameter up to 13 ± 15% for 10 mm region diameter); (2) higher number of reconstruction iterations impacted in opposite ways the mlc% of the two methods, ameliorating SUV performance but penalizing the Logan. A summary of these results is reported in Figures 4A and 4B. Notably, for both methods, across all subjects, all region dimensions, and all reconstruction settings, no significant difference in mlc% was found between test and retest data. The major impact of increasing the region size (from 2.5 to 10 mm diameter) was on reducing the mlc% variability: from 27% to 15% with DVR and from 41% to 16% with SUV.
Regional test/retest reproducibility maintained the patterns found for the whole brain analysis: with Logan, mlr% was 3 ± 12% for GM and 4 ± 13% for WM; with SUV, mlr% was 15 ± 18% for GM and 13 ± 15% for WM. For both methods, these results referred to the mean ± s.d. across region dimensions and reconstruction settings, while a more exhaustive description of local reproducibility analysis is reported in Figures 4C–4F.
Figure 5 shows the p-index results as a function of POSEM iterations and simulated region dimensions: while the first represents an important variable for Logan performance (for SUV p-indexes remain stable), the second significantly modulates the contrast power in both quantification methods. Consistently with the rest of results, p-index highlights the better WM/GM contrast power of SUV with respect to Logan.
Analysis of Partial Volume Effect
Analysis of mean DVR values in GM and WM as function of the CSF distance shows the presence of a strong partial volume effect reducing the value of the DVR in the voxels within 2 to 3 mm from the CSF (Figure 6A). Notably, this distance is consistent with the scanner resolution. With regard to the mean DVR values reported within 6 to 8 mm from CSF, the underestimation for these voxel is −38 ± 30% for WM and −20 ± 9% for GM. Moving away from CSF (distance > 10 mm), DVR estimates in GM remain stable while the WM DVR significantly increases (+20% mean relative difference respect to 6 to 8 mm WM DVR correspondent to 1.54 ± 0.05 DVR absolute value). These particular highly myelinated brain regions appear to be spatially localized within the spinal-cortical brain tracts (Figure 6B).
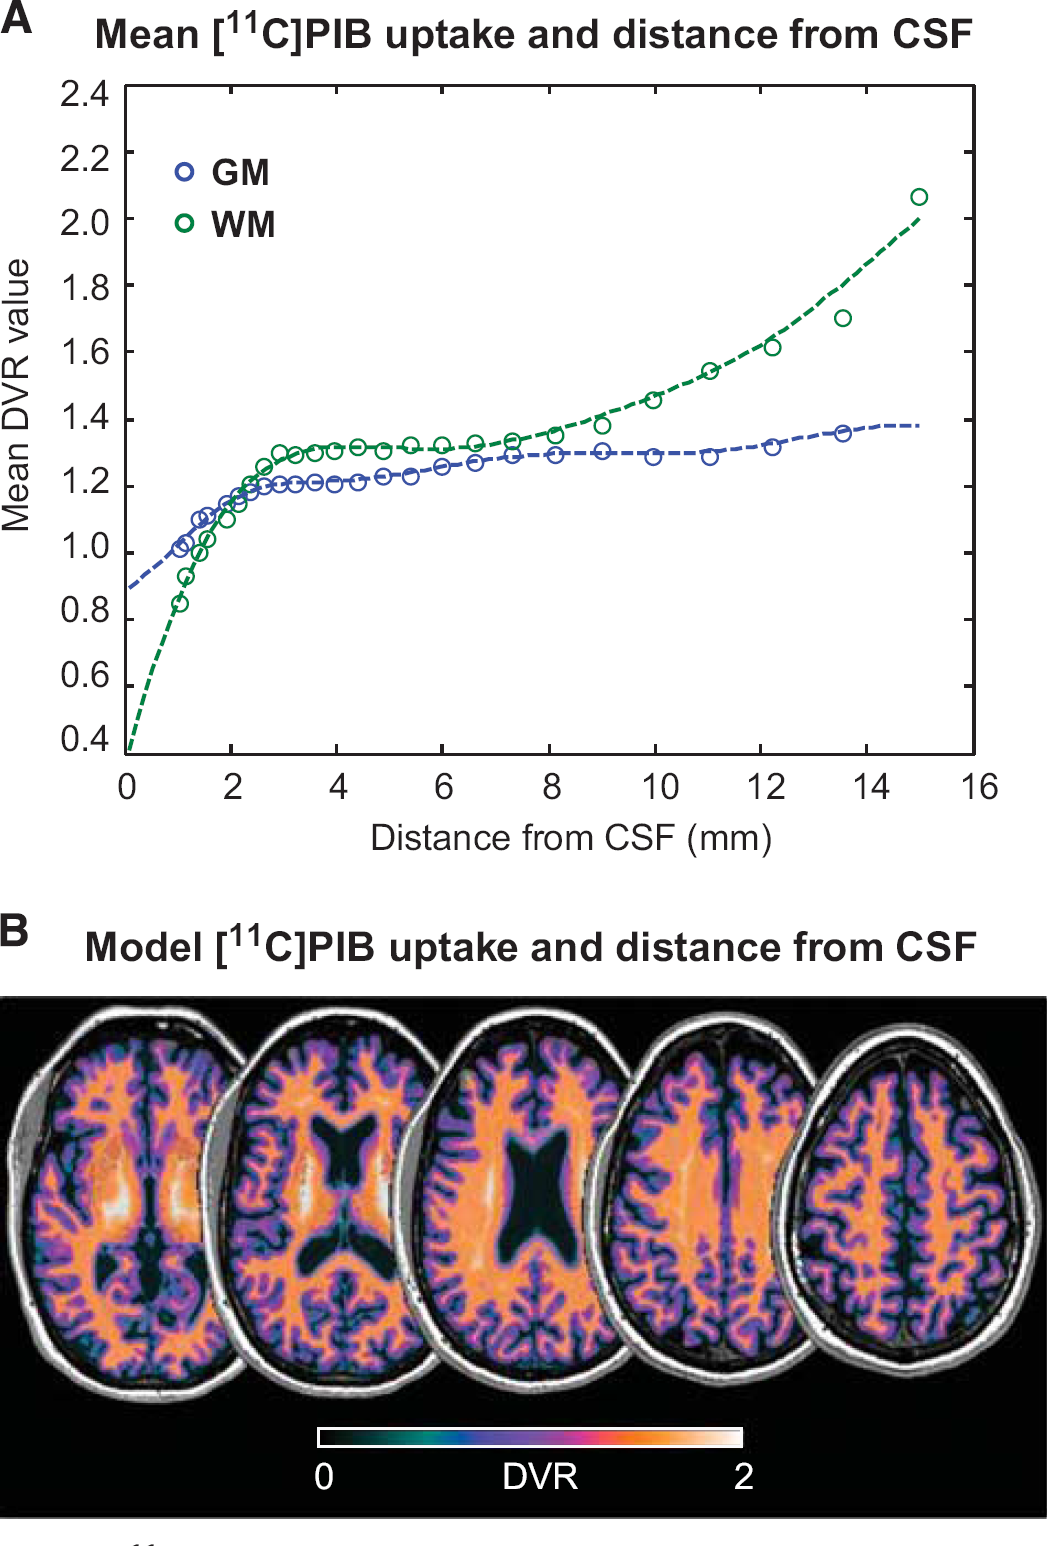
[11C]PIB uptake and partial volume effect. (
[11C]PIB Positron Emission Tomography Binding: Correlation with Myelin-Associated Protein Gene Expressions
Analysis of mRNA myelin-associated protein expression shows cross-subject consistency for most of the probes analyzed, with Pearson's correlation
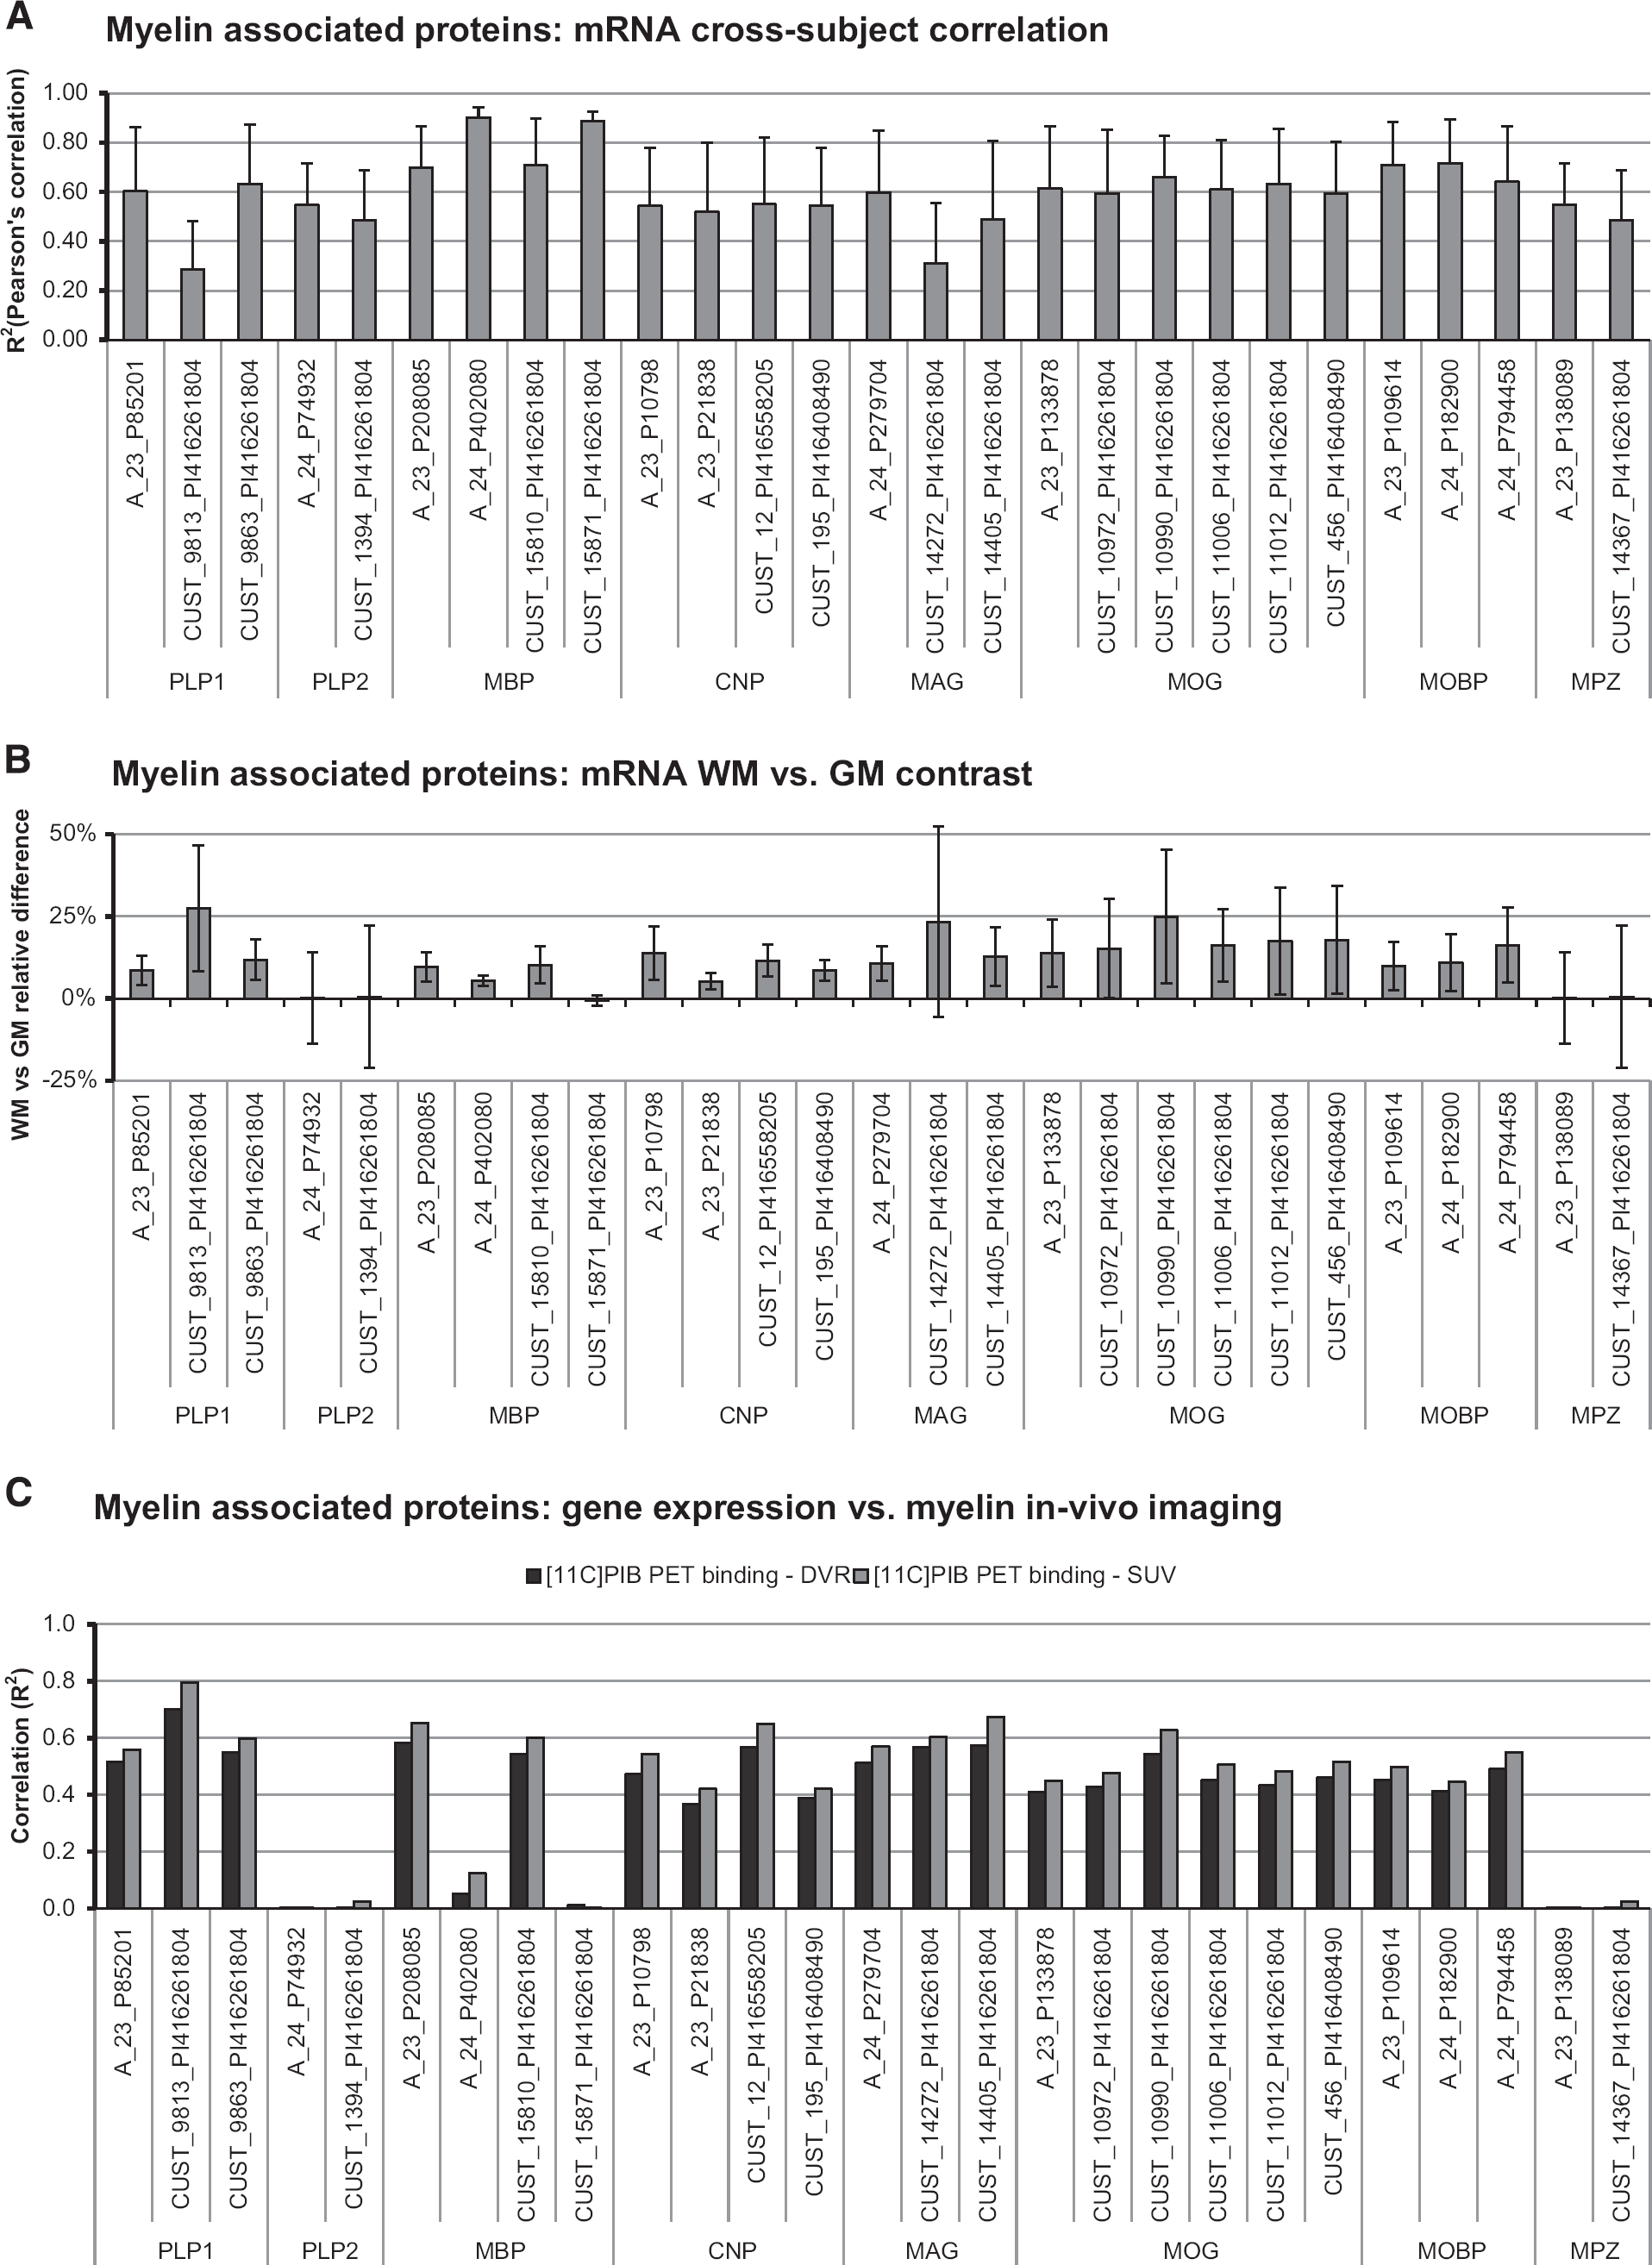
Comparison between [11C]PIB imaging and myelin-associated protein gene expressions. (
The mRNA expressions and spatial distributions of these probes were highly cross-correlated (
Analysis of mRNA expression differences between WM and GM shows, which probes better reflect myelin density contrast between these two tissues (Figure 7B). The WM and GM mRNA samples were localized by using two anatomic masks for WM and GM in MNI space (90% of probability threshold). The WM versus GM mRNA expression contrast ranged from −1% to 27% (mean ± s.d.: 11 ± 7%). Among the myelin-associated proteins, those with the lowest WM–GM differences were PLP2 and MPZ, while the highest was reported for MOG (18 ± 3%), MAG (16 ± 6%), and MOBP (12 ± 3%). These results reflect the
This classification was maintained when myelin-associated protein expressions were compared with
As a negative control study, we investigated the correlation between [11C]PIB bindings maps and the mRNA expressions of some well-known nonmyelin-associated proteins. For the purpose, we considered two monoaminergic receptor systems (dopamine D1, D2, and D3 receptors and serotonin 5HT1A, 5HT1B, 5HT1D, 5HT1E, and 5HT1F receptors), two astrocyte markers (Aq4L and Aldh1L1) and one oligodendrocyte precursor protein (PDGF receptor alpha, PDGFRA). 43 The first two groups were chosen because of their different spatial distributions: while dopamine receptors are mainly concentrated in the striatum, the serotonin ones present a more diffuse distribution across brain tissues. Aq4L, Aldh1L1, and PDGFRA were tested because they are known to be expressed also in the WM, although they are not directly linked to myelin. 43
Results confirmed the independency of the systems: notwithstanding the high probe autocorrelations that testified to the quality of mRNA, cross-correlations between [11C]PIB-DVR estimates and all the pre-selected genes were very low (
DISCUSSION
In the current work, we presented a methodological analysis of the quantification of [11C]PIB PET data as a myelin imaging tool. The combination of a supervised clustering approach with the Logan graphical method is proposed as a noninvasive solution for the voxelwise quantification of such data. The performance of the method was assessed in comparison with the use of SUV, a semiquantitative static index whose use is standard in clinical PET routine.
Both SUV and Logan methods showed to be reliable, with the SUV providing a superior contrast between WM and GM tracer uptake, at both global and regional levels, but at the same time presenting a higher sensitivity to the measurement noise. In terms of reproducibility, Logan overperformed SUV presenting a significantly lower test–retest variability. Notably, the two methods were not perfectly correlated. This is justified by the different specificity offered by these measures: while SUV reflects the overall radioactivity within a given volume of interest that integrates both tracer perfusion and binding, the DVR estimate computed by the Logan analysis directly returns the measure of [11C]PIB binding to the target. Dynamic PET imaging and full quantification should be preferred when applicable.
The mismatch between DVR and SUV is already known in PIB data analysis for the characterization of amyloid density 44 and may also justify the inconsistent distribution of binding across different WM regions discovered for [11C]PIB in preclinical data when assessed with SUV. 27 To overcome the problem, SUV normalized by reference region has been proposed as a more accurate quantification method for [11C]PIB static imaging. 28 This was not applicable in our case since the reference region is extracted through tissue kinetic clustering thus requiring dynamic imaging.
Of particular interest is the relationship between SUV and Logan performance and the PET reconstruction settings. A larger number of iterations was shown to improve PET spatial resolution, but led to an expected increase in the image noise. Interestingly, this impacted on SUV and Logan methods with opposite effects. In the case of the SUV, the higher the number of iterations, the better the WM/GM contrast, while for the Logan it was the opposite for the analysis at both global and local levels. The effects of the noise introduced in the reconstructed PET data by the POSEM setting mainly impacted by increasing the DVR voxel estimate variability as the number of iterations increased, with the final results of making the discrimination between different levels of tracer uptake more challenging. In agreement with this, we found that Logan returns the best parametric maps in terms of both quality of voxel estimates and power of differentiate between tracer uptake when the dynamic PET data are reconstructed with the best possible SNR. On the other hand, this configuration led to very smooth and blurred images, making the choice of using a high-resolution scanner like HRRT completely redundant. Among the tested reconstruction settings, we believe that the best compromise between image resolution, image noise, and estimate consistency was the use of 10 iterations with PSF smoothing. It is also worth to underline that HRRT does not represent the standard for PET acquisition but a high-resolution resource to which few centers have access. We are currently running additional studies with [11C]PIB analogs to establish the feasibility of the method with more conventional PET/CT tomographs.
The local analysis, i.e., the investigation of method performance in small size regions, showed that [11C]PIB PET imaging has the potential to be applied for investigations of small lesions down to the pixel level. Nevertheless, the capacity to describe tissue alterations depends not only on the lesion size, but also on its brain localization as well as on the magnitude of signal variations. The first issue is related to the partial volume effect and the impact that CSF has on the quantification of [11C]PIB binding in the adjacent regions. Any cross-sectional comparison between healthy and pathological tissues should not be performed without taking this aspect into account. The second issue is related to the amount of [11C]PIB binding reduction occurring in demyelinated tissues. This cannot be established with a data set of healthy controls, and further studies in pathological conditions are needed to fully characterize the power of the method at the lesion level.
Supervised clustering confirmed to be a robust approach for reference region extraction. Although the different levels of noise introduced by modifying the POSEM settings had an impact on the number of voxel-TACs associated with the reference region (from 15% of brain analyzed voxels with POSEM 1-iteration, to 8% of brain analyzed voxels with POSEM 10-iterations), in all the tested scenarios the extracted reference input functions were consistent with the expected profile. This finding is encouraging for the extension of the method to pathological conditions. Importantly, this procedure also allows an optimal investigation of the cerebellar region which cannot be performed when cerebellum is used as a reference in standard practice. Note that the use of GM as a reference region limits the method applicability to WM only, since the amount of myelin in normal GM represents the lowest boundary of detection of the method. Only quantification methods with arterial input functions can overcome this limitation and be applied to investigate GM myelin density. It is important to remark that the myelin content of GM (although in much smaller amount compared with WM) does not impede its use as a reference: a reference region can contain some specific binding, but this has to remain stable across clinical conditions. 45 The use of supervised clustering rather than the anatomic segmentation warrants this assumption and the consistent selection of reference tissue with pre-defined kinetic properties across studies and subjects.
The comparison of [11C]PIB PET binding maps with myelin-associated gene expressions highlights a strong association with the most representative myelin brain proteins and the absence of any significant correlation with myelin-independent proteins, including proteins expressed by astrocytes and oligodendrocyte precursors. Despite the limits of these comparisons (e.g., two different groups of subjects, PET referring to
One possible criticism to the method here presented concerns the role that [11C]PIB tracer metabolites might have in [11C]PIB tissue binding. Several lines of evidence convincingly exclude any such contribution: (1) [11C]PIB plasma tracer metabolites are very polar and therefore very unlikely to pass through the blood–brain barrier; 18 (2) the kinetic modelling of [11C]PIB tissue tracer uptake with an arterial input function does not require any additional metabolite input in both healthy and pathological conditions;18,19 (3) the quantification of [11C]PIB uptake with a reference input function is consistent with that returned by metabolite-corrected arterial input function in both healthy and pathological conditions, which attests the good reliability of noninvasive estimation methods even when beta amyloid in absent.19,29 This last aspect was confirmed by a pilot study (Supplementary Material—Figure 7), performed to verify the reliability and robustness of the implemented PET experimental procedure.
The use of Logan graphical analysis might also appear as another limit of the study. Although we could not fully evaluate the use of more conventional [11C]PIB quantification methods (e.g., RPM or RPM2), it is worth to mention that in the presence of low [11C]PIB uptake, as it is the distribution of the tracer in healthy volunteers when beta-amyloid is absent, Logan represents a reliable and almost unbiased method for [11C]PIB parametric imaging. 47
CONCLUSIONS
In this work, we showed that [11C]PIB PET binding to WM is reliable and reproducible. Results are dependent on the use of a proper data quantification approach, but [11C]PIB parametric maps can be obtained noninvasively via supervised clustering and Logan graphical analysis. The method is generally applicable as long as beta amyloid plaques are absent within the investigated tissues and the analysis limited to the WM.
We also showed that there is a close relation between the major proteins associated with myelin sheath and [11C]PIB imaging. Future work will elucidate [11C]PIB sensitivity and specificity to myelin dynamics in WM disorders.
Footnotes
Dr Stankoff reports receiving consulting and lecture fees from Biogen Idec, Novartis, Merck Serono, Sanofi-Aventis, Teva-Pharma and research support from Genzyme and Merck-Serono. The other authors state no conflict of interest.
ACKNOWLEDGMENTS
The authors thank Adrien Clavairoly for the useful discussion on mRNA myelin-associated markers; Carlos Parras, from the ICM, Paris, for helpful suggestions; and the Assistance Publique des Hopitaux de Paris (APHP) for sponsoring the research.
References
Supplementary Material
Please find the following supplemental material available below.
For Open Access articles published under a Creative Commons License, all supplemental material carries the same license as the article it is associated with.
For non-Open Access articles published, all supplemental material carries a non-exclusive license, and permission requests for re-use of supplemental material or any part of supplemental material shall be sent directly to the copyright owner as specified in the copyright notice associated with the article.