
Abstract
Summation analysis strategies are recognized throughout diverse scientific fields as powerful means of differentially enhancing experimental signals over random fluctuations (noise). Such techniques, applied to emission tomographic cerebral blood flow scans, reveal subtle alterations in neuronal activity during specific behavioral states. In the present work, we extend the principles of intersubject image summation analysis to the evaluation of emission tomographic ligand-binding studies. A general methodology is presented that may be applied to a wide variety of binding site determinations. The procedure consists of anatomic standardization of individual brains to a common stereotaxic orientation, followed by statistical analyses of group versus group or individual versus group differences. We develop and evaluate performance of our technique with the use of positron emission tomographic [11C]flumazenil scans from normal volunteers, depicting the regional cerebral distribution of benzodiazepine binding sites.
The advantages of data summation in experimental analyses are well-described in a variety of settings. In biomedical clinical and research studies, the results of signal summation are most evident in the recording and analysis of stimulus-evoked electrical potentials (Barrett, 1986; Lopes da Silva, 1987) including visual-, auditory-, and somatosensory-evoked responses and other delayed cortical responses (Gevins and Cutillo, 1986; Beydoun et al., 1993). Distinction of these neuronal signals from unrelated aspects of the electroencephalogram is accomplished by averaging hundreds of identical trials, employing the stimulus onset to temporally align the individual recordings for summation.
Similar improvement in distinction of relatively weak signals over biologic and statistical noise is achieved in trial summation and group difference analyses of CBF pattern changes during physiologic stimulation (Fox and Raichle, 1984; Fox et al., 1985; Fox et al., 1988). In these instances, individual CBF scans are aligned both temporally (according to task or state) and spatially, resulting in three-dimensional anatomic depiction of CBF response patterns to a variety of stimuli or behavioral states. An additional advantage of these data transformations is their facilitation of omnibus statistical screening for regions of significant change (Fox et al., 1988; Friston et al., 1991; Worsley et al., 1992). These statistical procedures generally account for the large numbers of parallel observations (anatomic locations) inherent in image data, minimizing the frequency of type I errors.
In the present work, we have extended application of anatomic, intersubject summation analyses to the quantification of cerebral benzodiazepine binding sites. The methodology employed is computationally parallel to prior studies of CBF activation; however, the dynamic range of receptor distributions span several orders of magnitude, as opposed to CBF, which typically varies by at most twofold. Thus, receptor image summation analyses require independent methodologic evaluation, as performed in the present studies. The advent of stereotaxic, volumetric analyses of ligand binding data will permit screening of large in vivo binding data sets, either by individual or grouped analyses, and will facilitate detection of subtle or previously unsuspected alterations. The methodology employed is easily generalized to a wide variety of emission tomographic ligand binding brain scans.
METHODS
Human subjects
Normal subjects were recruited for participation in positron emission tomography (PET) imaging session by local advertisement. Single benzodiazepine binding scans were performed in 14 young normal individuals (8 men, 6 women, ages 19–30 years). Subjects had no history of neurologic or psychiatric disorder, no family history of heredible neurologic or psychiatric disorder in first-order relatives, were nonsmokers, consumed <300 mg of caffeine per day, and denied alcohol dependence or recreational drug use. They had normal screening medical and neurologic examinations and had not received prescription or over-the-counter medications with CNS effects for at least 1 month before participation. All experimental procedures were approved by The University of Michigan institutional review boards governing the study of human subjects and the use of radioisotopes in research involving humans. Informed consent was obtained before the participation of each subject.
Benzodiazepine binding site scans
Regional cerebral benzodiazepine binding sites were quantified as described previously in our laboratory (Frey et al., 1991). Briefly, a dynamic series of brain PET images was obtained during 60 min after the bolus intravenous injection of 20–50 mCi of [11C]flumazenil. Timed, arterial plasma samples were obtained throughout the imaging period and were chromatographically analyzed to distinguish authentic tracer from radiolabeled metabolites. The emission scan series and the plasma [11C]flumazenil time-activity curves were then analyzed according to a two-compartment, two-parameter physiologic model, resulting in pixel-by-pixel maps depicting tracer transport from blood to brain (K1) and the regional tissue tracer distribution volume relative to plasma (DV). The latter parameter has been shown previously to correspond to the sum of specific and nonspecific binding of flumazenil (Koeppe et al., 1991; Frey et al., 1991), and is dominated by benzodiazepine receptor binding in most brain regions (Ishihara et al., 1994). The K1 and DV parametric maps from each subject were employed in subsequent summation analyses.
Stereotaxic orientation of parametric images
To facilitate precise anatomic summation of scans, individual differences in scan orientation and in gross cerebral morphology were first eliminated. The procedures employed for anatomic standardization have been described previously, and were developed and validated for use with CBF and glucose metabolism images. In the present work, these algorithms were applied to the flumazenil transport images, recognizing the similar neuroanatomic characteristics of CBF and K1 image sets.
The anatomic standardization of each flumazenil scan was preceded by a refinement of K1 and DV image coregistration by maximizing the overlap of pixels falling within a specified range in the two images (Minoshima et al., 1993c). This procedure eliminated any effects of subject motion during the original 60-min scan acquisition that were not removed during calculation of the parametric images. Next, the K1 image was processed sequentially by automated routines (Minoshima et al., 1992; Minoshima et al., 1993d) to identify the orientation of the anterior commissure-posterior commissure line (AC-PC line), to linearly scale the brain to the size of a standardized reference atlas, and to accomplish plastic deformation of brain shape (nonlinear warping employing thin-plate spline deformation) to conform to the atlas contours (Minoshima et al., 1994a). The transformation necessary to map the K1 image into atlas configuration (60 AC-PC parallel transaxial slices with 128 × 128 voxel matrices per slice, 2.5 mm3 voxels) was applied in parallel to both the K1 and DV images, resulting in anatomic standardization of both ligand transport and binding maps. The anatomic transformations were conducted in a concentration-conservative manner by three-dimensional (3D) linear interpolation of original scan values to determine parametric values of the standardized K1 and DV voxels. Thus, relationships between image parameters and plasma ligand concentrations are maintained in the transformed images.
Automated regional sampling
Regions of interest (ROIs) corresponding to a variety of brain areas were identified in the transformed images according to stereotaxic coordinates from the reference brain atlas of Talairach and Tournoux (1988). ROIs corresponding to cortical and subcortical structures were positioned according to their definitions in stereotaxic coordinate space.
The DV value of the pons was also determined for its potential use as an index of nonspecific and free ligand DV (Persson et al., 1989), because prior in vitro studies have identified very low levels of pontine benzodiazepine binding sites (Zezula et al., 1988). The pons was identified in the anatomically standardized images by a two-stage procedure (Fig. 1). First, a midsaggital plane demarcating the expected center of the pons was applied to the K1 image (boundary coordinates: 5–40 mm posterior and 24–33 mm inferior to the AC). The center of a small spherical ROI (9-mm radius) was iteratively positioned within the plane to subtend the maximum K1 value. The pontine DV was then determined by mapping the ROI coordinates onto the corresponding DV map. This procedure was employed due to effects of scattered activity from adjacent temporal lobes and cerebellum in the DV images, precluding unbiased definition of the pons by searching for minimum DV.
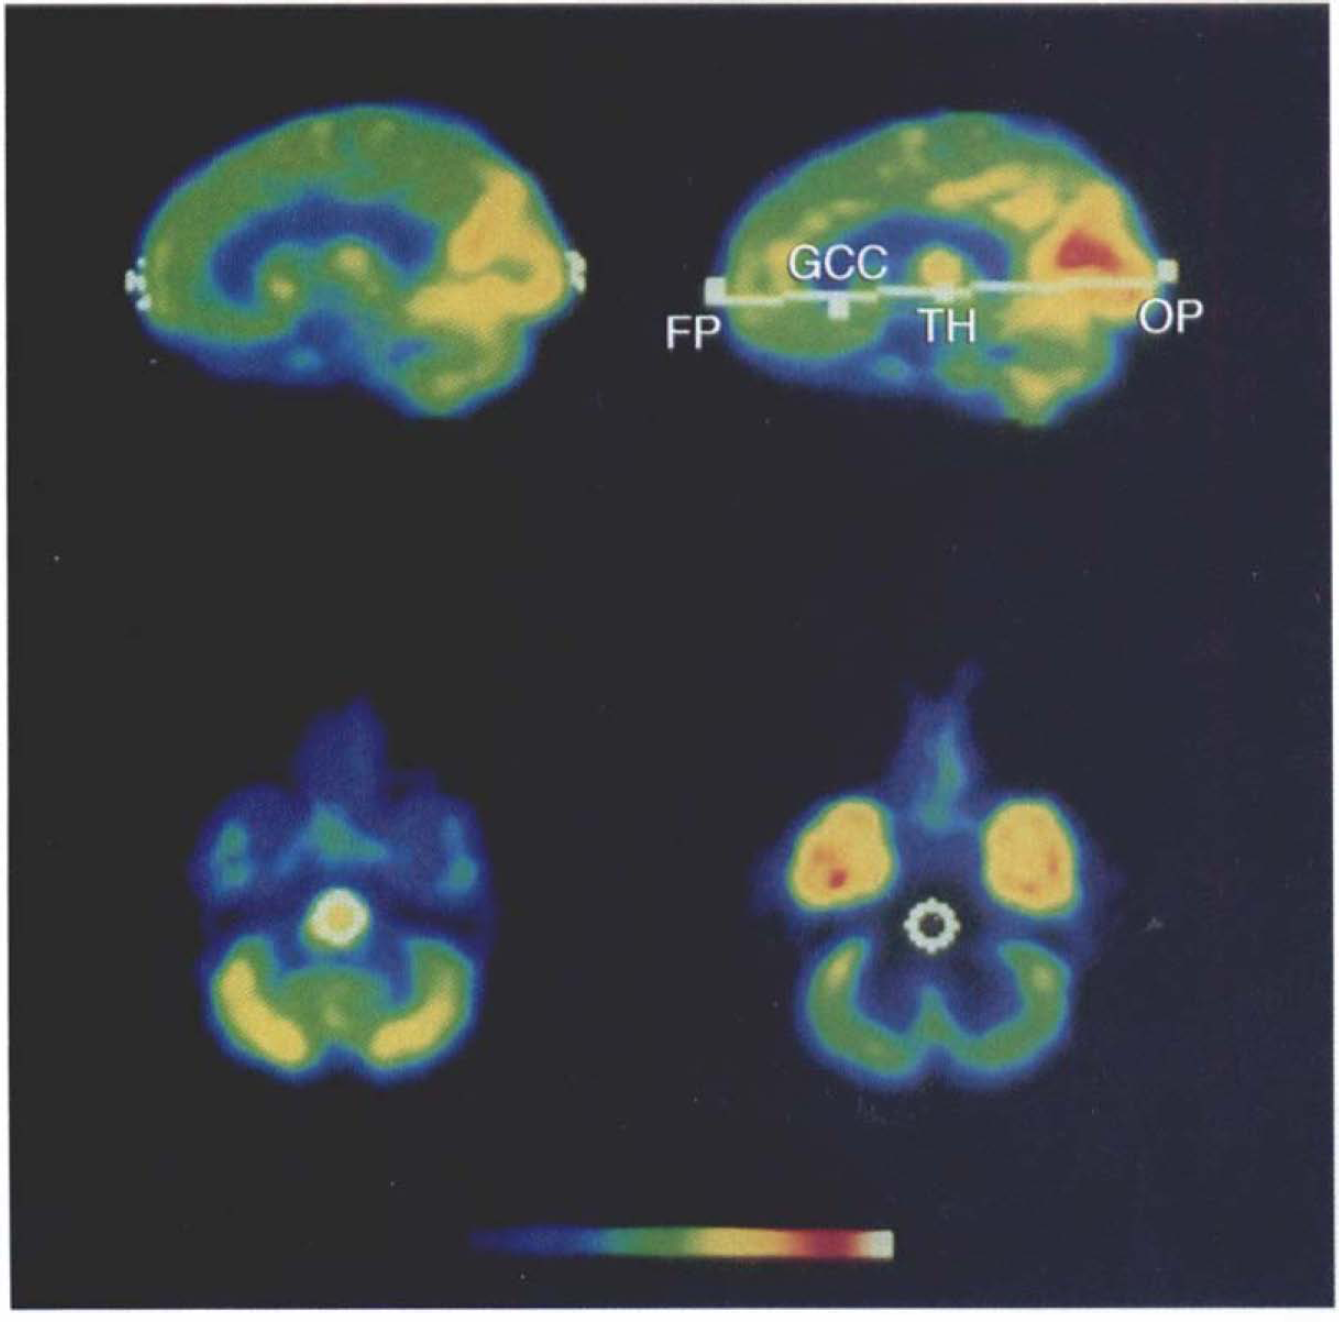
Stereotaxic processing of ligand distribution images. Localization of anterior commissure-posterior commissure (AC-PC) line in flumazenil transport (K1) data, by analogy to its identification in positron emission tomography cerebral glucose metabolism data (Minoshima et al., 1993d), is depicted in the upper two images. The frontal and occipital poles are located in summed 22.5-mm-thick midsaggital data (upper left). Locations of iteratively determined pole points from individual transaxial levels are represented in white. The final locations of the pole points are the median of these coordinates. The orientation of the AC-PC line is further specified by additional landmarks, as determined in 45-mm-thick midsaggital image (upper right). Locations of the genu of the corpus callosum and the inferior extent of the thalamus are identified, and in conjunction with the previously determined polar points, the AC-PC line is estimated by linear regression. The detected points and estimated AC-PC line are depicted in white: FP, frontal pole; GCC, genu of corpus callosum; OP, occipital pole; TH, subthalamic point. Automated determination of pons region of interest (lower left) is based on iterative search for maximal (K1) activity within a stereotaxically defined range. The region is then mapped to the corresponding position in the distribution volume (DV) data (lower right). All images represent parametric maps of either K1 or DV, depicted in pseudocolor, with red and white representing highest and green and blue the lowest values, according to the scale at the bottom.
The average DV of the scanned gray matter was additionally determined by a modification of an established method (Fox and Raichle, 1984). The average gray matter DV was calculated from each individual scan as the volume-weighted average of voxels falling within a stereotypic gray matter mask template. The template was constructed from the group-averaged K1, map by inclusion of voxels with values >80% of the average of the entire scanned field of view. These limits routinely exclude activity associated with ventricular CSF, white matter, and scalp and extracerebral soft tissues. The mask identified 63,104 gray matter voxels common to all data sets.
Calculation and display of binding maps
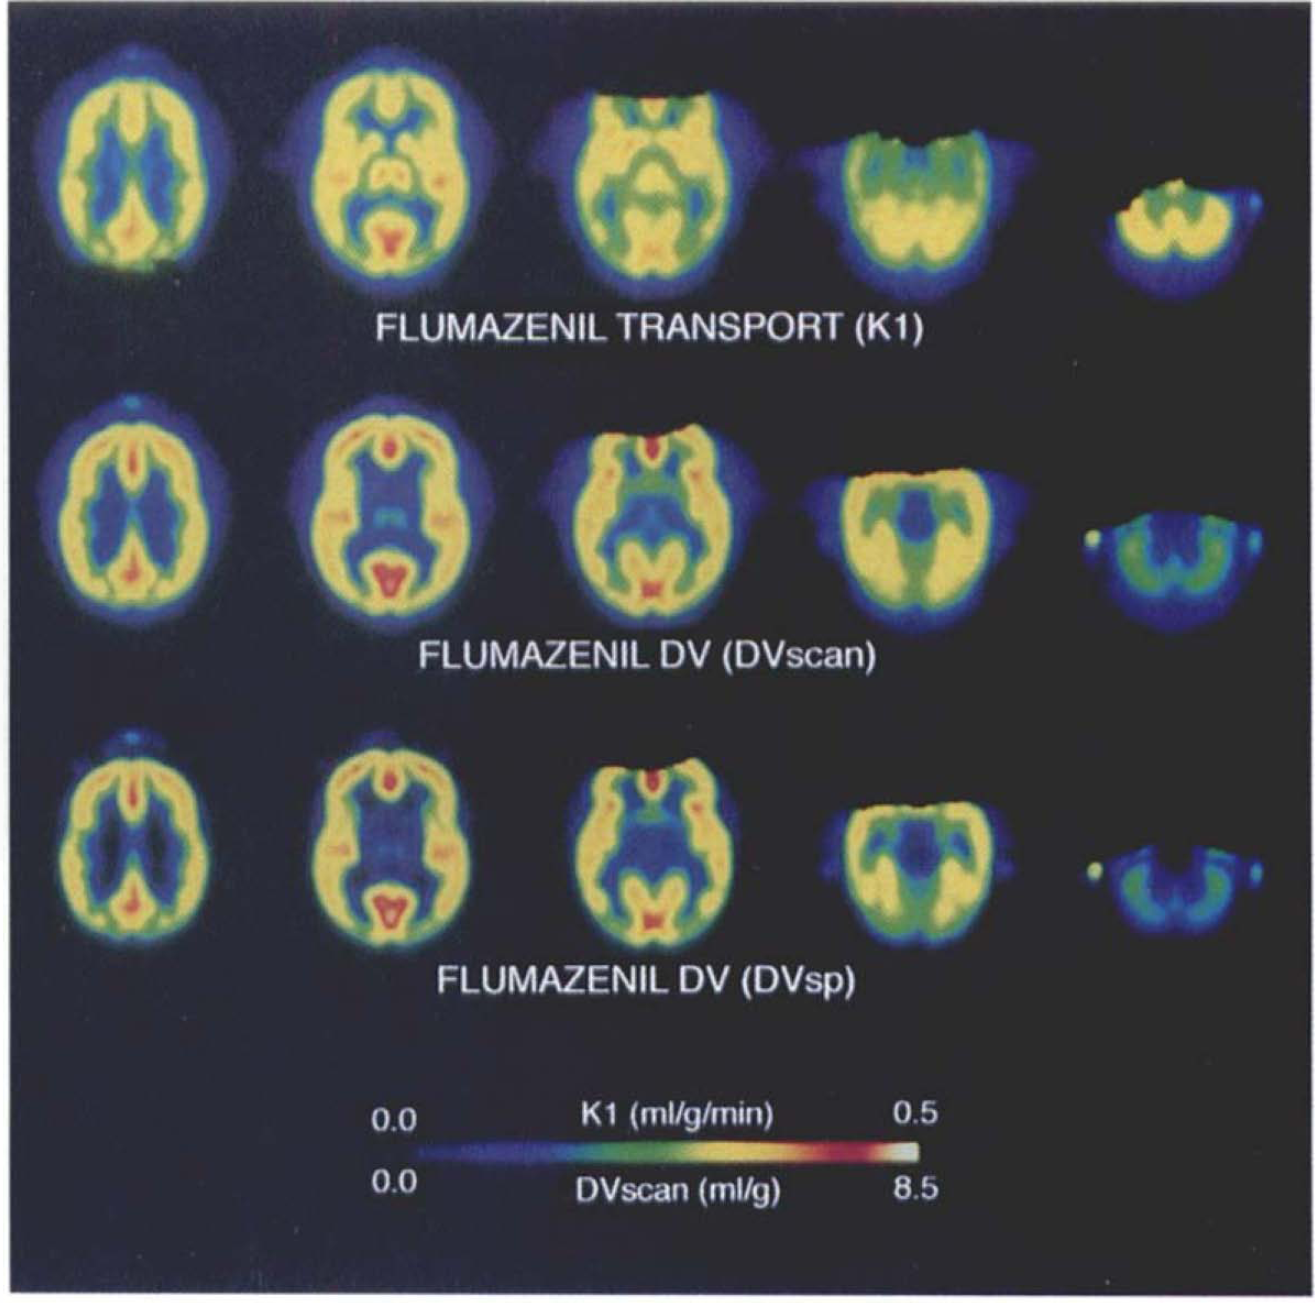
Intersubject summation binding maps were calculated by each of three conventions. Flumazenil DV was summed in original parametric values (DVscan; ml plasma/ ml brain), as expressed relative to whole brain average DV (DVglobal,), and as relative “specific” binding (DVsp). The latter calculation involved use of the pontine DVscan (DVpons) as an estimate of nonspecific and free tissue DV as follows:
The DVscan consists of components attributable to free ligand (DVF), nonspecific binding (DVNS), and specific benzodiazepine receptor binding (DVS; see eqs. 5, Koeppe et al., 1991):

The relationship in eq. 2 may be restated in kinetic terms as follows (see eqs. 5, Koeppe et al., 1991):
where K1 and k2 represent ligand transport across the blood-brain barrier from the intravascular to tissue spaces and back, k3 is the rate of ligand binding to the benzodiazepine receptor, k4 is the dissociation rate for specific binding, and k5 and k6 reflect binding and dissociation from nonspecific (non saturable) sites, respectively. Assuming that the pons contains only nonspecific and free ligand, and that these are relatively uniform throughout the brain, eq. 1 may be rewritten as:
The DVsp is thus equivalent to the binding potential (BP) divided by the tissue free-ligand fraction (f2) in the alternative notation employed by Mintun et al. (1984):
DVsp is thus linearly proportional to regional available benzodiazepine binding site density (Bmax′) in the case where all specific binding sites possess identical equilibrium binding dissociation constants (Kd).
Averaged binding maps as well as pixel-by-pixel maps of variance and coefficient of variation (CV; the ratio of mean to SD) were created for DVscan, DVglobal, and for DVsp data. The CV was calculated only for voxels within the gray matter mask, because extracerebral and CSF areas have both low DV and high variance, giving rise to very high CV values.
Statistical evaluation of population-averaged binding maps
The statistical properties of stereotaxically transformed binding data were evaluated by each of two procedures to identify the frequency and location of areas that might give rise to apparent false-positive differences in subject-versus-group or in group-versus-group comparisons. In both analyses, the pixels of interest were limited to those defined as cerebral gray matter according to the algorithm described previously, eliminating the consideration of apparent changes in extracerebral regions.
Subject-versus-group comparisons were explored with the use of a jackknife analysis (Efron, 1982) of the DVglobal, data. Each individual subject's DV data were smoothed with a 3-D gaussian filter (9-mm FWHM) and compared against the mean and SD of the remaining 13 subjects. Pixel-by-pixel Z-score maps were created and searched for peaks (both positive and negative), defined as local maxima or minima of the surrounding 26 voxels in a 3D search pattern. The locations and Z values corresponding to all peaks were recorded for each subject.
Group-versus-group analysis was performed by arbitrarily dividing subjects into two subgroups of seven, followed by calculation of mean and SD DVglobal maps. A pixel-by-pixel Student's t statistical comparison was then conducted, followed by each of two procedures for assessment of significance in the resulting t map. First, the t-statistic map was transformed to the corresponding Z-statistic map using a probability integral transformation. This was accomplished by assigning pixel Z values on the basis of the probability associated with observed t values, as predicted by the theoretical distribution of t and the available degrees of freedom. Image smoothness in the resulting Z map was evaluated on the basis of its first partial derivatives in a 3D extension of the procedure described by Friston et al. (1991), followed by estimation of the number of independent resolution elements (Worsley et al., 1992). This procedure permitted subsequent assignment of adjusted statistical probabilities to peaks identified in analysis of the group Z-statistical map, on the basis of a smoothed gaussian field model (Adler and Hasofer, 1976). Alternatively, a newly described procedure for direct inspection of the t field was employed to determine the t threshold corresponding to an adjusted probability of p ≤ 0.05 (corollary 5.5, evaluated for N = 3 dimensions in the t field and m = 12 df in: Worsley, 1994).
RESULTS
Summation analyses
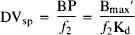
The anatomic standardization methods employed resulted in automated identifiability of brain structure and landmarks in each K1 and DV scan set. After summation across subjects, regional cerebral structure in the population-averaged transport and binding maps was well-preserved, permitting distinction of cortical as well as subcortical structures (Fig. 2). As in the instance of individual subject's DV maps, the summed image demonstrates highest binding in cerebral cortex, with lower levels of binding in basal ganglia, thalamus, and cerebellar cortex. Pontine binding is lowest of identified gray matter structures, approaching levels present in subcortical white matter regions.
Average ligand transport and benzodiazepine binding site maps in normal subjects. Images depict the population-averaged maps of flumazenil K1 (top row) or distribution volume (DV) (middle and bottom rows) at five matching transaxial levels separated by 13.5 mm, extending from 24.75 mm superior (left) to 29.25 mm inferior and parallel to the anterior commissure-posterior commissure (AC-PC) line. The middle row depicts DVscan (unsealed parametric summation) and the bottom row depicts DVsp (specific binding estimated with the use of pontine DV as an estimate of nonspecific and free ligand). Images are depicted in pseudocolor with parametric ranges of 0–0.5 ml/g/min for K1, 0–8.5 ml plasma/ml brain for DVscan, and 0–5.7 for DVsp, respectively. Note definition of basal ganglia and thalamus in the summed images (columns 2 and 3), particularly evident in the K1, data (top row). The DVscan and DVsp patterns are similar, but demonstrate relatively lower values of DVsp in regions of fewest benzodiazepine binding sites (basal ganglia, thalamus, cerebellum, and white matter) after subtraction of estimated nonspecific and free ligand DV (DVpons). Missing data at the top of images in columns 3–5 represent voxels not present in all scan data sets. The original scan acquisitions were oriented parallel to the canthomeatal line, whereas the transformed maps are displayed in AC-PC orientation.
Automated location of the pons
The algorithm for location of pontine activity successfully converged in all cases. The resulting Ta-lairach coordinates of the ROI center were (mean ± SD of x, y, and z, displacements in millimeters from the AC): 0, −25 ± 3, −29 ± 1. Regional DV values for the pons determined in this fashion (Table 1) are in good agreement with prior estimates from subjectively placed ROIs (Frey et al., 1991).
Effect of normalization on binding estimates a
Benzodiazepine binding site densities are expressed as mean and SD from n = 14 young, normal subjects. Binding is estimated from the tissue-to-plasma distribution volume of [11C]flumazenil (DVscan), or from transformations of DVscan measurements as described in the text: DVsp is an estimate of specific binding, employing pontine DVscan as an estimate of nonspecific and free DV. DVglobal is the ratio of regional DVscan to the average gray matter value.
Gray matter region of interest were identified according to stereotaxic atlas (Talairach and Tournoux, 1988) coordinates. The Brodmann areas corresponding to neocortical regions sampled are given parenthetically, and brain volumes corresponding to the voxels sampled in each subject for each region are specified.
Brain gray matter voxels were identified on the basis of the group-averaged [11C]flumazenil transport map as described in the text. The gray matter DV values represent area-weighted averages of the identified voxels.
Effect of normalization procedures on binding maps
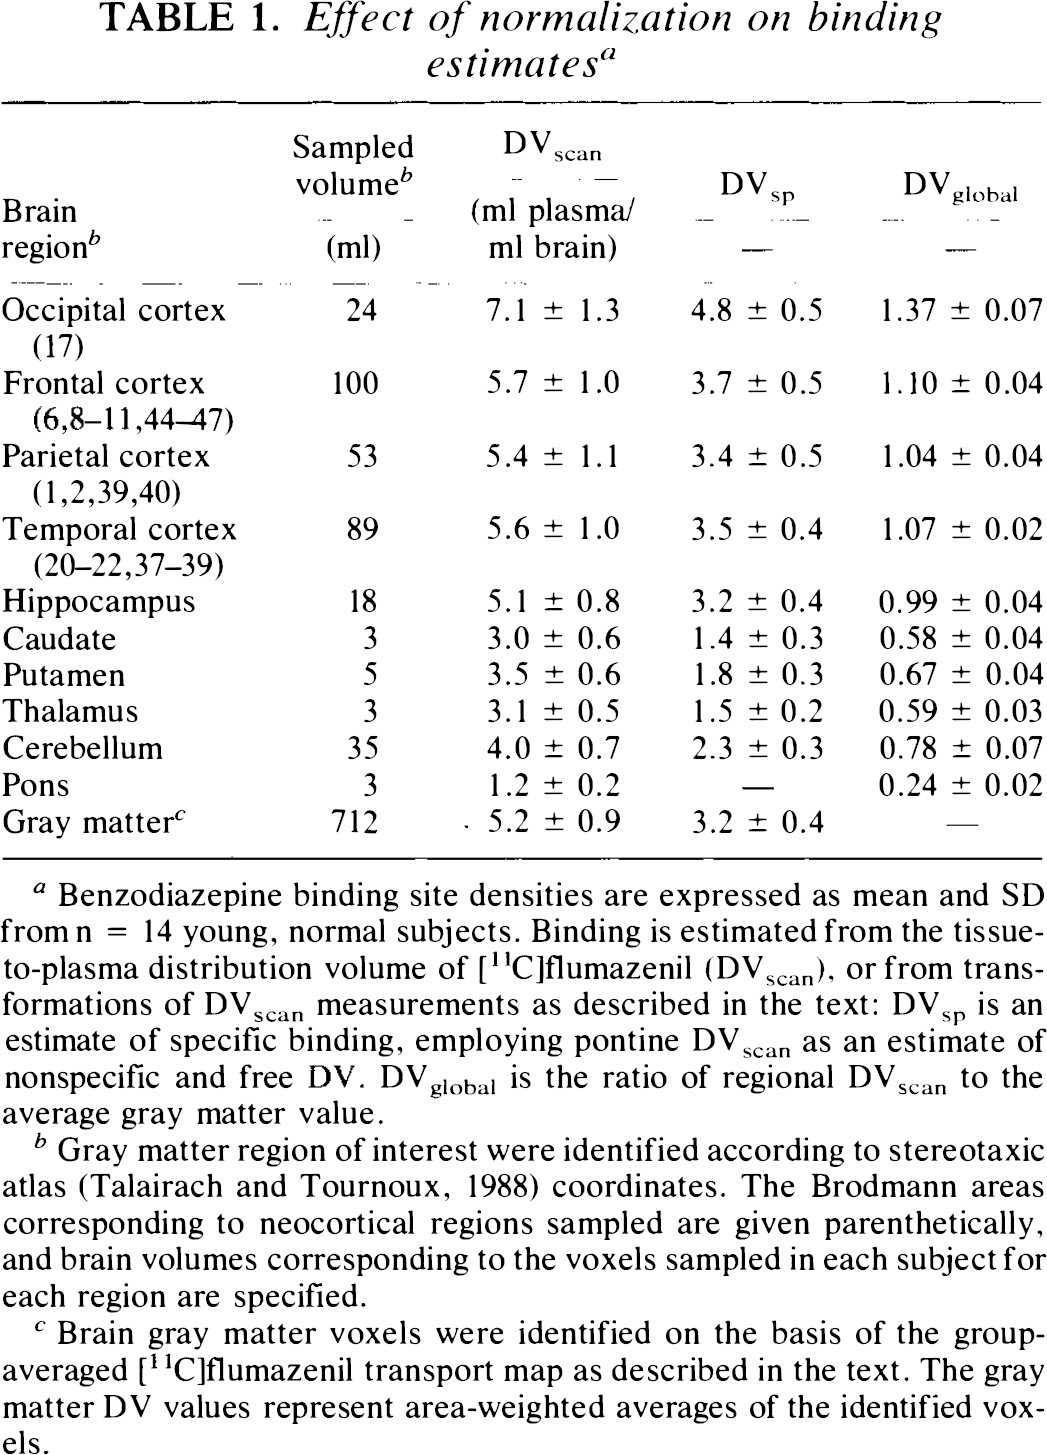
Scaling of DV relative to pontine or to whole brain average (data not shown) values before summation results in qualitatively similar population-average DV maps, but with substantial reductions in overall variance (Fig. 3; Table 1). Summed parametric DV maps (DVscan) are associated with average gray matter CV of ∼17% (ROI range 14–20%). The average gray matter CV is reduced to 12% in DVsp maps (range 10–20%), and to <10% in DVglobal maps (range 2–9%).
Effect of image scaling on summation binding map variance. The pixel-by-pixel gray matter coefficient of variation (CV) is depicted at the same transaxial levels displayed in Fig. 2 for distribution volume (DV)scan (top row), DVsp (middle row), and DVglobal (bottom row) summed data. There is overall progressive reduction in CV by the two normalization procedures in areas of high binding (cerebral cortex). Values of DVsp at the margins of regions of low binding (caudate nucleus, thalamus, and cerebellum) are increased relative to DVscan and DVsp in the pons is indeterminate, due to reduction in the mean parameter values after the subtraction of DVpons. Values are depicted in pseudocolor according to the scale at the bottom from 0 to 0.45.
The CV patterns are relatively uniform across major gray matter structures, with areas of relatively increased variance corresponding to gray-white matter interfaces. This is attributable to residual structural variability after stereotaxic standardization, because neither the cortical gray-white matter margin nor the apparent cortical width are specified in the current transformation procedures. Thus, relatively greater anatomic variability and partial volume averaging of gray and white matter result in increased CV on the basis of increased SD and reduced mean DV, respectively.
Statistical properties of summed binding data
Comparison of individual DVglobal data with the group mean pattern revealed a consistent pattern in all subjects. Peak analysis revealed 210 ± 10 (mean ± SD) discrete positive or negative peaks per subject. The range of Z scores associated with the detected peaks was 3.98 to − 3.84. An average of 10 ± 9 peaks (5% of total peaks) per subject fell outside the range of 2.5 ≤ Z ≥ −2.5. This compares favorably with the prediction of 4.6% of values falling outside of the ±2.5 SD range in the gaussian distribution.
The subgroup-versus-subgroup analysis revealed a range of adjusted Z-statistic values between 3.77 and −3.57 (Fig. 4). Assessment of image smoothness indicated a FWHM .resolution of 9 mm in the summed images, corresponding to a total of 986 independent resolution elements within the volume subtended by the gray matter mask. Analysis of the group difference Z-statistic map revealed a distribution of values corresponding closely to the gaussian distribution (Fig. 5). No outlier pixels with extreme Z values were observed. Eight peaks within the analyzed volume had uncorrected significance at the p < 0.001 level; however, after adjustment for multiple comparisons assuming a gaussian model (Worsley et al., 1992), there were no peaks exceeding the significance threshold of p < 0.05 (corresponding Z-statistic threshold of 4.64). Employing the more conservative t field estimator (Worsley, 1994), no voxels approached the specified p < 0.05 significance threshold (t value 9.96, corresponding to a Z-transformed value of 5.08).
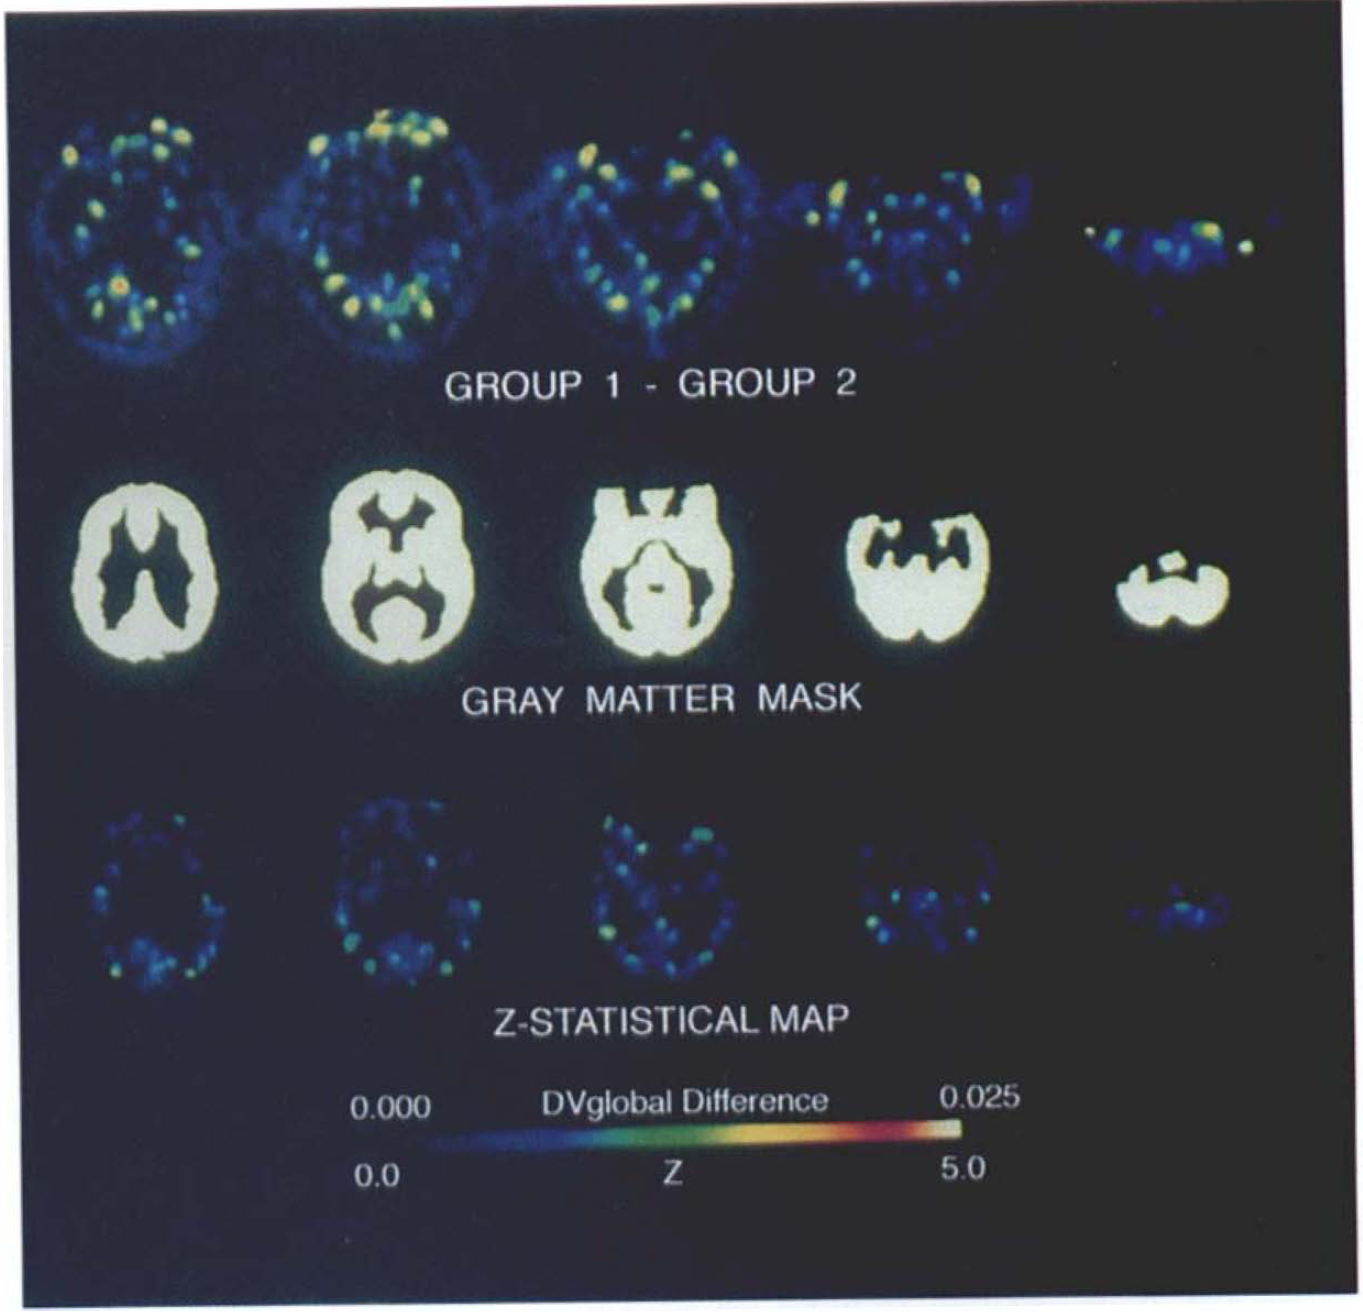
Assessment of differences between subgroups of normal scans. The top row depicts the difference in distribution volume (DV)global data between two subgroups of normal subjects (n = 7 each) at the same transaxial levels represented in Figs. 2 and 3. The middle row depicts the gray matter mask at the corresponding anatomic levels. The bottom row depicts the Z-statistical map for gray matter voxels corresponding to the difference between the two subgroups. The images in the top and bottom rows are displayed in pseudocolor representation according to the scale at the bottom with a range of 0–0.025 for the DV difference and 0–5 for the Z-statistical images, respectively. The red range of the color scale includes Z = 4.64, the threshold for significance at an adjusted level of p < 0.05 using the gaussian model. The Z-threshold predicted by the t-field model, Z = 5.08, is off scale. The areas of highest difference between the subgroups, represented at the tops of the first two images and at the lateral aspects of the bottom images in the first row, correspond to locations of scalp fiduciary markers. There are no pixels approaching either threshold for statistical significance in the Z map depicting comparison of the subgroups.
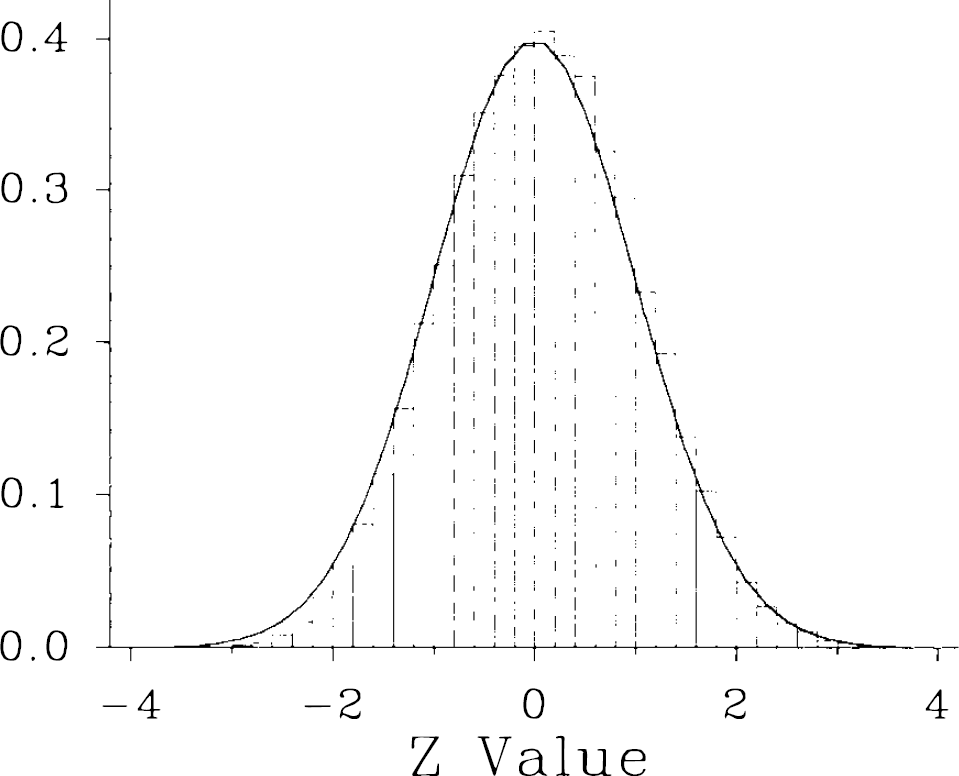
Frequency histogram of Z-statistical values corresponding to gray matter voxels in comparison of normal subgroups. The Z-statistical map represented in Fig. 4 was converted to a frequency histogram and plotted at 0.2 SD intervals (bars) in comparison to a normal gaussian distribution. There is general agreement between the observed data and the gaussian prediction.
DISCUSSION
Intersubject image averaging
The results of our initial application of summation techniques to ligand binding maps are encouraging on several levels. First, the ability to perform automated stereotaxic scan deformations permits the rapid and routine use of population-averaging techniques. Our approach, based on existing CBF image processing techniques, requires no additional structural image data [magnetic resonance (MR) or x-ray computed tomography] to standardize normal brains. Evolving methods that accomplish stereotaxic transformations with the use of comparison MR imaging (Evans et al., 1991) may be employed in instances of gross structural abnormality (subjects with prior brain surgery or with mass lesions), but will require interactive feedback from an experienced observer to identify landmarks. Effects of diffuse cerebral atrophy may not preclude use of the current method, as evidenced by success of the same automated stereotaxic procedure in recent studies of aging and Alzheimer's disease (Minoshima et al., 1994a; Cho et al., 1994). Focal or regional atrophy such as that encountered in the striatum of patients with Huntington's disease, however, has yet to be evaluated with these techniques.
The use of radioligand transport maps to guide anatomic transformation permits precise between-subject alignment of binding maps, even in regions of very low receptor density. The mean and variance maps created in the present studies demonstrate pixel-by-pixel precision comparable to that reported in prior region-of-interest-based studies of [11C]flumazenil in our laboratories (Frey et al., 1991). This indicates that the advantages of stereotaxic summation analyses may be achieved without loss of statistical power. Our finding that the gaussian distribution corresponds reasonably to that of observed Z statistic in the group-versus-group comparison might be anticipated, because the two distributions are known to converge when >20 df are represented (Rice, 1988). However, we interpret this finding with caution due to the limited degrees of freedom (df = 12) in the current analysis. Because a probability integral transformation of observed t-statistical values was used to assign Z values, our results imply that the observed and theoretical probability distributions of t were in close agreement. Thus, group comparison studies employing modest numbers of subjects appear to be suitable for analysis with our procedures as predicted by Worsley's theoretical analysis regarding the correspondence of gaussian and t fields (eq. 7 in Worsley et al., 1992).
Statistical properties of individual images in comparison to the averaged binding distribution indicate a lack of voxels of high residual variation after anatomic standardization. It is notable that no outliers relative to the expected gaussian distribution of random statistical fluctuation were identified in peak difference analyses. Thus, possible misregistration or “edge” artifact does not contribute to false-positive differences with use of the current stereotaxic algorithms. Future work will be required to establish empirical threshold criteria for interpretation of individual scans in comparison with reference data; however, the present results indicate that the combined effects of biologic variability and procedural error result in normally distributed peak differences, facilitating development and application of quantitative statistical criteria.
A major advantage of statistical image analyses is the opportunity to rigorously correct for multiple parallel comparisons. The bases for such corrections require estimation of the overall image smoothness as an index of the number of independent resolution elements represented. We used a combination of the methods reported by Friston (Friston et al., 1991) and Worsley (Worsley et al., 1992), but using local estimates of variance, to calculate a Z-statistical map that was used to estimate smoothness in the receptor binding data. An alternative procedure for assessing significance in t-statistical maps generated on the basis of pooled variance has been proposed by Worsley (Worsley et al., 1993). Although this approach does not require the numbers of subjects employed in the present analyses (a minimum of four subjects are necessary), it does depend on a uniform distribution of variance in the images.
Applications of summation analyses in benzodiazepine binding experiments
After the routine implementation of the methods described here, we have explored post hoc application of the technique to several benzodiazepine binding site data sets. Preliminary analyses indicate, for example, that there is increased binding with advancing age in the normal cerebellar cortex (Minoshima et al., 1993b). In addition, we have evaluated benzodiazepine binding maps obtained from patients with refractory mesial temporal lobe epilepsy (Minoshima et al., 1993a). In this instance, we have confirmed the major finding arising from qualitative visual and region-of-interest analyses (Henry et al., 1993), that there is reduction of binding sites in the epileptogenic hippocampal formation and amygdala. The stereotaxic summation analysis, however, indicates that there are no additional, occult changes that occur frequently enough to serve as biologic markers of refractory epilepsy. Thus, both unanticipated positive as well as pertinent negative findings may arise through the use of omnibus statistical analyses of summed binding maps.
Analyses of other ligands and of qualitative data sets
The analytic strategy employed in the current work may be directly extended to studies of other cerebral ligand distributions. The parametric ligand transport map used for stereotaxic anatomic definition has been routinely calculated in our laboratories for a variety of binding site ligands including muscarinic cholinergic receptors (Zubieta et al., 1993; Koeppe et al., 1994), cholinergic presynaptic vesicles (Kuhl et al., 1994), dopamine D2 receptors (Minoshima et al., 1994b), and monoaminergic presynaptic vesicles (Vander Borght et al., 1994). In addition to the use of parametric transport maps, it is likely that integrated activity maps obtained shortly after tracer injection will allow comparable definition of anatomic structure. Indirect use of early postinjection data to accomplish anatomic standardization of delayed tracer distributions may, thus, follow the present convention for analyses of flumazenil K1 and DV parametric maps. Success of this approach with other tracers will depend on image statistics and gray matter contrast, dictated predominantly by the administered dose and its first-pass cerebral extraction.
CONCLUSIONS
In conclusion, our initial application of stereotaxic image summation techniques to ligand binding data indicates promise for future analyses. The methods employed in these studies are fully automated, rapid, and permit inspection of entire scan data sets for unanticipated changes. Pixel-by-pixel analyses of neurochemical parameters, in conjunction with more traditional ROI-based methods, may significantly enhance the information extracted from costly and labor-intensive neuroimaging experiments.
Footnotes
Acknowledgments:
This work was supported by grants from the National Institute of Mental Health designated ROI MH49748 and from the National Institutes of Health designated P50 NS15655, and by Department of Energy contract DE-FG-02-87ER60561. We thank The University of Michigan Cyclotron/Radiochemistry Laboratory staff for radioligand production, the PET Imaging Suite staff for collection of scan data, and Dr. Jeffrey Fessler for thoughtful discussion on statistical models.