
Abstract
Post-treatment with the N-methyl-D-aspartate (NMDA) receptor antagonist MK-801 reduces hypoxic–ischemic brain injury in immature animals. To elucidate possible mechanisms, cerebral glucose utilization (CMRglc) and cerebral blood flow (CBF) were measured 1–5 h after hypoxia–ischemia and administration of MK-801 in 7-day-old rats. After 100 min of unilateral hypoxia–ischemia, half of the pups were injected with MK-801. CMRglc was assessed by the [14C]deoxyglucose (2-DG) method. The brains were analyzed either by autoradiography or for energy metabolites and chromatographic separation of 2-DG-6-phosphate and 2-DG. CBF was measured by the autoradiographic [14C]iodoantipyrine method. Mean CMRglc in the cerebral cortex was increased ipsilaterally after hypoxia–ischemia to 15 ± 3.3 μmol 100 g−1 min−1 (p < 0.01) and areas with CMRglc >20 μmol 100 g−1 min−1 amounted to 8.0 ± 7.7 mm2 in the ipsilateral hemisphere compared with 1.2 ± 1.6 mm2 contralateral (p < 0.001). Treatment with MK-801 decreased CMRglc bilaterally (p < 0.05) and reduced ipsilateral areas with increased CMRglc by 64% (p < 0.01). CBF was unaltered after hypoxia–ischemia and by MK-801 treatment. In conclusion, regional glucose hyper-utilization in the parietal cortex after hypoxia–ischemia was attenuated by MK-801; this may have relevance to the neuroprotective effect of NMDA-receptor antagonists in this model.
Brain damage due to perinatal hypoxia–ischemia (HI) causes perinatal mortality and neurologic and psychological deficits in humans (Hagberg et al., 1993; Volpe, 1995). Evidence accumulating during recent years suggests that excitatory amino acids (EAAs) are important for the development of HI brain damage in the immature rat (Johnston and Silverstein, 1987; Hagberg et al., 1990; Hattori and Wasterlain, 1990; Barks and Silverstein, 1992). In the immature rat brain, EAA receptors of the N-methyl-D-aspartate (NMDA) type are “hyperactive,” [i.e., NMDA toxicity, receptor density, and excitability is enhanced compared with that of the adult (Greenamyre et al., 1987; Ben-Ari et al., 1988; Hamon and Heinemann, 1988; McDonald et al., 1988; Tremblay et al., 1988; Represa et al., 1989)]. Blocking of NMDA (McDonald et al., 1987; Hattori et al., 1989) or α-amino-3-hydroxy-5-methyl-4-isoxazolepropionate (AMPA; Hagberg et al., 1994) receptors before or after HI offers neuroprotection in the immature rat. The mechanism for the neuroprotection offered by NMDA-receptor antagonists is unknown. High concentrations of EAAs are directly toxic if administered to brain cells in vitro (Choi, 1987), and high concentrations of glutamate analogues like NMDA and AMPA injected in vivo exert neurotoxicity in the immature rodent brain (Olney et al., 1971; McDonald et al., 1988; Ikonomidou et al., 1989; McDonald et al., 1992).
During HI, endogenous extracellular (ec) concentrations of EAAs increase considerably (Hagberg et al., 1987; Andiné et al., 1991; Silverstein et al., 1991), but the concentrations of EAAs return to levels only slightly higher than normal after the insult (Puka-Sundvall et al., 1995). These concentrations are unlikely to exert direct neurotoxicity and do not explain the neuroprotective effect of NMDA-receptor antagonists after HI. A moderately elevated excitatory activity (Chen et al., 1986; Puka-Sundvall et al., 1995), inhibited EAA re-uptake (Hu et al., 1991) and post-HI changes in the function of the NMDA receptors (Andiné et al., 1988; Kohmura et al., 1990; Hammond et al., 1994; Heurteaux et al., 1994) may contribute to the injurious cascade under conditions with reduced energy supply (Novelli et al., 1988; Simon and Shiraishi, 1990; Gill et al., 1992; Mies et al., 1993; Greene and Greenamyre, 1995). Indeed, it has been suggested that mitochondrial function is impaired during early recovery after HI in the 7-day-old rat, characterized by increased cerebral glucose utilization (CMRglc), increased tissue lactate concentrations, decreased NAD+/NADH quotient, and decreased ATP levels despite normal or decreased energy utilization and normalized CBF (Mujsce et al., 1990; Yager et al., 1991; Vannucci et al., 1994). Impairment of oxidative metabolism may represent a generalized phenomenon applicable also to postasphyxia conditions in human infants as brain regions with enhanced 18-fluoro-deoxyglucose uptake (Blennow et al., 1996), accumulation of lactate (Groenendaal et al., 1994) and secondary depression of the phosphocreatine/orthophosphate quotient (Roth et al., 1992) appear to predict an unfavorable outcome.
The aim of this study was to obtain regional information on CMRglc and CBF during the early reperfusion phase after immature HI and on how these parameters are affected by post-HI treatment with a neuroprotective dose of the NMDA-receptor antagonist dizocilpine (MK-801).
MATERIALS AND METHODS
Animals and chemicals
Inbred Wistar F rat pups of either sex were purchased from BK Universal, Stockholm, Sweden, housed at 24°C, and fed by their dams until the start of the experiments when 7 days old. 2-Deoxy-D-[U-14C]glucose (2-DG; specific activity, 230–330 mCi/mmol), 4-iodo[N-methyl-14C]-antipyrine (IAP; specific activity, 53 mCi/mmol), Hyperfilm βMax, and [14C]methacrylate standards were obtained from Amersham Sweden AB, Stockholm, Sweden. Chemicals for scintillation counting (Soluene-350, Permablend III, and Triton) were purchased from Packard Instrument B.V. Chemical Operations, Groningen, The Netherlands, and Sigma-Labkemi, Göteborg, Sweden.
Protocol
In our experiments, 152 pups from 21 litters were used. In each litter, except for the animals that did not undergo HI (non-HI controls) and animals used for 2-DG and IAP plasma/blood concentration curve estimates, half of the pups received 0.5 mg/kg of MK-801 intraperitoneally in a single dose immediately after HI (MK-801-treated rats), and the other half served as control animals (HI controls) and received the vehicle of the drug (saline) immediately after HI. Because of the catheterization procedure of intravenous injection, animals from each litter were consecutively, from 1–5 h after HI, injected with either 2-DG or IAP and subsequently decapitated. The rectal temperature was measured with a thermistor probe (BAT-12, Physitemp Instruments, Clifton, NJ, U.S.A.).
Induction of hypoxia–ischemia
Anesthesia was induced and maintained with halothane in oxygen/nitrous oxide in a snout mask. The left common carotid artery was cut between ligatures of Prolene suture (6–0; Rice et al., 1981). Animals were allowed to recover from anesthesia for at least 1 h. HI was induced by exposure to 7.7 ± 0.01% oxygen in nitrogen for 100 min in a humidified chamber at 36°C. After the insult, the pups were returned to their dams.
Measurement of regional cerebral glucose utilization, glucose, lactate, and ATP
Regional cerebral glucose utilization was assessed by the 2-DG method (Sokoloff et al., 1977), modified for the 7-day-old rat (Vannucci et al., 1989). Because these small rats offer methodologic problems, glucose utilization was measured in two different ways. In the first group, pups were reanesthetized after HI, and the femoral vein was catheterized with a polypropylene catheter (outer diameter, 200 μm) by a proximal femoral incision and ligation of the vein. The skin was lightly sutured but not closed. When the animals reacted with movement to tail pinching, 50–150 μCi/kg 2-DG in 30 μl saline was administered intravenously for 1 min, the catheter was removed, and the ligatures and sutures tied close. At 1, 2, 5, 10, 20, 30, 45, or 90 min later, blood was collected from severed neck vessels at decapitation. This method offered the advantage of injecting the 2-DG quickly and allowing 45 min of circulation time (Sokoloff et al., 1977; Mori et al., 1990) but necessitated 25–30 min of reanesthesia. In the other group, 2.5 μCi in 0.2 ml saline, ∼250 μCi/kg, was injected subcutaneously in fully awake rats, after which blood was collected at decapitation at 5, 10, 15, 20, 45, or 90 min after injection. This method impairs the rats' function less but requires a longer (90 min) circulation time of the 2-DG until measurement of glucose utilization (Vannucci et al., 1989).
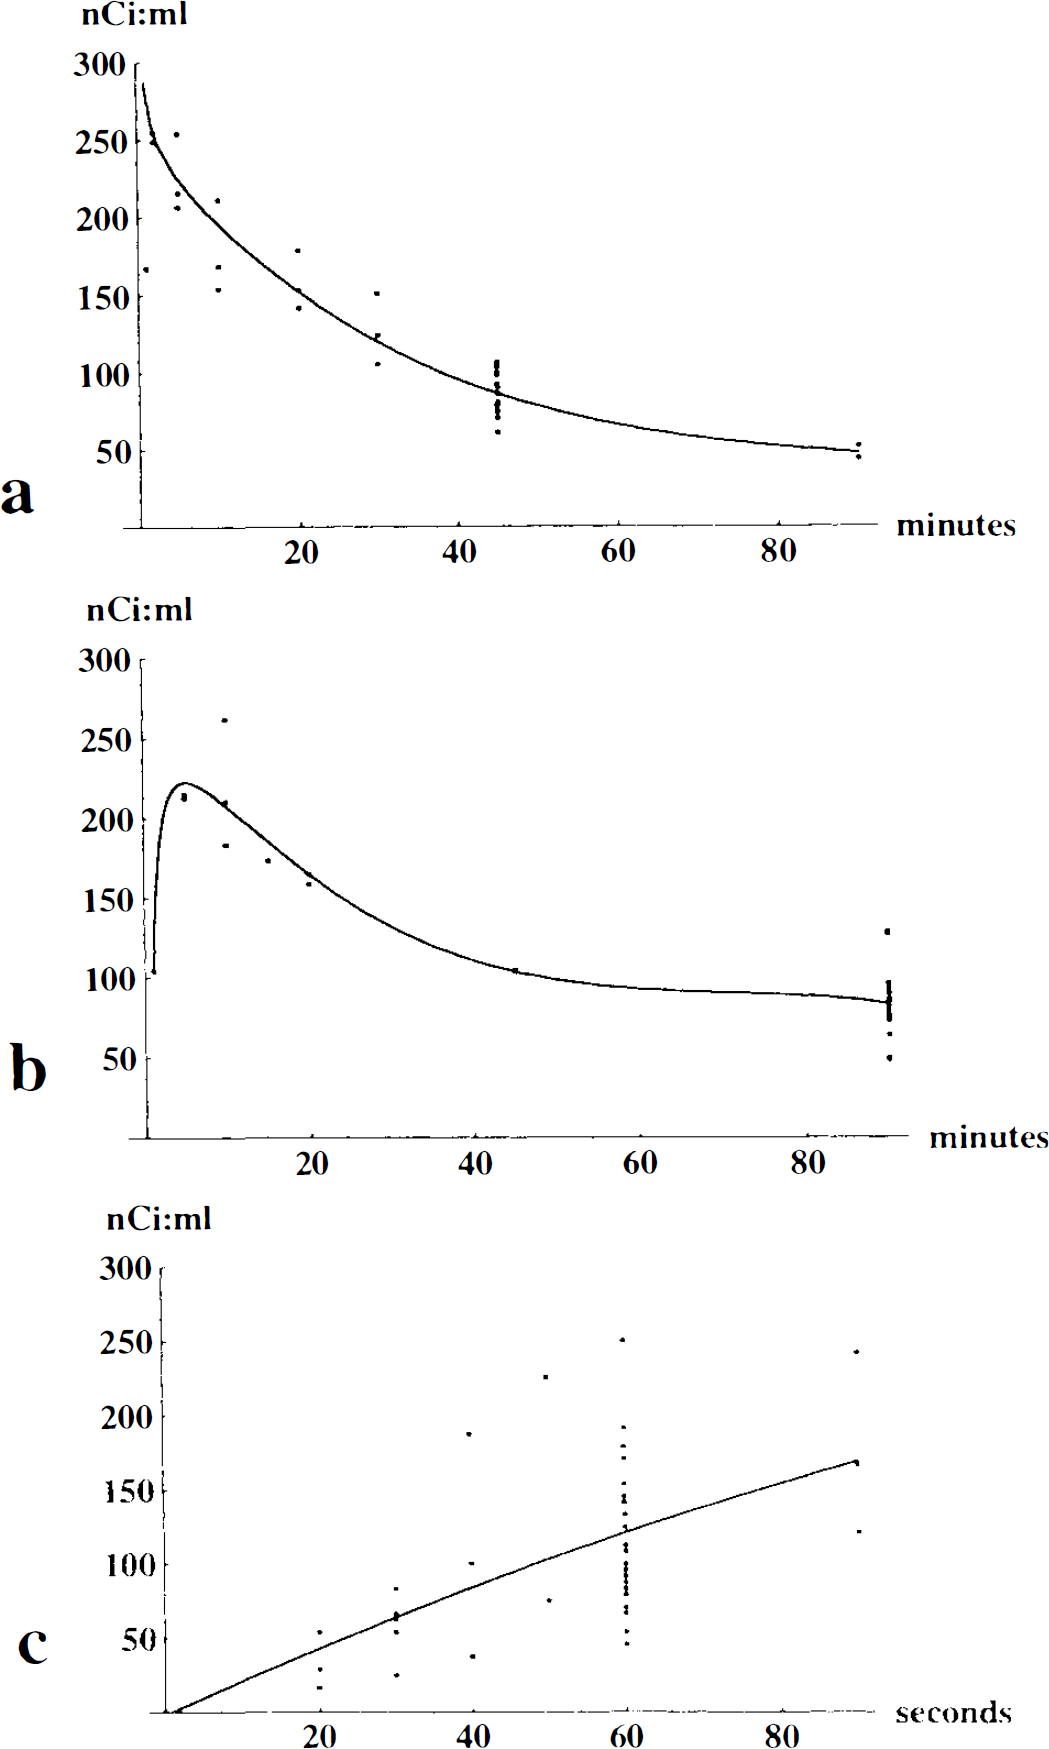
A portion of the blood was used to determine glucose concentration by an enzymatic-photometric technique (Reflolux II M, Boehringer Mannheim GmbH, Mannheim, Germany), whereas the rest was centrifuged at 5,000 g for 15 min, after which 10 μl of plasma was added to 9 ml of scintillation fluid (0.75 L xylene, 6 g Permablend III, and 0.25 L Triton per liter). Samples were counted in a calibrated liquid scintillation counter (1215 Rackbeta, Wallac OY, Turku, Finland). This allowed calculations of the mean arterial plasma curves for 2-DG after either intravenous or subcutaneous injection (Fig. 1a, b). Because blood sampling from each rat could be done only once, the curve was fitted to the individual pup depending on the 2-DG plasma concentration at decapitation 45 (if intravenous injection) or 90 min (if subcutaneous injection) after injection, the times used for measurement of CMRglc.
Individual values and fitted mean curve for (
If they were planned for autoradiography, the brains were dissected out after decapitation and in <1 min frozen in isopentane cooled by dry ice. Coronal sections were cut at −20°C, mounted on glass slides, dried, and autoradiographed on Hyperfilm βMax together with [14C]methacrylate standards. Autoradiographs were calibrated and analyzed by quantitative densitometry (NIH Image, NIH, Bethesda, MD, USA) by a blinded observer. CMRglc was calculated by Sokoloff's original equation with values of the rate constants from measurements on adult rats (Sokoloff et al., 1977) and the lumped constant from mean of ipsi- and contralateral estimations, respectively (see the following). After film exposure, sections were stained with hematoxylin–eosin to correlate the CMRglc to histologic damage.
When planned for measurement of metabolites and 2-deoxy-D-[14C]glucose-6-phosphate (2-DG-6-P), the rats were decapitated over liquid nitrogen and the heads immediately frozen. Portions (10–50 mg) of the parietal cortex were dissected out at −20°C, weighed, and solubilized in 3 M HClO4 (Lowry and Passonneau, 1972) at ∼10°C. After centrifugation at 5,000 g for 25 min, one volume of the supernatant was neutralized with 2.5 volumes of 2 M KHCO3 and again centrifuged to remove precipitated KHCO3. The supernatant was divided into three portions, and 50–150 μl was added to 9 ml of scintillation fluid and counted as previously; 150 μl was used for enzymatic–fluorometric determination of ATP, glucose, and lactate (Lowry and Passonneau, 1972), and 300–600 μl was passed over an ion-exchange column formate form (AG1-X8 resin, Biorad Econocolumn, Biorad, Solna, Sweden) to retain 2-DG-6-P, whereas unphosphorylated 2-DG was eluted with 2.6 ml of distilled water. The remaining 2-DG-6-P was eluted with two portions of 3 ml 1 M HCl. Eluted portions were added to 9 ml of scintillation fluid and counted in a liquid scintillation spectrometer. The 2-DG-6-P activity in the tissue was used as the numerator in Sokoloff's original equation (Sokoloff et al., 1977; Vannucci et al., 1989). The lumped constant vas estimated from a nomogram for adult rat brain that allows calculation of the lumped constant from the brain and plasma glucose concentrations (Pardrige et al., 1982). All brains and specimens were stored at −80°C.
Measurement of local cerebral blood flow
CBF was measured by the autoradiographic IAP method (Sakurada et al., 1978), adapted to the immature rat (Lyons et al., 1987). First, 5–10 μCi IAP (500–1,000 μCi/kg) in 0.2 ml saline was injected subcutaneously. Then at 20, 30, 40, 50, 60, or 90 s after injection, the rats were decapitated, and 10 μl of blood was solubilized in 1 ml of Soluene-350 overnight, added to 9 ml of scintillation fluid and counted. The brain was dissected out in <40 s (Jay et al., 1988), frozen in isopentane cooled by dry ice, and processed for autoradiography as previously described. Because blood could be drawn from rats only at decapitation, the mean arterial blood concentration curve of IAP, calculated from rats decapitated at 20–90 s after injection (Fig. 1c), was fitted to the pups decapitated at 60 s and used for autoradiography and calculation of CBF; 0.944 ml/g was used as the brain-blood partition coefficient (Lyons et al., 1987).
Statistics
The Mann–Whitney U test was used for unpaired statistical analysis between HI controls and MK-801-treated rats, and the Wilcoxon test for paired analysis between ipsilateral and contralateral brain regions. Values are given as mean ± SD. Spearman's rank correlation coefficient (rs) was used for rank correlation, and the least squares method, for linear regression.
RESULTS
Plasma curves and mode of injection
Individual values and mean 2-DG plasma concentration curves after intravenous and subcutaneous injection and blood IAP concentration curves after subcutaneous injection are shown in Fig. 1. The 2-DG-6-P/ total 2-DG quotients were similar after intravenous injection with 45-min circulation time (0.57 ± 0.16 ipsilaterally and 0.42 ± 0.09 contralateral; n = 8) and subcutaneous injection with 90 min circulation time (0.63 ± 0.14 ipsilaterally and 0.55 ± 0.10 contralateral; n = 15), both of which showed an interhemispheric difference. Calculated CMRglc in the parietal cortex of HI controls did not differ between intravenously and subcutaneously injected rats (15 ± 3.6, n = 9, vs. 15 ± 4.1 μmol 100 g−1 min−1, n = 7, in the ipsilateral hemisphere and 11 ± 4.9, n = 9, vs. 10 ± 2.0 μmol 100 g−1 min−1, n = 7, in the contralateral hemisphere).
Temperature
There was no difference in rectal temperature at decapitation between HI controls (34.4 ± 1.3°C, n = 26) and 0.5 mg/kg of MK-801-treated rats after HI (34.3 ± 1.4°C, n = 20).
CMRglc and metabolites in whole tissue
Table 1 shows data from portions of the parietal cortex in rats injected with 2-DG 1–5 h after HI. In HI controls, CMRglc was higher ipsilaterally than contralateral (15 ± 3.3 vs. 9.4 ± 2.1 μmol 100 g−1 min−1; p = 0.002), accompanied by ipsilaterally decreased ATP and glucose and increased lactate concentrations, increased lumped constant, and increased 2-DG-6-P/total 2-DG ratio. Compared with non-HI controls, CMRglc in the ipsilateral hemisphere was not significantly increased (p = 0.2; Table 1). CMRglc in the contralateral hemisphere was, however, decreased when compared with that of non-HI controls (p = 0.01; Table 1). Compared with HI controls, rats treated with MK-801 had lower CMRglc ipsilaterally (11 ± 5.3 μmol 100 g−1 min−1; p = 0.05) and contralateral (7.1 ± 2.1 μmol 100 g−1 min−1; p = 0.02), a tendency to increased glucose and decreased lactate ipsilaterally (not significant), and increased cerebral glucose concentration contralaterally. The lumped constant was not significantly lower ipsilaterally in MK-801-treated rats, but MK-801 treatment decreased the 2-DG-6-P/total 2-DG ratio ipsilaterally.
Metabolic variables from pieces of the parietal cortex in untreated and MK-801-treated rats 1–3 h after hypoxia–ischemia and non-hypoxia–ischemia-exposed controls
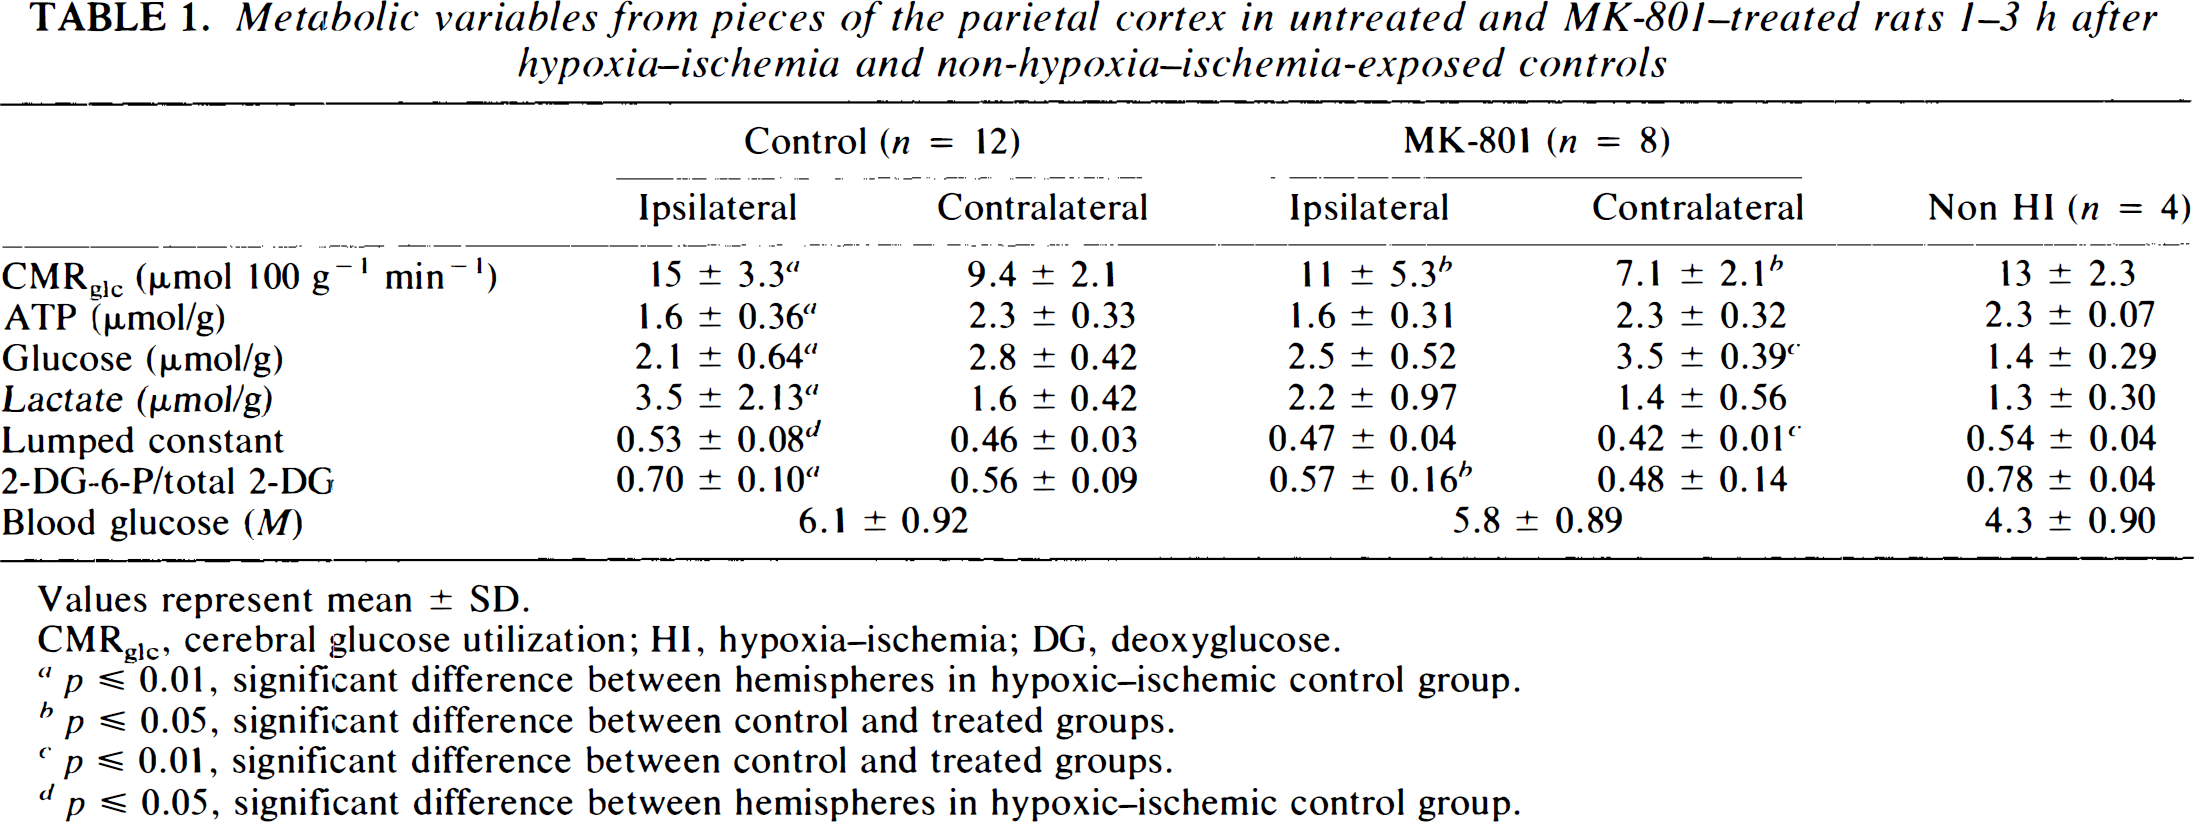
Values represent mean ± SD.
CMRglc, cerebral glucose utilization; HI, hypoxia–ischemia; DG, deoxyglucose.
p ≦ 0.01, significant difference between hemispheres in hypoxic–ischemic control group.
p ≦ 0.05, significant difference between control and treated groups.
p ≦ 0.01, significant difference between control and treated groups.
p ≦ 0.05, significant difference between hemispheres in hypoxic–ischemic control group.
There was a close linear correlation between CMRglc as calculated by the original Sokoloff equation and as calculated with the 2-DG-6-P replacement and individually estimated lumped constants (modified CMRglc = 2.6 + 0.80 × Sokoloff CMRglc; r = 0.97; p < 0.0001; residual SD = 1.18; Fig. 2), with a tendency to differ at very low values of CMRglc.
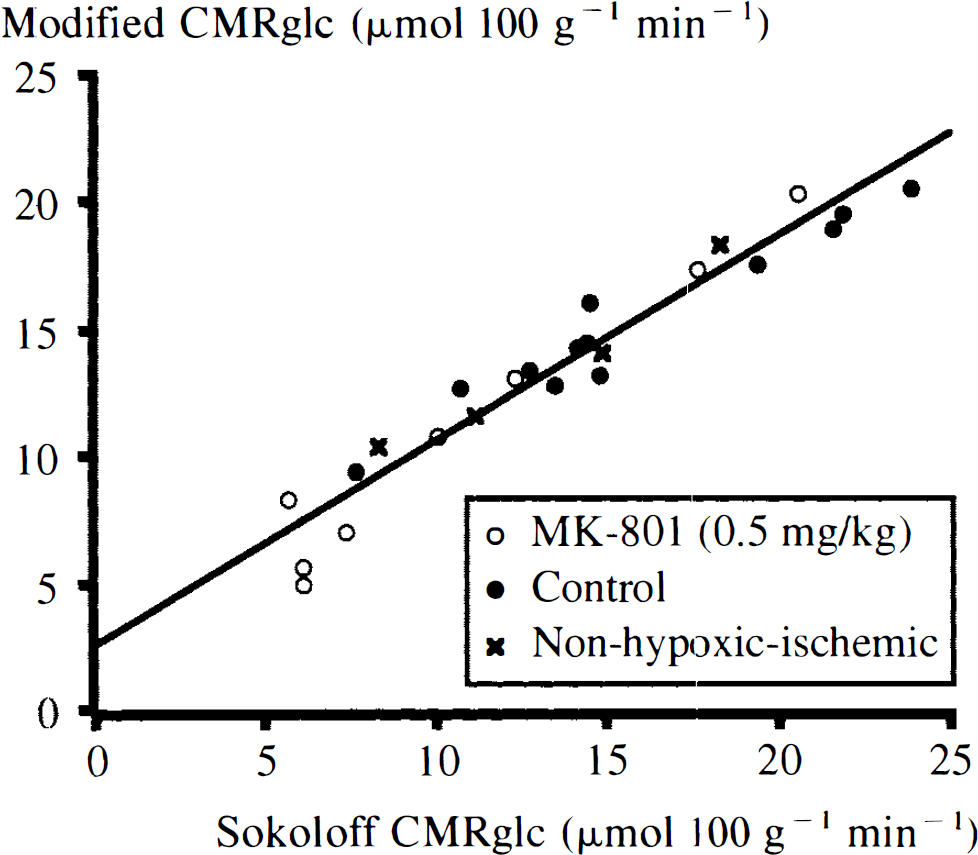
Linear correlation of cerebral glucose utilization (CMRglc) in the ipsilateral cortex as calculated with Sokoloff's original equation (Sokoloff et al., 1977) and with mean lumped constants to CMRglc calculated with 2-deoxy-D-[14C]glucose-phosphate (2-DG-6-P) measurement modification and with individually estimated lumped constants (Vannucci et al., 1989).
In the ipsilateral hemisphere, there was a negative rank correlation between CMRglc and brain ATP (rs = −0.36; p = 0.04), a positive correlation between CMRglc and brain lactate (rs = 0.48: p = 0.005), and a negative linear regression of brain glucose on CMRglc [glucose (in micromols per gram) = 3.3 – 0.078 × CMRglc (in micromols per 100 g per min); r = 0.59; p = 0.006) when analyzing HI controls together with MK-801-treated rats.
CMRglc and CBF calculated from autoradiographs
CMRglc values calculated from autoradiographs are shown in Table 2. In HI controls, mean CMRglc in the parietal cortex was increased ipsilaterally compared with that in the contralateral hemisphere (14 ± 3.6 and 8.9 ± 3.3 μmol 100 g−1 min−1, respectively; p < 0.001), although CMRglc in the ipsilateral hemisphere was very heterogeneous, with glucose-hypoutilizing areas corresponding to morphologically damaged areas (loss of acidophilia), and glucose-hyperutilizing areas corresponding to histologically intact areas surrounding damaged areas (Figs. 3 and 4). The glucose-hyperutilizing areas were larger ipsilaterally than contralaterally (8.0 ± 7.7 and 1.2 ± 1.6 mm2, respectively, for CMRglc > 20 μmol 100 g−1 min−1; p < 0.001; Table 2, Fig. 4). Treatment with MK-801 reduced CMRglc ipsilaterally (to 10 ± 4.7 μmol 100 g−1 min−1; p = 0.016) and contralaterally (to 4.9 ± 2.6 μmol 100 g−1 min−1; p < 0.001) and correspondingly reduced the size of the glucose-hyperutilizing areas to 2.9 ± 3.8 mm2 in the ipsilateral hemisphere (p = 0.008; Table 2, Fig. 4).
Mean blood glucose utilization (CMRglc.) in parietal cortex and size of areas where CMRglc >20 and 30 μmol 100 g−1 min−1, respectively, in whole hemisphere in midhippocampal sections in control and MK-801-treated rats 1–5 h after hypoxia–ischemia
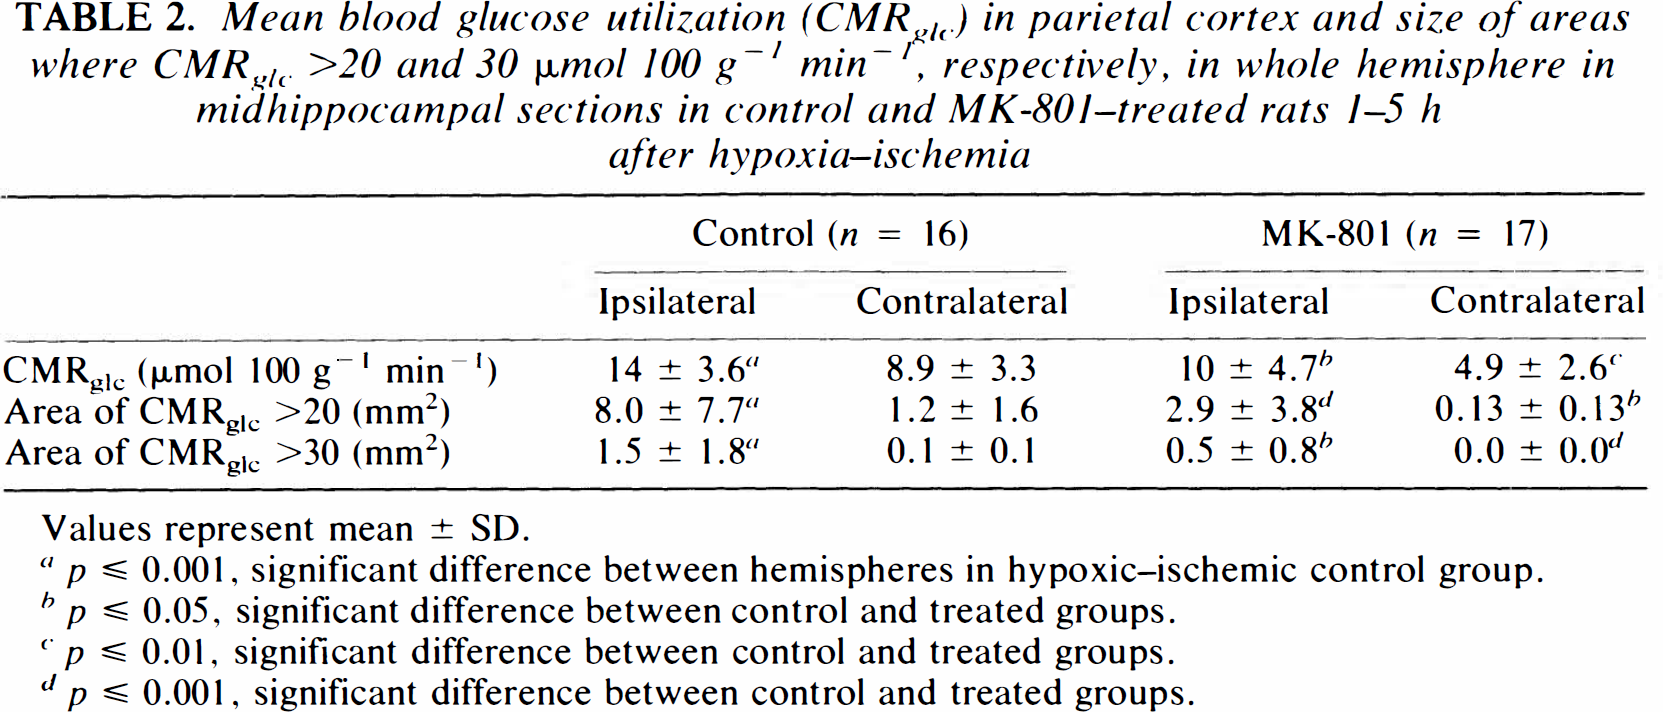
Values represent mean ± SD.
p ≦ 0.001, significant difference between hemispheres in hypoxic–ischemic control group.
p ≦ 0.05, significant difference between control and treated groups.
p ≦ 0.01, significant difference between control and treated groups.
p ≦ 0.001, significant difference between control and treated groups.
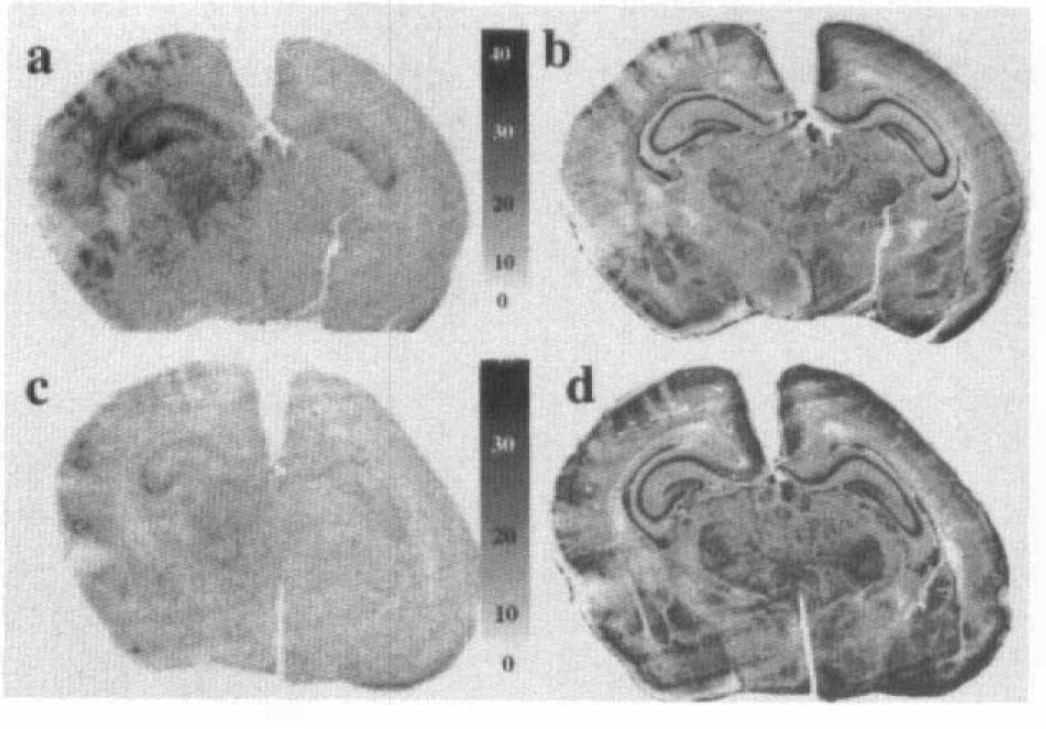
Representative 2-deoxy-D-[14C]glucose autoradiographs (calibrated in micromol per 100 g per minute) (
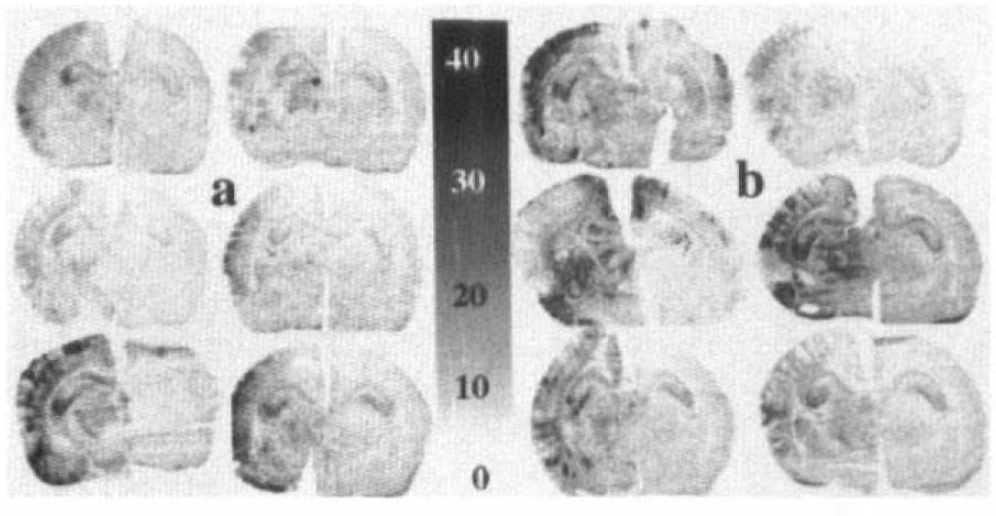
Representative 2-deoxy-D-[14C]glucose autoradiographs(calibrated in micromol per 100 g per minute) from (
Mean CMRglc values did not change with time between 1 and 5 h after HI either in the ipsilateral (CMRglc = 15 — 0.009 × min after HI; r = 0.14; p = 0.5) or contralateral hemisphere (CMRglc = 8.3 + 0.004 × min after HI; r = 0.03; p = 0.7) in HI controls (n = 16).
CBF in the parietal cortex of HI controls did not differ between the ipsilateral (51 ± 22 ml 100 g−1 min−1) and contralateral hemispheres (50 ± 25 ml 100 g−1 min−1) (Table 3, Fig. 5), but did show a slight heterogeneity corresponding to histologic damage. Treatment with MK-801 did not significantly affect CBF (73 ± 37 ml 100 g−1 min−1 ipsilaterally and 56 ± 27 ml 100 g−1 min−1 contralaterally; Table 3).
Mean CBF in parietal cortex from midhippocampal sections in control and MK-801–treated rats 1–5 h after hypoxia–ischemia and non-hypoxia–ischemia–exposed controls
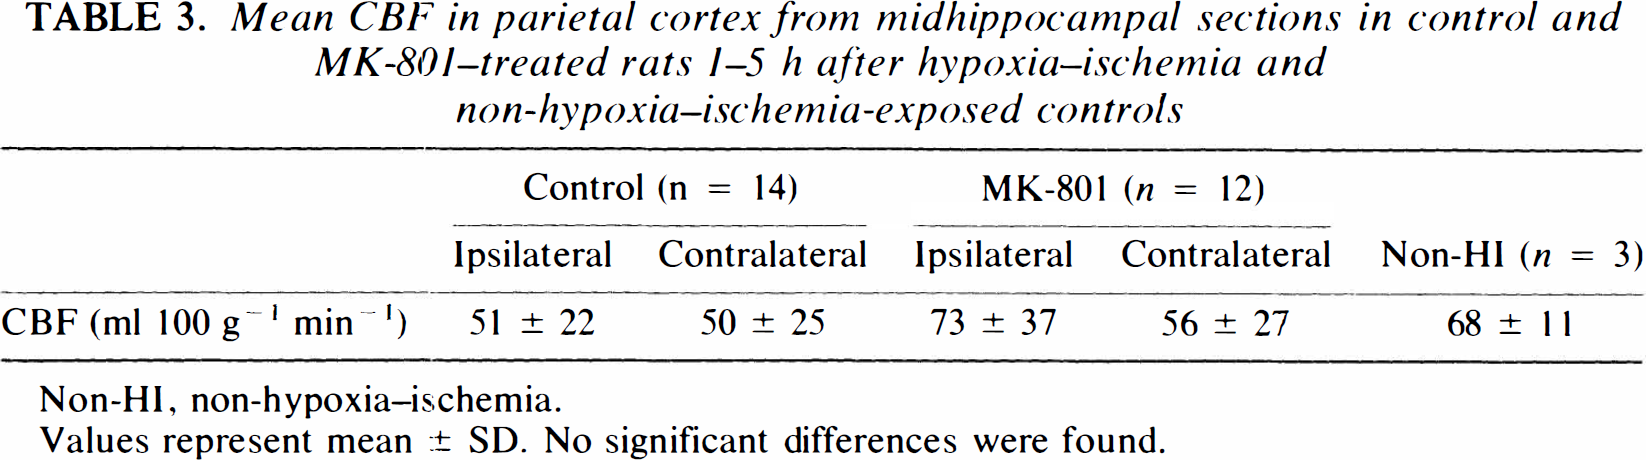
Non-HI, non-hypoxia–ischemia.
Values represent mean ± SD. No significant differences were found.
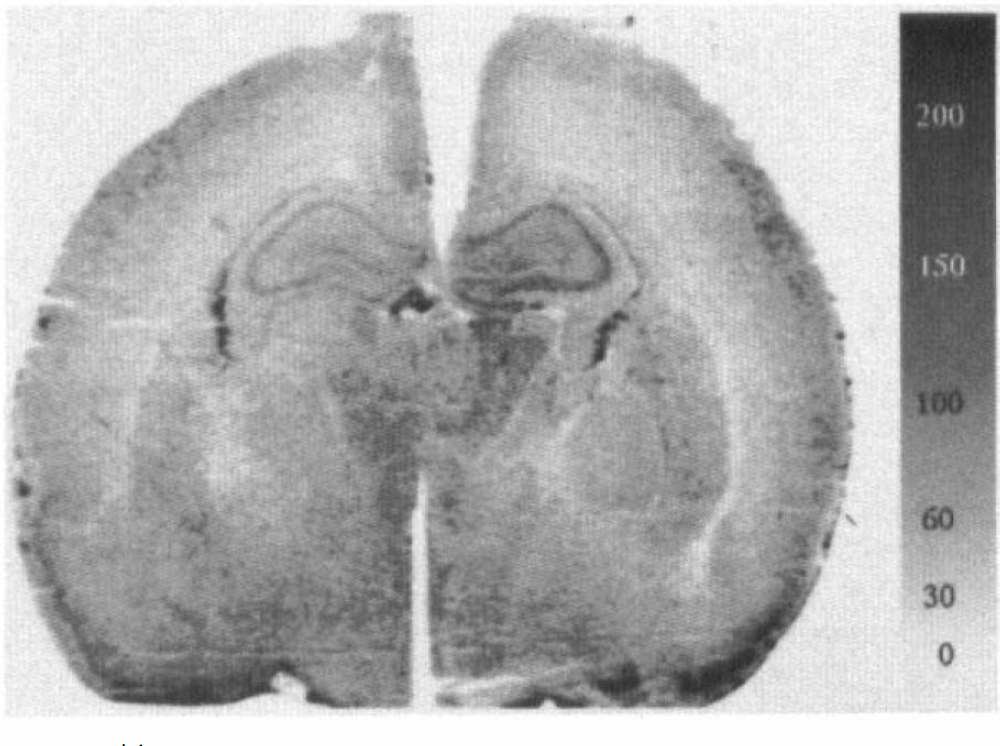
[14C]lodoantipyrine autoradiograph (calibrated in milliliters per 100 g per minute) of hippocampal section 2 h after hypoxia–ischemia.
DISCUSSION
The predominant lesions in this model of immature HI brain damage were infarction and selective neuronal necrosis in the hemisphere ipsilateral to the carotid artery occlusion, affecting, in order of decreasing frequency the posterior cerebral cortex, hippocampus, thalamus, and striatum (Rice et al., 1981; Towfighi et al., 1991; Hagberg et al., 1994). The parietal cortex, which was focused on in this study, shows neuronal damage in 92–95% of HI controls, although there is a large individual variation in the extent of damage (Rice et al., 1981; Hagberg et al., 1994).
In this study we found no difference in CBF 1–5 h after HI between ipsi- and contralateral parietal cortex (Fig. 5), neither of which differed from non-HI controls. These values agree well with earlier published results both in non-HI immature rats (Lyons et al., 1987; Nehlig et al., 1989) and in post-HI 7-day-old rats (Mujsce et al., 1990), showing complete reperfusion up to 24 h after HI.
CMRglc values calculated from autoradiographs were similar to those in calculations from pieces of brain tissue with estimated lumped constant and measured 2-DG-6-P/total 2-DG ratio (Tables 1 and 2), even though the rate constants used were calculated from data on the adult rat (Sokoloff et al., 1977). This was probably due to the time intervals used (45 and 90 min), when the influence of the rate constants is relatively minor (Mori et al., 1990). In the adult, there is a significant loss of 2-DG-6-P from the brain at 90 min (Mori et al., 1990), in the immature brain, the activities of glycolytic enzymes are ≦50% of the activities in the adult, which would make the dephosphorylation insignificant at 90 min (Vannucci et al., 1989). This is supported by the similar values of CMRglc calculated after 45 and 90 min of circulation time, after intravenous and subcutaneous injection, respectively, in this study. The values for CMRglc in the parietal cortex of non-HI controls agree well with those in earlier studies in the immature rat (Vannucci et al., 1989; Bômont et al., 1992; Nehlig and Pereirade Vasconcelos, 1993).
During HI in this model, there is a marked reduction of CBF to the ipsilateral hemisphere together with a reduction in CMRglc, depletion of high-energy reserves, and decreased NAD+/NADH ratio of the cytoplasm (Welsh et al., 1982; Vannucci et al., 1988; Vannucci et al., 1989; Ringel et al., 1991; Yager et al., 1991; Yager et al., 1992).
After HI, CMRglc values in the ipsilateral hemisphere were very heterogeneous, with hypoglucose-utilizing areas interspersed between areas with increased glucose uptake (CMRglc > 20 μmol 100 g−1 min−1) (Fig. 3; i.e., at levels well above values from non-HI controls; Table 1). This heterogeneous glucose uptake was highly reproducible and seen in all animals 1–5 h after HI (Fig. 4). The area with increased glucose utilization was markedly larger in the ipsilateral hemisphere than in the contralateral (Table 2), and the mean CMRglc value in the ipsilateral hemisphere after HI was higher than that in the contralateral hemisphere (Tables 1 and 2). Compared with non-HI controls, there was no significant increase of mean CMRglc values in the ipsilateral cortex, although large areas showed CMRglc above non-HI control levels. Compared with non-HI controls, there was a significant reduction in mean glucose utilization in the contralateral cortex (Table 1; Fig. 3). This has been shown previously and explained in terms of oxidative metabolism of lactate and ketone bodies, because it was not accompanied by any change in cerebral energy utilization, as determined from the changes in the concentrations of glucose, lactate, ATP, and phosphocreatine during 2 min after decapitation (Vannucci et al., 1994). In the same study, Vannucci et al. (1994) found normal levels of glucose uptake and decreased cerebral energy utlization in the ipsilateral hemisphere 1 h after HI, and increased glucose uptake and unaltered cerebral energy utilization 4 h after HI, when compared with those of non-HI controls. In this study, we did not see any change of mean CMRglc during 1–5 h after HI. The differences between the studies might be due to differences in brain regions sampled, severity of the insult, and time points analyzed.
Even though energy utilization in whole tissue is not increased after HI (Vannucci et al., 1994), localized areas with increased energy utilization could exist. In the immature brain, spreading depressions are difficult or impossible to elicit chemically (Bures, 1957), but burst-suppression patterns on EEG have been recorded after HI (Chen et al., 1986). This makes it unclear if the increase in CMRglc partly represents increased electrical activity in a penumbra surrounding an infarction (Astrup et al., 1981; Simon and Shiraishi, 1990; Gill et al., 1992; Mies et al., 1993). An increased electrical activity might be caused by leakage of EAA or potassium from nearby infarcted (glucose-hypoutilizing) areas (Hansen, 1985; Butcher et al., 1990), although only moderately increased levels of EAA have been measured in this model during recovery (Puka-Sundvall et al., 1995).
The combination of increased CMRglc, decreased or normal cerebral energy utilization (Vannucci et al., 1994), incomplete restitution of ATP levels, and increased lactate concentrations [which because of the high blood-brain barrier permeability for lactate in the immature brain (Cremer et al., 1979) might reflect a substantial lactate production] suggests that a significant part of the energy demand is supplied by glycolysis. This cannot be explained by low oxygen availability because the blood flow was not reduced after HI (our results and those of Mujsce et al., 1990). Instead, these data suggest an impaired oxidative/mitochondrial metabolism, which has been suggested before and might be an early, pathogenically important change during reflow after HI (Brown and Brierly, 1973; Brown, 1977; Rehncrona et al., 1979; Siesjö, 1981; Linn et al., 1987; Sims and Pulsinelli, 1987; Vannucci, 1990; Nelson and Silverstein, 1994; Vannucci et al., 1994). This post-HI energy failure due to decreased capacity of the oxidative metabolism might be further impaired by reduced glucose-transport capacity of the blood-brain barrier (Vannucci et al., 1995), which would limit the maximal substrate availability and rate of glycolysis.
The pathogenic importance of impaired oxidative metabolism is supported by positron emission tomography and magnetic resonance spectroscopy observations in children with defective mitochondrial respiration, characterized by increased CMRglc and tissue lactate concentrations in the CNS (Duncan et al., 1995). In addition, the secondary energy failure occurring in the brain after severe birth asphyxia (Roth et al., 1992) in infants appears to be preceded by enhancement of the CMRglc (Blennow et al., 1996) and increased tissue lactate levels (Groenendaal et al., 1994); all three of these biochemical events predict brain damage and a poor clinical outcome. We found that the most pronounced increases in CMRglc levels were seen in regions proximate to areas of early infarction (loss of acidophilia in routine stains and glucose hypoutilization; Fig. 3), suggesting that tissue with increased CMRgfc is at a risk of irreversible damage.
Post-HI administration of 0.5 mg/kg MK-801 decreases brain damage in the 7-day-old rat when administered after HI (Hagberg et al., 1994). In this study, this treatment reduced CMRglc bilaterally and substantially reduced the size of areas with increased CMRglc after HI. In focal ischemia in the adult rat, it is suggested that NMDA-receptor antagonists exert their protective effect by reducing the number of periinfarct depolarizations, which reduces the metabolic stress on cells in areas with reduced CBF and thereby reduced energy-producing capacity (Simon and Shiraishi, 1990; Gill et al., 1992; Mies et al., 1993). In this model, there are no areas with reduced CBF early after HI (our results and those of Mujsce et al., 1990), and it is unclear whether there is increased electrical activity after HI. It is possible that MK-801 exerts its neuroprotective effect by reducing a normal or increased (Puka-Sundvall et al., 1995) excitatory tonus and thereby reducing the metabolic demands on cells with impaired energy metabolism (see the preceding). This is supported by the fact that MK-801 reduced CMRglc bilaterally. Speculatively, reduction of energy requirements during reflow in a critical phase of metabolic impairment may enhance the possibilities of repair and recovery. Another possibility is that EAAs, through their actions on the NMDA channel with increased Ca2+ influx, free radical formation, possibly through nitric oxide (NO) synthesis and peroxynitrite formation (Beckman, 1991; Halliwell, 1992; Coyle and Puttfarcken, 1993), contribute to the damage of the mitochondrial membranes and the oxidative metabolism in a more direct way (Brown and Brierly, 1973; Brown, 1977; Rehncrona et al., 1979; Siesjö, 1981; Linn et al., 1987; Sims and Pulsinelli, 1987; Vannucci, 1990; Nelson and Silverstein, 1994; Vannucci et al., 1994). This hypothesis is further supported by the finding of increased glucose consumption by cultured neurons after NO exposure (Maiese et al., 1995).
In conclusion, there was an increase in regional CMRglc in the ipsilateral hemisphere, being very marked in (penumbral) areas surrounding infarcted tissue. These glucose-hyperutilizing areas, and CMRglc generally in the brain, were attenuated by post-HI treatment with a neuroprotective dose of the NMDA-receptor antagonist MK-801. These events and the effect of MK-801 were unrelated to changes in CBF.
Footnotes
Acknowledgment:
This work was supported by the Swedish Medical Research Council (grant no. 9455), the 1987 Foundation for Stroke Research, the Sven Jerring Foundation, the Åke Wiberg Foundation, the Åhlén Foundation, the Magnus Bergwall Foundation, the Frimurare Barnhus Foundation, the Göteborg Medical Society, Fonden för studerandet av läkarvetenskapen vid Sahlgrenska sjukhuset, the First-of-May Flower Annual Campaign, and the Medical Faculty of Göteborg, University of Göteborg. Special thanks to Carin Alminger for invaluable technical assistance.