
Abstract
Changes of neuronal excitability and γ-aminobutyric acid (GABAA)-receptor expression were studied in the surround of photothrombotic infarcts, which were produced in the sensorimotor cortex of the rat by using the rose bengal technique. In a first series of experiments, multiunit recordings were performed on anesthetized animals 2–3 mm lateral from the lesion. Mean discharge frequency was considerably higher in recordings from lesioned animals (>100 Hz in the first postlesional week) compared with control animals (mean, 15 Hz). These alterations were already present after 1 day but were most pronounced 3 to 7 days after lesion induction. Thereafter the hyperexcitability declined again, although it remained visible up to 4 months. In a second series of experiments, the GABAA-receptor expression was studied autoradiographically. This revealed a reduction of GABAA receptors in widespread brain areas ipsilateral to the lesion. The reduction was most pronounced in the first days after lesion induction and declined with longer intervals. It is concluded that cortical infarction due to photothrombosis leads to a long-lasting and widespread reduction of GABAA-receptor expression in the surround of the lesion, which is associated with an increased neuronal excitability. Such alterations may be responsible for epileptic seizures that can be observed in some patients after stroke and may contribute to neurologic deficits after stroke.
Keywords
The degree of functional impairment and recovery after a cortical stroke in the human brain often does not correlate very well with the size of the ensuing lesion (Freund, 1987). This may, on the one hand, depend on the location of the lesion, the function of the impaired cortical area, and the number and functional importance of afferent and efferent neuronal pathways interrupted. On the other hand, a stroke may also affect the function of surrounding and remote brain tissue. Special interest has been attributed to the penumbra, which has been defined as functionally impaired but still viable brain tissue (Astrup, 1981; Heiss and Graf, 1994). This tissue is in danger of undergoing delayed neuronal cell death after the onset of the infarction. Another distant process is the so-called diaschisis, which was first described by von Monakow (1914). The diaschisis is well known from investigations with positron emission tomography (von Giesen et al., 1994) and autoradiography (Ginsberg et al., 1989) with deoxyglucose, where it is displayed as reduced metabolism in distant brain areas. Functional changes in the surround of focal brain lesions have also been described (Eysel and Schmidt-Kastner, 1991; Mittmann et al., 1994). We recently found an impaired paired pulse inhibition in brain slices from neuronal tissue surrounding a cortical lesion (Domann et al., 1993). Corresponding to this, with intracellular recordings, a reduction of the conductance of γ-aminobutyric acid (GABAA) responses was found (Neumann-Haefelin et al., 1995). This indicates that the excitability in the surround of these lesions is increased. Such functional changes may contribute to the neurologic deficits after cerebral infarction, expressed for example in epileptic discharges, which occur with an incidence of 5 to 20% after cortical strokes (Kotila and Waltimo, 1992).
The aim of our study was to investigate whether and to what extent neuronal hyperexcitability can be observed in the surround of cerebral lesions. Furthermore, changes of GABAA-receptor expression as a possible cause of the neuronal hyperexcitability were investigated with quantitative receptor autoradiography.
MATERIALS AND METHODS
Induction of photothrombosis
Male Wistar rats (280–320 g) were anesthetized with halothane (1.5% during preparation and 0.8% during lesioning) and placed in a stereotaxic frame. Focal lesions were induced in the hindlimb area (HL), which adjoins the primary somatosensory area Par1 (Zilles, 1985). By using the rose bengal technique introduced by Watson et al. (1985), a lesion was induced with an optic fiber bundle (aperture: 1.5 mm) mounted on a cold light source (Schott, Mainz, Germany). For this purpose, the skin above the skull was incised, and the optic fiber bundle was placed stereotactically 4 mm posterior to the bregma and 4 mm lateral to the midline. The illumination lasted >20 min. During the first 2 min, rose bengal (Aldrich, 1.3 mg/100 g body weight) was injected intravenously. After the illumination period, the catheter was removed and the wounds sutured. This procedure results in a lesion with an average diameter of 2.82 ± 0.75 mm (means ± SD; n = 47). The lesions were restricted to the cortical tissue and did not extend into the white matter. Five hours after the induction of photothrombosis, histologic sections already showed a pronounced structural alteration with edema and destroyed neurons.
Electrophysiologic experiments in vivo
In a first series of experiments, spontaneous neuronal activity was measured in rats 7 days after lesioning and in sham-operated controls without lesions. For electrophysiologic recordings, the skull surface was exposed by incising the scalp and the masseter muscle under anesthesia (1.5% halothane). At a stereotaxically defined position 6.5 to 7 mm lateral to midline and 4 mm posterior to the bregma, a hole was drilled (2 mm i.d.). During the in vivo recordings, animals were paralyzed with d-tubocurarine (0.1 ml 4 times; 10−3 M/h) and were artificially ventilated with a mixture of N2:O2 (70:30) and 0.4% halothane via a tracheal tube. The body temperature was maintained at 37.5°C. Blood gases and ECG were continuously monitored. After we removed the dura mater, a low-impedance tungsten electrode (0.1 MΩ at 1 kHz) was placed 2 to 3 mm lateral to the lesion center. This type of electrode allows recording of responses from multiple nerve cells. Extracellular neuronal activity was recorded with a highpass filter with a cutoff frequency of 0.5 Hz. After recording, brains were frozen in liquid nitrogen for 5 min, with the electrode left in the cortex. Thereafter the brains were stored at −70°C. After dissection in a cooling chamber (–20°C), the brains were sectioned at −20°C in 20 urn coronal serial sections with a cryotome. The slices were mounted onto gelatin-coated slides, and pericarya were stained with cresyl violet. This procedure allows the identification of the registration site, visible as a little hole in the cortex caused by the registration electrode.
Action potentials were analyzed with a window discriminator by using the double noise level as threshold. Data sets were analyzed over periods of 120 s. The frequency was calculated for each interval between successive action potentials (“instantaneous mean frequency”). The firing rates were analyzed on a logarithmic time basis. Interval histograms were constructed by using a bin width of 0.1 log frequency. Electrophysiologic data are given as mean ± SD.
For evaluation of the time course of the hyperexcitability, further experiments were carried out with animals 1, 3, 5, 14, 30, 60, and 120 days after lesion induction.
Receptor autoradiography
Rat brains were frozen in isopentane at −70°C 1, 3, 5, 7, 14, and 60 days after lesion induction and kept at this temperature for further processing. The brains were coronally cut on a cryostat microtome (section thickness, 10 μm), and the sections were mounted on gelatin-coated glass slides.
The labeling procedure started with a preincubation of the mounted sections in Tris-citrate buffer (pH 7.0) for 20–30 min. The GABAA receptor was labeled with [3H]muscimol (6 nM) in 50 mM Tris-citrate buffer (pH 7.0) for 40 min at 4°C in the presence and absence of GABA (10 nM) as a competitor, followed by three washing steps with the buffer for 2 s each at 4°C (for details, see Zilles et al., 1991). After 6 weeks' exposure of the labeled sections at 4°C against Hyperfilm (Amersham), the autoradiographs were measured with an image analyzer as already described in detail (Zilles et al., 1986; Schleicher and Zilles, 1988). Alternating sections were Nissl stained and used for the anatomic identification of the lesioned and the lateral, nonlesioned neocortical regions.
The autoradiographic images were printed, and the contours of the photothrombotic lesion and the lateral neocortical area were delineated by superimposing the images of the Nissl-stained sections onto the prints in a drawing microscope. The contours of both regions were traced with a digitizer linked with the computer. Thus the prints with the contours were used as overlays for the retrieval of the gray values localized in the lesion or the lateral neocortex and stored in the computer. The gray values were transformed into receptor densities (femtomoles per milligram protein) at saturation conditions by using Eq. 1 and the gray values of the autoradiographs and of coexposed plastic standards (Amersham) with known concentrations of radioactivity.
KD is the dissociation constant (= 3.0 nM), L is the free concentration of the ligand during incubation (6 nM), Bl is the concentration of the binding sites occupied by the ligand at incubation condition (apparent receptor density in the autoradiographs), and BS is the concentration of binding sites at saturation condition (for further details, see Schleicher and Zilles, 1988; Zilles et al., 1986, 1991).
Because the nonspecific binding (incubation with tritiated muscimol plus unlabeled GAB A; see the preceding) was <5% of the total binding (incubation with tritiated muscimol) in the labeling procedure, total binding is practically equal to specific binding. For comparisons with control data from sham-operated rats, the mean GABAA receptor densities in each of the areas of the control brain were defined as 0% levels, and the relative differences between the respective regions of the control and the lesioned brain were calculated. Receptor autoradiography data are given as mean ± SD.
RESULTS
Electrophysiology in vivo
Recordings were made from the same site in control animals and in lesioned animals. The recording site was 2 to 3 mm lateral from the lesion center. This recording site, which was evaluated in histologic sections, was located in the parietal cortex (Par 1). In all penetrations, multiunit responses were recorded at a depth of 800–1,000 μm below the cortical surface (layer IV/V).
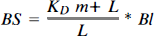
In control animals, irregular discharge patterns of the neurons were found (Fig. 1). These were interrupted by bursts of high-frequency discharges with frequencies of 280–500 Hz. These bursts usually lasted 1–30 ms, with five to 15 action potentials per burst. Action potentials within those bursts tended to be smaller than those outside. No additional systematic discharge pattern was observed in recordings from control animals.
Original multiunit recordings from brain of control animal
In recordings from animals with 7-day-old lesions, the pattern of discharges was similar. Irregular patterns of action potentials, as well as bursts, similar to those seen in control animals were observed. No new discharge pattern was found. However, in single recordings, a generally higher discharge frequency of neurons was obvious (Fig. 1B).
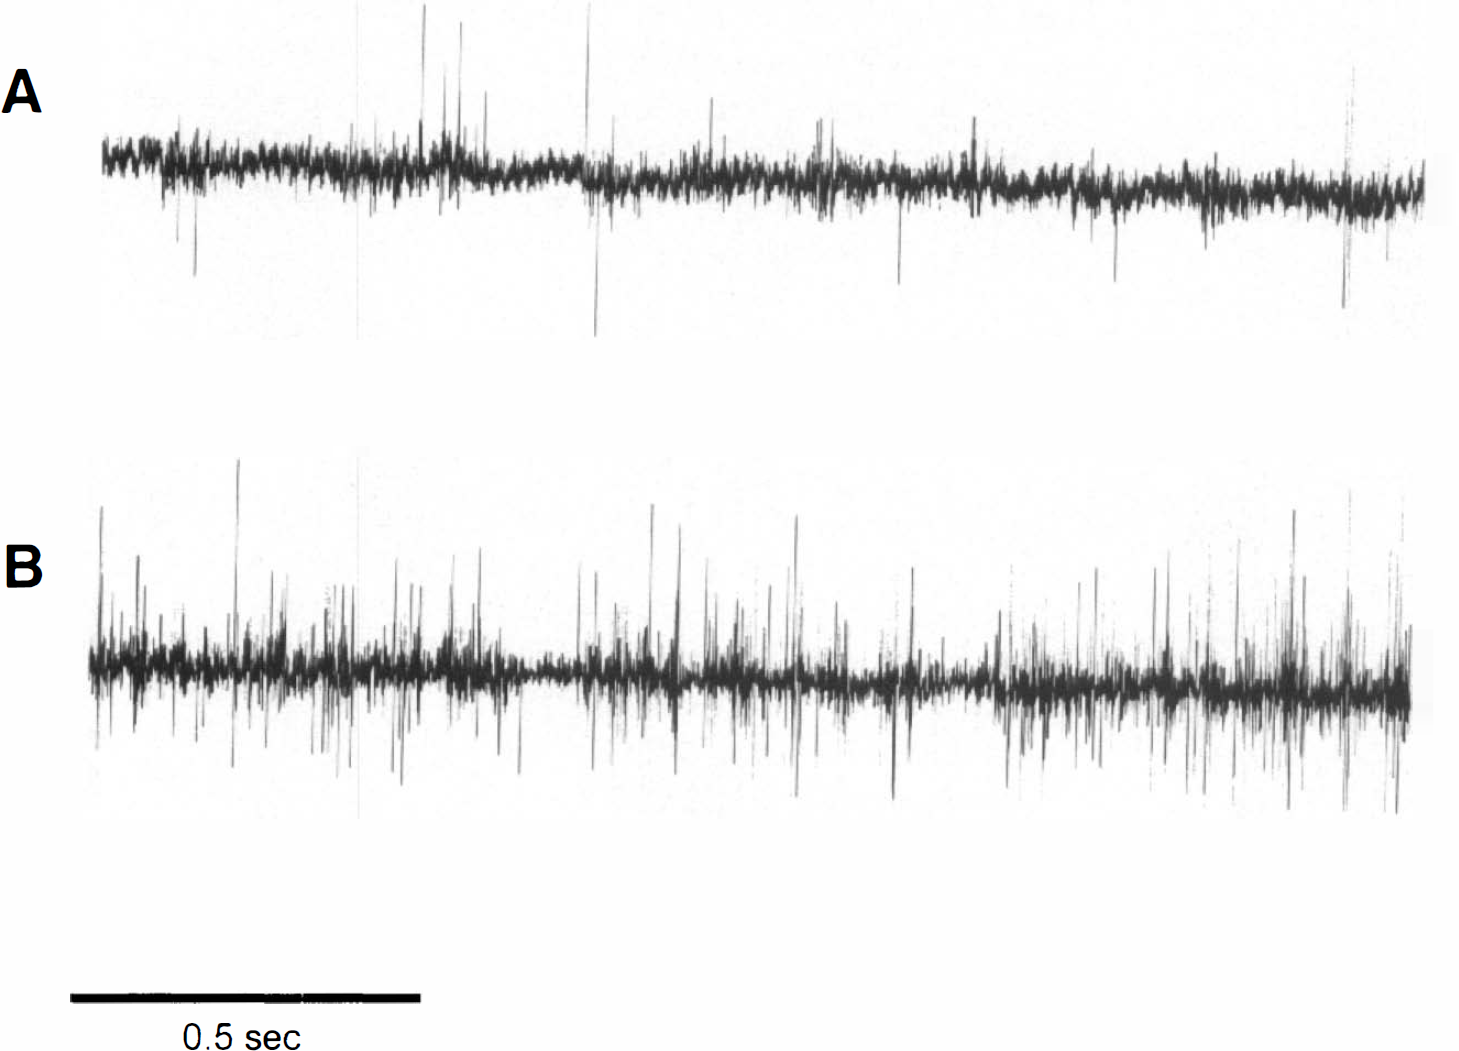
The frequency distribution of single recordings is displayed in Fig. 2. Frequency histograms showed striking differences between recordings from control (Fig. 2A) and lesioned animals (7 days after lesioning in this example; Fig. 2B). In recordings from control animals, a broad maximum in the histogram was observed at 10 to 20 Hz. In the histograms from lesioned animals, the range from 1 to 15 Hz was virtually missing. The first maximum in the histogram was shifted into the range of 50 to 200 Hz. The mean of first peak discharge frequency in the histograms was 14.8 ± 6.6 Hz (n = 9) in controls and 129.3 ± 75.4 Hz (n = 12; mean ± SD; p < 0.0001; unpaired Student's t test) in recordings from animals 7 days after lesion induction. A second maximum was obvious at 280–500 Hz in several histograms from control animals (four of nine; mean frequency of peak, 380.6 ± 90.5 Hz) corresponding to the burst discharges in single recordings. Such a second maximum was also observed in some recordings from lesioned animals, although it was often less obvious because of the generally higher discharge rates. An evaluation of single recordings revealed that the discharge rates within single high-frequency bursts (as described previously) was not significantly altered.
Distribution of discharge frequencies in multiunit recordings. Firing rates analyzed on logarithmic basis and interval histograms constructed by using a bin width of 0.1 log frequency.
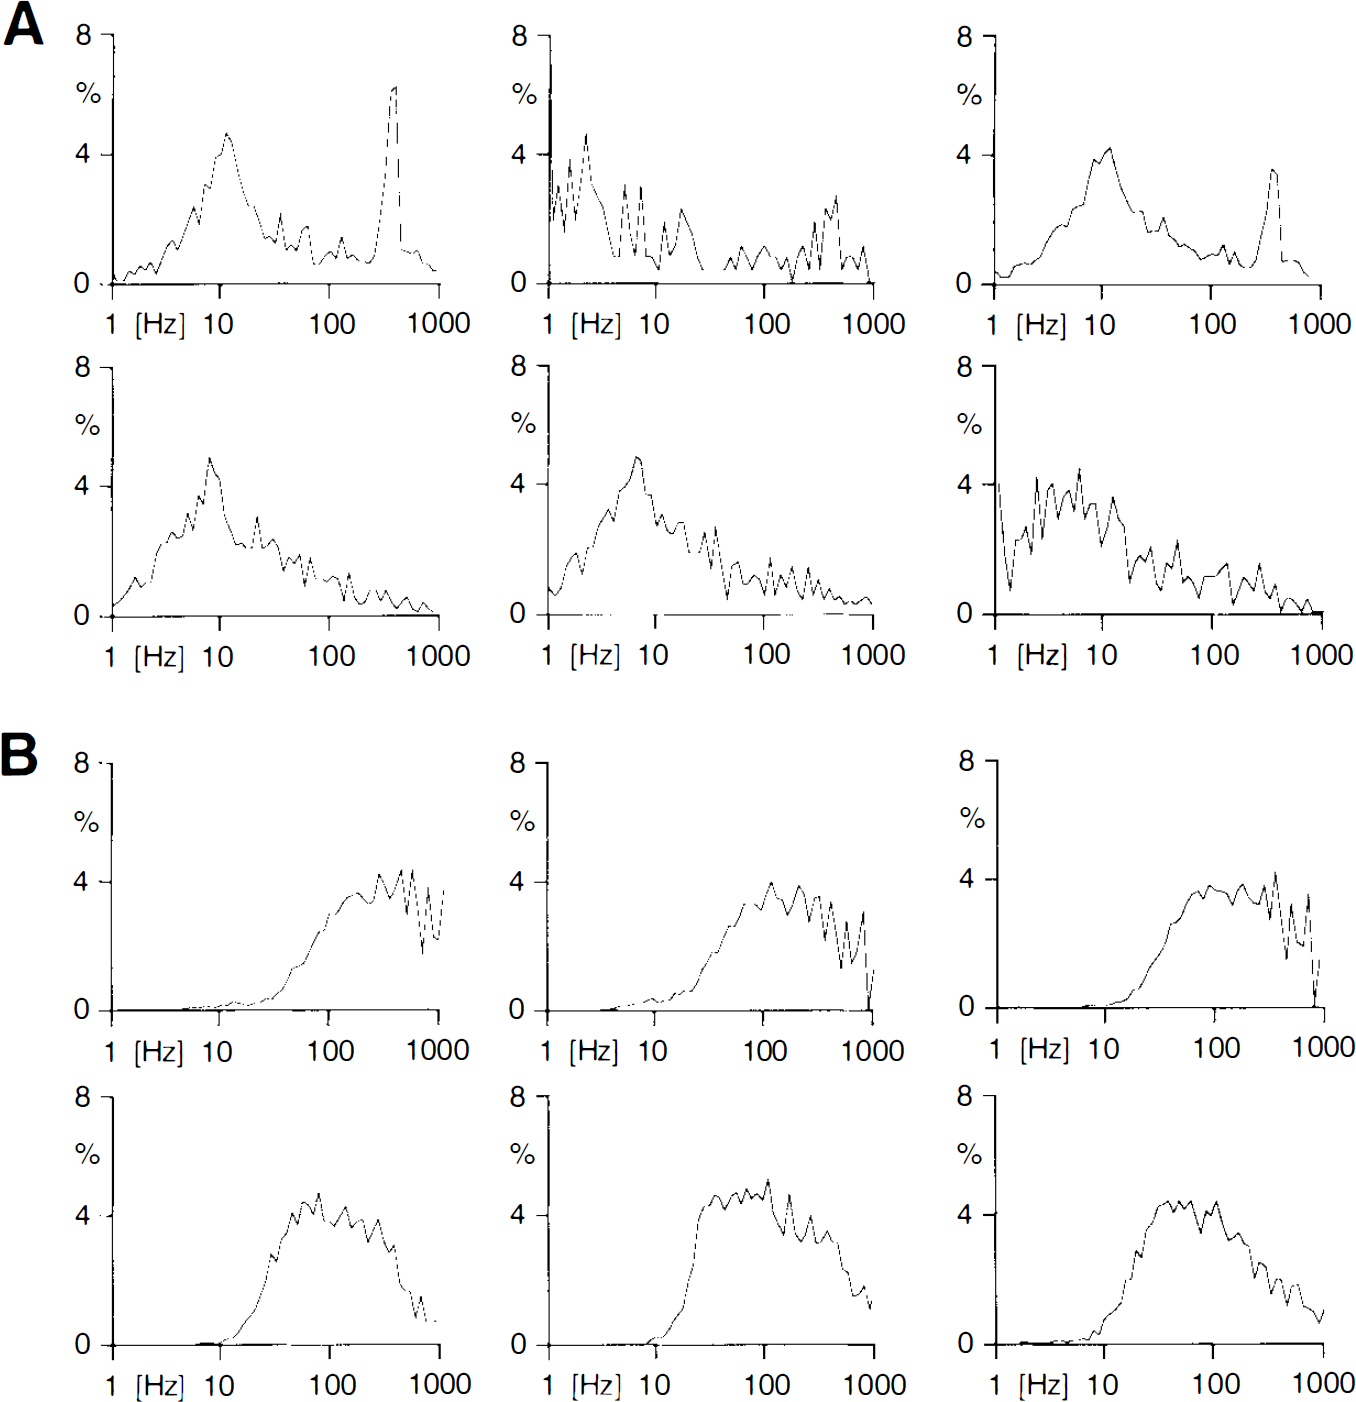
For investigation of the time course of the electrophysiologic changes in the surround of photothrombosis, recordings were made at different intervals after lesion induction. These experiments revealed that the increase in discharge rate was already visible 1 day after lesion induction, although to a lesser extent than that after 3 or 5 days. The maximum in the frequency histogram at the first postlesional day was 135.0 ± 29.7 Hz (n = 4; mean ± SD), at the third day 196.7 ± 18.9 Hz (n = 5; statistically different from the first postlesional day with p < 0.05) and 186.7 ± 31.1 Hz (n = 4) 5 days after lesion induction. After 1 month, the mean discharge ratio had declined to ∼76.7 ± 16.9 Hz (n = 5; statistically different from 5 days with p < 0.05) but was still higher than that under control conditions (different with p < 0.001). Two months after lesion induction, the mean discharge ratio had declined to ∼40.1 ± 9.1 Hz (n = 4), and 4 months after lesioning, a maximum ∼10 Hz (9.8 ± 7.23 Hz; n = 5; not significantly different from controls) became visible again as in control animals, although the overall distribution of discharge rates remained biased toward higher frequencies (Fig. 3).
Grand averages of distribution of discharge frequencies in multiunit recordings from control and lesioned animals at different times after lesion induction. The maximum of firing rates shifted from ∼15 Hz in controls to higher frequencies of >100 Hz in lesioned animals. Note that this increase in discharge frequency was already visible on day 1 but increased toward day 3 and 5. There was a partial recovery 1, 2, and 3 months after lesion induction although the histograms remained different from those obtained in control animals. The histograms from control and lesioned animals showed a second maximum ∼300–500 Hz, which shifted only slightly to higher frequencies 3 and 5 days after lesion induction. Error bars show standard deviations.
Receptor autoradiography
As one possible cause of the electrophysiologic alterations, changes of GABAA receptor density were measured. For this purpose, quantitative receptor autoradiography was carried out. The photothrombotic lesion could be recognized at all postlesional stages in both the histologic sections and the autoradiographs. The lesions reached from the pial surface to the cortex/white matter border, with a rather constant diameter of ∼2.82 ± 0.75 mm (n = 47; mean ± SD). After an initial edema in the center of the lesion, the neurons degenerated and disappeared completely after postlesional day 10. The rim of the lesion could be clearly delineated from the surrounding cortex by its very high cell density. The laterally adjoining neocortex did not show any pathologic changes in the Nissl-stained sections.
The changes of GABAA-receptor densities in the photothrombotic lesion differed from those in the laterally adjoining neocortex. In the first week, the density of GABAA receptors in the center of the lesion was increased above control levels (2,058 ± 208 fmol/mg protein; n = 5; mean ± SD) to 2,551 ± 665 fmol/mg protein (n = 8). After the first week, the receptor density within the lesion progressively declined. In the ninth week, only 26% (528 ± 352 fmol/mg protein; n = 3) of the GABAA receptors observed in controls were found in the center of the lesion (different from control with p < 0.001; cf. Fig. 5).
In the neocortex laterally adjoining the lesion, the GABAA receptors were reduced (Figs. 4 and 5). This reduction was very pronounced in the first week after lesion induction, with a reduction to ∼67% (1,378 ± 85 fmol/mg protein; n = 8) of normal values (significantly different from control with p < 0.001). Thereafter the receptor density only slightly recovered.
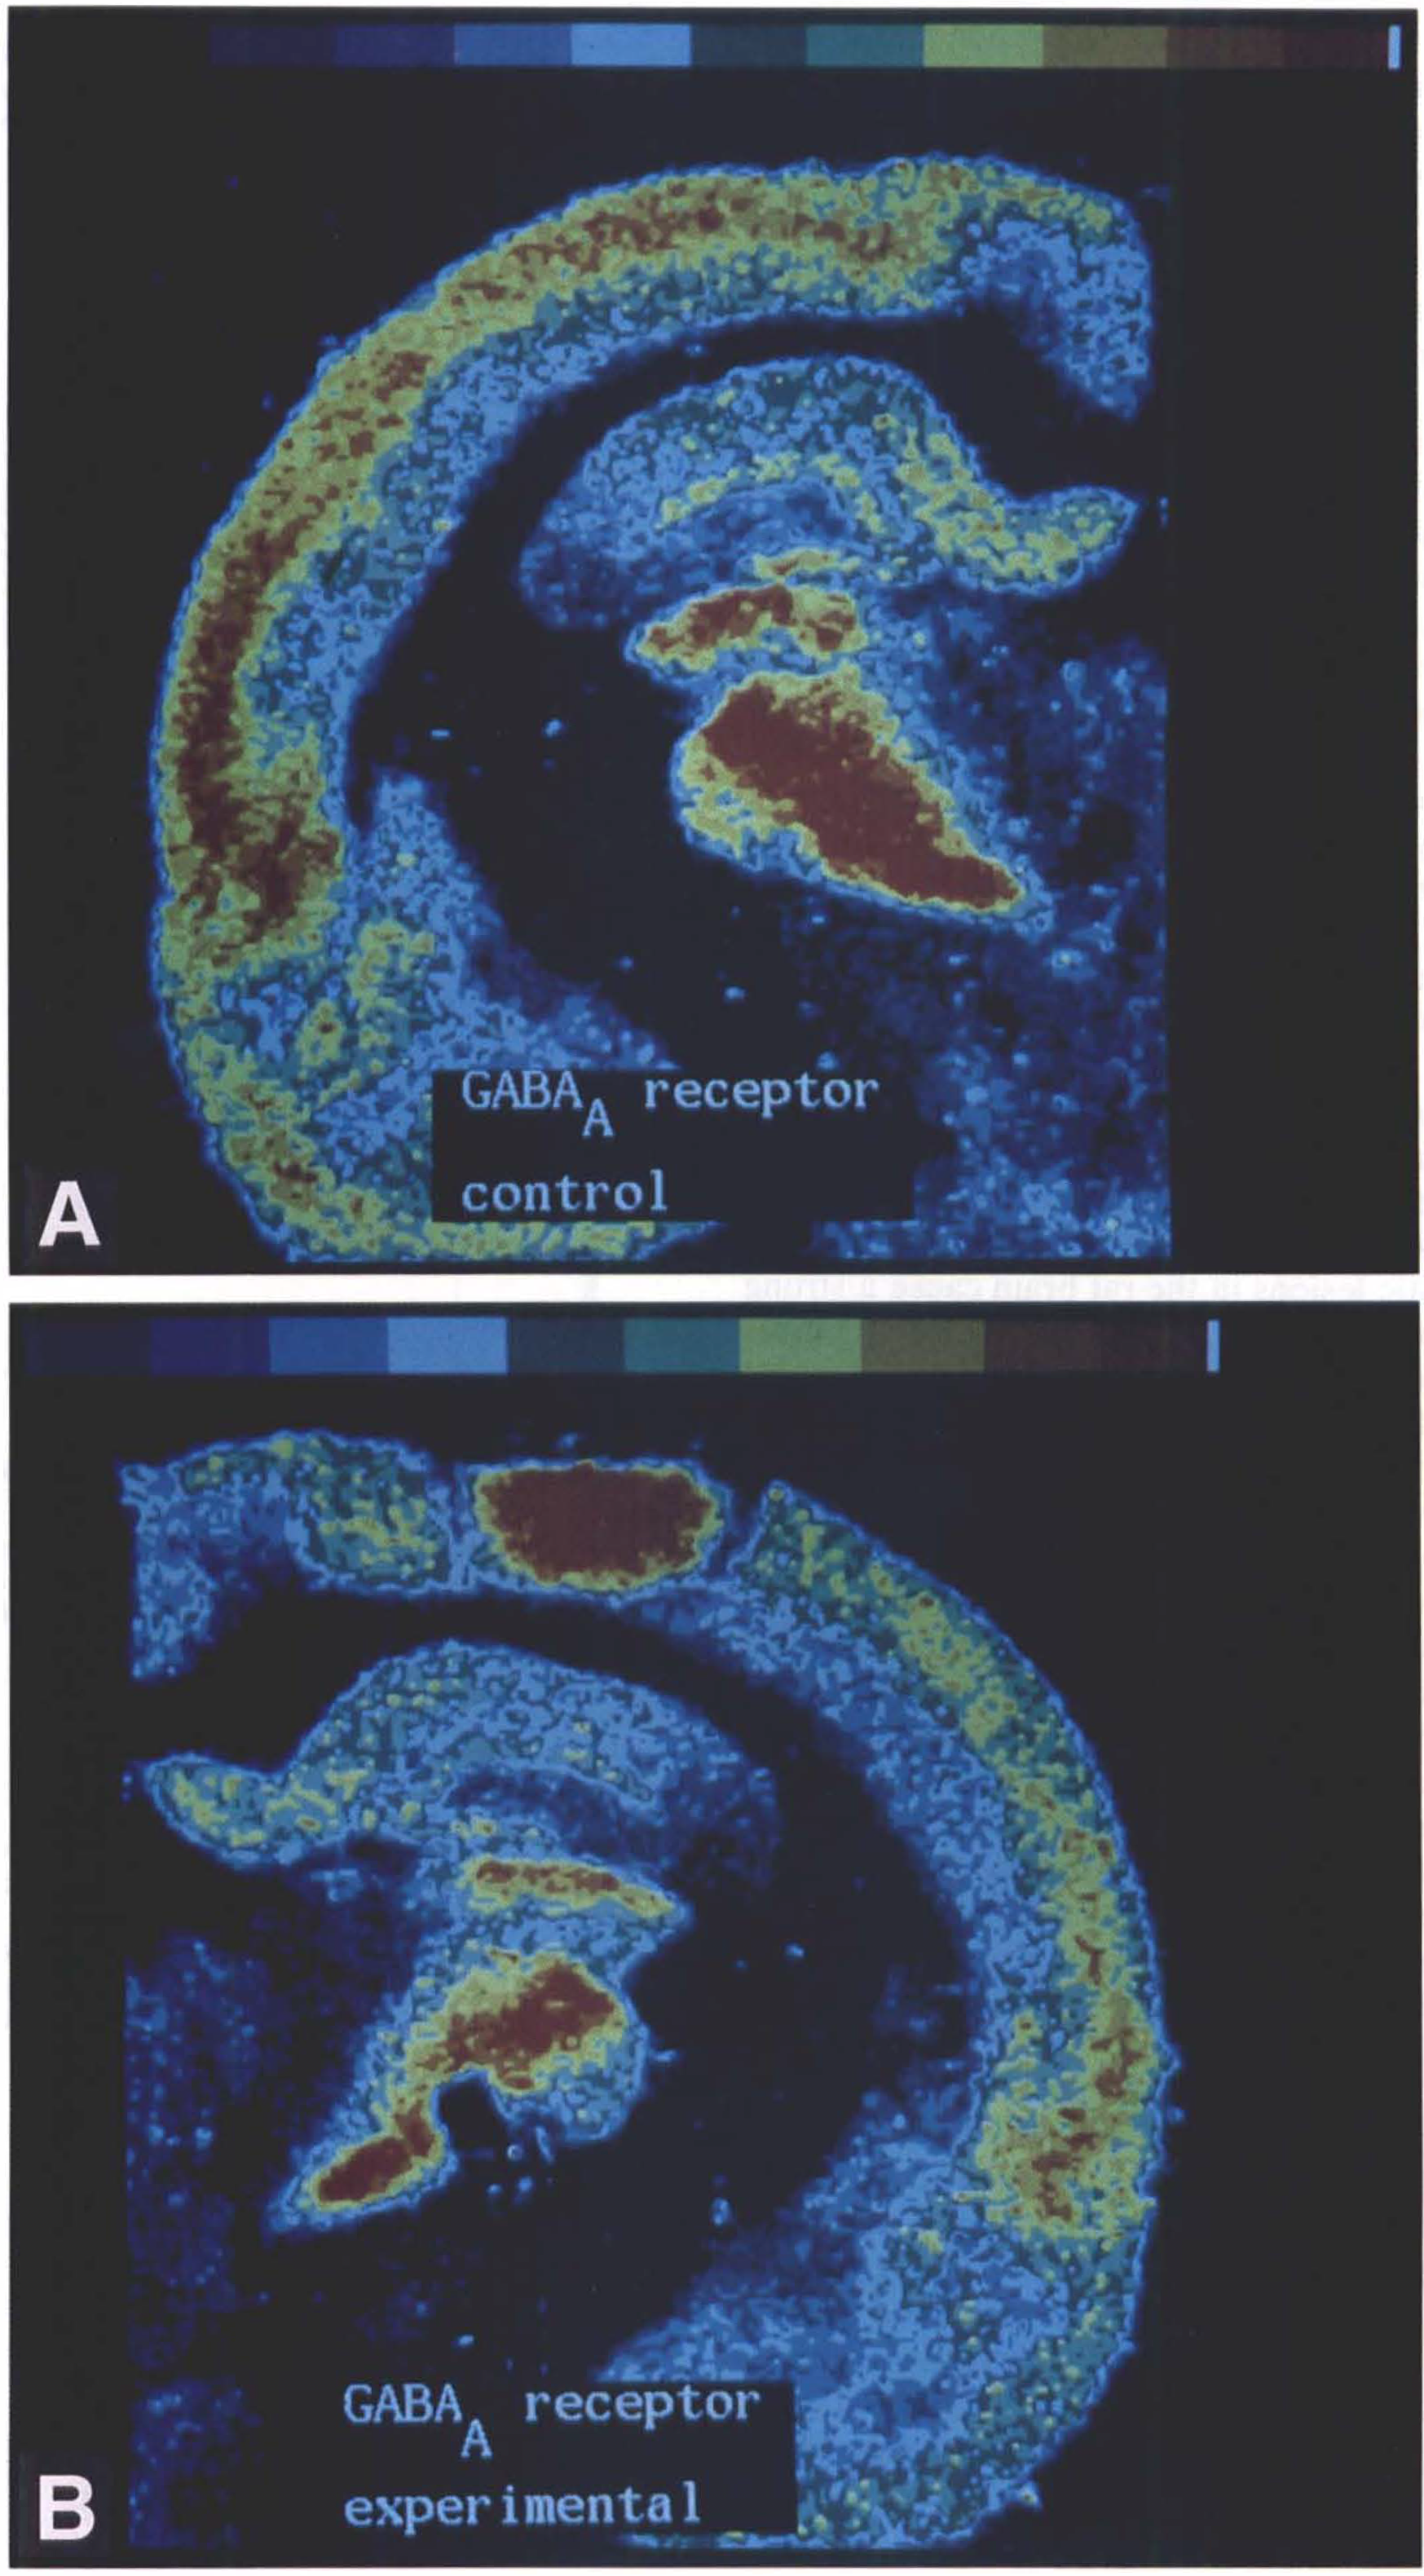
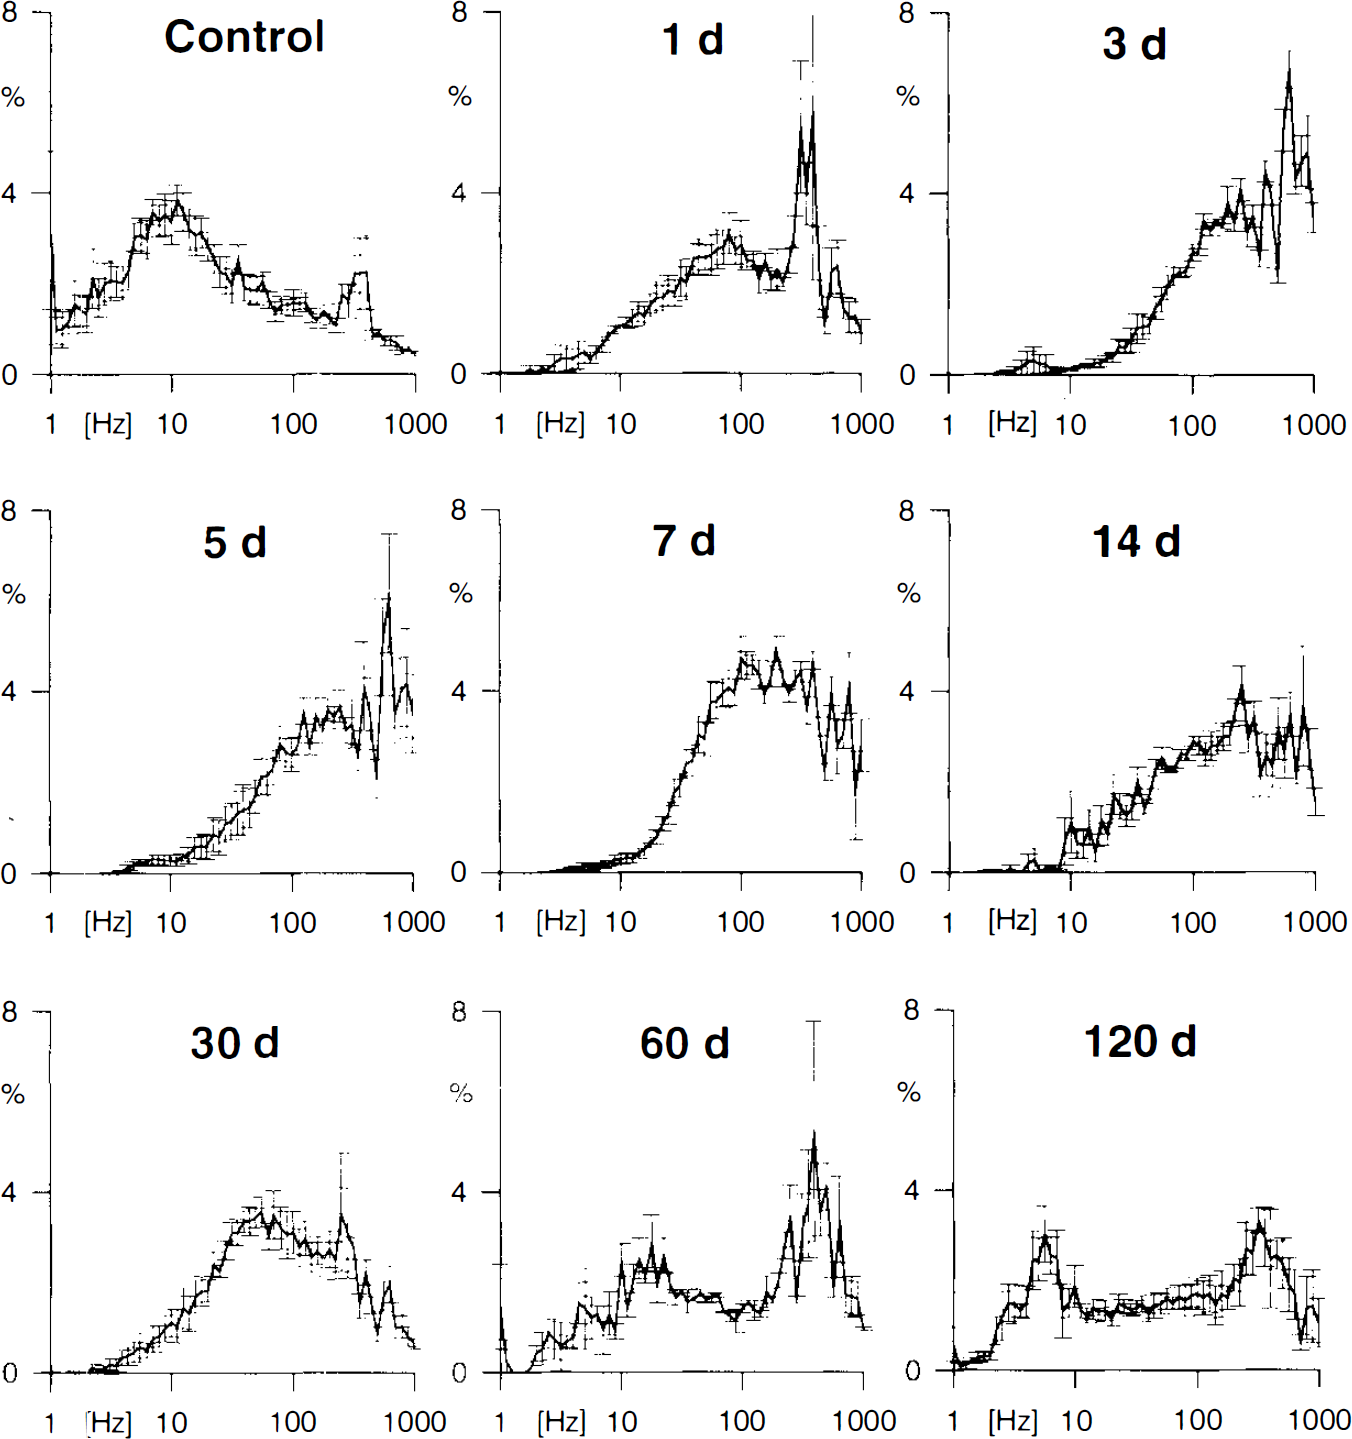
GABAA-receptor densities in control
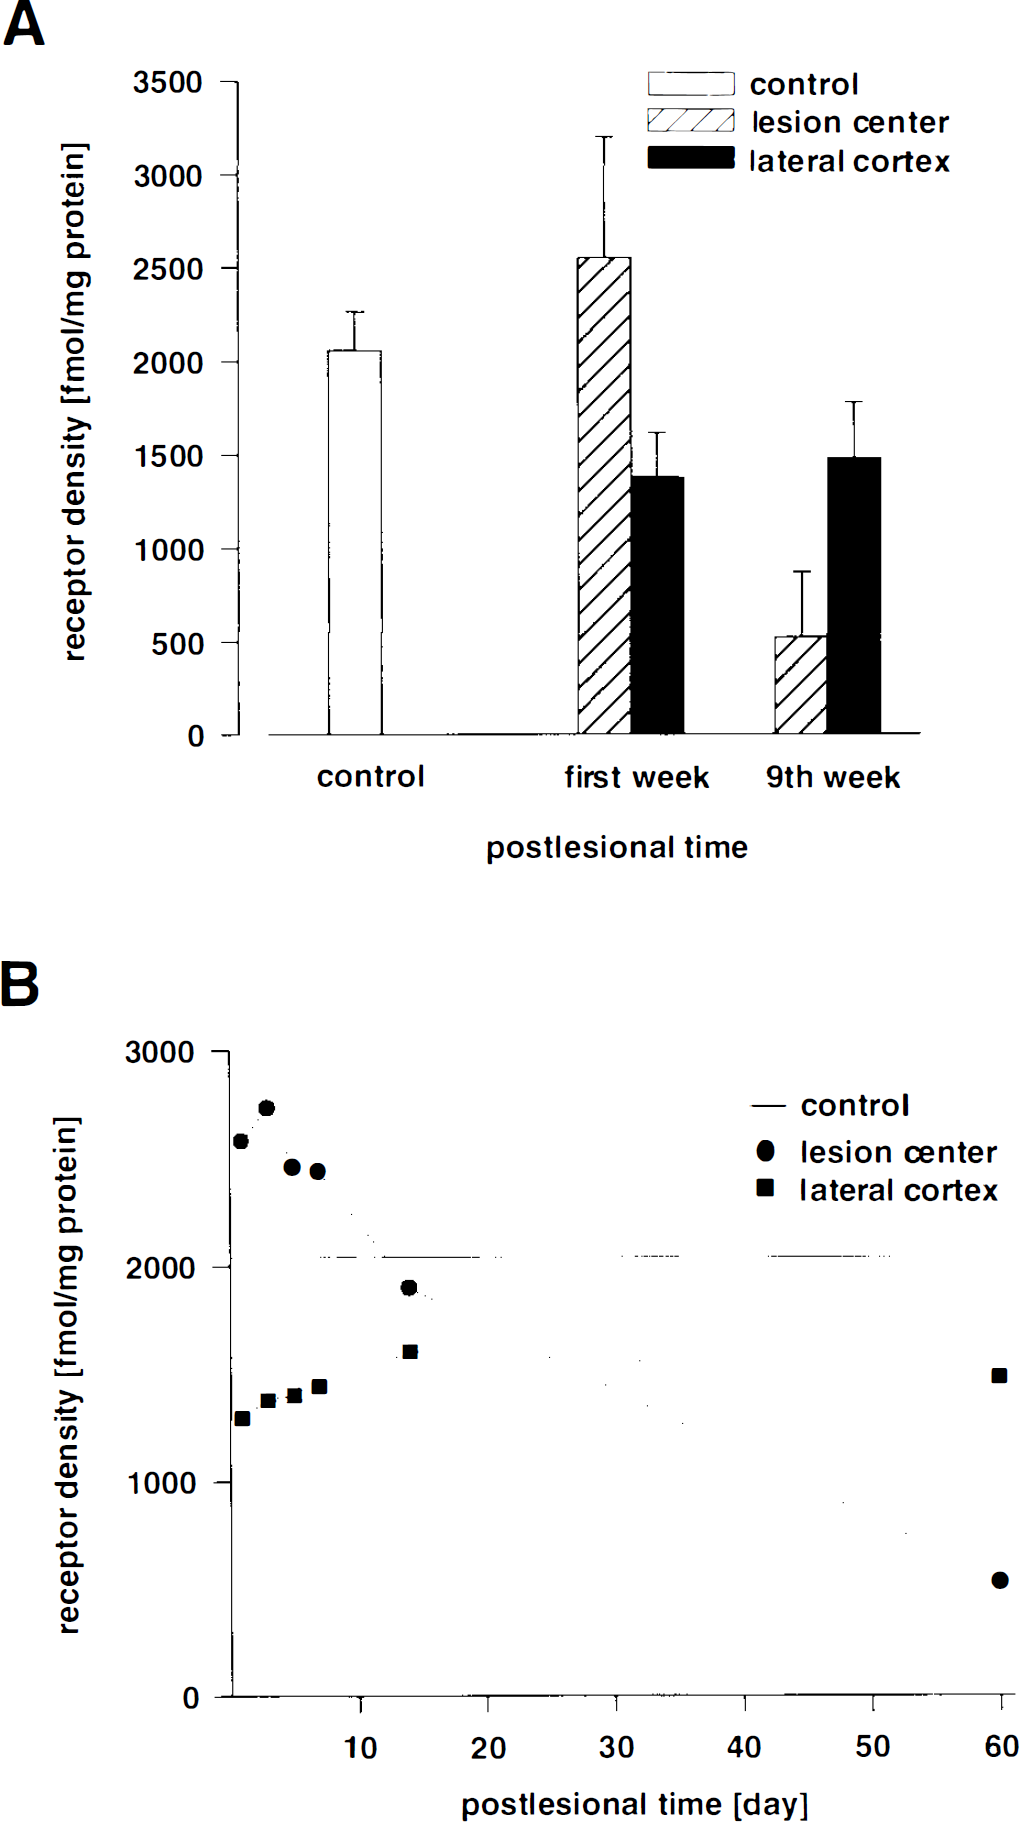
Nine weeks after lesion induction, the GABAA receptor density lateral to the lesion was 72% of control values (1,481 ± 176 fmol/mg protein; n = 3; cf. Fig. 5).
DISCUSSION
These experiments show that there is an increased activity of neurons in the surround of photochemically induced cortical infarctions. These functional alterations were in brain areas that did not show any structural alterations. In accordance with the electrophysiologic changes, a reduction of GABAA-receptor expression was found, which explains at least partially the increase in excitability and the increased firing rates of the neurons.
The GABA-receptor studies showed that the alterations of receptor expression comprised wide parts of the ipsilateral hemisphere. This is in accordance with previous studies from brain slices, which showed a decreased double-pulse inhibition after stimulation. The decrease in double-pulse inhibition was present from the first day after lesion induction and persisted for ≥30 days, and it extended ≥4 mm laterally from the lesion at the border between the HL and the primary somatosensory cortex (Domann et al., 1993). No increase in spontaneous activity of the neurons was found in the experiments on brain slices, suggesting that neurons in the slices are considerably dysfacilitated.
Several processes could contribute to the functional alterations and alterations of receptor density demonstrated in our experiments:
The extent of these functional changes exceeds the extent of lateral inhibitions, which are mediated intracortically through GABAergic interneurons (Somogyi et al., 1983; Matzsubara et al., 1987). However, connections either directly from the site of the lesion or via (intracortically) the basal ganglia or the thalamus may be involved in the re-auction of GABAA-receptor expression and the associated hyperexcitability.
Alternatively, SDs, which are induced during induction of the lesion, might cause such changes of receptor expression. It has been shown in several studies that induction of the cortical lesion causes SDs that travel across the ipsilateral cortex in the hours after induction of photothrombosis (Dietrich et al., 1994; Schroeter et al., 1995). These are associated with strong intracellular increases of sodium and potassium in both neurons and glial cells, cause an activation of glial cells as manifested by an increased labeling for glial fibrillary acidic protein (GFAP; Kraig et al., 1991; Schroeter et al., 1995), and induce the expression of immediate early genes (Gass et al., 1992). It is conceivable that such spreading depressions also cause persistent alterations of GABAA-receptor expression and neuronal excitability. However, recent experiments on brain slices from animals treated with MK-801 after induction of the lesion for prevention of SDs suggest that they are not responsible for the neuronal hyperexcitability (Buchkremer-Ratzmann and Witte, 1995).
Finally, it has recently been shown that glutamate, as well as GABAA-receptor gene expression, can be altered by epileptic activity (Friedman et al., 1994). Dietrich et al. (1986) wrote that photothrombotic lesions in the rat brain cause a strong hypermetabolism in a small rim surrounding the lesions, which could correspond to epileptic neuronal activity (cf. Bruehl and Witte, 1995). Therefore, it is also conceivable that the photothrombosis induces epileptic activity in the immediate vicinity, which by its connections causes changes of receptor expression in the surround of the lesion. A hyperactivity of neurons in the immediate vicinity of a heat lesion was described by Eysel and Schmidt-Kastner (1991). Mittmann et al. (1994) described a lesion-induced transient hyperactivity and suppressed inhibition in areas surrounding cerebral infarction induced by heat lesion, suggesting that the functional changes observed in our experiments are not restricted to the photothrombosis model.
The animals investigated did not display overt seizures. The spontaneous firing pattern of the neurons was not changed, although the overall firing rates increased. Both control recordings and recordings from lesioned animals showed bursts of high-frequency discharges, which may represent the activity of interneurons or so-called fast-spike units (McCormick et al., 1985; Connors and Gutnik, 1990). In contrast to the tonic increase of firing rate, the characteristic feature of epileptic discharges is the appearance of so-called paroxysmal depolarization shifts (Matsumoto and Ajmone-Marsan, 1964a,b; Westerhoff et al., 1995; Witte, 1995). Synchronization of multiple neurons obviously plays a key role in producing epileptic discharges. This raises the possibility that, within the brain tissue surrounding focal photothrombosis, neurons rarely show epileptiform discharges in spite of their increased excitability, because for unknown reasons, the neurons are not well enough synchronized.
As expected, within the lesion, the GABAA receptors finally disappeared. However, the receptor density initially increased (cf. Fig. 5). As shown in control experiments, the [3H] muscimol binding was specific. With antibodies against the microtubule-associated protein MAPII (unpublished observations), we could show that neurons disappeared completely within the first days after lesion induction. The photothrombosis is associated with an invasion of macrophages into the lesion. These cannot, however, be the reason for the increase of GAB A receptors; macrophages are not yet present within the lesion at 1 day, but start invading the core of the lesion as late as 7 days after lesion induction (Watson et al., 1985; Jander et al., 1995). Therefore, the receptors that can be seen within the lesion are either upregulated in transiently surviving neurons and glial cells or represent transiently surviving binding sites of degenerating cells. Because the remains of cortical tissue are condensed in the lesion center after the initial edema, the transiently high density of binding sites may also be caused by this condensation process.
The functional significance of the changes in neuronal excitability and GABAA- receptor density shown in this study is not yet known. However, such functional alterations could contribute to the resulting neurologic deficit after cortical lesions and stroke. Such an increased excitability may also underlie the occurrence of epileptic seizures, which are observed in 5 to 20% of patients after cortical stroke (Jennett, 1975; Kotila and Waltimo, 1992). It is furthermore conceivable that a reduced inhibition in the surround of the lesion favors plasticity and the rearrangement of function in perilesional brain areas.
Footnotes
Acknowledgment:
The investigations were supported by DFG Wi 830 6–3, SFB 194 A6 and B2.