
Abstract
Water-suppressed chemical shift magnetic resonance imaging was used to detect neurochemical alterations in vivo in neurotoxin-induced rat models of Huntington's and Parkinson's disease. The toxins were: N-methyl-4-phenylpyridinium (MPP+), aminooxyacetic acid (AOAA), 3-nitropropionic acid (3-NP), malonate, and azide. Local or systemic injection of these compounds caused secondary excitotoxic lesions by selective inhibition of mitochondrial respiration that gave rise to elevated lactate concentrations in the striatum. In addition, decreased N-acetylaspartate (NAA) concentrations were noted at the lesion site over time. Measurements of lactate washout kinetics demonstrated that t1/2 followed the order: 3-NP ≈ MPP+ » AOAA ≈ malonate, which parallels the expected lifetimes of the neurotoxins based on their mechanisms of action. Further increases in lactate were also caused by intravenous infusion of glucose. At least part of the excitotoxicity is mediated through indirect glutamate pathways because lactate production and lesion size were diminished using unilateral decortectomies (blockade of glutamatergic input) or glutamate antagonists (MK-801). Lesion size and lactate were also diminished by energy repletion with ubiquinone and nicotinamide. Lactate measurements determined by magnetic resonance agreed with biochemical measurements made using freeze clamp techniques. Lesion size as measured with MR, although larger by 30%, agreed well with lesion size determined histologically. These experiments provide evidence for impairment of intracellular energy metabolism leading to indirect excitotoxicity for all the compounds mentioned before and demonstrate the feasibility of small-volume metabolite imaging for in vivo neurochemical analysis.
The biochemical etiology of both Parkinson's and Huntington's disease is unknown. However, several valuable clues have been suggested by neurotoxin models that mimic various neurochemical and histological changes seen in the human neurodegenerative illnesses. These models involve the deliberate (in the case of animals) or accidental (in the case of humans) use of mitochondrial toxins that are potent blockers of various stages in the electron transport chain. A working hypothesis of these models is that a defect in oxidative phosphorylation will lead to secondary excitotoxic neuronal degeneration as a result of decreased ATP levels and energy depletion. This leads to a cascade of events that results in both intracellular and intramitochondrial calcium influx with its attendant toxic sequelae, as well as impaired uptake of glutamate in glial cells leading to further excitotoxicity (Novelli et al., 1988; Blass et al., 1988; Zeevalk and Nicklas, 1991; Beal, 1992; Beal et al., 1993a). This mechanism may play a role in Parkinson's disease (PD), which has been modeled using 1-methyl-4-phenyl-1,2,3,6-tetrahydropyridine (MPTP). MPTP produces parkinsonian symptoms in both nonhuman primates, and in humans who had inadvertently injected it (Davis et al., 1979; Langsten et al., 1983). MPTP is converted by monoamine oxidase-B to MPP+ (N-methyl-4-phenylpyridinium) that blocks complex I of the mitochondrial electron transport chain (Furtado and Mazurek, 1991; Tipton and Singer, 1993). We have also found that aminooxyacetic acid (AOAA), an inhibitor of the malate–aspartate shuttle, can produce lesions with a striking sparing of NADPH-diaphorase neurons, similar to Huntington's disease (HD) (Beal et al., 1991). Another mitochondrial toxin is 3-nitropropionic acid (3-NP), which causes putaminal necrosis accompanied by dystonia and chorea when accidentally ingested in humans (Ludolph et al., 1991). It is a suicide inhibitor of succinate dehydrogenase (complex II) in the electron transport chain, and in vivo can produce degeneration of the caudate and putamen (Hamilton and Gould, 1987a; Hamilton and Gould, 1987b). 3-NP and malonate, another complex II inhibitor, may become a valuable model for Huntington's disease. Sodium azide, a cytochrome oxidase (complex IV) inhibitor, also produces basal ganglia degeneration in primates and rodents after systemic administration (Mettler, 1972; Miyoshi, 1967). A schematic for the role of these toxins in the mitochondrial electron transport chain is shown in Fig. 1.
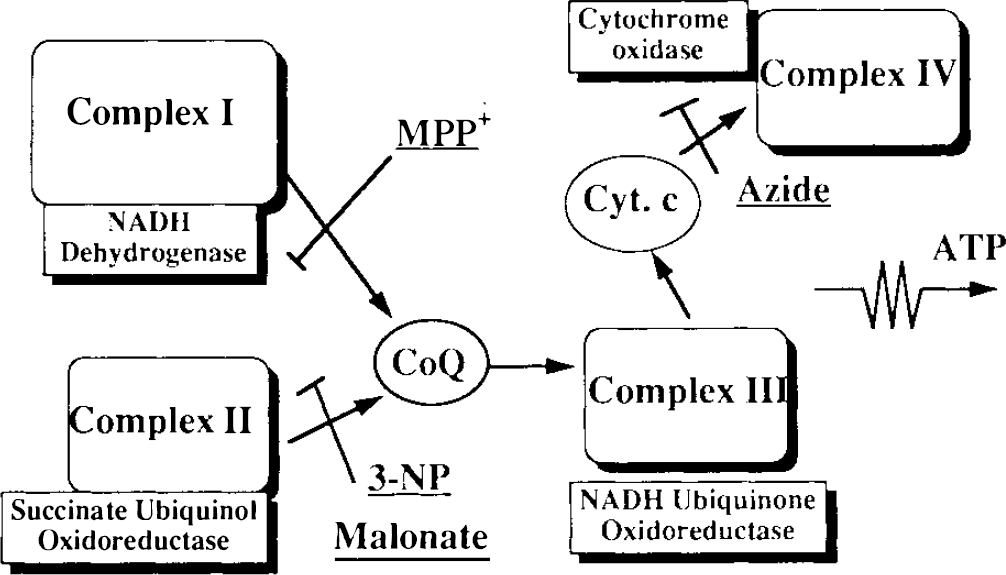
A schematic for the electron transport chain, showing the sites blocked by the various mitochondrial poisons used in this study.
One key step in testing the hypothesis that energy impairment can lead to secondary excitotoxic lesions, and identifying the mechanisms of action of these excitotoxins is to find out whether or not they lead to alterations in energy metabolism in vivo. One measure of altered metabolic states is the buildup of cerebral lactate, because its presence is evidence of impairment of oxidative phosphorylation. Detection of lactate in vivo by nuclear magnetic resonance (NMR) has been of great interest for many years (Behar et al., 1983; Arus et al., 1985; Prichard and Shulman, 1986; Gadian et al., 1987; Hanstock et al., 1988; Prichard, 1991). Furthermore, there are many other chemicals detectable by 1H NMR in the brain besides lactate, such as N-acetylaspartate (NAA), glutamate, glucose, creatine, and choline, and these may serve as useful markers for other cerebral conditions (Barrere et al., 1990; Ross, 1991; Behar and Ogino, 1991; Kauppinen, 1992). NAA in particular may serve as a useful marker for lesion progression over time in these animal models due to its nearly exclusive presence in neurons (Birken and Oldendorf, 1989; Urejnak et al., 1993).
In this communication we present the application of water-suppressed chemical shift imaging (CSI) experiments to the analysis of several animal models of human neurodegenerative diseases. Our goals were (a) to demonstrate that energy impairment can lead to focal lactate buildup and subsequent neuronal degeneration, (b) to show that indirect glutamate-mediated excitotoxicity is a common pathway for neuronal death after energy impairment using blockade of both glutamate receptors (via MK-801) and blockade of glutamatergic input to the striatum from cortex via hemidecortectomies, and (c) to show that energy repletion using boosters of mitochondrial energy metabolism may be a rational therapy for these animal models, and by implication, neurodegenerative illness.
CSI offers powerful advantages over traditional biochemical techniques for following lesion progression and amelioration over time due to the ability to use each animal, in vivo, as its own control. These studies should contribute to understanding the biochemical etiology of diseases such as PD and HD and, in addition, demonstrate the utility of small-volume metabolite imaging for in vivo neurochemical analysis.
MATERIALS AND METHODS
Animals
Male Sprague-Dawley rats were anesthetized with inhalational methoxyflurane, and immobilized in a stereotactic frame. The skulls were exposed and burr holes were created with a dental drill at bregma 2.6 mm to the left of the sagittal suture. Injections into the left striata were made at a depth of 4.5–5.0 mm from the dura, at a rate of 1 μl/min with a 2-min postinjection dwell time. N-methyl-4-phenylpyridium (MPP+) was injected as 60 nmol in 1 μl of 0.1 M phosphate buffer, pH 7.4. AOAA was injected as 3.75 nmol in 1.5 μl (adjusted to pH 7.4). Sodium acetate at the same concentration and pH served as a control. 3-NP was injected as 500 nmol in 1 μl. Malonate was injected as 3 nmol in 1.5 μl. Systemic injections of 3-NP or azide were delivered via an Alzet pump (Palo Alto, CA, U.S.A.) at doses of 15–45 mg/kg/day for variable periods up to 2 weeks. Anesthesia during the MR experiments was maintained by ventilation with a halo-thane/N2O/O2 mixture (1.0% halothane). Animals were maintained at body temperature in the magnet by use of a temperature-regulated circulating water blanket kept at 38°C, placed over the animal's body.
MK-801 ([(+)-5-methyl-10,11-dihydro-5H-dibenzo-[a,d]cyclohepten-5,10-imine maleate), an N-methyl-D-aspartate (NMDA) antagonist, was injected at the doses stated in text. Coenzyme Q10 (ubiquinone, CoQ) was administered orally by mixing crushed tables into rat chow for 10 days before lesioning at the doses stated in the text. Nicotinamide was injected intraperitoneally at the stated doses.
NMR measurements
In vivo imaging experiments were conducted with a GE Omega CSI 4.7 T machine using a home-built bird-cage coil. The following experiment was performed:

where the refocusing pulse is a modified binomial water suppression pulse, and the preparation period consists of a nonselective Levitt/Ernst-type composite inversion pulse (short T inversion recovery) followed a variable delay, [inversion time (TI)], optimized to give maximal fat and lipid suppression (Jenkins et al., 1991). TI was changed during the averaging by incrementation between 190 and 220 ms to correct for variable lipid T1s around the volume of the slice. This method produced an improvement over a single TI value by ∼15%. This technique, combined with the long echo time and the volume coil, as opposed to a surface coil, yielded lipid suppression in the brain region into the noise level while providing uniform metabolite signal-to-noise ratio (SNR) around the entire brain at some expense to the total SNR one might obtain with a surface coil (Fernandez et al., 1992). Phase encoding was performed in two dimensions to yield a three-dimensional data set (x, y, ω). The entire echo was collected using a repetition time (TR) of 2.2 s and echo time (TE) of 272 ms, eight averages, and the field of view was either 35 or 50 mm with 16 × 16 phase-encoding steps and a 7-mm slice thickness. These parameters correspond to voxels between ∼40 and 100 μl and imaging times of 1.2 h. Signal data were then subjected to three-dimensional Fourier transforms after multiplication with a trapezoidal function followed by zero filling. Spatial maps were generated by summing together the planes defined by the resonance linewidth in the three-dimensional data set to produce spatial maps. T2, proton-density (p), and diffusion-weighted imaging were performed using TR/TE = 3,200/80, 10 ms for T2 and ρ respectively, and TR/TE = 2,200/55 ms for diffusion images with isotropic x, y, z gradients of 3 G/cm and S = 15 ms and Δ = 40 ms.
Freeze clamp lactate and lesion size measurements
Freeze clamp determinations of lactate concentrations were made using the method of Schon (Schon, 1965) as reported earlier (Storey et al., 1992; Brouillet et al., 1993). For lesion size measurements brains were quickly removed and placed in ice cold 0.9% saline solution. Brains were sectioned at 2-mm intervals in a brain mold. Slices were placed in 2% 2,3,5-triphenyltetrazolium chloride monohydrate (TTC) solution, stained in the dark for 30 min, and then removed and placed in 4% paraformaldehyde at pH 7.3. Lesions were evaluated using a Bioquant IV system.
Lactate concentration estimates
Lactate SNR for the NMR data were measured in magnitude images. Lactate was measured using a region of interest over the lesion site. To convert this to an estimate of the concentration, the lactate SNR was normalized to the NAA SNR over the control hemisphere or over the entire brain, where it is assumed that the TI and T2 values of NAA and lactate are the same. This assumption was tested by running TI and T2 experiments. The TI values for lactate and NAA at 4.7 T were ≈1.5 s whereas the T2 values were ≈260 and 240 ms, respectively. These differences were not significant enough to warrant corrections; this is not surprising given that both resonances are methyl groups. The available literature on the concentration of NAA in rat brains presents a range of values between 4 and 8 mM(cf. Birken and Oldendorf, 1989 and references therein). After study of the extant literature, we have adopted a value of 7 mM here. We corrected the SNR values for the statistical properties of noise in magnitude images with low SNRs [i.e., non-zero mean, Rayleigh noise distribution (Papoulis, 1984)], and determined the lactate concentration as [Lactate] ***≈ [NAA] × [SNR(lac)]/[SNR(NAA)]. These lactate estimates were then converted into the forms reported in the text and Tables 1–3. As a further control, metabolite intensities in some cases were also compared with water SNR in corresponding voxels from proton-density-weighted images. This enables comparison of absolute metabolite intensities from animal to animal even if the absolute molar concentrations are in error.
Effect of decortication on differential striatal lactate production after systemic infusion of mitochondrial poisons
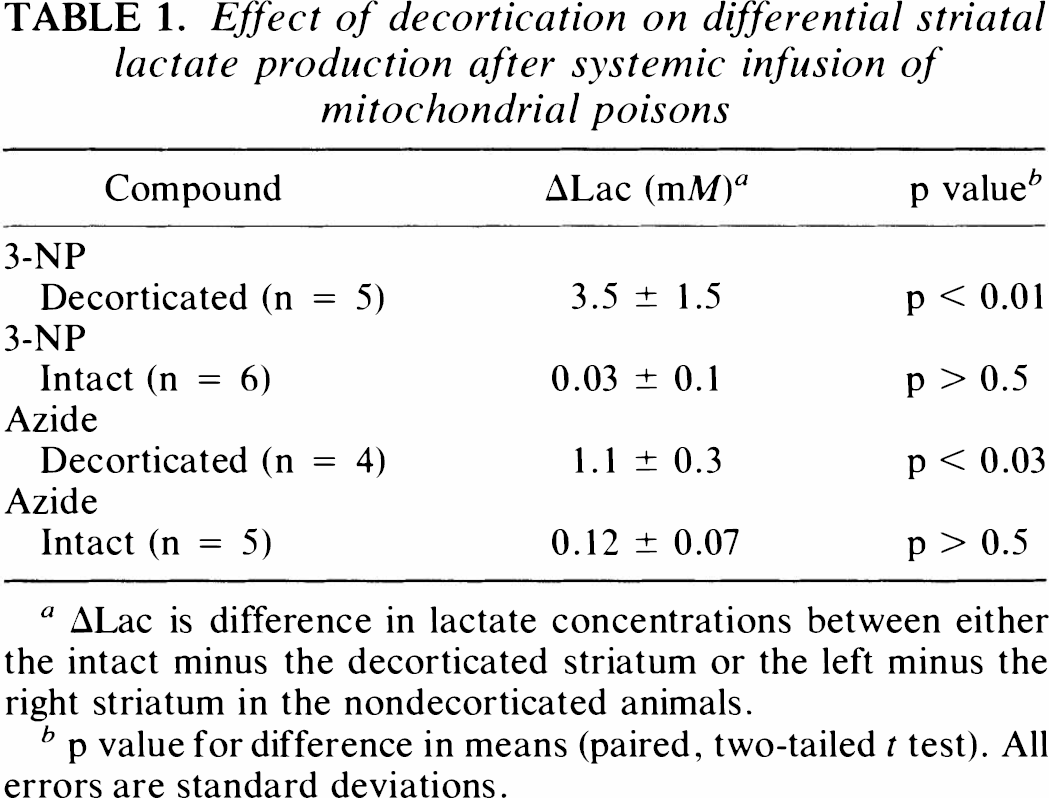
ΔLac is difference in lactate concentrations between either the intact minus the decorticated striatum or the left minus the right striatum in the nondecorticated animals.
p value for difference in means (paired, two-tailed t test). All errors are standard deviations.
Summary of results for intrastriatal injection of MPP+ or malonate and protection with MK-801
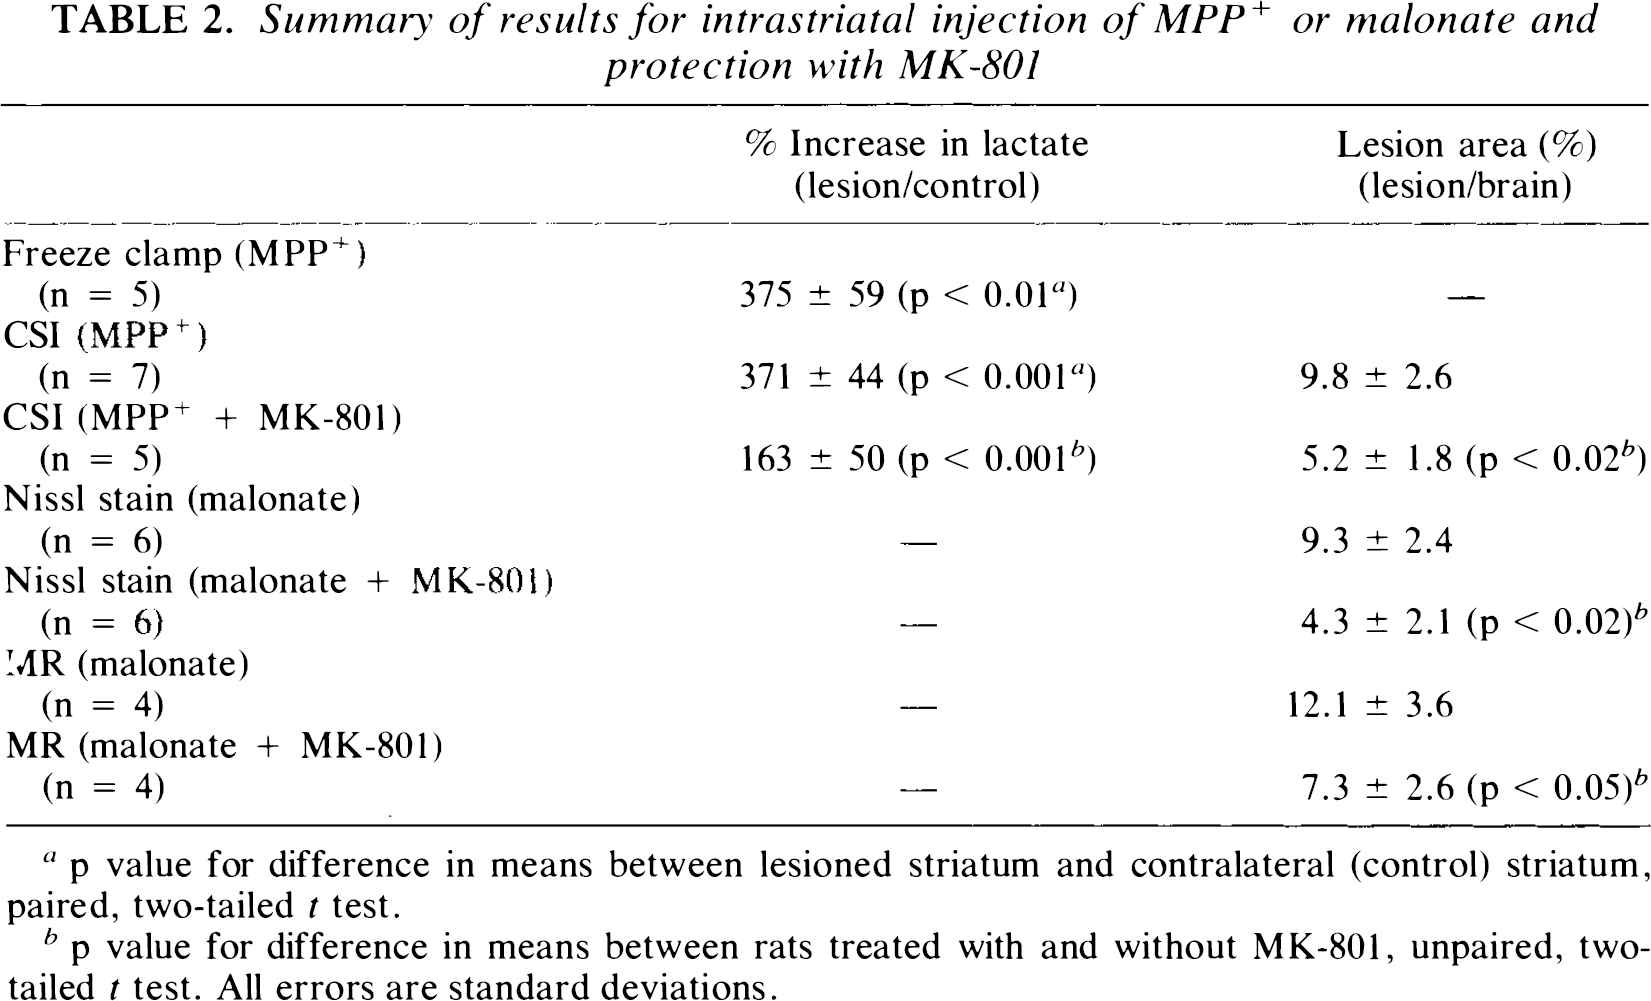
p value for difference in means between lesioned striatum and contralateral (control) striatum, paired, two-tailed t test.
p value for difference in means between rats treated with and without MK-801, unpaired, two-tailed t test. All errors are standard deviations.
Effect of energy repletion on normalized lesion size and lactate production after intrastriatal injection with malonate
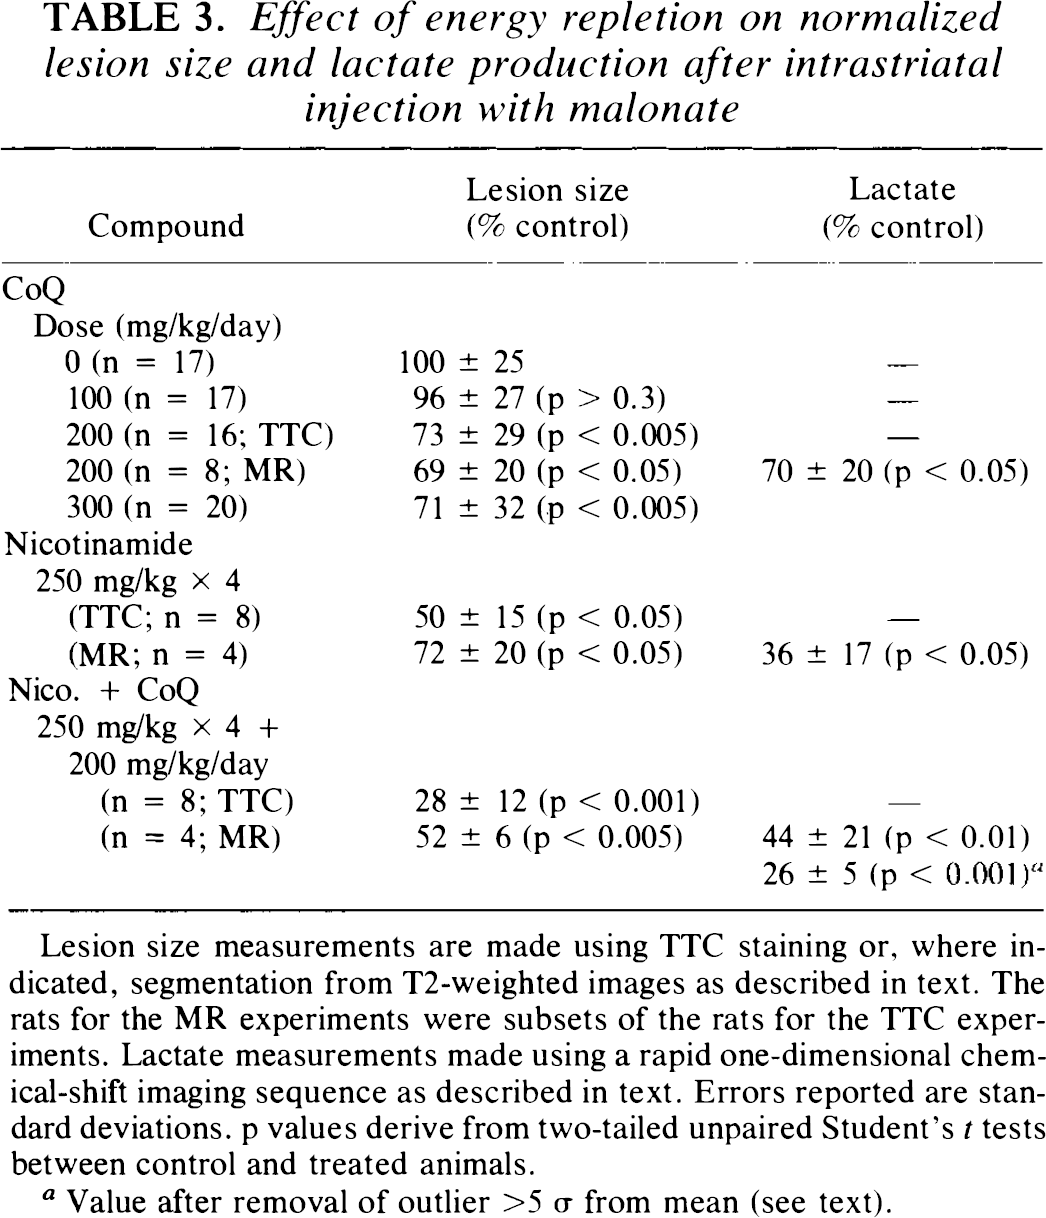
Lesion size measurements are made using TTC staining or, where indicated, segmentation from T2-weighted images as described in text. The rats for the MR experiments were subsets of the rats for the TTC experiments. Lactate measurements made using a rapid one-dimensional chemical-shift imaging sequence as described in text. Errors reported are standard deviations, p values derive from two-tailed unpaired Student's t tests between control and treated animals.
Value after removal of outlier >5 σ from mean (see text).
T2 lesion size was quantitated via measurement of signal intensity in the contralateral brain area, with definition of a lesion as any signal >2.0 SD above the mean signal in the unaffected area. The lesion area was then normalized to the total brain slice area.
RESULTS
Energy impairment
Lactate production and NAA depletion.
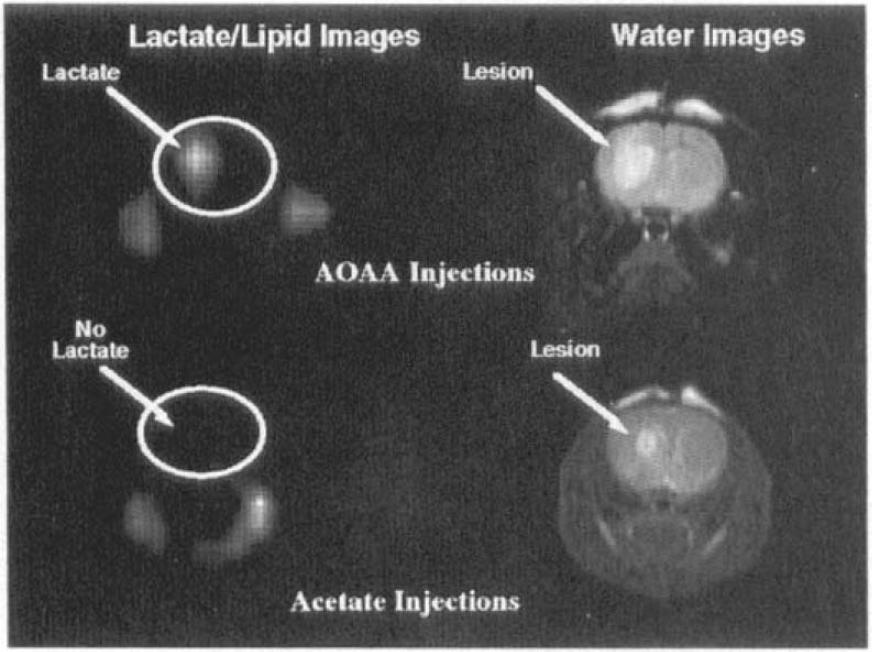
T2-weighted and chemical shift images of rat brains ∼2 h after stereotaxic injection of aminooxyacetic acid (AOAA)
One week after injection, no lactate above baseline is seen in the lesions caused by either MPP+, AOAA, malonate, or 3-NP; however, NAA is depleted and the T2 bright lesions remain, as shown in Fig. 3 for malonate injections (a diffusion-weighted image is shown for comparison). It can be seen that there is a hole in the striatum in the NAA image corresponding to the T2 bright lesion as well as the dark patch in the diffusion-weighted image. Follow-up studies indicate further decline in NAA at 2.5–3 months postinjection (relative to water SNR in proton density images) as well as the persistence of T2 bright lesions. No lesions were noted on T2 images 1 week after sodium acetate injections (not shown).
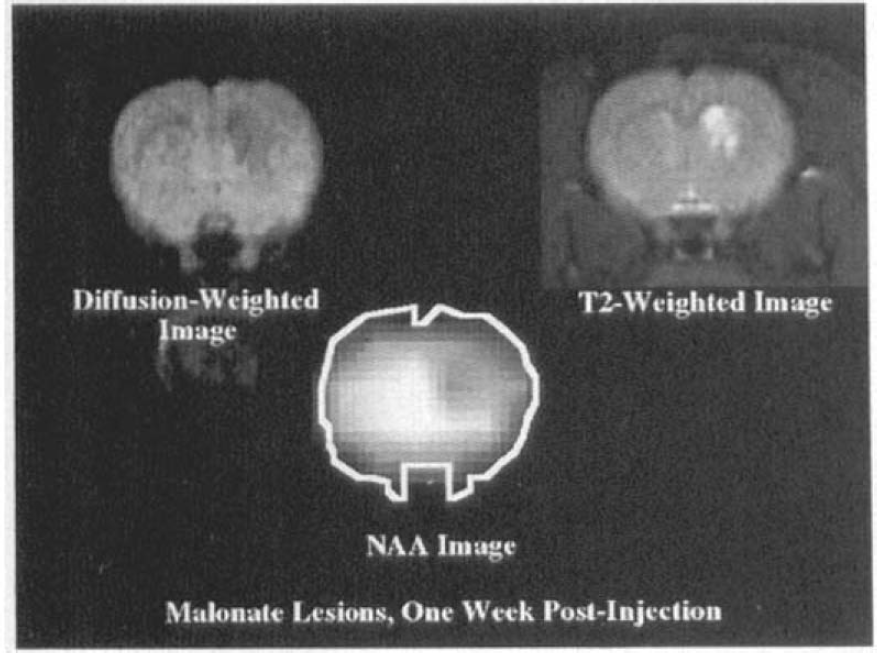
Diffusion-weighted, T2-weighted, and N-acetylaspartate (NAA) images of a rat brain 1 week after stereotaxic intrastriatal injection with malonate. (Field of view for the NAA image was 35 mm, ∼2 × 2 mm in plane.) Note low NAA intensity at the lesion site, and high NAA intensity in the lateral septum, which is also well demarcated in the diffusion-weighted, but not the T2 image.
To determine the ability of NAA to serve as a measure for neuronal degeneration, we ran CSI images of NAA 2.5–3 months after injection with MPP+ as shown in Fig. 4. Using a ratio of NAA SNR to the SNR from a proton density-weighted image yielded a constant value that allowed absolute inter-animal comparisons. It is seen that the NAA is depleted by 41% in the injected striatum compared with uninjected animals. Note also how small the standard deviations are, giving confidence to this technique as a method for absolute NAA quantification. This was tested by comparing the NAA intensity from the ipsilateral to the contralateral striatum. The ratio in these animals for [NAA]ipsilateral/[NAA]contralateral indicated 44 ± 4% depletion of NAA in excellent agreement with the absolute measurement. We have recently performed formed a more detailed comparison of the CSI technique with in vitro assays showing its validity (Guimaraes et al., 1995).
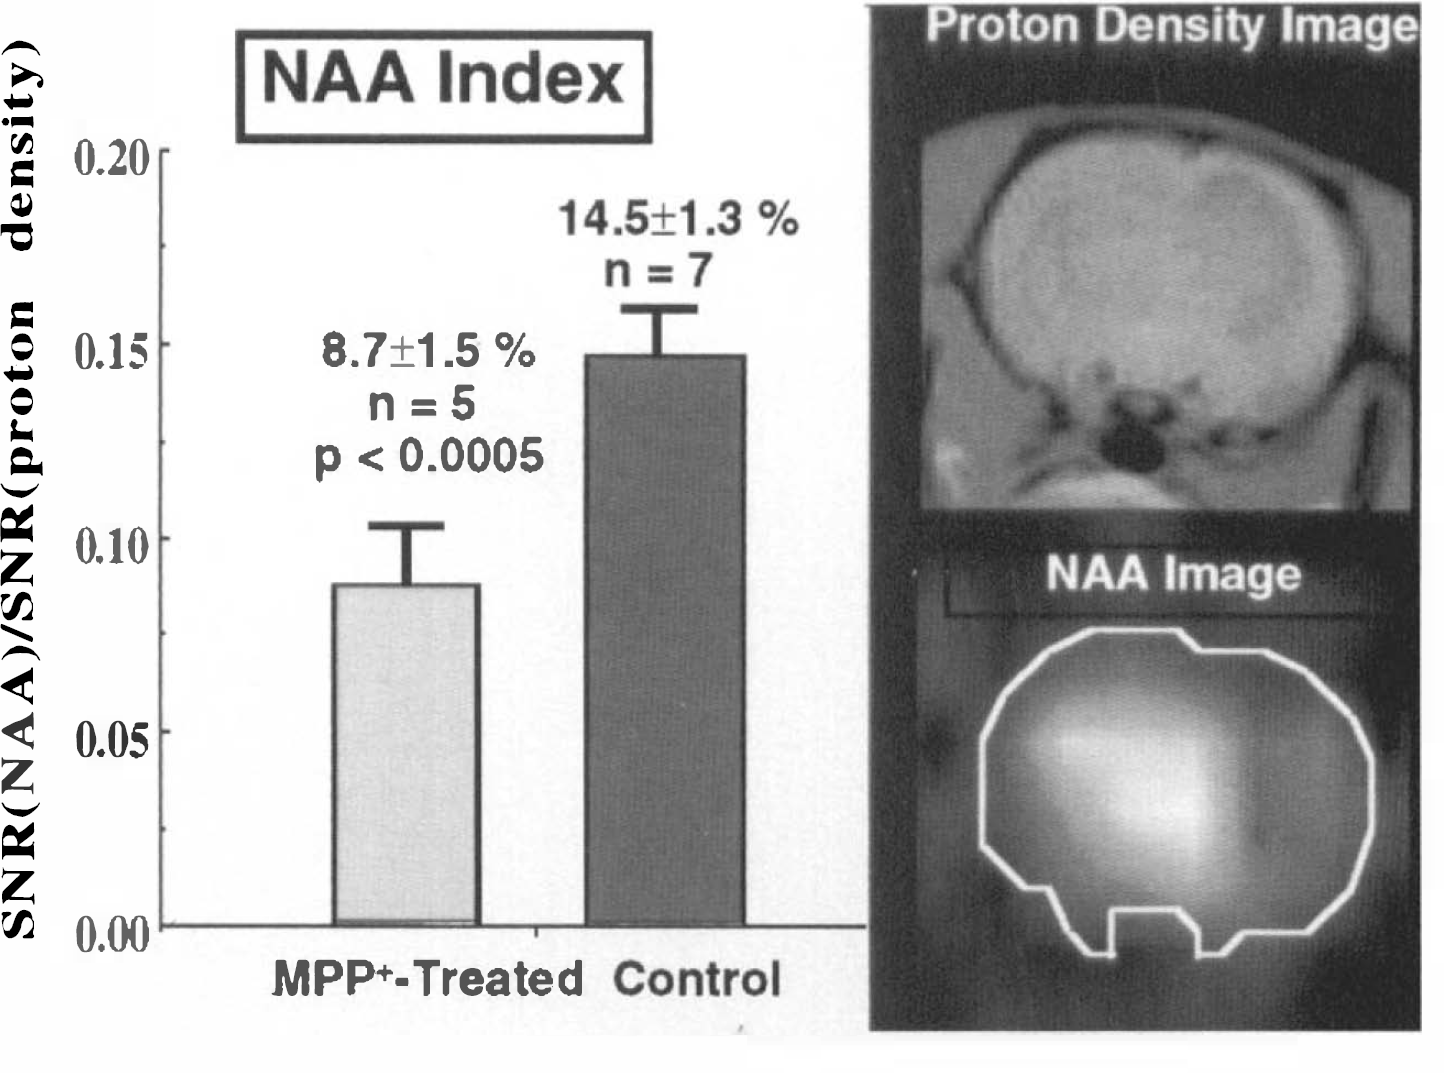
Ratio of N-acetylaspartate (NAA) signal-to-noise ratio (SNR) to proton density-weighted water SNR in the striatum in control rats and in rats 2.5–3 months after injection with N-methyl-4-phenylpyridinium (MPP+). On the right is a typical NAA image showing NAA loss in the injected striatum. Note the similar intensity of lesion to brain in the proton density-weighted image (TR/TE 4,500/10 ms) in contrast to a T2-weighted image (see Fig. 3).
Lactate washout and glucose infusion. Although all the neurotoxins block mitochondrial electron transport, they all have differing properties. For instance, whereas 3-NP binds irreversibly to complex II, malonate binds reversibly. MPP+ binds near the rotenone binding site of complex I extremely tightly (Tipton and Singer, 1993). Biodisposition of AOAA is also reversible. Given these facts, one could expect lactate production to be transient. We tested this hypothesis by measuring lactate temporally using a rapid ID CSI sequence. The first time point comes at ∼45 min postinjection due to the time required to suture, place the animal in the magnet, localize, and shim. Figure 5a shows a curve of lactate versus time for both malonate and AOAA. The time courses are very similar, with exponential fits for the concentration half-life of lactate yielding 203 ± 23 and 178 ± 28 min for AOAA (n = 4) and malonate, respectively (n = 4). Both 3-NP and MPP+ yield half-lives of > 10 h (not shown) in which the lactate concentration did not decrease measurably during 5 h. At both 24 and 48 h the lactate concentration for MPP+ was ∼50% reduced as compared with 3 h.
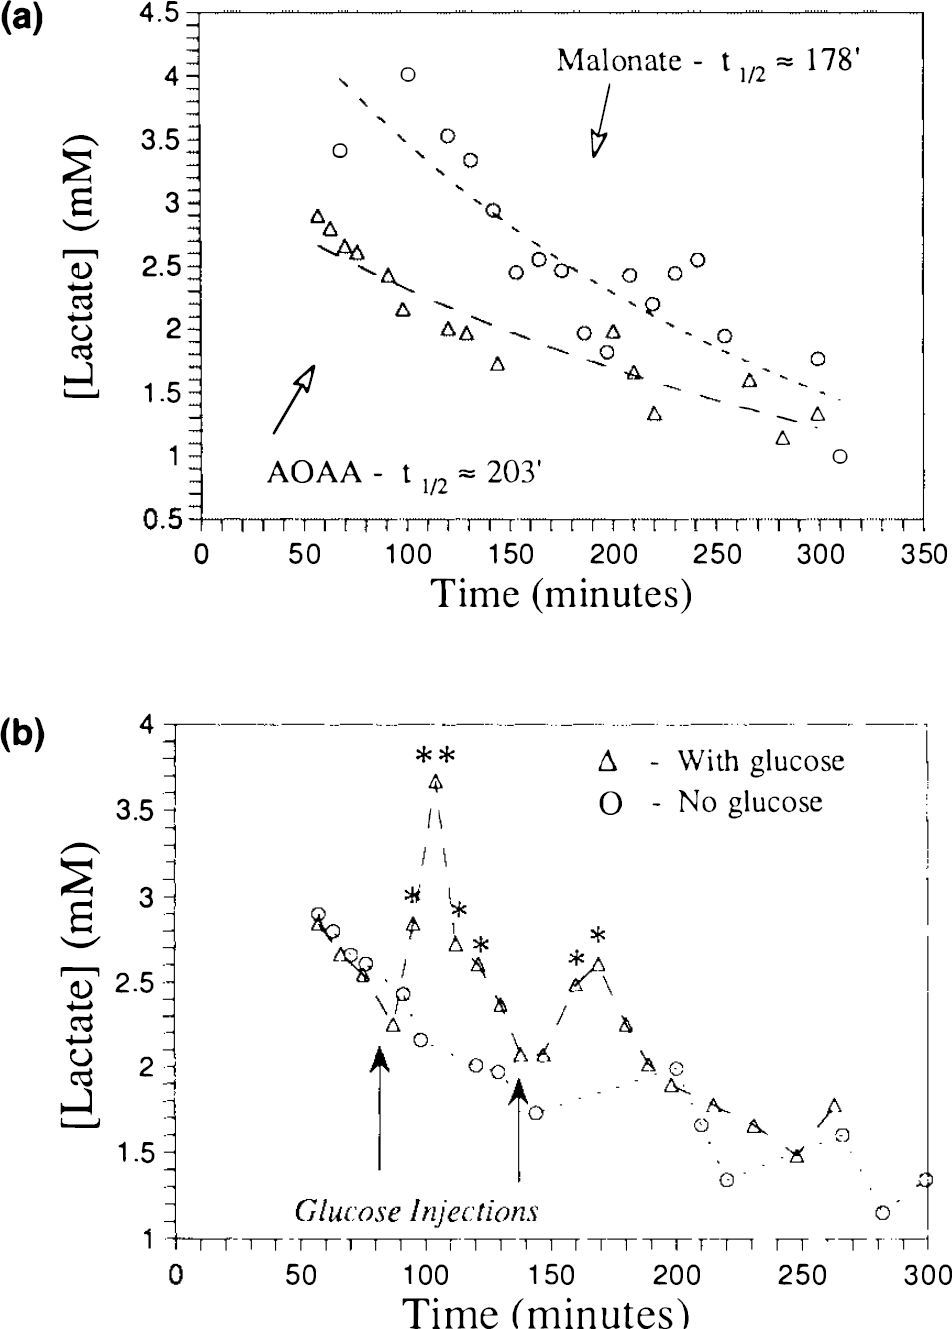
To see whether the lactate was actively being produced by way of anaerobic glycolysis (as opposed to a static pool) we performed a lactate stimulation experiment where we infused glucose (1.2 ml of a 12% solution) into a rat with an intrastriatal injection of AOAA (n = 2). These data are shown in Fig. 5b. It can be seen that there is a transient increase in the lactate concentration by almost a factor of two. A second injection also gives rise to a transient increase, but lower than the first injection, probably due to washout of AOAA. These data indicate that there is an active metabolic pool of glucose-limited oxidatively impaired cells.
Age dependence of blockers of complex II
We previously found that both malonate and 3-NP, which block complex II, show a pronounced vulnerability of the striatum in older rats compared with younger rats (Brouillet et al., 1993; Henshaw et al., 1994). CSI may be an ideal way to follow this age-dependent vulnerability in a longitudinal fashion. We have now conducted more extensive analysis of both the age dependence of lactate production and lesion size for intrastriatal injection of both malonate and 3-NP, including data from 25 animals collected using the 3D CSI technique and T2-weighted imaging. The data indicate a logarithmic dependence on age for both variables as shown in Fig. 7. We tested whether or not a logarithmic fit was significantly better than a straight linear fit to age using an F test. For the fit of lesion size to age, the probability of the log fit being better was p < 0.05, whereas for the lactate data it was p < 0.1 (due to more scatter in the latter values). The mechanisms of this potential logarithmic dependence of striatal vulnerability with age for both blockers of complex II remains to be investigated.
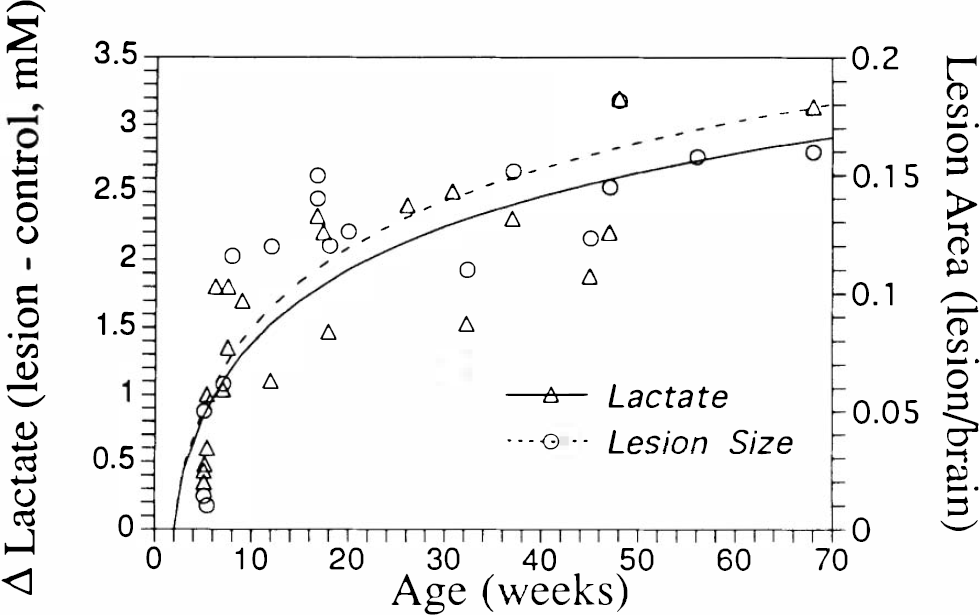
Dependence of differential lactate production (lesioned minus control striatum) and normalized lesion size (lesion/brain) on age after intrastriatal injection with complex II blockers (3-nitropropionic acid and malonate). Lactate measured using x, y, ω chemical shift imaging sequence as described in text. A logarithmic fit to age yields: ΔLactate = −0.40685 + 1.788* log(age); R = 0.834 (p < 10−4). Lesion size = −0.024972 + 0.10913* log(age); R = 0.842; (p < 10−4).
Attenuation of excitotoxic lesions
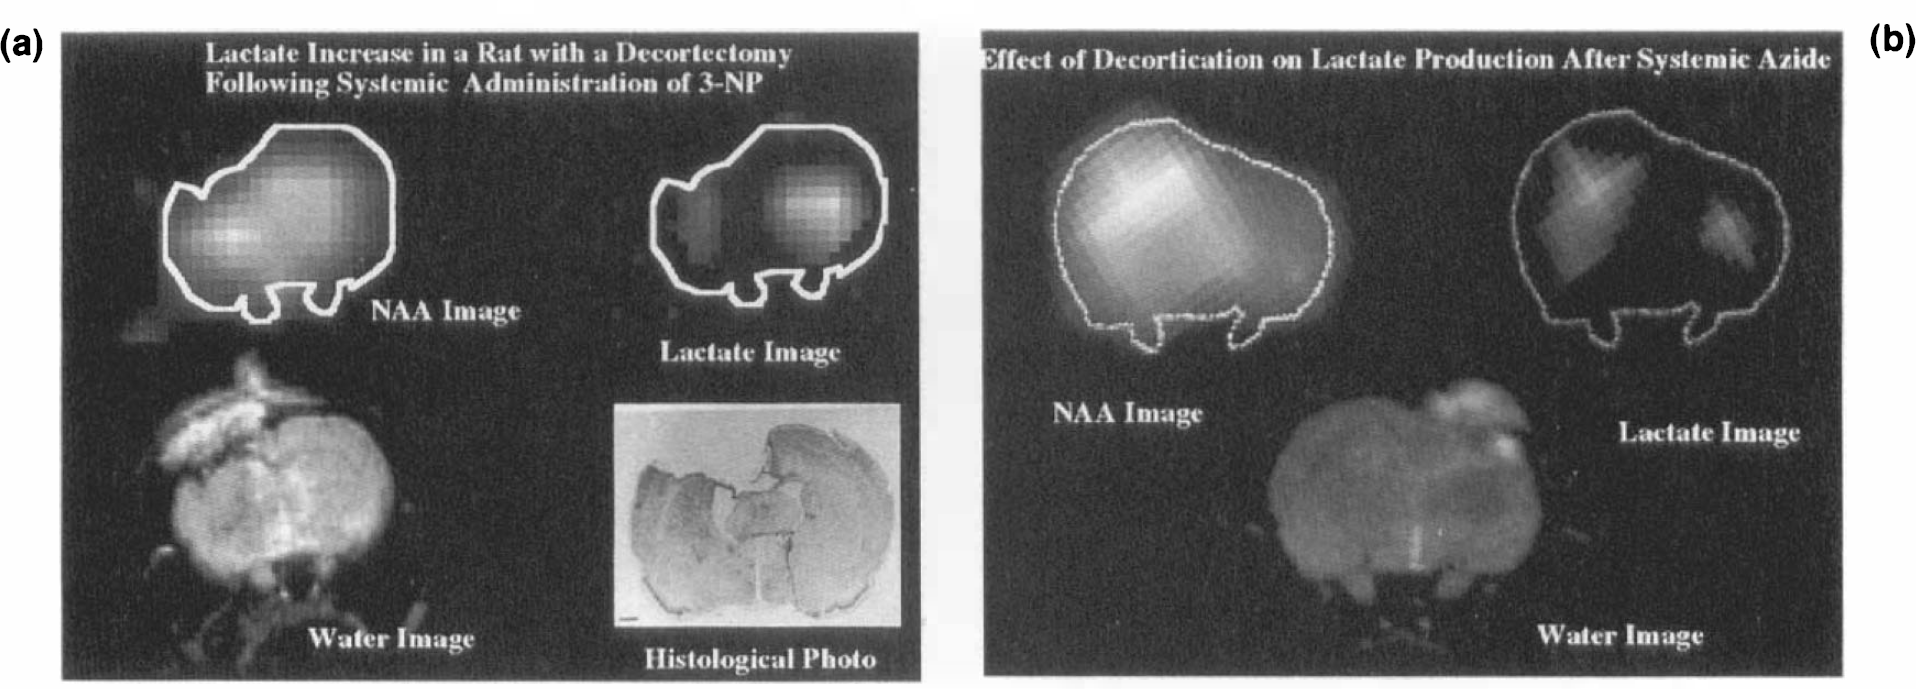
Blockade of glutamatergic input to the striatum. Evidence of glutamate-mediated excitotoxicity was provided by studies of animals that had unilateral frontal cortical ablations. This removes the cortical glutamatergic input to the striatum and should ameliorate the lesions in the ipsilateral striatum (Storey et al., 1992; Beal et al., 1993b). This is shown in Fig. 8a for a systemic injection of 3-NP. It is apparent that the lactate intensity is considerably lower on the decorticated side. In addition, NAA signal intensity corresponds very closely to the brain contour derived from the water image, indicating the good spatial localization of these images. Subsequent histology and biochemistry on the animals showed sparing of the decorticated striatum. Decortication also protects against azide lesions as seen in Fig. 8b. This animal also shows diminished lactate production on the decorticated side. The results for differences in the lactate concentrations in the left and right striata in both the decorticated and control animals are presented in Table 1. It is obvious that the decortication causes a relative decrease in lactate production in the striatum ipsilateral to the decortication. We note that these differences remain statistically significant even if the method is insufficient for absolute quantification. Further proof of glutamate-mediated excitotoxicity is presented later herein.
Glutamate antagonists. If the lesions generated by impairment of energy metabolism act by way of indirect glutamate excitotoxicity, then they should be blockable by glutamate antagonists. This hypothesis was tested by use of the well-known NMDA antagonist, MK-801. MK-801 diminished lactate concentration postinjection with either MPP+ or malonate. In addition, lesion size was diminished as measured by either Nissl staining or T2-weighted scans. These data are presented in Table 2, which shows lactate measurements were made using both freeze clamp and MR (x, y, ω CSI) techniques 3 h after intrastriatal injection with MPP+ without and with pretreatment with two injections of 5 mg/kg MK-801 (no lactate comparisons are shown for malonate with this protocol due to the time dependence of both the lactate washout and the MK-801 treatment). The agreement between the freeze clamp and MR measurements is so close that it is probably fortuitous; nevertheless, it lends confidence to the MR technique, which has a lower standard deviation than the biochemical technique. These data, and others not shown, indicate that glutamate-mediated excitotoxicity is a common pathway for neuronal death.
Energy repletion. Excitotoxic lesions caused by impairment of energy metabolism should be partially capable of amelioration by way of energy repletion. Logical candidates for such repletion are compounds that can aid in electron transport through the electron transport chain (ETC). We chose to study the effects of energy repletion using coenzyme Q10 (ubiquinone, CoQ) and/or nicotinamide. Fig. 9 shows the effect of nicotinamide on both lesion size and lactate concentration after intrastriatal malonate injection. It is apparent that the lactate peak has been reduced to the noise level in this animal and that the T2 lesion is substantially reduced. For comparison, a similar set of images is shown for pretreatment with the combination of both CoQ and nicotinamide where the lesion size has been reduced even further.
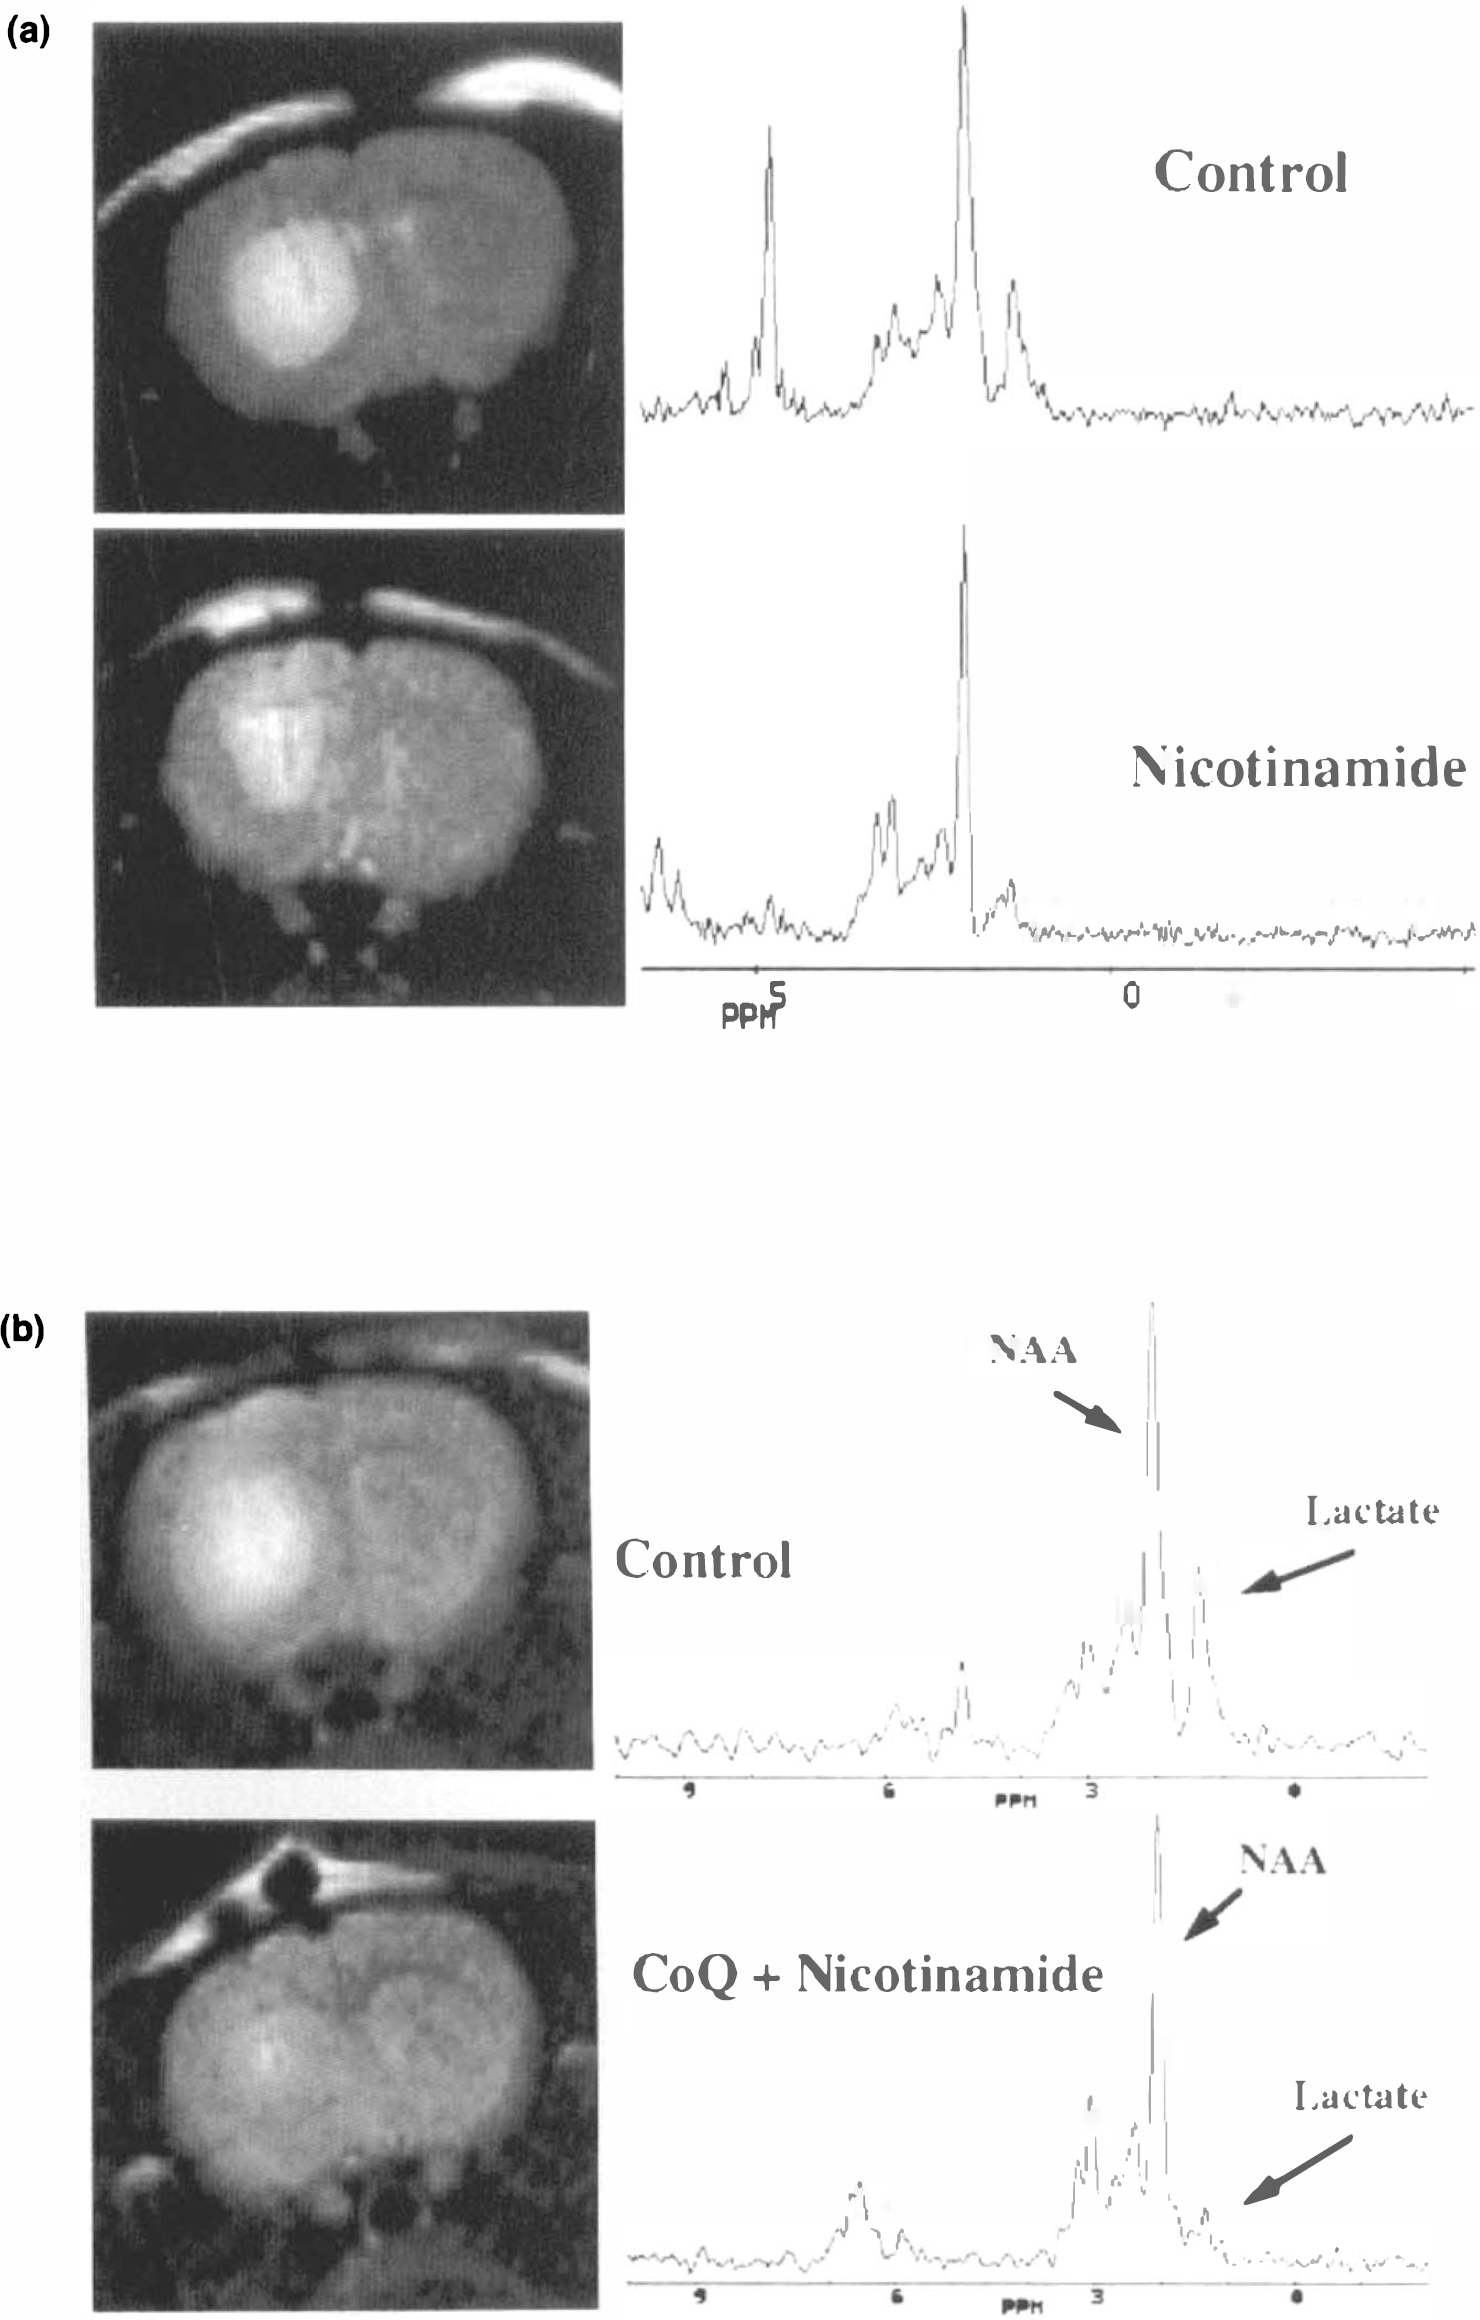
T2-weighted images and magnitude spectra from the level of the striatum in two rats after intrastriatal injection with malonate; a: rats pretreated with nicotinamide (lesion area ∼18 mm2 in the control and 10 mm2 in the treated animal),
These data are summarized in Table 3. In this table, lesion size measurements using both TTC staining and MR T2 are shown for comparison reported as percent of control. Lesion size reduction after treatment with CoQ (200 mg/kg) showed excellent agreement as assessed by either TTC or MR imaging when measured as percent of control. The absolute values of the TTC lesion sizes ranged from 1 to 7% of brain slice area, whereas for T2 the numbers were 2–9% (total brain areas ≈600 mm2). However, the average TTC lesion was smaller than the average MR lesion by 29 ± 9% due likely to the inclusion of some nonspecific edema in the case of the T2 measurements. For the combination of nicotinamide and CoQ, the lesion size measured by MR was substantially larger than that with the TTC staining (52 versus 28%).
It is apparent that both CoQ and nicotinamide are successful in diminishing both lactate production and lesion size; however, a combination of CoQ plus nicotinamide is more effective than either alone (Table 3). Although the lactate percent reduction appears to be lower in the nicotinamide-treated animal than in the CoQ plus nicotinamide-treated animal, this was largely due to an outlier in the latter data set. Removal of this outlier (in which lactate concentration was 2.0 mM versus an average of 0.55 ± 0.09 mM for the other three animals) yielded smaller lactate concentrations in the nicotinamide plus CoQ-treated animals compared with nicotinamide alone. These numbers were 1.05 for nicotinamide alone versus 0.55 mM for the combination (a reduction to 26% of control). The latter number is essentially equivalent to reduction to unlesioned control values of lactate concentration.
DISCUSSION
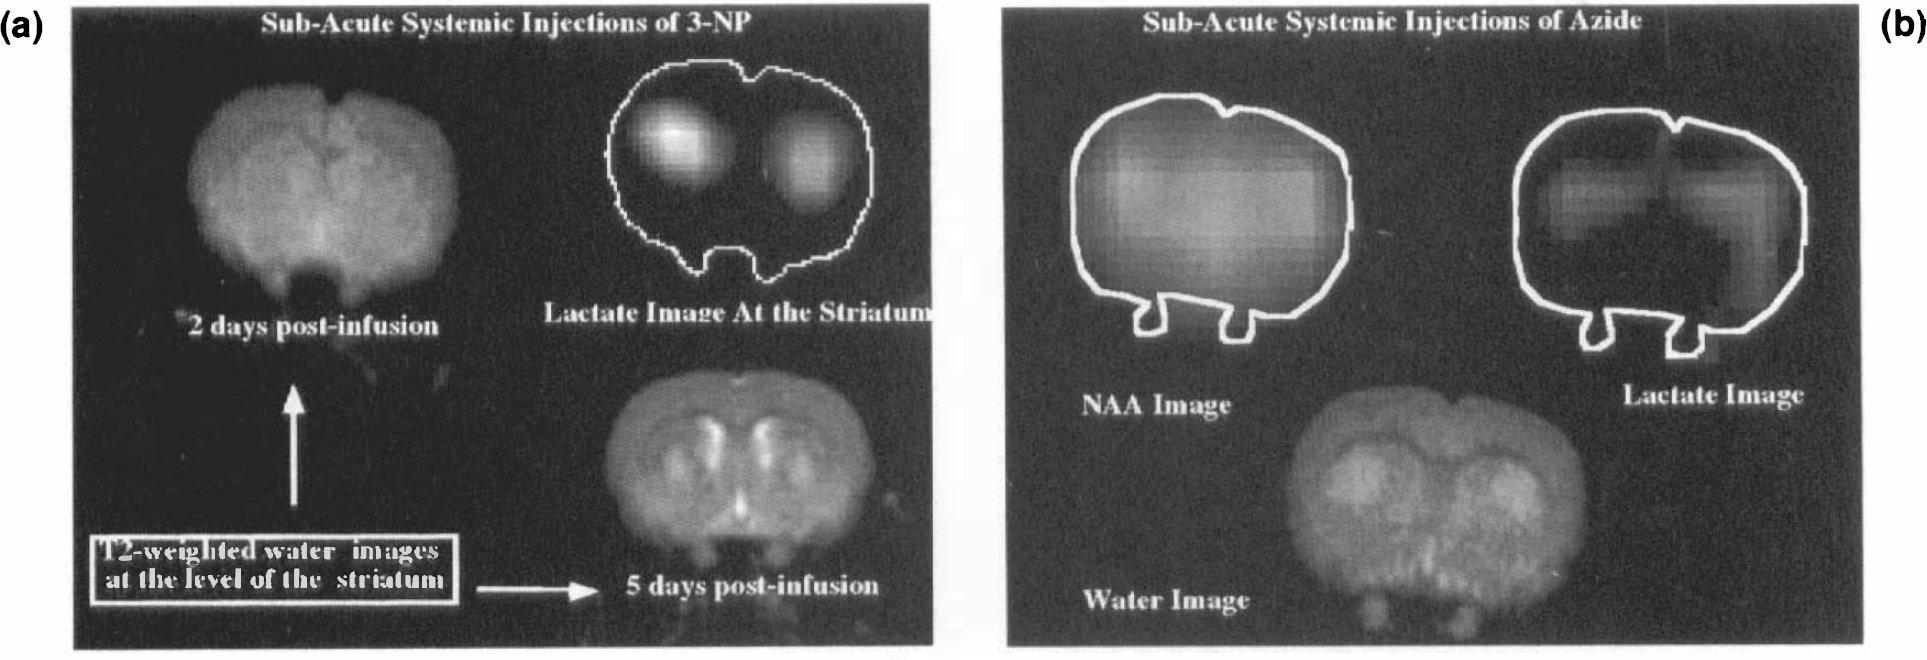
The present experiments provide important new data concerning potential etiologic mechanisms in neurodegenerative diseases and the application of MR to the study of models of these conditions. We have shown in prior work that AOAA, 3-NP, and malonate can reproduce many of the biochemical findings characteristic of HD (Beal et al., 1991; Brouillet et al., 1993; Beal et al., 1993b; Henshaw et al., 1994). MPP+ is also well known to replicate many features characteristic of PD (Langsten et al., 1983; Furtado and Mazurek, 1991; Storey et al., 1992; Tipton and Singer, 1993). The experiments here show that these toxins produce marked local increases in lactate via intrastriatal injection consistent with impaired oxidative phosphorylation, within a brain region that subsequently shows neuronal degradation by histological, neurochemical, and MR methods. In addition, systemic administration of azide and 3-NP produced focal buildup of lactate and lesions in the striatum, the area first afflicted in HD. The CSI sequence used here was able to not only localize the lactate lesion quite reliably, but also to provide quantitative estimates of concentrations that agree quite well with concentrations measured using freeze-clamp biochemistry (Table 2).
These experiments thus provide valuable in vivo evidence for the hypothesis that energy impairment can lead secondarily to excitotoxic neuronal death (Novelli et al., 1988; Blass et al., 1988; Zeevalk and Nicklas, 1991; Beal, 1992; Beal et al., 1993a). Most convincing in this regard is that systemic administration of both 3-NP and azide produce lactate lesions localized to the striatum that precede the development of the lesions seen in the T2-weighted water images (Fig. 6). Another feature is that the lactate lesions often appear larger than the T2-weighted or histological lesions (Fig. 6a), indicating that there may be an area of tissue that recovers from the energy impairment, similar to what is seen with the ischemic penumbra in focal ischemia models. The mechanism behind these changes can be explained by relief of the voltage-dependent Mg2+ block of the NMDA receptor resulting from depolarization of the cell membrane, caused by ATP depletion as a consequence of blockage of electron transport (Zeevalk and Nicklas, 1991; Beal et al., 1993a).
Measurement of the lactate concentrations as a function of time yielded information on the mechanism of energy impairment. Specifically, the time for the lactate concentration to halve (t1/2) as shown in Fig. 5 correlated quite well with the expected lifetimes of the toxins. The t1/2 values calculated for AOAA and malonate were 203 and 178 min, respectively, whereas 3-NP and MPP+ had t1/2 values of >10 h. These numbers are reasonable because both AOAA and malonate are reversible inhibitors of their targets, whereas 3-NP is an irreversible inhibitor of succinate dehydrogenase and MPP+ has an extremely long lifetime in the rotenone binding site of complex I (Tipton and Singer, 1993). In the only other data of this type that we are aware of, in vivo microdialysis of lactate production after lesioning with NMD A showed a t1/2 of ∼8 min (Kuhr and Korf, 1988). This is reasonable, because NMDA should be subject to glutamate reuptake mechanisms, making its energy impairment transitory and rather fast compared with these other toxins. These experiments also demonstrate the ability of glucose to transiently boost production of lactate. This effect can also be induced in ischemic conditions, demonstrating substrate-limited anerobic glycolysis.
In addition to its ability to follow lactate as a marker of metabolism, CSI is well suited to a role for determining neuronal loss using NAA as a marker. The loss of NAA over time was readily measured using MR techniques (Figs. 3 and 4). We have previously shown that this CSI technique provides excellent agreement with in vitro measures of NAA loss in similar rat models (Guimaraes et al., 1995). This makes it feasible to follow the same animal over time to assay lesion progression in contrast to conventional biochemical techniques. In this context, NAA serves as an anatomic neuronal marker, whereas lactate serves as a functional metabolic marker.
MR imaging also proves to be a useful tool for assessing the age dependence of complex II inhibitors. Our data clearly show that both malonate and 3-NP evince a pronounced vulnerability of the striatum as a function of age. This is revealed in both excess lactate production as a function of age as well as increased lesion size. Interestingly, this same behavior was not seen with MPP+ (not shown). This may be related to the age-dependent decline in activity that has been reported for complex I, but not II, in recent studies of rat respiratory muscle (Torii et al., 1992). This age dependence has profound implications for study of the age-dependent onset of neurodegenerative disorders, because it provides a plausible explanation for why increasing age might be a risk factor (Wallace, 1992; Mecocci et al., 1993). Because HD typically shows an onset at early middle age, and increasing age is the major risk factor for both PD and Alzheimer's disease, these toxins may become standard animal models of neurodegeneration. That the age-dependent vulnerability of the striatum is logarithmic rather than linear is at this point not understood; however, it certainly warrants additional study because it may yield further insight into the actual mechanism of neurodegeneration.
A further role of CSI is in its ability to assess neuroprotection. Our data clearly indicate that both lesion size and lactate production can be diminished using hemidecortectomies and MK-801, both of which act to block glutamate-mediated excitotoxicity including, but not necessarily limited to, NMDA glutamate receptors. CSI was capable of producing spatially resolved images of NAA and lactate that readily demonstrated neuroprotection. The excellent concordance between the MR and biochemical freeze-clamp measurements of lactate (Table 2) lends credence to the in vivo capability of MR lactate quantitation. Our data also demonstrate the protective effects of MK-801 on MPP+ toxicity in contrast to a prior report (Sonsalla et al., 1992) but in agreement with another (Turski et al., 1991). In addition, we have shown that boosters of mitochondrial energy metabolism (coenzyme Q10 or ubiquinone and nicotinamide) can also lead to diminished lesion size and lower lactate production.
The finding that energy repletion can produce neuronal protection against excitotoxic lesions is exciting, because it immediately suggests a possible therapeutic role for these agents in neurodegenerative illnesses and a role for MR in following this potential therapy. A preliminary account of just such an approach has been reported using CoQ in HD patients (Jenkins et al., 1993). Although these studies do not confirm the mechanism by which these agents work, due to ubiquinone's ability to act as a free radical scavenger as well as an electron transporter, they nonetheless unequivocally indicate their effectiveness with specific mitochondrial poisons. Thus, it is likely that their beneficent role in the electron transport chain is at least in part responsible for their efficacy.
CSI should become an important adjunct to existing neurochemical techniques by producing maps of relevant cerebral metabolites in vivo. Most techniques now in use rely on postmortem assessment of lesion chemistry. We believe that CSI offers some powerful and complementary advantages over conventional biochemical techniques, not the least of which is that CSI allows for follow-up studies to be performed on a single animal, yielding important information regarding lesion progression over time, using each animal as its own control. An additional advantage of MR imaging is that one can obtain two measures for the price of one—lactate for functional metabolism, and NAA for neuronal anatomy. Of course there are many other chemicals such as glutamate and GABA one can follow that may also yield novel information on neurodegeneration. MR imaging may prove to be invaluable in screening potential therapeutic strategies in animal models of neurodegeneration. Application of this technology to both animal models of human neurodegenerative illnesses, and to the human illnesses themselves, may yield important new information about the pathogenesis of these diseases.
Footnotes
Acknowledgment:
We thank Mike Vevea for several of the image processing software tools, Robert Weisskoff for discussions regarding signal-to-noise measurements, and Ross Henshaw for technical assistance with many of the experiments. This work was supported by National Institutes of Health grants RO1CA40303, NIH RO1HL39810, NIH NS16367, NIH NS 10828, and NIH 5T32CA09502.